 Juan Pablo Cárdenas
 Gastón Olivares
 Gerardo Vidal2,4
 Miguel Fuentes
- 1Net-Works, Viña del Mar, Chile
- 2Complex Society Lab., Viña del Mar, Chile
- 3Grupo de Sistemas Complejos, Escuela Técnica Superior de Ingeniería Agronómica, Alimentaria y de Biosistemas, Universidad Politécnica de Madrid, Madrid, Spain
- 4Pontificia Universidad Católica de Valparaíso, Valparaíso, Chile
- 5Psicología, Facultad de Educación y Ciencias Sociales, Universidad Andrés Bello, Viña del Mar, Chile
- 6Instituto de Investigaciones Filosóficas, Buenos Aires, Argentina
- 7Santa Fe Institute, Santa Fe, NM, United States
- 8Instituto de Sistemas Complejos de Valparaíso, Valparaíso, Chile
The adaptive nature of the social system allows it to overcome the challenges imposed by its environment as well as to overcome those internal pressures. This adaptive process is associated with an increase in complexity manifested in a greater diversity of its components, new forms of organization, among other transformations. However, these adaptations have a cost and need to be administered, otherwise, they can trigger social unrest and crisis processes. Currently, the adaptive process of social systems has been accelerated and magnified by the emergence of information technologies. In this work, we explore the close relationship between adaptation, complexity, and crisis, showing it expression in a digital social environment, although with some particularities. Specifically, we have observed expected behaviors, such as the polarization of society and negative sentiment of messages during times of crisis, however, our results show something interesting. Despite the loss of order in the social organization questioned by the crisis, we observe the emergence of new complex ephemeral structures of information which seem to be early-warnings signals of profound social transformations.
1 Introduction
Society evolves with increasing complexity [1]. As a Complex adaptive system, it is constantly gathering information, restructuring and adapting for its survival. However, it is the same acquired complexity which enables the occurrence of events where the social organization is questioned due to its failure to manage it, giving rise to the phenomenon of social crises [2, 3], affecting fields of politics, economy, and society in general. On the other hand, it is the same complexity which limits the prediction of crises events since there is no clear relation between its precursors and final magnitude.
To face the limits of prediction, and other characteristics of this kind of complex and collective phenomenon, during recent decades Complexity Theory has been providing models with more complete meanings and theoretical coherence for social systems [4, 5]. Human (collective) behavior, and social crises in particular, are many times decentralized processes that emerge as the result of a bottom-up process where social links play an important role, in much the same way that social rules may govern complexity in the society.
Although social crises have accompanied humanity since its origins [2, 6–8], for some years we have witnessed a series of social crisis events of a global nature, of great magnitude and more frequent than in past decades, which could have its origin in the arise of the so-called Networked Society [9] due to the increase in social complexity given the emergence of information technologies and the Internet, which has broken down geographical barriers, strengthened globalization and significantly increased social interaction as well as the flow of information [10]. It is for this reason that today, online social networks such as Twitter among others, have become a projection of material1 interactions, sharing signs and developing their own particularities, taking on an unusual role in the development, and even the genesis of some of these social crisis events [11].
In this work we propose a methodology to observe and describe these common signs between the material society and digital society behavior that occurs in times of crisis. Our objective seeks to clarify the relationship between these two “societies”, where society expresses itself in the manifestation of this type of phenomenon. To achieve this, we have analyzed the Twitter activity of Chilean society, which has experienced for several years, and in particular since October 2019, an acute social crisis which presents in the near future a series of challenges (as the creation of a new Constitution). We have analyzed the activity in the online microblog from two perspectives: users and content, with the aim to approach the phenomena of crisis from those who participate in this, but also from the content or information that they use. To do this, we are using Network and Information theories in order to detect changes (decrease, conservation or increase) in the complexity of the online social system.
We started our analysis from the basis that any critical social moment presents a state of ?maturation? [4], a kind of increase in social temperature. It is for this reason that we daily monitor the ?hot? topics that circulate on Twitter for a specific territory (i.e., Chilean Trending Topics in the case of this study), harvesting the tweets associated with them in order to construct and analyze networks of users and topics in addition to other typical measures for analysis of this type (e.i., sentimental analysis, polarization, etc.). Thus, we pretend to obtain a multidimensional metric that characterizes the digital society in moments of critical behavior.
The work is structured as follows. In Section 2 we present the characteristics of the phenomenon of social crises described from traditional sociological and psychological theory. Section 3 describes the methodology developed to achieve the objectives of this work. The results of our study are shown in Section 4. Finally, in Section 5 we sum up the highlights and present some concluding remarks.
2 Social Crises. A Brief View From Social Sciences
Few concepts refer to such diverse connotations as crisis, to the point that it ends up being used to denote various situations, among them very different in scope, depth, and effects. However, the idea of associating the crisis with “something” (a space, a property, an interest, an affectation, etc.) that is perceived, understood, intuited, etc., as “critical”, seems to be a point in common in many of the definitions. Furthermore, it seems clear that any of these definitions consider the phenomenon as a “process” which, according to the discussion in [12] for example, occurs in stages: integration, disintegration, rupture and reintegration.
From sociological theory [12–22], social crises have three properties that define them as such: 1) the conjunctural desectorization of the social space, 2) structural uncertainty and, 3) the processes of deobjectivation; all selective, observable and with a given trend.
The conjunctural desectorization of the social space means that, given the critical conjuncture of the social system, its formal structure is diluted, admitting subtle frontiers of sectoral differentiation, which hinders the interaction of the actors and their sectoral logic, together with the decompartmentalization from the themes that are now released to broader spaces of intervention. Likewise, there is a reduction in the autonomy of the actors and a displacement of the arenas of confrontation, generating a loosening of the links between arenas and issues of confrontation. All this determines serious difficulties for the realization of the calculations that the actors must carry out in anticipation of the effects of their eventual plays, installing a determining factor in the possibility of their success or failure. Thus arises the inability to perform adequate evaluations for the management of the crisis. In psychological terms, the usual styles of resolution are not enough to face the phenomenon, whose scope is mediated by the severity of the events, their unexpected nature and the degree of perceived risk [23].
A second property is structural uncertainty and it manifests itself both as loss and/or confusion of those pre-existing reference indices2, collapsing traditional definitions and generating loss of effectiveness of the evaluation instruments used in moments of a routine situation (i.e., non-crisis state). This can cause important skidding of certain crises, driven by polarization dynamics in the plays and behaviors of the actors, also accompanied by certain psychological modifications that are expressed in this. In emotional terms, the mediation of the emotional meaning of the crisis is collective [24]. Although narratives become personal through a narrative “engagement”, these emotions motivate social actions. In cognitive terms, the crisis is associated with a confirmation bias (i.e., a tendency to discard opinions inconsistent with one’s own), motivated reasoning (believing that one’s opinion is the best of all and ignoring opposing data) [25], or the priming effect, related to the predisposition to associate certain ideas and stimuli according to those that temporality precede it [26].
Finally, a third property refers to processes of deobjectification of the relations both between sectors and also between actors and sectors, being one of the most interesting vulnerabilities of political systems, generating certain states of liberation in the phenomena of multisectoral mobilizations, or “madness”? or “creative effervescence”? and in the actors certain behaviors assigned to “collusive transactions”? as a formula to obtain certain control of the dynamics that the critical juncture (crisis) acquires.
However, the focus of our concern is whether the digital environment of social interaction represents, in moments of critical juncture, the multiplicity of properties and characteristics described by the theory of social sciences. This is linked to the idea of how far the digital society is a projection of the material society or if the material one is an effect or consequence of the digital society. Furthermore, is it possible to think that the digital society constructs autonomous phenomena and properties in its dynamics, distancing itself from being just a reflection of the social material system, which could rather be insinuated as an autonomous creative capacity that would even allow anticipating the concretion of realities exposed real world.
These questions place us in the identification and reading of the behavior that Twitter has in the face of a critical juncture that unfolds in real time in both types of society, and places us in the analysis of multiple metrics built to try to identify some of these characteristics and get closer to infer something from what is proposed in these questions.
For the Chilean context it is important to highlight that 82% of inhabitants have Internet connection, and 79% of them use online social networks where Twitter stands as one of the most widely used social network, surpassed only by Facebook [27]. As [28] suggests, the country’s “digital elite” participates in Twitter, attracting 13% of its population.
The foregoing shows that one of the characteristics associated with crises, such as the displacement of the arenas of confrontation, allow us to understand why online social networks have become a space for the expression of multiple and diverse actors who not only debate about associated ideas but also, they judge, legitimize, approve, reject, confront or construct new realities that affect the game, and move the social system to critical thresholds, thus generating the emergence of its own dynamic.
The structural uncertainty of the crisis is also manifested in online social networks where new reference appear. In fact, traditional referents do not have the exclusive role that they used to have when referring to critical social situations on digital platforms. On the other hand, the loss of sectoral logic, typical of the crisis, is also observed in the digital social environment where any user can comment on any topic, as well as disseminate the associated information much more efficiently.
Finally, the evident social polarization generated by online social networks [29] is another of the characteristics of the crises described by the social sciences that manifests itself in digital environments. In fact [30] suggests that online social networks generate individual political alignments that shape personal consumption of apparently non-political products. On the other hand [31] associate digital polarization with a lower semantic diversity of the subjects treated by individuals and a greater lexical diversity. That is, in polarized digital environments, few issues are discussed but in multiple ways.
While it is true that there are these and other similarities between material and digital societies during a crisis phenomena, we must not forget that the social digital environment has its own rules that generate its own particularities. Among these, the immediacy in the availability of information, the accelerated flow of it, the possibility of anonymity when commenting on the situations and the existence of thematic connecting vehicles such as hashtags, among others, stand out.
3 Methods
3.1 Context Research
We have developed our work analyzing the digital activity of Chilean people in a context of deep social crisis. In fact, Chile has not been immune to the unstable social behavior manifested by different countries around the world.
Despite his young age (little more than 200 years), the history of Chile has been characterized by various social crises that have determined changes and transformations in the organization of its social, political and economic systems. According to Kenneth [32], the state of stability, or routine situation [13], that characterize the country since the end of the military dictatorship in 1990, began to change to a new state of crisis, or fluid critical conjuncture [13], with the so-called ?Penguin Revolution? in 2006, when thousands of students and their supporters took the streets to protest inequalities and lack of quality in Chilean education. This challenge to the sociopolitical scenario was extended and reach high instability between 2011 and 2012 with the so-called “Student Movement”, which highlighted several challenges of the Chilean educational system along with a series of other demands against institutionalism, authorities and their decisions, as well as diverse social, political, economic, environmental and health issues, among others. Starting a logic situation, a climate, a prégnance [33] in Chile, which floods the system and manifests itself through a series of critical projections, which seem at first sight to be unrelated, but which form part of the same process. All these conditions seem to converge in October 2019 in a highly unstable generalized scenario with typical characteristics of a sociopolitical crisis such as those faced by the country at other times in its history.
Considering the current crisis scenario that Chile is going through, we have developed a multidimensional analysis to detect signals of crisis that appear in the digital society that are in resonance with signals of the social material crisis.
3.2 Data Harvesting and Networks Construction
From August 27th to October 26th, 2020, we daily monitor Twitter in the search of Chilean Trending Topics, harvesting three times each day (morning, evening and night) the tweets associated with these trending topics. The data, extracted automatically using the Twitter API3, corresponds to 453,564 Chilean tweets (i.e., eliminating foreigners) during the entire period. In each harvest of Trending Topics the average of tweets collected was 4,183.5.
Using the information of these tweets we construct two types of networks: thematic and users.
3.2.1 Thematic Networks
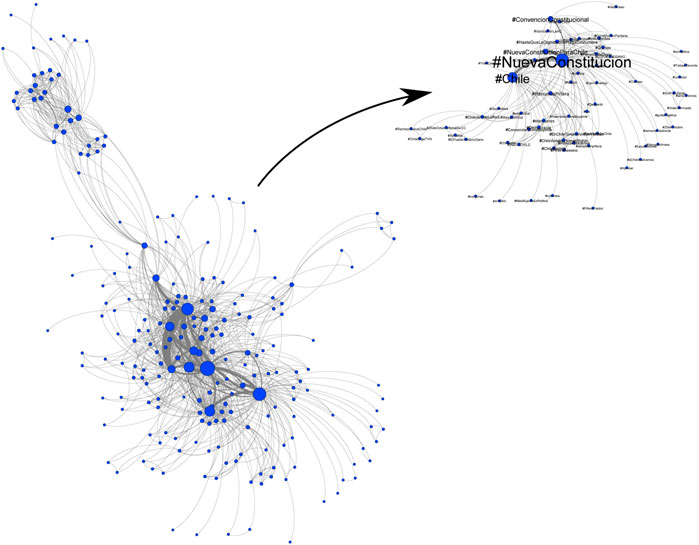
FIGURE 1. Thematic Network, T. Left: Giant Connected Component of T generated in October 2, 2020. Nodes correspond to hashtags linked with others by co-ocurrence in tweets. Upper right: subset of T displaying node labels.
3.2.2 Users Networks
We will call
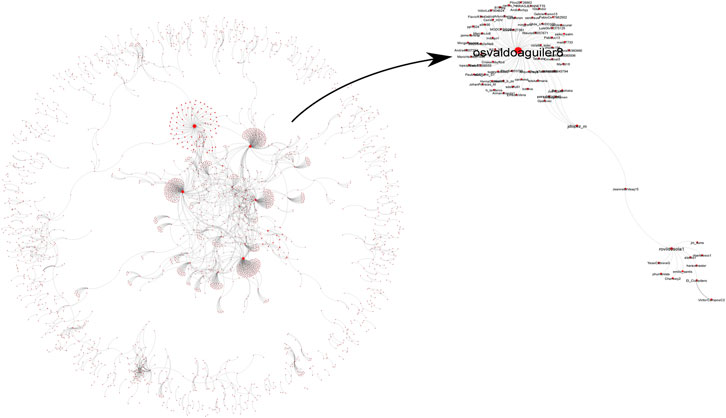
FIGURE 2. Left: Retweet network,
3.3 Characterizing the Digital World, New Metrics
We have analyzed various metrics, some of them are completely new following the ideas of the concept of a crisis developed and discussed in the previous sections. We have separated this measures into two subsets: structural and content metrics.
Structural metrics correspond to a set of measures that depend exclusively on the structure and topology of the networks that are being analyzed. Specifically, we have considered the following structural measures: network complexity, normalized conditional degree matrix (NCD matrix), and polarization. For the content metrics we have considered the presence of critical concepts, sentiment analysis on messages, and duration for trending topics. Local metrics such as ratio followers/friends for Twitter users was also used in this work.
3.3.1 Structural Metrics
We have applied a series of analyzes to T and U networks, focusing our attention on the Giant Connected Component for each harvest. A brief description of these measures is presented below.
Giant connected component (GCC): is the basic structure of networks T and U analyzed in this work due to the importance in percolation processes [34, 35]. It corresponds to a sub-structure of a network that contains the major proportion of nodes where between each pair of nodes there is a path.
Complexity: the Complexity of T networks is defined by [36] as the product between the network entropy S and network disequilibrium Q according to the following equation
where entropy is based on the assessment of probabilities to jump between nodes when randomly traveling through the network. Thus, the entropy
where N corresponds to the total number of nodes of the GCC.
On the other hand, the disequilibrium Q is measured in terms of the Jensen-Shannon divergence [37], taking as a reference network the Erdös-Rényi network, see Eq. 3. Q takes low values for systems that are close to equilibrium and high values for ordered systems according to
where
where N corresponds to the total number of nodes of the GCC network.
Conditional degree matrix (CD matrix): when studying social networks, we have been able to verify, as already indicated in [38, 39], that metrics referring to local properties (such as the degree of a node) do not capture the general richness of network topology. One way to further characterize the structural properties of the studied networks T is to define the conditional degree matrix,
where
Using the proposed probabilities, similar metrics to those mentioned above can be defined: entropy, disequilibrium and complexity.Important for this work is the definition of the actual domain of this probability matrix, i.e. what array elements of
where
Polarization was calculated for each harvest obtaining a measure from the resulting density distribution of nodes? opinion values
where
and
3.3.2 Content Metrics
Sentiment analysis: is an automatic task of massive classification of documents, which focuses on cataloging the documents according to the positive or negative connotation of the language used in it. We have used the python sentiment-spanish library [44] to infer the positive and negative sentiments of each tweet harvested. This library uses a convolutional neural network to predict the feelings of words in Spanish. This model was trained using more than 800,000 user reviews from various websites, such as eBay and Film affinity. This library delivers sentiment values between 0 and 1. In this work, values closer to 1 indicate negativity of the message and values closer to 0 indicate positivity of the message.
Presence of specific words: we quantified the presence of words “charged” of anger, fear and social critical relevance for Chilean context. In this case, we used the NLTK corpus WordNet in order to increase the probability of finding words of this type.
Topic relevance: we developed a web-crawler to extract from Trendinalia.com the duration (hours) of trending topics analyzed in each harvest. This metric denotes the importance of the topics analyzed in the Chilean context.
3.3.3 Order, Disequilibrium and Diversity (ODD)
In order to capture the order, disequilibrium, diversity of T networks analyzed, as well as the topic importance, we introduce the metric
where C corresponds to the Complexity of the T network (Eq. 1),
3.3.4 Metrics and Social Theory
Finally, the metrics proposed in this section try to quantify some expressions of the properties described in Section 2. Table 1 shows our proposal about the relation between these metrics and the theory behind social crises.
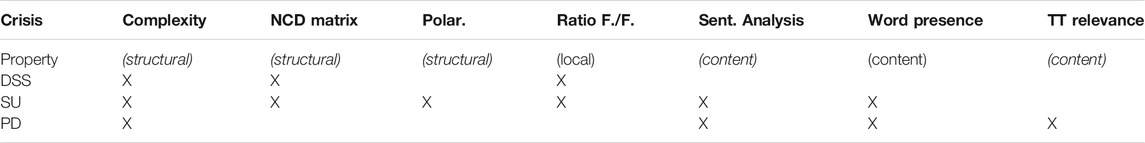
TABLE 1. Scope of action of the metrics proposed in relation to the properties of social crises described in Section 2: Desectorization of social space (DSS), Structural uncertainty (SU), and Processes of deobjectivation (PD).
4 Results
It seems to be clear which are the characteristics associated with the phenomenon of the crisis, at least from the social sciences point of view. However, it is not entirely clear in those disciplines, what are the conditions that allow its manifestation. We are not referring only to precursors or early-warning signals, where there is practically unexplored terrain, but to those contexts which appear as multiple and unclear. The problem of detecting early warnings in social networks has been investigated in various ways, and even in this work we present different perspectives, from a sociological and qualitative point of views, using network theory and complexity tools.
Berestycki et al. [4] show that before the social explosions associated with crisis, society needs to be “ripe”, charged with negativity and violence. This behavior is manifested in the case of our study. Figure 3 shows the analysis of the messages associated with the trending topics of the moment, issued by Chilean Twitter users.
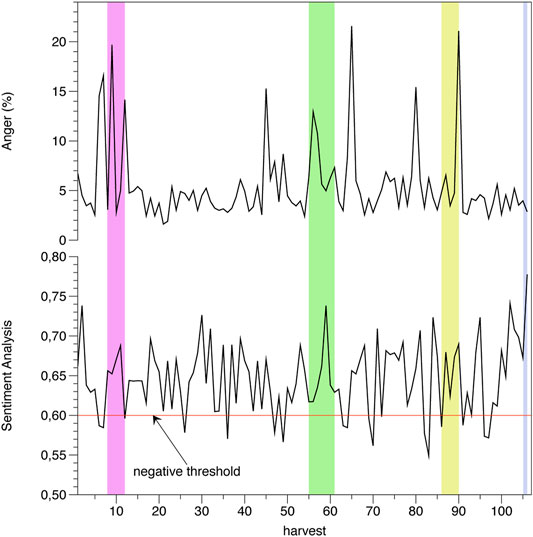
FIGURE 3. Content analysis of the tweets associated with trending topics studied. Upper plot: presence (%) of words related with anger sentiment. Bottom plot: sentimental analysis (negative threshold is drawing in red). The four color regions show different critical moments for Chilean society: National Truck Stoppage (Purple), case of extreme police violence (Green), social outbreak anniversary (Yellow) and, plebiscite for a new constitution (Grey).
The result of the sentiment analysis of the messages seems be fairly obvious for crisis situations: messages are usually negative in character. In addition, the result is complemented with the analysis of the presence of words full of anger for the Chilean context, which in some cases coincide with moments of high tension in Chilean society marked with four vertical stripes of color: National Truck Stoppage (Purple), case of extreme police violence (Green), social outbreak anniversary (Yellow) and, plebiscite for a new constitution (Grey). The width of vertical stripes denotes the duration (i.e., significant presence) of the events in Twitter.
This negative verbal context coincides with a highly polarized digital society (upper plot of Figure 4), highlighting the tension between conservatives and progressives regarding the future of the country. It can be seen that, like the sentiment analysis, user polarization of U networks was high throughout the period of analysis.
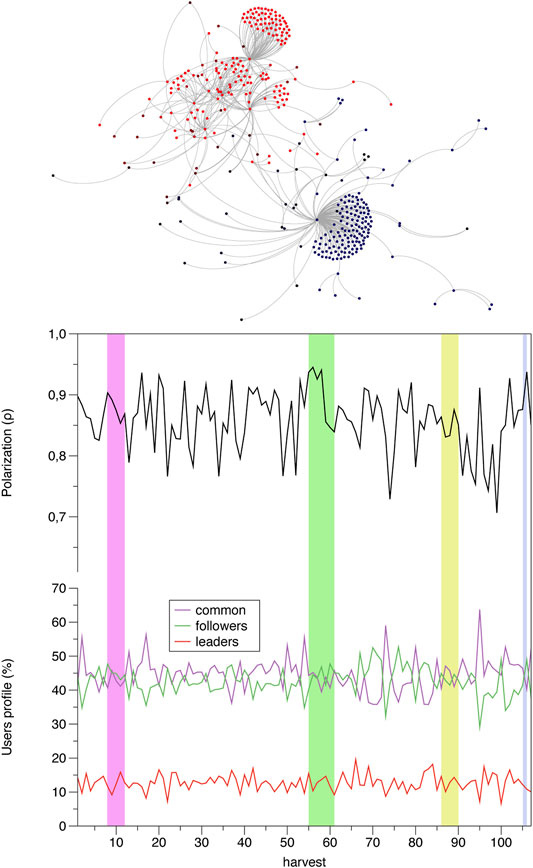
FIGURE 4. User analysis for the tweets associated with the trending topics studied. Upper plot: Polarization ρ of U networks during the studied period and network example of a digital social system polarized denoted by two groups (red and blue). Bottom plot: Participation (%) of types of users (commons, followers, leaders) during the studied period. Colored regions correspond to the same ones in Figure 3.
Something similar happens with the distribution of participating user types, which does not vary during the period. Notwithstanding the foregoing, it is interesting to note that during the entire period, those leading users are not opinion leaders (Followers/Friends
A polarized society, and negative and violent verbal language, seem to reflect the state of a society [45]. But, do they allow us to forewarn a crisis or a critical moment for the society? Apparently not. The results show minimal variations in these parameters during the period studied, even during those moments of high social tension manifested by the material and digital society, which had important consequences.
It would seem suggestive to think that these moments of high tension are associated with greater activity in the digital society, however, this is not the case either. Figure 5 (lower plot) shows that during these moments the number of users as well as tweets associated with the hot topics of the moment, do not show variations either. Nothing special is observed in user activity either. The average number of tweets by user does not match the critical moments that society experienced either.
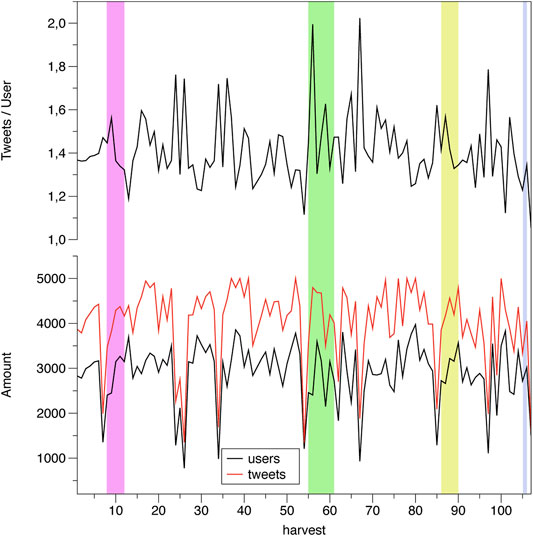
FIGURE 5. User analysis for the tweets associated with the trending topics studied. Upper plot: Average number of tweets by user during the studied period. Bottom plot: Number of tweets and users during the studied period. Colored regions correspond to the same ones in Figure 3.
At this moment our results about structural properties of thematic networks T become relevant. Upper plots of Figure 6 show the Complexity (A plot), NCD Matrix (B plot) and the interest (hours) generated by the trending topics obtained in each harvest (C plot), for the thematic networks T during the period studied. Fluctuations can be observed in all cases during the period studied, which in some cases coincide with moments of high social tension.
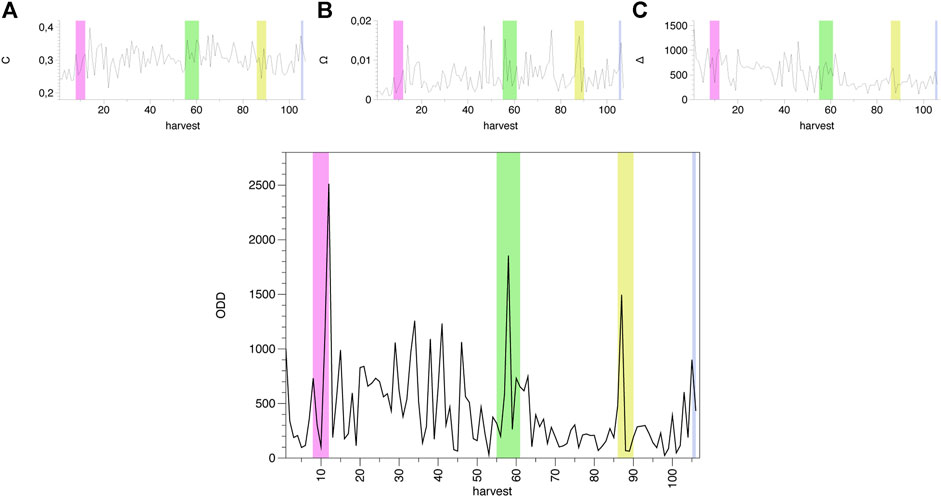
FIGURE 6. A: Complexity of T networks (C, Eq. 1). B: NCD Matrix of T networks (
What is relevant appears when considering these measures in order to rescue broad changes in the structural complexity of thematic networks. Thus, by combining the entropy of the thematic system, its structural disequilibrium, its diversity in terms of connectivity, and its impact, four major fluctuations are clearly appreciated in this constructed metric ODD, which coincide with periods of high social unrest in the country (color mark) that resulted in important social transformations. That is, during critical moments, and in particular before they manifest themselves in the material society, thematic networks become more complex, with a high degree of order, far from structural equilibrium and with a wide diversity in the connectivity between these themes.
5 Conclusions
This work explored the digital behavior of Chilean society in the midst of a deep social crisis. The analysis of the messages associated with the main trending topics used by Chilean Twitter users, suggest that the crisis that the country is experiencing is expressed not only in the so-called material society through multiple expressions, but is also expressed in the digital society in which the inhabitants of the country communicate preferentially for the treatment of these and other issues.
The results show that the digital activity of Twitter reflects the tension of events that occurred in the material society, while the digital activity “feeds” this tension. Consequently, this relationship is clearly reciprocal. Nevertheless, our results suggest that digital activity would allow alerting about critical events with the potential to generate social transformations. For example, the first critical moment detected in our analysis (pink region in Results section figures) resulted in the accusation and subsequent departure of the prime minister of Chilean government [46]. The second moment (green region) had consequences for the restructuring of the national police, the arrest of several people and even threats towards judges investigating the case associated with the event [47]. The third moment (yellow region) was the anniversary of the so-called “social outbreak” associated with several riots around the country [48], and the fourth moment (grey region) resulted in a historic vote that meant rewriting the national constitution [49].
Traditionally, online social network analysis focuses on users and sentiment analysis of the messages. However, in this work we don’t observe a strong correlation between the activity intensity of users and critical moments (Figure 5), nor with the polarization (upper plot of Figure 4), or the usage of negative/violent language that remains constant throughout the period studied (Figure 3). What our results show is that at critical moments preferably common and follower users share information (bottom plot of Figure 4), taking away the traditional role of the media and other echo chambers. Nevertheless, the most important result of our work is that the organization of information, posted by these kind of users, seems to be the key to anticipating critical events with the potential to generate social transformations. In fact, the increase in the order, disequilibrium and diversity of hot topics relationships, seem to be a signal of the beginning of a critical moment with unexpected results, at least that is what our results show for a polarized digital society that communicates with violent and negative language.
The novel proposed methodology, based on the analysis of thematic networks, allows us to observe the aforementioned reciprocal relationship between digital and material societies. Thus, from our perspective, users become only agents for the transmission of information forming a decentralized collective that generates and maintains the energy associated with information related to critical events. In critical moments, the information (topics) is organized in a non-trivial way and it seems to capture the social tension as well as its subsequent relaxation (Figure 6). Thus, the thematic networks T would allow access to representations and ideas about reality at a particular moment. These networks would self-organize through the emergence and dynamics of hot topics as objects of reference [50] in the exchange of opinions within Twitter.
The emergence of order in the information that flows through online social media prior to critical moments seems to enrich the social theory of crises from an adaptive social perspective. The (apparent) loss of structure described by social theory (i.e., the conjunctural desectorization of the social space, structural uncertainty, and the processes of deobjectivation) actually signifies a restructuring of order engendered by critical events. In fact, the deep social crisis manifested by the Chilean society has shown an evident loss of structure in part of its organization; however, other parts of the social system seems to reorganize itself into new structures. The complex behavior observed in critical moments such as the ones described in this work, along with others in which society is organized against the established order, included the future national constitution, would be the manifestation of the spontaneous increase of complexity that the systems manifest in its adaptive process. Thus, the complexity of the adaptive system is maintained and even increased during the process. This is a hypothesis that may be probed in a future as well as a deeper understanding behind the observed correlation between the organization of information in online social networks and social crisis events.
Data Availability Statement
Publicly available datasets were analyzed in this study. This data can be found here: Twitter Public Dataset.
Author Contributions
All authors provided critical feedback and helped shape the research, analysis, and manuscript.
Funding
This work was supported by the Office of Naval Research Global (ONRG) under Grant no. N62909-20-1-2060. MF thanks ANID FONDECYT 1211323.
Conflict of Interest
The authors declare that the research was conducted in the absence of any commercial or financial relationships that could be construed as a potential conflict of interest.
Footnotes
1We use the concept of Material to refer to those traditional face-to-face human relationships.
2In non-crisis contexts, they are what the different actors in these social systems use to live together.
3GET Trends Place API: https://developer.twitter.com/en/docs/twitter-api/v1/trends/trends-for-location/api-reference/get-trends-place
References
1.C Lineweaver, P Davies, and M. Ruse eds. What is complexity? Is it increasing?. In: Complexity and the arrow of time. Cambridge: Cambridge University Press (2013). p. 3–16. doi:10.1017/CBO9781139225700.002
2. Tainter J. The collapse of complex societies. Cambridge, United Kingdom: Cambridge University Press (1988). p. 1–37.
3. Cárdenas JP, Vidal G, Urbina C, Olivares G, Rodrigo P, Fuentes M. Social crises:signatures of complexity in a fast-growing economy. Complexity (2018) 2018. doi:10.1155/2018/9343451
4. Berestycki H, Nadal JP, Rodíguez N. A model of riots dynamics: Shocks, diffusion and thresholds. Net. Heter. Med. (2015) 10(3):443–75. doi:10.3934/nhm.2015.10.443
5. Cárdenas JP, Vidal G, Urbina C, Olivares G, Fuentes MA. Social crises. A network model approach. Physica A: Stat. Mech. Appl. (2018) 505:35–48. doi:10.1016/j.physa.2018.03.031
6. Thomas JA, Telfer MG, Roy DB, Preston CD, Greenwood JJD, Asher J, et al. Comparative losses of British butterflies, birds, and plants and the global extinction crisis. Science (2004) 303(5665):1879–81. doi:10.1126/science.1095046
7. Famiglietti JS. The global groundwater crisis. Nat Clim Chan (2014) 4(11):945–48. doi:10.1038/nclimate2425
8. Bartram SM, Bodnar GM. No place to hide: the global crisis in equity markets in 2008-2009. J. Int. Money Finan. (2009) 28(8):1246–92. doi:10.1016/j.jimonfin.2009.08.005
9. Castells M. The new public sphere: global civil society, communication networks, and global governance. ANNALS Am. Acad. Polit. Soc. Sci. (2008) 616(1):78–93. doi:10.1177/0002716207311877
11. Ledford H. How Facebook, Twitter and other data troves are revolutionizing social science. Nature (2020) 582(7812):328–30. doi:10.1038/d41586-020-01747-1
12. Almond GA, Flanagan SC, Mundt RJ eds. Crisis, choice, and change: historical studies of political development. Boston, MA: Little Brown (1973).
13. Dobry M. Sociologías de las crisis políticas. Madrid, Spain: Centro de Investigaciones Sociológicas (1988). 299 p.
15. Flanagan S. Theory and method in the study of coalition formation: toward a more general model of political coalitions. J Comp Adm (1973) 5(3):267–314. doi:10.1177/009539977300500301
18. Granovetter M. Threshold models of collective behavior. Am J Soc (1978) 83(6):1420–43. doi:10.1086/226707
19. Habermas J. Raison et légitimé. Problémes de légitimations dans le Capitalisme avancé. Payot: París (1978).
20. Luhmann N. Sociocybernetics: Temporalization of complexity. Boston, MA: Springer (1978). 95–111 p.
21. Zald MN, McCarthy JD. The dynamics of social movements: Resource mobilization, social control, and tactics. Newyork: Little Brown & Co. (1979).
22. Dobry M. Mobilisations multisectorielles et dynamique des crises politiques: un point de vue heuristique. Revue française de sociologie (1983) 395–419. doi:10.2307/3321867
23. Echeburúa EP. Intervención en crisis en víctimas de sucesos traumáticos ¿cuándo, cómo y para qué?. Psicología conductual (2007) 15(3):373–87.
24. Clarà M. Meaning and mediation of emotional experience: placing mediational meaning at the center of psychological processes. New Ideas Psychol (2020) 58. doi:10.1016/j.newideapsych.2019.100776
25. Taber C, Lodge M. M. Motivated skepticism in the evaluation of political beliefs. Am J Polit Sci (2006) 50(3):755–69. doi:10.1111/j.1540-5907.2006.00214.x
27. Kemp S. DIGITAL 2019: CHILE (2019). Available at: https://datareportal.com/reports/digital-2019-chile?rq=chile (Accessed December 15, 2020).
28.Diario La Segunda. En Chile el 15% de las personas está en Twitte... Es la elite digital de Chile (2020). Available from: https://digital.lasegunda.com/2020/08/24/A/GG3RG295 (Accessed October 10, 2020).
29. Garimella K, Weber I. A. long-term analysis of polarization on Twitter In: Proceedings of the 11th International Conference on Web and Social Media (ICWSM); May 15 2017-May 18; Montreal, Canada (2017).
30. DellaPosta D, Shi Y, Macy M. Why do Liberals Drink Lattes?. Am J Sociol (2015) 120(5):1473–511. doi:10.1086/681254
31. Shi F, Teplitskiy M, Diede E, Evans J. The wisdom of polarized crowds. Nat Hum Behav (2019) 3:329–336. doi:10.1038/s41562-019-0541-6
32. Kenneth MR. (Re)Politicizing inequalities: Movements, parties, and social citizenship in Chile. J Pol Latin Am (2016) 8(3):125–54. doi:10.1177/1866802X1600800305
33. Thom R. Esquisse d’une sémiophysique: Physique aristotélicienne et théorie des catastrophes. French: FeniXX (1991). 292 p.
34. Cohen R, Havlin S. Complex networks: structure, Robustness and function. Cambridge, United Kingdom: Cambridge University Press (2010).
36. Wiedermann M, Donges JF, Kurths J, Donner RV. Mapping and discrimination of networks in the complexity=entropy plane. Phys Rev E (2017) 96(4):42304. doi:10.1103/physreve.96.042304
37. Martin MT, Plastino A, Rosso OA. Statistical complexity and disequilibrium. Phys. Lett. A. (2003) 311(2-3):126–32. doi:10.1016/s0375-9601(03)00491-2
38. Grisi-Filho JH, Ossada R, Ferreira F, Amaku M. Scale-free networks with the same degree distribution: different structural properties. Phys Res Int (2013) 2013:9. doi:10.1155/2013/234180
39. Tsiotas D. Detecting different topologies immanent in scale-free networks with the same degree distribution. Proc Natl Acad Sci USA (2019) 116(14):6701–6. doi:10.1073/pnas.1816842116
40. Morales AJ, Borondo J, Losada JC, Benito RM. Measuring political polarization: twitter shows the two sides of Venezuela. Chaos: Interdiscip J Nonlinear Sci (2015) 25:033114. doi:10.1063/1.4913758
41. Olivares G, Cárdenas JP, Losada JC, Borondo J. Opinion polarization during a Dichotomous electoral process. Complexity (2019) 2019:1. doi:10.1155/2019/5854037
42. Chen C, Gao D, Li W, Hou Y. Inferring topic-Dependent influence roles of twitter users. in: Proceedings of the 37th international ACM SIGIR conference on Research and development in information retrieval; 2014 July 6-July 11; Gold Coast, QLD (2014).
43. Krishnamurthy B, Gill P, Arilitt M. A Few Chirps about Twitter. in: Proceedings of the first workshop on Online social networks; 2008 August 18; Washington, USA (2008).
44. Hofman E. A pre-trained sentiment Analysis classifier in Spanish: Available at: https://github.com/aylliote/senti-py (Accessed August 12 2020) (2018).
45. Zollo F, Novak PK, Del Vicario M, Bessi A, Mozetič I, Scala A, et al. Emotional dynamics in the age of misinformation. PLoS ONE (2015) 10(9):e0138740. doi:10.1371/journal.pone.0138740
46.France24. Chile’s Interior Minister resigns after being suspended by the Chamber of Deputies (2020). Available from: https://www.france24.com/es/minuto-a-minuto/20201103-ministro-del-interior-de-chile-renuncia-tras-ser-suspendido-por-la-cámara-de-diputados (Accessed December 15, 2020).
47.El País. Carabineros de Chile, en el ojo del huracán por la caída de un joven a un río en medio de una manifestación (2020). Available at: https://elpais.com/internacional/2020-10-03/carabineros-de-chile-en-el-ojo-del-huracan-por-la-caida-de-un-joven-a-un-rio-en-medio-de-una-manifestacion.html (Accessed December 15, 2020)
48.The Guardian. Churches burned amid tense anniversary protests in Chile—video (2020). Available at: https://www.theguardian.com/global/video/2020/oct/19/churches-burned-amid-tense-anniversary-protests-in-chile-video (Accessed December 15, 2020)
49.Gobierno de Chile. Proceso Constituyente (2020). Available at: https://www.gob.cl/procesoconstituyente/ (Accessed October 10, 2020).
Keywords: social crises, complexity, social networks, polarization, thematic networks, early-warning
Citation: Cárdenas JP, Olivares G, Vidal G, Urbina C and Fuentes M (2021) The Structure of Online Information Behind Social Crises. Front. Phys. 9:650648. doi: 10.3389/fphy.2021.650648
Received: 07 January 2021; Accepted: 18 February 2021;
Published: 28 April 2021.
Edited by:
Haroldo V. Ribeiro, State University of Maringá, BrazilReviewed by:
Nuno A. M. Araújo, University of Lisbon, PortugalLuiz G. A. Alves, Northwestern University, United States
Copyright © 2021 Cárdenas, Olivares, Vidal, Urbina and Fuentes. This is an open-access article distributed under the terms of the Creative Commons Attribution License (CC BY). The use, distribution or reproduction in other forums is permitted, provided the original author(s) and the copyright owner(s) are credited and that the original publication in this journal is cited, in accordance with accepted academic practice. No use, distribution or reproduction is permitted which does not comply with these terms.
*Correspondence: Miguel Fuentes, ZnVlbnRlc21Ac2FudGFmZS5lZHU=