Oscillatory Microrheology, Creep Compliance and Stress Relaxation of Biological Cells Reveal Strong Correlations as Probed by Atomic Force Microscopy
 D.A.D. Flormann1 C. Anton1 M.O. Pohland1 Y. Bautz1
  K. Kaub1,2
  E. Terriac3 T.E. Schäffer4
  J. Rheinlaender4 A. Janshoff2
  A. Ott1*†
  F. Lautenschläger1*†
- 1Center for Biophysics, Saarland University, Saarbruecken, Germany
- 2Institute of Physical Chemistry, University of Goettingen, Göttingen, Germany
- 3Leibniz Institute for New Materials, Saarbruecken, Germany
- 4Institute of Applied Physics, Eberhard-Karls University Tübingen, Tübingen, Germany
The mechanical properties of cells are important for many biological processes, including wound healing, cancers, and embryogenesis. Currently, our understanding of cell mechanical properties remains incomplete. Different techniques have been used to probe different aspects of the mechanical properties of cells, among them microplate rheology, optical tweezers, micropipette aspiration, and magnetic twisting cytometry. These techniques have given rise to different theoretical descriptions, reaching from simple Kelvin-Voigt or Maxwell models to fractional such as power law models, and their combinations. Atomic force microscopy (AFM) is a flexible technique that enables global and local probing of adherent cells. Here, using an AFM, we indented single retinal pigmented epithelium cells adhering to the bottom of a culture dish. The indentation was performed at two locations: above the nucleus, and towards the periphery of the cell. We applied creep compliance, stress relaxation, and oscillatory rheological tests to wild type and drug modified cells. Considering known fractional and semi-fractional descriptions, we found the extracted parameters to correlate. Moreover, the Young’s modulus as obtained from the initial indentation strongly correlated with all of the parameters from the applied power-law descriptions. Our study shows that the results from different rheological tests are directly comparable. This can be used in the future, for example, to reduce the number of measurements in planned experiments. Apparently, under these experimental conditions, the cells possess a limited number of degrees of freedom as their rheological properties change.
Introduction
The mechanical properties of cells are of great importance in a wide diversity of biological phenomena, which include cell migration [1, 2], cell differentiation [3], cell division [4], embryogenesis, and cancers [5, 6]. To investigate cell mechanics [7], a broad range of techniques have been established. Examples here are seen with beads moved by optical tweezers [8, 9], magnetic twisting cytometry [10, 11], microplate viscometry [12], cell monolayer shearing, and atomic force microscopy (AFM) [13–21]. Comparisons across techniques have revealed strong quantitative differences, even when the same parameter has been probed for the same cell type [22]. Differences in the mechanical state of the cells might be involved here. Such differences can be caused by biochemical signaling; for instance, through specific adhesion to a substrate [19, 21]. Moreover, cells actively react to deformation, which means that their mechanical properties are history dependent [23]. Probing on different time and length scales might result in large differences in cell responses that are accompanied by different mechanical properties. Cell deformation at small scales follows a linear description [46]. In this regime, the validity of a power-law description was found to hold for many different cell types [24]. Large-scale deformation requires a more sophisticated description, taking into account non-linear and history-dependent properties [23]. Accordingly, small-scale cell deformation cannot simply be integrated to obtain the response at larger scales [25].
Here, we used AFM to characterize the viscoelastic properties of living cells in a liquid environment and at physiological temperatures [26]. Depending on the shape of the cantilever used to establish the mechanical contact with the cells, AFM can be used to probe the viscoelastic properties globally [27] or locally [28]. The Hertz-Sneddon model [29] is most commonly used to extract quantitative elastic material properties from AFM measurements. However, this model assumes purely elastic materials, while cells exhibit viscoelastic properties [14, 18–21, 30]. Creep compliance [14, 31], stress relaxation [20, 32], and oscillatory microrheology [17, 18] are standard rheological tests that can been applied with AFM, thereby giving information about both the elastic and the viscous properties of the cells.
Here, we asked whether the tests performed are interdependent, such that the main parameters from these different tests are correlated. For this study, we applied well-known pharmacological agents to alter the cellular cortex, and potentially thereby also altering the mechanical properties of the cells. These drugs have been extensively characterized in other studies. Here, we were not interested in the precise working actions or properties of these drugs; rather, we used them to alter the mechanical properties of the cells to determine whether these changes are reflected by the different rheological tests in ways that are related and that can be understood. In our local probing experiments, we identified correlations and further interrelations between the parameters obtained.
Results
In this study, all of the probing was performed either at the cell nucleus or at the perinucleus. We took the perinucleus as the region between the border of the nucleus and the periphery of the cell (see Figure 1A for details). At each location, we performed the different rheological methods, as schematically shown in Figure 2A.
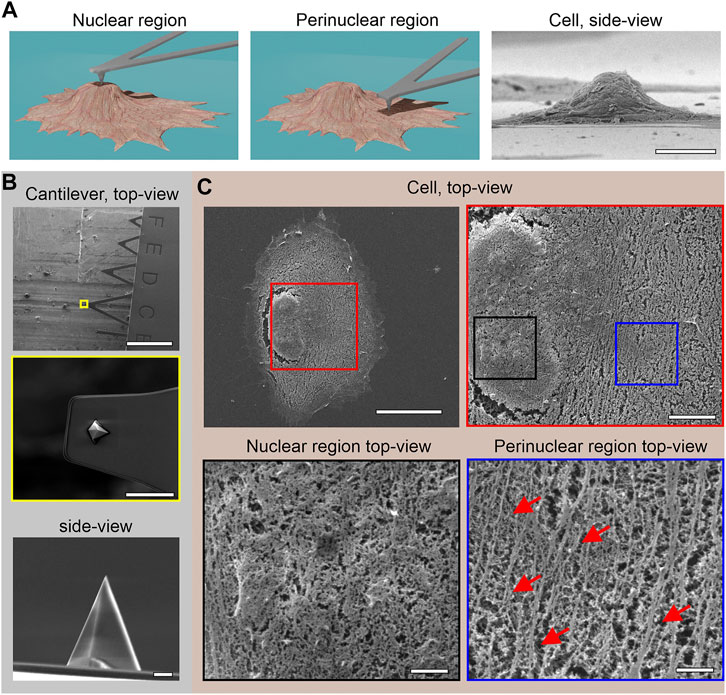
FIGURE 1. Scanning electron microscopy images. (A) Schemes of AFM cantilever positioning at the nuclear (left) and perinuclear (middle) cell regions, showing also a side-view of a hTERT-RPE1 cell after membrane removal (right). (B) Representative images of the AFM cantilever (top) and the indenter (middle, bottom). (C) A representative hTERT-RPE1 cell after membrane removal at different magnifications (color-coded frames highlight the magnified regions). Arrows, exemplary actin bundles. Scale bars: (A): 10 μm; (B) top to bottom: 300 μm, 10 μm, 1 μm; (C): 20 µm (top left), 5 µm (top right), 1 µm (bottom left, black frame), 1 µm (bottom right, blue frame).
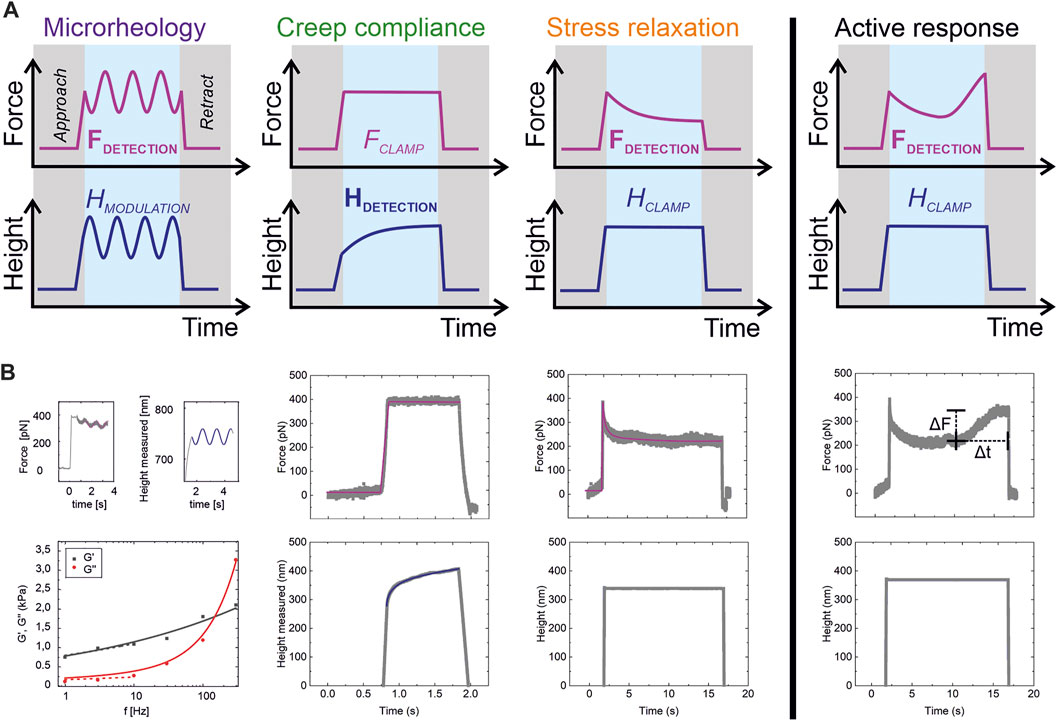
FIGURE 2. Methods and raw data. (A) Overview of the rheological test protocols used in this study, where either force or cell height are imposed, and the other parameters are measured. (B) Raw data from the tests in (A). Fits of Eqs 1, 6, 7, and 10 to data are in color; force (magenta), height (blue). G′ over full frequency range: black line, G′ over 1–10 Hz (approximated with single power law): dashed black line. G″ over full frequency range: red line. G″ over 1–10 Hz (approximated with single power law): dashed red line.
From analysis of the force-indentation data during the cantilever approach, the Young’s modulus E was determined using the Hertz-Sneddon model (see Supplementary Figure S1 for an example curve).
In oscillatory microrheology, the complex modulus of the cell (Figure 2B, left panel) can be described by a power-law structural damping material model [17, 33, 34]:
where G0 is the shear modulus scaling factor, α is the power-law exponent, which describes the fluidity of the sample, and μ is the (linear) viscosity [18]. f0 is a frequency scaling factor, assumed to be f0 = 1 Hz. The viscosity related term is known to describe the higher frequency behavior. To demonstrate that the lower frequency range can be described by a single power law, we fitted Equation 1 without the viscosity term to the data f = 1–10 Hz (Figure 2B, dashed curves), yielding G0 = 620 ± 40 Pa and α = 0.14 ± 0.02. This agrees with the fit including the viscous term (G0 = 580 ± 60 Pa, α = 0.17 ± 0.02, µ = 1.4 ± 0.1). We used the model including the viscosity term for the oscillatory microrheology analysis, but a single power law for the two time-domain related methods as described in the following.
We describe the creep compliance of the cell (Figure 2B, 2nd left panel) as:
where E0 is the modulus scaling parameter, which is a measure of the stiffness of the material and equivalent to the apparent Young’s modulus of the material at time
We describe the stress relaxation response of the cell (Figure 2B, 3rd left panel) by modelling as a thin contractile shell according to:
where KA is the area compressibility modulus, and γ is the fluidity. The time scaling parameter t0 is set to
More information on the formalism and the extraction of the numerical values from the experiments is included in the Methods section.
Cytoskeletal Perturbation Using Drugs
Here, we only refer to the results from the nuclear region of the cell (Figures 3A,B), as the results from probing within the perinuclear regions were similar (Figures 3C,D).
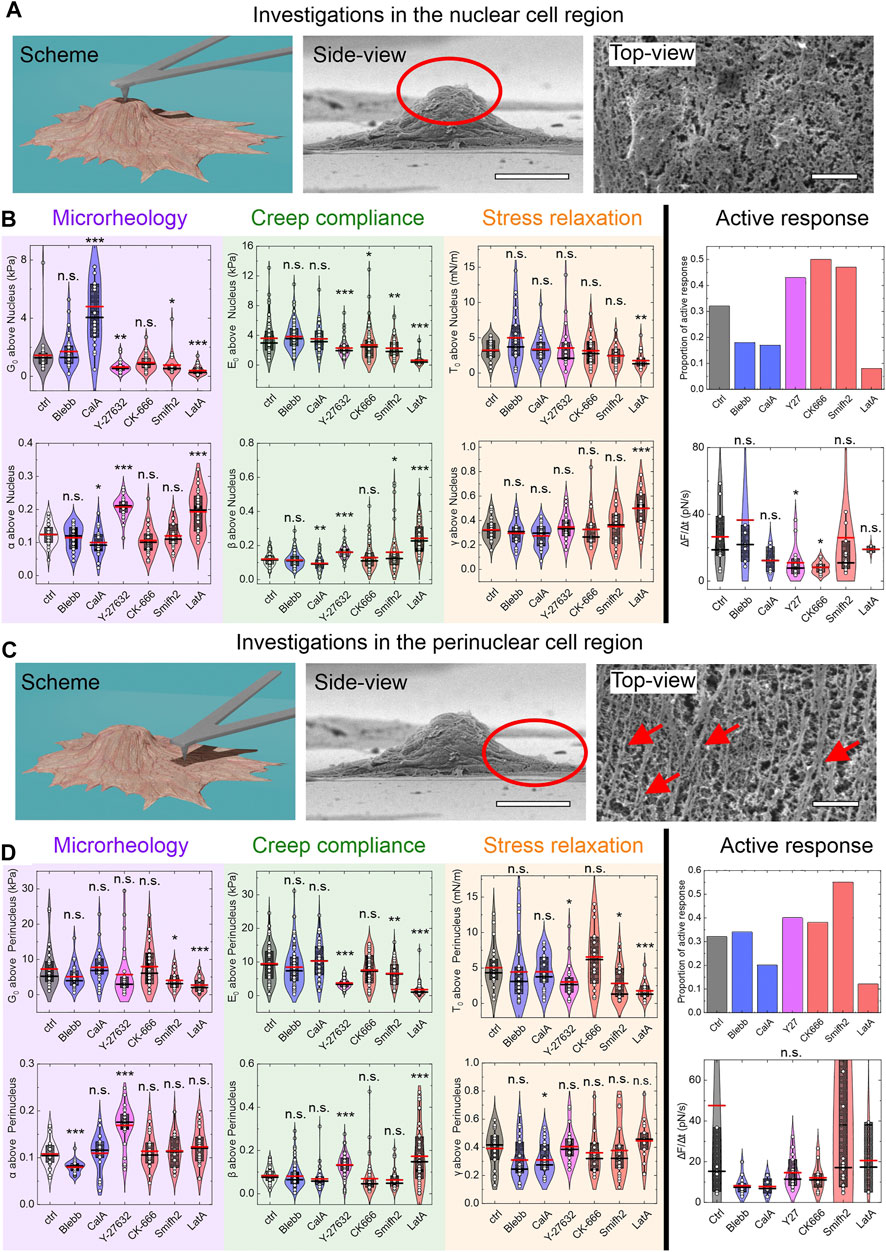
FIGURE 3. Selected parameters obtained from rheological tests. (A) Position of the cantilever. (B) Data for control and applied drugs for G0 and α from microrheology; E0 and β from the creep compliance; T0 and γ from stress relaxation and the proportion of cells actively responding during stress relaxation; ΔF/Δt for the active response. (C, D) Same as in (A) and (B), except for the cantilever positioned at the perinucleus. Arrows, exemplary actin bundles. n. s., p > 0.05; *, p < 0.05; **, p < 0.01; ***, p < 0.001 vs. untreated cells (ctrl) (Student’s t-tests). Scale bars (A, C): 20 µm (middle images), 1 µm (right images). Cell numbers N apply to all parameters tested by the particular protocol (including Figure 4 and Supplementary Figure S3). Cell numbers N are in the following order: Ctrl, Blebb, CalA, Y-27632, CK-666, Smifh2, LatA. Microrheology (B): N = 28, 28, 20, 29, 29, 24, 26; Microrheology (D): N = 27, 29, 26, 27, 24, 19, 22; Creep compliance (B): N = 53, 86, 38, 51, 63, 45, 40; Creep compliance (D): N = 52, 73, 34, 49, 47, 31, 43; Stress relaxation (B): N = 26, 21, 28, 23, 19, 20, 17; Stress relaxation (D): N = 22, 22, 26, 24, 15, 21, 17; Active response (B) for ΔF/Δt: N = 9, 7, 7, 16, 16, 18, 2; Active response (D) for ΔF/Δt: N = 9, 13, 8, 15, 12, 20, 3. The total numbers of cells analyzed for active responses were the same as for stress relaxation.
The inhibition of nonmuscle myosin II (NM II) using blebbistatin is expected to decrease the pre-stress of the cellular cortex [35]. Here, the addition of blebbistatin had no significant influence (Figure 3A), with the exception of an increase in viscosity μ (Figure 4). Calyculin A is reported to increase the NM II activity via inhibition of PP1 and PP2A [36]. Compared to untreated cells (control), calyculin A resulted in a significant increase in the scaling factor G0, and a decrease in the power-law exponents α and β (Figure 3B). Treatment of the cells with Y-27632 is reported to inhibit Rho-associated protein kinase (ROCK), with downstream effects on cofilin activity, for example [37]. Here, Y-27632 resulted in a decrease in the Young’s modulus E, and in the cell viscosity μ, and G0 and E0. All of the power-law exponents (i.e., the fluidities) appear to be increased by Y-27632 (Figure 3B). According to the literature, CK-666 inhibits the Arp2/3 complex [38], and its application here resulted in a decrease in E0 and μ (Figure 3B). Smifh2 inhibits formin via the FH2 domain [39], and it showed very similar effects to CK-666 here; however, in addition, Smifh2 resulted in an increase in β and a decrease in G0 (Figure 3B). Finally, treatment with the actin polymerization inhibitor latrunculin A [40] resulted in an increase in the power-law exponents α and β, while the parameters G0, E0, µ, and E decrease concomitantly (Figure 3B).
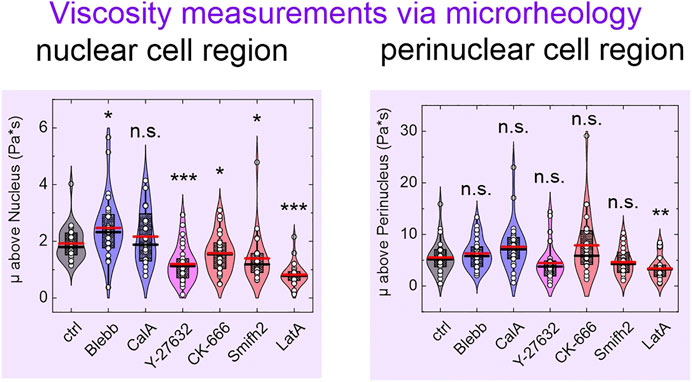
FIGURE 4. Viscosity μ as an additional parameter obtained from oscillatory microrheology tests at the nucleus and at the perinuclear region.
Active Responses of Cells Upon External Mechanical Stimuli
Cells are not just viscoelastic objects, they are viscoelastic objects that can actively respond to external mechanical stimuli [41]. Depending on the cytoskeletal alterations performed, active responses were obtained for 10–50% of the cells (Figure 3B, right column), which developed forces ΔF of up to a mean of 200 pN; these were reached within a time interval Δt of 8 s on average (Supplementary Figures S3B, D). Typically, the active response (if any) started after a few seconds of force relaxation, and continued until the end of the measurement (after 15 s), as would be expected [42]. Perturbation using various drugs reduced the maximum force per unit time (ΔF/Δt) compared to the control (while the majority of cells, as 50–90%, show no active responses; see Figures 3B,D). Moreover, drug perturbations enabled cells to reach their maximum active force faster than for the control if they were probed at the nucleus; however, this was slower than the control if probed at the perinucleus (compare Δt in Supplementary Figures S3B, D). This difference can be attributed to the higher cortical tension within the perinucleus that is induced by actin bundles, which were observed for all of the drug treatments (Figure 1C). Potentially, these bundles are a reason for the lower active response forces of the perinucleus compared to the nucleus (Supplementary Figures S3B, D).
Parameters From Power-Law Descriptions of the Different Rheological Tests Strongly Correlate
As the individual cells presented a large spread in their parameters, we examined the drug-induced changes as illustrated in Figures 5A–C. Here, G0, E0, and T0 correlated positively with the Young’s modulus E. The power law exponents (i.e., the so-called fluidities α, β, γ) of all of the tests correlated positively (Figures 5D,E), as did the scaling factors E0, KA, and G0. The scaling factors and fluidities were inversely correlated, as has been reported previously [20, 43]. T0, E, and µ correlated positively to the scaling factors (and inversely to the exponents α, β, γ), as shown in Figures 5D,E, which suggested universal scaling laws for living cells. Figure 5G underlines the correlation of the scaling factors (stiffnesses) and exponents (fluidities) of all three tests in a three dimensional plot.
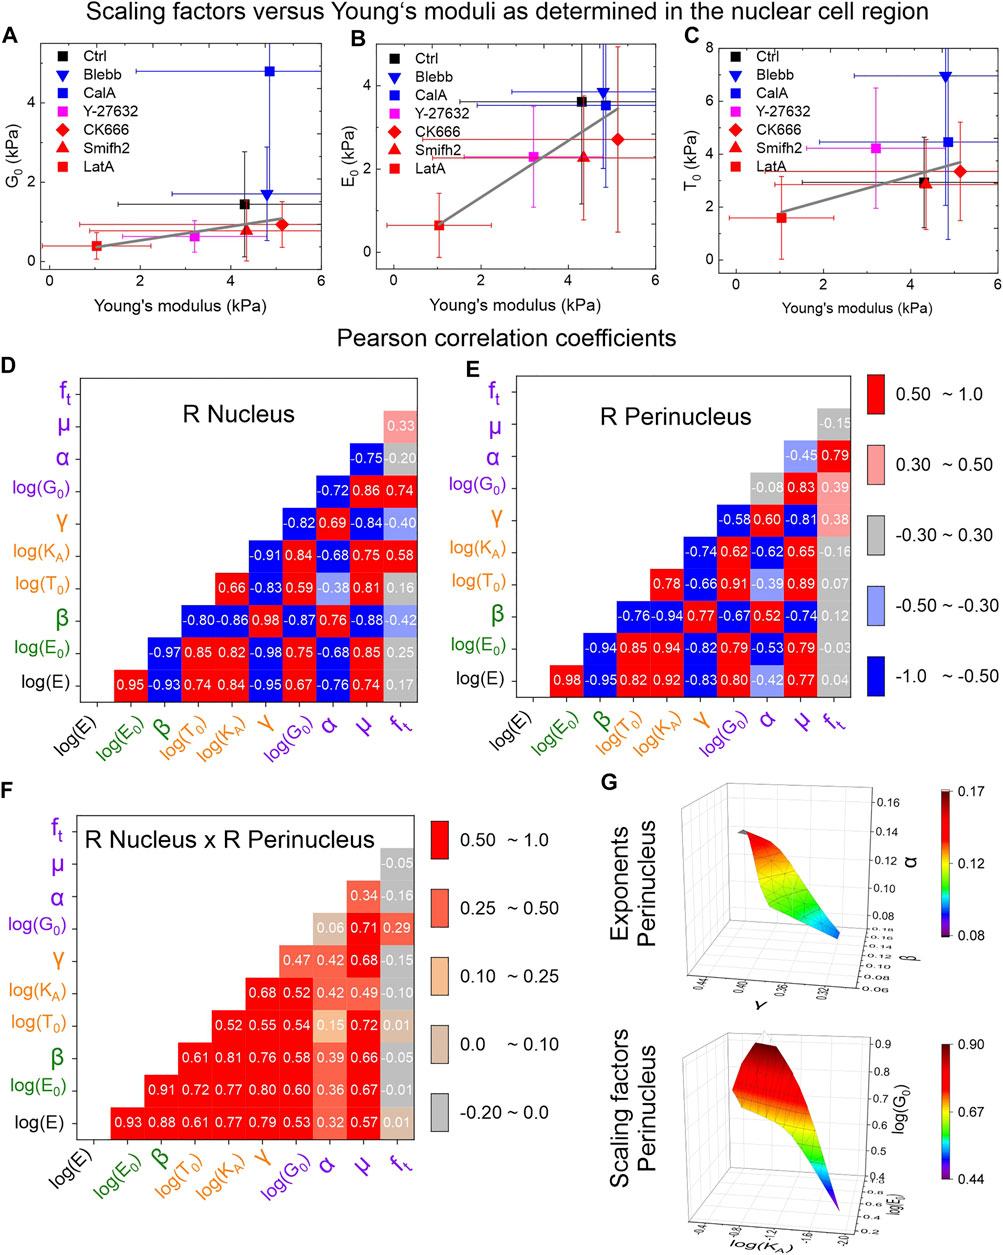
FIGURE 5. Correlations among all of parameters extracted from the different rheological tests. (A–C) Correlation of the Young’s modulus to G0, E0 and T0, as determined within the nuclear region of hTERT RPE1-cells; error bars represent standard deviations. Cell numbers N are in the following order: Ctrl, Blebb, CalA, Y-27632, CK-666, Smifh2, LatA: (A) N = 81, 114, 58, 80, 92, 69, 66; (B) N = 106, 172, 76, 102, 126, 90, 80; (C) N = 75, 108, 64, 75, 78, 66, 57. (D, E) Correlations among all of the accessible parameters of all of the three rheological tests, as well as the Young’s modulus as determined within the nuclear and perinuclear region. (F) Multiplication of Pearson R coefficients of each respective pair belonging to nucleus and perinucleus. (G) Three dimensional correlations between the scaling factors (“stiffnesses”) and exponents (“fluidity”) of creep compliance (E0, β), stress relaxation (KA, γ) and microrheology (G0, α); representation of the z-axis corresponds to the color code. Cell numbers N for correlations are based on seven data points each (see A–C). Therefore indirectly, each Pearson correlation coefficient between tests in (D) and (E) is based on typically N = 500–750 single cells (addition of cell numbers for the seven (drug) conditions for two tests).
Parameters are Conserved Over Cell Regions
Statistically, it is likely that correlations will be found even if the parameter set considered is random. To rule out such effects, we repeated the experiments at the perinucleus (i.e., the region between the nucleus and the cell periphery). Almost all of the parameters of creep, stress relaxation, and oscillatory microrheology showed similar results, and we observed the same correlations (Figures 5D,E). As the probing of the nucleus and the probing of the perinucleus are independent of each other, we can conclude that the correlations presented are statistically sustainable, as represented by the multiplication of the nuclear and perinuclear Pearson R values (Figure 5F). However, the perinuclear region did lead to larger scaling factors for all of the tests (compare Figures 3B,D).
Discussion
The exponents α, β, and γ from the power-law descriptions above are known as the fluidities, and they were clearly correlated (Figure 5). The scaling parameters, E0, KA, and G0 were also correlated. The scaling parameters and fluidities were inversely correlated. This agrees well with earlier studies (see Supplementary Tables S1–S4), where the inverse behaviors of the scaling parameters and fluidities have been observed for each test protocol independently [14, 18, 20]. Both creep and stress relaxation are linked to the viscous properties of the cell. At the same time, under the assumption of a linear viscoelastic material and a Poisson ratio of 0.5 that is time or frequency independent (both are usually assumed), the scaling parameters E0 and 3G0 should be identical [33]. This appears to be the case at the nucleus (Supplementary Figure S4), but not for the perinucleus. We hypothesize that this is due to the higher cortex tension within the perinucleus [44], which can lead to nonlinear material behavior [43, 45, 46], plasticity [47], or different memory effects in oscillatory microrheology when compared to creep compliance.
We see that the viscosity parameter μ correlated with the above parameters. However, the cortical tension T0 and the Young’s modulus also correlated with the fluidities (and stiffnesses). This might appear surprising, as a viscosity is a-priori independent of a stiffness; however, we have already shown that only very small deformations (i.e., of the order of 10 nm) lead to deformation size independent, “real” elasticities [25, 46]. Although large-scale deformations show in-phase, linear force-deformation relations as expected for a purely elastic body, they must be suspected of being pseudoelastic; i.e., to include a restructuring component [34, 48]. Therefore, if only a single parameter was to be used to follow cell mechanics, it would indeed appear to be justified to use the Hertz-Sneddon model, which considers elastic properties only [49–51].
For the drug-based perturbations, some of the rheological tests were more affected than others (Figure 3). In stress relaxation tests, only latrunculin A had significant effects on γ and T0 (but not on KA) (Figure 5; Supplementary Figure S3). The absence of detectable differences upon treatment with the other drugs might appear to contradict reports by others [18, 20]. We hypothesize that the statistically weaker significance of the changes in stress relaxation upon drug treatment as compared to creep and oscillatory microrheology are due to the initial approach at the relatively higher velocity (5 μm/s). Stress relaxation analysis yields different results if a cell is approached at a velocity of 0.5 μm/s [20]. Although, the differences that appear between drug-treated cells and the controls are often too small to be statistically significant, they were again consistently correlated, following a similar pattern to that discussed above. Notably, only for stress relaxation a material model with additional constant term had to be used, which is probably due to the fact that entirely different assumptions are made here (cortical shell model) as compared to the other two methods (viscoelastic half space).
For the oscillatory microrheology, the situation was different from the other two rheological tests. Oscillatory microrheology fixes the timescale of the perturbation according to the applied frequency, while the other tests probe a superposition on many timescales in a single test. This has the advantage that the frequency-dependency of the material response can be measured directly and that the measurement frequency can be adopted to the frequency range of interest [52]. However, time- and frequency-domain data are mathematical equivalents and time-domain data of the cells viscoelastic response can even be directly transformed into the frequency domain [53].
Investigation of the perinuclear region led to larger stiffness-related parameters than at the nuclear region. We hypothesize that this is a result of actin bundles under high tension within the perinucleus, as depicted in Figure 1 (perinucleus top-view, red arrowheads). This is well reflected by the increased (approximately by a factor of 2) cortical tensions T0 from nucleus (Figure 3B) to perinucleus (Figure 3D). Another explanation might be the presence of the substrate, as suggested in the studies by Garcia [54, 55], or local strain stiffening of cytoskeleton as proposed recently [56–58].
In conclusion, although different viscoelastic parameters are determined in different rheological tests, these parameters are far from independent. This suggests that cells regulate their mechanical parameters in a way that stiffening cells become less fluid at the same time.
Summary
Here, we show that the investigational methods of stress relaxation, creep compliance, and oscillatory microrheology are interdependent, since the parameter sets used for the description are clearly correlated. We analyzed the force-indentation during the initial approach to cells by Hertz-Sneddon contact mechanics [50, 59]. Although this purely elastic approach neglects viscous properties a priori, it produces a useful description. The Young’s modulus of cells is the most commonly determined mechanical parameter in AFM studies. We probed this parameter at a different approach velocity, so that viscous relaxation does not occur during the approach. We do not claim to universally explain the connections between these different rheological tests. A full study would require much more data, which is unfortunately beyond our reach to date, given the combinatorial explosion of multivariate experiments. However, we have shown that the different deformation patterns that were applied using these different methodologies are related, which indicates that the underlying connections here need to be investigated further to be fully understood.
Materials and Methods
Cell Culture
All of the experiments were performed with retinal pigmented epithelium cells (hTERT-RPE-1; ATCC, Manassas, VA, United States ). The cell culture medium was DMEM/F12 with 1% Glutamax, 1% Pen/Strep and 10% fetal bovine serum (Thermo Fisher Scientific, Waltham, MA, United States ). The cells were incubated in cell culture flasks (Cellstar, Greiner Bio-One, Kremsmünster, Austria) at 37°C and 5% CO2. Before each measurement, low numbers of cells were plated in Petri dishes (FluoroDish, World Precision Instruments, Sarasota, FL, United States ), which were incubated overnight at 37°C and 5% CO2. The cell medium was then replaced with fresh medium with 25 mM Hepes (Sigma-Aldrich, St. Louis, MO, United States ). If a pharmacological agent was added, the cells were incubated at 37°C in air for 30 min, or for 10 min for latrunculin A.
Cellular Regions
We investigated two cellular regions within the adhered hTERT-RPE1 cells: the nuclear and perinuclear regions (Figure 1A). We defined the nuclear region as the cellular region where the nucleus was identified by brightfield illumination, using the microscopy system specified below. We defined the perinuclear region as the region between the edge of the nucleus and the cell periphery. AFM experiments were always performed within the middle of the two-dimensional projections of those regions, rather than on the edges. As the indentations were less than 10% of the cell height (which corresponds to absolute values in the range of several 100 nm; data not shown), we expected to probe predominantly the viscoelastic properties of the cellular cortex, rather than the nucleus itself, or the substrate the cells were adhered to (35-mm glass bottomed FluorDishes, Ibidi, Germany).
Pharmacological Perturbations
In this study, hTERT-RPE-1 cells were treated with a range of inhibitory drugs. Blebbistatin (20 μM; para-nitroblebbistatin; Optopharma Ltd., Hungary) inhibits nonmuscle myosin II (NM II) [35]. Calyculin A (1 nM; Cayman Chemical, MI, United States ) increases cell contractility by increasing NM II activity [36]. Y-27632 (10 μM; Biomol GmbH, Germany) inhibits Rho-associated protein kinase (ROCK), which among other effects, lead to an indirect inhibition of NM II and activation of phospho-cofilin via LIMK [37]. CK-666 (100 μM; Abcam, UK) inhibits the actin nucleator Arp 2/3 that is also involved in crosslinking of actin filaments [38]. Smifh2 (10 μM; Sigma-Aldrich, Germany) inhibits the stabilization of actin filaments via the formins [39]. Latrunculin A (0.1 µM; Sigma Aldrich, Germany) inhibits polymerization of filamentous actin [40].
AFM: Setup and Measurements
All of the AFM measurements were performed using an atomic force microscope (Nanowizard 3; Bruker, Berlin, Germany) mounted on an optical microscope (Eclipse Ti-U, Nikon, Minato, Tokyo, Japan) and equipped with a PlanFluor 40x/0.6 Ph2 objective (Nikon). The system used lever C of a MLCT cantilever (Bruker, Billerica, MA, United States ) with a nominal spring constant of 0.01 N/m, and a four-sided pyramidal tip with half-opening angle of
To analyze the AFM data, various models are available. A good overview can be found in [61]. The models we used for the data analysis are detailed in the following section.
Young’s Modulus
The Young’s modulus was analyzed using the Hertz-Sneddon model for four-sided pyramidal indenters, which was described in detail by Bilodeau and co-workers [62]. Here, the force is defined as in Eq. 4:
where
Oscillatory Microrheology
During the AFM oscillatory microrheology measures, the oscillation frequency of the cantilever was varied. In contrast to both of the methods above, oscillatory microrheology determines the glassy transition frequency of cells. By indenting a cell with a cantilever and applying a sinusoidal excitation signal to the Piezo motors, in-phase and an out-of-phase deflection signals of the cantilever are detected [17, 18], which are used to determine the complex shear modulus, as:
where G′ is the storage modulus, G″ is the loss modulus, i is the complex unit, ω is the angular frequency, ν is the Poisson’s ratio (assumed to be 0.5), δ0 is the initial indentation, and θ is the half opening angle of the indenter. F(ω) and δ(ω) are the Fourier transforms of the force F and the indentation δ. Eq. 5 can be derived from Hertz-Sneddon contact mechanics for a four-sided pyramidal indenter, as proposed by Alcaraz et al. [17] and corrected by the hydrodynamic drag coefficient, measured as proposed in [16].
In these measurements, the cantilever was oscillated with an amplitude of 15 nm. The frequency was varied from 1 to 300 Hz in five approximately logarithmic steps (as 1, 3, 10, 30, 100, 300 Hz). Before each modulation, the contact force was kept constant at 400 pN for 0.5 s without any modulation. Finally, the cantilever was retracted to its initial position.
Creep Compliance
To characterize the viscoelastic properties of cells, the cell creep behavior can be investigated with the force clamp method, as described by Hecht et al. [14]. After reaching the setpoint force, the cantilever maintains a constant force for a specified time, here chosen to be 1 s, which results in increasing indentation. Subsequently, the cantilever was retracted to its initial position.
The experimental data were analyzed as described previously [14]. Briefly, the analysis assumes that the cell behaves as a power-law material with creep compliance according to Eq. 2. The force history
where FClamp is the clamp force, tC is the time until the tip first makes contact with the sample, ΔtA is the duration of the force increase, and a is the shape parameter, as a free parameter. The measured indentation was then fit with:
where
The modulus scaling parameter from the creep compliance and the shear modulus scaling parameter from oscillatory microrheology are related, as indicated by [33], and according to:
which simplifies to
Stress Relaxation
Stress relaxation is a method to characterize the viscoelastic properties. As soon as the cantilever reaches the setpoint force, the height of the cantilever is kept constant for 15 s, while the relaxation of the force is measured. Finally, the cantilever retracts to its initial position. The results are to a great extent independent of the AFM feedback-loop [66]. The elastic-viscoelastic-correspondence principle leads to the following expression for the overall tension σ of a shell-like structure with in-plane viscoelasticity:
where α is the relative area change, T0 is the prestress, and
where R is the initial radius of the cell when in suspension, g(ξ) is approximated with polynomials.
Statistical Analysis and Data Distribution
Two-sample student’s t-tests were used to find significant changes in the fitting parameters after treating the cells with physiological perturbers. To determine whether linear correlations were detectable, the Pearson correlation coefficients (Pearson R) were calculated for every pair of AFM parameters (Figure 5).
As the Young’s modulus, E0, T0, KA, and G0 are log-normally distributed (see Supplementary Table S5 and [14, 20, 67]) as depicted by the shape of all of the relevant violin plots, the Pearson correlation coefficients were calculated for the logarithms of these parameters (Figure 5). Nonetheless, and of note, a direct (nonlogarithmic) comparison only minimally altered the Pearson R values (data not shown).
Data Availability Statement
The original contributions presented in the study are included in the article/Supplementary Material, further inquiries can be directed to the corresponding authors.
Author Contributions
DF, ET, and FL designed the study; DF and FL supervised the study. DF, CA, MP, and YB performed experiments; DF performed, JR and TS helped with creep analysis. AJ provided analyzing software for stress relaxation. JR, AJ, KK, and AO helped with fruitful discussions; DF and AO wrote the manuscript; DF, TS, JR, AJ, AO, and FL revised the manuscript.
Funding
DFG, SFB 1027: The Collaborative Research Centre SFB 1027 at the Saarland University in Saarbrücken and Homburg is an interdisciplinary research team that aims to achieve a quantitative understanding of the physical mechanisms at work when biological matter self-organises into complex structures. Such self-organisation allows biological systems to perform dynamic functions including cell migration and polarisation, cell-cell adherence and synaptic transmission, biofilm formation and tissue growth. DFG, SPP1782: Epithelial intercellular junctions as dynamic hubs to integrate forces, signals and cell behavior. Saarland university provides funding for open access publishing.
Conflict of Interest
The authors declare that the research was conducted in the absence of any commercial or financial relationships that could be construed as a potential conflict of interest.
Publisher’s Note
All claims expressed in this article are solely those of the authors and do not necessarily represent those of their affiliated organizations, or those of the publisher, the editors and the reviewers. Any product that may be evaluated in this article, or claim that may be made by its manufacturer, is not guaranteed or endorsed by the publisher.
Acknowledgments
The authors thank Claude Verdier (Université Grenoble Alpes, Grenoble, France) and Elisabeth Fischer-Friedrich (Technische Universität Dresden, Dresden, Germany) for the fruitful discussions that led to the presented study. For financial support, the authors thank the Leibniz Institute for New Materials (INM, Saarbrücken, Germany), Saarland University (Saarbrücken, Germany) and Deutsche Forschungsgemeinschaft DFG in the framework of the CRC 1027, SPP1782.
Supplementary Material
The Supplementary Material for this article can be found online at: https://www.frontiersin.org/articles/10.3389/fphy.2021.711860/full#supplementary-material
References
1. Viji Babu PK, Rianna C, Belge G, Mirastschijski U, Radmacher M. Mechanical and Migratory Properties of normal, Scar, and Dupuytren's Fibroblasts. J Mol Recognit (2018) 31:e2719. doi:10.1002/jmr.2719
2. Barriga EH, Mayor R. Adjustable Viscoelasticity Allows for Efficient Collective Cell Migration. Semin Cel Dev Biol (2019) 93:55–68. doi:10.1016/j.semcdb.2018.05.027
3. Ekpenyong AE, Whyte G, Chalut K, Pagliara S, Lautenschläger F, Fiddler C, et al. Viscoelastic Properties of Differentiating Blood Cells Are Fate- and Function-dependent. PLoS One (2012) 7:e45237. doi:10.1371/journal.pone.0045237
4. Chen YQ, Kuo CY, Wei MT, Wu K, Su PT, Huang CS, et al. Intracellular Viscoelasticity of HeLa Cells during Cell Division Studied by Video Particle-Tracking Microrheology. J Biomed Opt (2014) 19:011008. doi:10.1117/1.JBO.19.1.011008
5. Chen M, Zeng J, Ruan W, Zhang Z, Wang Y, Xie S, et al. Examination of the Relationship between Viscoelastic Properties and the Invasion of Ovarian Cancer Cells by Atomic Force Microscopy. Beilstein J Nanotechnol (2020) 11:568–82. doi:10.3762/bjnano.11.45
6. Chim YH, Mason LM, Rath N, Olson MF, Tassieri M, Yin H. A One-step Procedure to Probe the Viscoelastic Properties of Cells by Atomic Force Microscopy. Sci Rep (2018) 8:14462. doi:10.1038/s41598-018-32704-8
7. Pullarkat P, Fernández P, Ott A. Rheological Properties of the Eukaryotic Cell Cytoskeleton. Phys Rep (2007) 449:29–53. doi:10.1016/j.physrep.2007.03.002
8. Wei M-T, Zaorski A, Yalcin HC, Wang J, Hallow M, Ghadiali SN, et al. A Comparative Study of Living Cell Micromechanical Properties by Oscillatory Optical Tweezers. Opt Express (2008) 16:8594–603. doi:10.1364/oe.16.008594
9. Chan CJ, Ekpenyong AE, Golfier S, Li W, Chalut KJ, Otto O, et al. Myosin II Activity Softens Cells in Suspension. Biophysical J (2015) 108:1856–69. doi:10.1016/j.bpj.2015.03.009
10. Puig-de-Morales M, Grabulosa M, Alcaraz J, Mullol J, Maksym GN, Fredberg JJ, et al. Measurement of Cell Microrheology by Magnetic Twisting Cytometry with Frequency Domain Demodulation. J Appl Physiol (2001) 91:1152–9. doi:10.1152/jappl.2001.91.3.1152
11. Puig-de-Morales-Marinkovic M, Turner KT, Butler JP, Fredberg JJ, Suresh S. Viscoelasticity of the Human Red Blood Cell. Am J Physiology-Cell Physiol (2007) 293:C597–C605. doi:10.1152/ajpcell.00562.2006
12. Thoumine O, Ott A. Time Scale Dependent Viscoelastic and Contractile Regimes in Fibroblasts Probed by Microplate Manipulation. J Cel Sci (1997) 110:2109–16. doi:10.1242/jcs.110.17.2109
13. Rigato A, Rico F, Eghiaian F, Piel M, Scheuring S. Atomic Force Microscopy Mechanical Mapping of Micropatterned Cells Shows Adhesion Geometry-dependent Mechanical Response on Local and Global Scales. ACS Nano (2015) 9:5846–56. doi:10.1021/acsnano.5b00430
14. Hecht FM, Rheinlaender J, Schierbaum N, Goldmann WH, Fabry B, Schäffer TE. Imaging Viscoelastic Properties of Live Cells by AFM: Power-Law Rheology on the Nanoscale. Soft Matter (2015) 11:4584–91. doi:10.1039/c4sm02718c
15. Abidine Y, Laurent VM, Michel R, Duperray A, Verdier C. Local Mechanical Properties of Bladder Cancer Cells Measured by AFM as a Signature of Metastatic Potential. The Eur Phys J Plus (2015) 130. doi:10.1140/epjp/i2015-15202-6
16. Alcaraz J, Buscemi L, Puig-de-Morales M, Colchero J, Baró A, Navajas D. Correction of Microrheological Measurements of Soft Samples with Atomic Force Microscopy for the Hydrodynamic Drag on the Cantilever. Langmuir (2002) 18:716–21. doi:10.1021/la0110850
17. Alcaraz J, Buscemi L, Grabulosa M, Trepat X, Fabry B, Farré R, et al. Microrheology of Human Lung Epithelial Cells Measured by Atomic Force Microscopy. Biophysical J (2003) 84:2071–9. doi:10.1016/s0006-3495(03)75014-0
18. Rother J, Nöding H, Mey I, Janshoff A. Atomic Force Microscopy-Based Microrheology Reveals Significant Differences in the Viscoelastic Response between Malign and Benign Cell Lines. Open Biol (2014) 4:140046. doi:10.1098/rsob.140046
19. Pietuch A, Janshoff A. Mechanics of Spreading Cells Probed by Atomic Force Microscopy. Open Biol (2013) 3:130084. doi:10.1098/rsob.130084
20. Cordes A, Witt H, Gallemí-Pérez A, Brückner B, Grimm F, Vache M, et al. Prestress and Area Compressibility of Actin Cortices Determine the Viscoelastic Response of Living Cells. Phys Rev Lett (2020) 125:068101. doi:10.1103/PhysRevLett.125.068101
21. Schierbaum N, Rheinlaender J, Schäffer TE. Combined Atomic Force Microscopy (AFM) and Traction Force Microscopy (TFM) Reveals a Correlation between Viscoelastic Material Properties and Contractile Prestress of Living Cells. Soft Matter (2019) 15:1721–9. doi:10.1039/c8sm01585f
22. Wu P-H, Aroush DR-B, Asnacios A, Chen W-C, Dokukin ME, Doss BL, et al. A Comparison of Methods to Assess Cell Mechanical Properties. Nat Methods (2018) 15:491–8. doi:10.1038/s41592-018-0015-1
23. Sander M, Dobicki H, Ott A. Large Amplitude Oscillatory Shear Rheology of Living Fibroblasts: Path-dependent Steady States. Biophysical J (2017) 113:1561–73. doi:10.1016/j.bpj.2017.07.032
24. Hoffman BD, Massiera G, Van Citters KM, Crocker JC. The Consensus Mechanics of Cultured Mammalian Cells. Proc Natl Acad Sci (2006) 103:10259–64. doi:10.1073/pnas.0510348103
25. Fernández P, Ott A. Single Cell Mechanics: Stress Stiffening and Kinematic Hardening. Phys Rev Lett (2008) 100:238102. doi:10.1103/physrevlett.100.238102
26. Gautier HOB, Thompson AJ, Achouri S, Koser DE, Holtzmann K, Moeendarbary E, et al. Atomic Force Microscopy-Based Force Measurements on Animal Cells and Tissues. Methods Cel Biol (2015) 125:211–35. doi:10.1016/bs.mcb.2014.10.005
27. Stewart MP, Hodel AW, Spielhofer A, Cattin CJ, Müller DJ, Helenius J. Wedged AFM-Cantilevers for Parallel Plate Cell Mechanics. Methods (2013) 60:186–94. doi:10.1016/j.ymeth.2013.02.015
28. Lekka M. Discrimination between Normal and Cancerous Cells Using AFM. BioNanoSci. (2016) 6:65–80. doi:10.1007/s12668-016-0191-3
29. Sneddon IN. The Relation between Load and Penetration in the Axisymmetric Boussinesq Problem for a Punch of Arbitrary Profile. Int J Eng Sci (1965) 3:47–57. doi:10.1016/0020-7225(65)90019-4
30. Krieg M, Fläschner G, Alsteens D, Gaub BM, Roos WH, Wuite GJL, et al. Atomic Force Microscopy-Based Mechanobiology. Nat Rev Phys (2018) 1:41–57. doi:10.1038/s42254-018-0001-7
31. Braunsmann C, Proksch R, Revenko I, Schäffer TE. Creep Compliance Mapping by Atomic Force Microscopy. Polymer (2014) 55:219–25. doi:10.1016/j.polymer.2013.11.029
32. Ketene AN, Schmelz EM, Roberts PC, Agah M. The Effects of Cancer Progression on the Viscoelasticity of Ovarian Cell Cytoskeleton Structures. Nanomedicine: Nanotechnology, Biol Med (2012) 8:93–102. doi:10.1016/j.nano.2011.05.012
33. Takahashi R, Okajima T. Comparison between Power-Law Rheological Parameters of Living Cells in Frequency and Time Domains Measured by Atomic Force Microscopy. Jpn J Appl Phys (2016) 55:08NB22. doi:10.7567/jjap.55.08nb22
34. Fabry B, Maksym GN, Butler JP, Glogauer M, Navajas D, Fredberg JJ. Scaling the Microrheology of Living Cells. Phys Rev Lett (2001) 87:148102. doi:10.1103/physrevlett.87.148102
35. Kovács M, Tóth J, Hetényi C, Málnási-Csizmadia A, Sellers JR. Mechanism of Blebbistatin Inhibition of Myosin II. J Biol Chem (2004) 279:35557–63. doi:10.1074/jbc.m405319200
36. Fabian L, Troscianczuk J, Forer A. Calyculin A, an Enhancer of Myosin, Speeds up Anaphase Chromosome Movement. Cell Chromosome (2007) 6:1. doi:10.1186/1475-9268-6-1
37. Riento K, Ridley AJ. Rocks: Multifunctional Kinases in Cell Behaviour. Nat Rev Mol Cel Biol (2003) 4:446–56. doi:10.1038/nrm1128
38. Hetrick B, Han MS, Helgeson LA, Nolen BJ. Small Molecules CK-666 and CK-869 Inhibit Actin-Related Protein 2/3 Complex by Blocking an Activating Conformational Change. Chem Biol (2013) 20:701–12. doi:10.1016/j.chembiol.2013.03.019
39. Isogai T, van der Kammen R, Innocenti M. SMIFH2 Has Effects on Formins and P53 that Perturb the Cell Cytoskeleton. Sci Rep (2015) 5:9802. doi:10.1038/srep09802
40. Coué M, Brenner SL, Spector I, Korn ED. Inhibition of Actin Polymerization by Latrunculin A. FEBS Lett (1987) 213:316–8. doi:10.1016/0014-5793(87)81513-2
41. Lomakin AJ, Cattin CJ, Cuvelier D, Alraies Z, Molina M, Nader GPF, et al. The Nucleus Acts as a Ruler Tailoring Cell Responses to Spatial Constraints. Science (2020) 370:370. doi:10.1126/science.aba2894
42. Stamenovic D. Chromium Supplements Could Benefit Patients with Type 2 Diabetes. Nat Rev Endocrinol (2006) 2:597–8. doi:10.1038/ncpendmet0311
43. Kollmannsberger P, Mierke CT, Fabry B. Nonlinear Viscoelasticity of Adherent Cells Is Controlled by Cytoskeletal Tension. Soft Matter (2011) 7:3127–32. doi:10.1039/c0sm00833h
44. Rheinlaender J, Wirbel H, Schäffer TE. Spatial Correlation of Cell Stiffness and Traction Forces in Cancer Cells Measured with Combined SICM and TFM. RSC Adv (2021) 11:13951–6. doi:10.1039/d1ra01277k
45. Fernández P, Pullarkat PA, Ott A. A Master Relation Defines the Nonlinear Viscoelasticity of Single Fibroblasts. Biophysical J (2006) 90:3796–805. doi:10.1529/biophysj.105.072215
46. Koenderink GH, Dogic Z, Nakamura F, Bendix PM, MacKintosh FC, Hartwig JH, et al. An Active Biopolymer Network Controlled by Molecular Motors. Proc Natl Acad Sci (2009) 106:15192–7. doi:10.1073/pnas.0903974106
47. Bonakdar N, Gerum R, Kuhn M, Spörrer M, Lippert A, Schneider W, et al. Mechanical Plasticity of Cells. Nat Mater (2016) 15:1090–4. doi:10.1038/nmat4689
48. Stamenović D, Rosenblatt N, Montoya-Zavala M, Matthews BD, Hu S, Suki B, et al. Rheological Behavior of Living Cells Is Timescale-dependent. Biophys J (2007) 93:L39–41. doi:10.1529/biophysj.107.116582
49. Haghparast SMA, Kihara T, Shimizu Y, Yuba S, Miyake J. Actin-based Biomechanical Features of Suspended normal and Cancer Cells. J Biosci Bioeng (2013) 116:380–5. doi:10.1016/j.jbiosc.2013.03.003
50. Fritzsche M, Erlenkämper C, Moeendarbary E, Charras G, Kruse K. Actin Kinetics Shapes Cortical Network Structure and Mechanics. Sci Adv (2016) 2:e1501337. doi:10.1126/sciadv.1501337
51. Nguyen AV, Trompetto B, Tan XHM, Scott MB, Hu KH-h., Deeds E, et al. Differential Contributions of Actin and Myosin to the Physical Phenotypes and Invasion of Pancreatic Cancer Cells. Cel Mol Bioeng (2020) 13:27–44. doi:10.1007/s12195-019-00603-1
52. Nguyen A, Brandt M, Muenker TM, Betz T. Multi-oscillation Microrheology via Acoustic Force Spectroscopy Enables Frequency-dependent Measurements on Endothelial Cells at High-Throughput. Lab Chip (2021) 21:1929–47. doi:10.1039/d0lc01135e
53. Rheinlaender J, Schäffer TE. Mapping the Creep Compliance of Living Cells with Scanning Ion Conductance Microscopy Reveals a Subcellular Correlation between Stiffness and Fluidity. Nanoscale (2019) 11:6982–9. doi:10.1039/c8nr09428d
54. Benaglia S, Amo CA, Garcia R. Fast, Quantitative and High Resolution Mapping of Viscoelastic Properties with Bimodal AFM. Nanoscale (2019) 11:15289–97. doi:10.1039/c9nr04396a
55. Garcia PD, Guerrero CR, Garcia R. Nanorheology of Living Cells Measured by AFM-Based Force-Distance Curves. Nanoscale (2020) 12:9133–43. doi:10.1039/c9nr10316c
56. Kurzawa L, Vianay B, Senger F, Vignaud T, Blanchoin L, Théry M. Dissipation of Contractile Forces: the Missing Piece in Cell Mechanics. MBoC (2017) 28:1825–32. doi:10.1091/mbc.e16-09-0672
57. Rheinlaender J, Dimitracopoulos A, Wallmeyer B, Kronenberg NM, Chalut KJ, Gather MC, et al. Cortical Cell Stiffness Is Independent of Substrate Mechanics. Nat Mater (2020) 19:1019–25. doi:10.1038/s41563-020-0684-x
58. Vignaud T, Copos C, Leterrier C, Toro-Nahuelpan M, Tseng Q, Mahamid J, et al. Stress Fibres Are Embedded in a Contractile Cortical Network. Nat Mater (2021) 20:410–20. doi:10.1038/s41563-020-00825-z
59. Martens JC, Radmacher M. Softening of the Actin Cytoskeleton by Inhibition of Myosin II. Pflugers Arch - Eur J Physiol (2008) 456:95–100. doi:10.1007/s00424-007-0419-8
60. Hutter JL, Bechhoefer J. Calibration of Atomic‐force Microscope Tips. Rev Scientific Instr (1993) 64:1868–73. doi:10.1063/1.1143970
61. Bonfanti A, Kaplan JL, Charras G, Kabla A. Fractional Viscoelastic Models for Power-Law Materials. Soft Matter (2020) 16:6002–20. doi:10.1039/d0sm00354a
63. Radmacher M, Fritz M, Kacher CM, Cleveland JP, Hansma PK. Measuring the Viscoelastic Properties of Human Platelets with the Atomic Force Microscope. Biophysical J (1996) 70:556–67. doi:10.1016/s0006-3495(96)79602-9
64. Harris AR, Charras GT. Experimental Validation of Atomic Force Microscopy-Based Cell Elasticity Measurements. Nanotechnology (2011) 22:345102. doi:10.1088/0957-4484/22/34/345102
65. Guz N, Dokukin M, Kalaparthi V, Sokolov I. If Cell Mechanics Can Be Described by Elastic Modulus: Study of Different Models and Probes Used in Indentation Experiments. Biophysical J (2014) 107:564–75. doi:10.1016/j.bpj.2014.06.033
66. Efremov YM, Okajima T, Raman A. Measuring Viscoelasticity of Soft Biological Samples Using Atomic Force Microscopy. Soft Matter (2020) 16:64–81. doi:10.1039/c9sm01020c
Keywords: cell mechanics, atomic force microscopy, cell rheology, power-law, microrheology, creep compliance, stress relaxation
Citation: Flormann D, Anton C, Pohland M, Bautz Y, Kaub K, Terriac E, Schäffer T, Rheinlaender J, Janshoff A, Ott A and Lautenschläger F (2021) Oscillatory Microrheology, Creep Compliance and Stress Relaxation of Biological Cells Reveal Strong Correlations as Probed by Atomic Force Microscopy. Front. Phys. 9:711860. doi: 10.3389/fphy.2021.711860
Received: 19 May 2021; Accepted: 09 August 2021;
Published: 23 August 2021.
Edited by:
Ivana Dusan Pajic-Lijakovic, University of Belgrade, SerbiaReviewed by:
Bruno Goud, Centre National de la Recherche Scientifique (CNRS), FranceAlfred Nguyen, University of Münster, Germany
Copyright © 2021 Flormann, Anton, Pohland, Bautz, Kaub, Terriac, Schäffer, Rheinlaender, Janshoff, Ott and Lautenschläger. This is an open-access article distributed under the terms of the Creative Commons Attribution License (CC BY). The use, distribution or reproduction in other forums is permitted, provided the original author(s) and the copyright owner(s) are credited and that the original publication in this journal is cited, in accordance with accepted academic practice. No use, distribution or reproduction is permitted which does not comply with these terms.
*Correspondence: A. Ott, albrecht.ott@physik.uni-saarland.de; F. Lautenschläger, f.lautenschlaeger@physik.uni-saarland.de
†These authors have contributed equally to this work