The PENELOPE Physics Models and Transport Mechanics. Implementation into Geant4
- 1SLAC National Accelerator Laboratory, Menlo Park, CA, United States
- 2Dep. de Física Atómica, Molecular y Nuclear, Universidad de Sevilla, Sevilla, Spain
- 3I3M Instituto de Instrumentación para Imagen Molecular, CSIC-Universitat Politècnica de València, València, Spain
- 4Dep. Física Teòrica and IFIC, Universitat de València-CSIC, Burjassot, Spain
- 5Facultat de Física (FQA and ICC), Universitat de Barcelona, Barcelona, Spain
A translation of the penelope physics subroutines to C++, designed as an extension of the Geant4 toolkit, is presented. The Fortran code system penelope performs Monte Carlo simulation of coupled electron-photon transport in arbitrary materials for a wide energy range, nominally from 50 eV up to 1 GeV. Penelope implements the most reliable interaction models that are currently available, limited only by the required generality of the code. In addition, the transport of electrons and positrons is simulated by means of an elaborate class II scheme in which hard interactions (involving deflection angles or energy transfers larger than pre-defined cutoffs) are simulated from the associated restricted differential cross sections. After a brief description of the interaction models adopted for photons and electrons/positrons, we describe the details of the class-II algorithm used for tracking electrons and positrons. The C++ classes are adapted to the specific code structure of Geant4. They provide a complete description of the interactions and transport mechanics of electrons/positrons and photons in arbitrary materials, which can be activated from the G4ProcessManager to produce simulation results equivalent to those from the original penelope programs. The combined code, named PenG4, benefits from the multi-threading capabilities and advanced geometry and statistical tools of Geant4.
1 Introduction
Monte Carlo simulation has become the tool of choice for describing the transport of radiation through matter. The general-purpose code system penelope1 [1, 2] provides a reliable description of the coupled transport of electrons and photons in a wide energy range, nominally, from 50 eV up to 1 GeV, which are the lower and upper limits of the interval covered by the interaction database. However, the approximations underlying the interaction models and the tracking algorithm are expected to be valid only for energies larger than about 1 keV. Therefore, the results from simulations of particles with energies less than this value should be considered as semi-quantitative. The code has been used in a variety of applications, including dosimetry, radiation metrology, radiotherapy, detector characterization, electron microscopy and microanalysis, and x-ray fluorescence. After more than 25 years of development guided by user needs and physics improvements, penelope has become a robust and versatile simulation tool with unique capabilities in electron transport. Direct evidence of the reliability of the code was given by a series of benchmark comparisons of simulation results with a variety of absolute measurement data from the literature [3].
The penelope code is programmed in Fortran, mostly in Fortran 77 with a few extensions of Fortran 90. The original programs are readable and well documented, with abundance of comments, and are accompanied by a detailed manual [2] where the physics models, particle tracking scheme, and numerical sampling methods are described. However the Fortran programs do not allow running parallel simulations (only a manual process is provided to run independent simulations in different processing units, with a summing program to collect the results in a single set of output files). In addition, the Fortran subroutines are difficult to link to other simulation codes. The C++ code presented here is a strict translation of the original Fortran subroutines, which can be linked to Geant4 [4–6] so as to make the penelope physics available as part of the Geant4 toolkit, and to take advantage of the multi-threading capabilities and advanced geometry and statistical tools of Geant4.
The subroutine package penelope is designed as a generator of random electron-photon showers in material media of infinite extent. In the simulations, all position and direction vectors refer to a fixed orthogonal frame, the laboratory frame, which is implicitly set through the geometry definition. Lengths and energies are given in cm and eV, respectively. Occasionally, directions (unit vectors,
where u, v, w are the Cartesian components (direction cosines) of the vector
The type of particles that are transported is identified by the value of the integer label KPAR ( = 1, electron; 2, photon; 3, positron). Each particle trajectory is simulated from its initial state
The present article is organized as follows. The physics interaction models implemented in penelope are briefly described in Section 2. Section 3 deals with the generation of electron-photon showers. Photons are simulated by means of the conventional detailed (i.e., interaction-by-interaction) method. The tracking of electrons and positrons is performed by means of a flexible class-II (mixed) algorithm, which is tuned by a small number of user-defined simulation parameters. The algorithm is tailored to optimize accuracy (i.e., consistency with detailed simulation) and stability under variations of the simulation parameters. Since the penelope approach has clear advantages in front of the condensed multiple-scattering schemes adopted in most general-purpose Monte Carlo codes, we present a detailed formulation of the class-II algorithm, which is extensible to simulate the transport of charged particles other than electrons and positrons. The C++ version of the penelope classes and their linking to Geant4 are described in Section 4. Sample simulation results are presented in Section 5, where we also verify the consistency of the integration of penelope into Geant4 with the original Fortran programs. Finally, in Section 6 we give a few concluding comments.
2 Interaction Models
The materials where radiation propagates are assumed to be amorphous, homogeneous and isotropic. Penelope describes the relevant interactions of transported particles by means of the corresponding differential cross sections (DCSs). In a typical collision measurement, projectile particles with energy E moving in the direction
where σint(E) is the total cross section,
and pint(E; W, θ, ϕ) is the normalized joint probability density function of the energy transfer and the scattering angles θ and ϕ. Because of the assumed isotropy of the medium, the DCSs are generally independent of the azimuthal angle; the only exceptions are the DCSs for interactions of polarized photons. For simulation purposes, it is convenient to replace the polar angle θ with the variable
which varies from 0 (θ = 0) to 1 (θ = π). Notice that the element of solid angle is dΩ = sin θ dθ dϕ = 2 dμ dϕ. The DCS, per unit energy transfer and per unit deflection is then
The last expression is valid only when scattering is axially symmetric, in which case the azimuthal angle is a random variable uniformly distributed in [0, 2π).
The mean free path between interactions is
where NA = 6.022 141 29 × 1023 g/mol is Avogadro’s number, ρ is the mass density (g/cm3), and Am is the molar mass (g/mol) of the material. The inverse mean free path
The interaction models implemented in penelope combine results from first-principles calculations, semi-empirical formulas and evaluated databases. The DCS of each interaction mechanism is either defined numerically or given by an analytical formula with parameters fitted to relevant theoretical or experimental information. Penelope uses the most accurate physics models available that are compatible with the intended generality of the code.
Most of the physics models pertain to interactions with free atoms or with single-element materials. In the case of a compound (or mixture), the molecular DCS is obtained by means of the independent-atom approximation (i.e., as the sum of DCSs of the atoms in a molecule). This approximation is expected to be valid whenever the de Broglie wave length of the radiation is much shorter than typical inter-atomic distances in the material. Inelastic collisions of charged particles are peculiar in that they are dominated by excitations of weakly bound electrons and, hence, they are strongly affected by the state of aggregation of the material. The DCS for inelastic collisions is obtained from an analytical model with parameters determined by the mass density ρ and the mean excitation energy I of the material, the central parameter in the Bethe stopping power formula [7, 8]. Empirical I values of materials [9] are used, so as to account approximately for the aggregation state of the material.
The penelope code system includes an extensive database of atomic DCSs and total (integrated) cross sections, for all elements in the periodic system, from hydrogen (Z = 1) to einsteinium (Z = 99), covering the energy range from 50 eV to 1 GeV. In the following Subsections we give a brief description of the interaction models adopted for photons and electrons/positrons. Further details on the physics models, and a thorough description of sampling methods for the different interaction mechanisms, are given in the penelope manual [2]. References to the underlying theory and calculations can also be found in the review article by Salvat and Fernández-Varea [10].
2.1 Photon Interactions
The considered interactions of photons and the corresponding physics models are:
• Rayleigh scattering (Ra). The DCS for the coherent scattering of unpolarized photons by atoms is a function of the polar angle θ of the direction of the scattered photon. It is expressed as the product of the Thomson DCS (which describes the scattering of electromagnetic waves by free electrons at rest) and the squared modulus of the atomic form factor plus angle-independent anomalous scattering factors [11]. The atomic form factors and the total (integrated) atomic cross sections are taken from the LLNL Evaluated Photon Data Library [12]. The direction of the scattered photon is sampled from the DCS in the form-factor approximation, i.e., disregarding the anomalous scattering factors.
• Compton scattering (Co). The atomic DCS for the incoherent scattering of photons by atoms depends on the direction and energy E′ of the scattered photon. It is calculated from the relativistic impulse approximation with analytical one-electron Compton profiles [13] that approach the numerical Hartree-Fock Compton profiles given by Biggs et al. [14]. This approximation accounts for the effect of electron binding and Doppler broadening in a consistent way. The total atomic cross section is obtained as the sum of contributions of the various electron subshells. In the case of conductors, conduction electrons are assumed to behave as a degenerate electron gas having the electron density of the conduction band. The DCS for Compton scattering is a function of the energy transfer W = E − E′ and the polar angle θ of the direction of the scattered photon.
• Photoelectric absorption (ph). The photoelectric effect is described by using total atomic cross sections, and partial cross sections for the K shell and L, M, and N subshells of neutral atoms, which were calculated by using conventional first-order perturbation theory [15]. In these calculations (as well as in those of impact ionization by electron and positron impact, see below), atomic wave functions are represented as single Slater determinants built with one-electron orbitals that are solutions of the Dirac equation for the Dirac-Hartree-Fock-Slater self-consistent potential [16, 17]. The cross sections in the database account only for ionization, i.e., contributions from excitations of atoms to discrete bound energy levels are disregarded. Additionally, the photon energy was shifted slightly so that the shell ionization thresholds coincide with the electron binding energies recommended by Carlson [18], which were obtained from a combination of experimental data and theoretical calculations. Our cross sections practically coincide with those in the LLNL Evaluated Photon Data Library [12], although they are tabulated in a denser grid of energies to accurately describe the structure of the cross section near absorption edges. A screening normalization correction, initially proposed by Pratt [19] is included. The initial direction of photoelectrons is sampled from Sauter’s K-shell hydrogenic DCS [20], which is a function of the polar angle θ of the direction of the emitted photoelectron.
• Electron-positron pair production (pp). The total atomic cross sections for pair (and triplet) production were obtained from the xcom program of Berger et al. [21]. The initial kinetic energies of the produced particles are sampled from the Bethe-Heitler DCS for pair production, with exponential screening and Coulomb correction, empirically modified to improve its reliability for energies near the pair-production threshold. This DCS is a function of the kinetic energy of the electron, E−; the energy of the positron is determined by energy conservation.
The total cross section for each of these processes is obtained by integration of its DCS,
over the corresponding variables. The total molecular cross section, σtot, is the sum of contributions,
The length s of each photon free flight is sampled from the familiar exponential distribution
where
is the attenuation coefficient (i.e., the inverse mean free path) for photons of energy E. Partial and total mass attenuation coefficients, μat/ρ, of carbon and mercury are displayed in Figure 1.
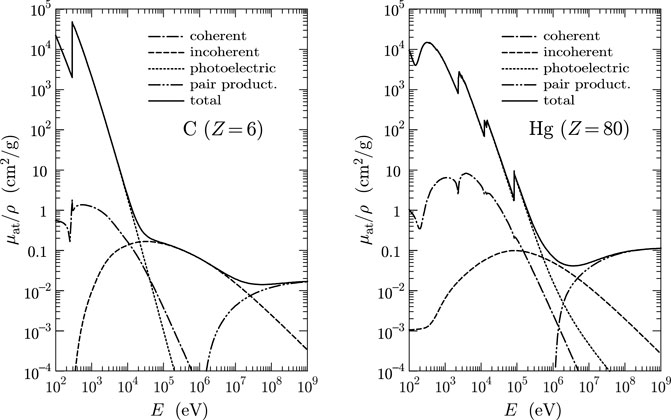
FIGURE 1. Partial and total mass attenuation coefficients of carbon and mercury as functions of the photon energy. Notice the different low-E behavior of the incoherent-scattering contribution,
Penelope can also simulate Rayleigh and Compton scattering of polarized photons, with the state of polarization described by means of the Stokes parameters [2]. The polarization of photons does not alter neither the total cross sections nor the distributions of polar angles (see, e.g., Ref. [2]), but the distribution of azimuthal angles ceases to be uniform. Characteristic x rays and bremsstrahlung photons emitted by electrons or positrons, as well as positron annihilation quanta, are assumed to be unpolarized.
2.2 Electron and Positron Interactions
The interactions of electrons and positrons considered in penelope are:
• Elastic collisions (el). The DCSs for elastic collisions of electrons and positrons were calculated numerically by running the program elsepa [22, 23] which uses the relativistic Dirac partial-wave expansion method for the electrostatic potential of the target atom obtained from Dirac-Fock atomic electron densities [24, 25], with the exchange potential of Furness and McCarthy [26] for electrons. Figure 2 displays DCSs from the elsepa database for elastic scattering of electrons and positrons by carbon and mercury atoms. These plots illustrate the variation of the DCS with the atomic number Z, the charge of the projectile, and the energy E.
• Inelastic collisions (in). Interactions involving electronic excitations of the medium are simulated on the basis of the plane-wave Born approximation with the Sternheimer-Liljequist generalized oscillator strength model [27, 28]. The model is designed to simplify the simulation of inelastic collisions and to facilitate the calculation of the density-effect correction. The excitation spectrum is modeled as a discrete set of delta oscillators. Each oscillator represents excitations of an electron subshell, its strength is set equal to the number of electrons in that subshell and its resonance energy is proportional to the subshell binding energy. The proportionality constant is the same for all subshells, and it is determined from the requirement that the generalized oscillator strength model reproduces the empirical value of the mean excitation energy I recommended in the ICRU Report 37 [9]. This procedure ensures that the stopping powers calculated from this model agree closely with the tabulated values in the ICRU Report 37. To smear out the effect of discrete resonances, the energy loss in distant interactions with bound electrons is sampled from a continuous (triangular) distribution with a mean value equal to the resonance energy of the active subshell.
• Ionization of inner shells by impact of electrons and positrons (si). The K shell, and the L, M, and N subshells that have binding energies larger than about 50 eV are considered as inner atomic electron shells. Because the total cross sections obtained from the Sternheimer-Liljequist generalized oscillator strength model are not sufficiently accurate for describing the ionization of inner shells, penelope uses numerical shell-ionization cross sections calculated by Bote and Salvat [29] by means of the distorted-wave (first) Born approximation with the Dirac-Hartree-Fock-Slater self-consistent potential (see also Ref. [30]), multiplied by an energy-dependent factor that accounts for the density-effect correction. The energy loss and the momentum transfer in ionizing collisions are sampled from the distribution given by the Liljequist-Sternheimer model. The total cross sections of outer subshells are renormalized to keep the value of the stopping power unaltered. This approach yields the correct number of ionizations per unit path length, without altering substantially the modeling of inelastic collisions.
• Bremsstrahlung emission (br). The energy W of the emitted photon is set equal to the energy loss of the projectile. It is sampled from numerical energy-loss spectra obtained from the scaled cross-section tables of Seltzer and Berger [31, 32]. The intrinsic angular distribution of emitted photons is described by an analytical expression —an admixture of two “boosted” dipole distributions— [33] with parameters determined by fitting a set of 910 angular distributions calculated with the program of Poškus [34], which extends the previously available calculation of Kissel et al. [35]. Penelope assumes that elastic collisions account for all angular deflections of the particle trajectory caused by the atomic field and, consequently, that radiative events do not modify the direction of the electron or positron.
• Positron annihilation (an). In the simulation of positron annihilation the target electrons are assumed to be at rest. The process is described by the Heitler DCS [36, 37] for in-flight annihilation with emission of two photons of energies E− and E+, with E− ≤ E+, which add to E + 2mec2, where me is the rest mass of the electron and mec2 ≃ 511 keV its rest energy. The Heitler DCS is a function of the energy E− of the less energetic photon. The directions of the two photons are determined by energy and momentum conservation. When the energy of a positron is less than its absorption energy,
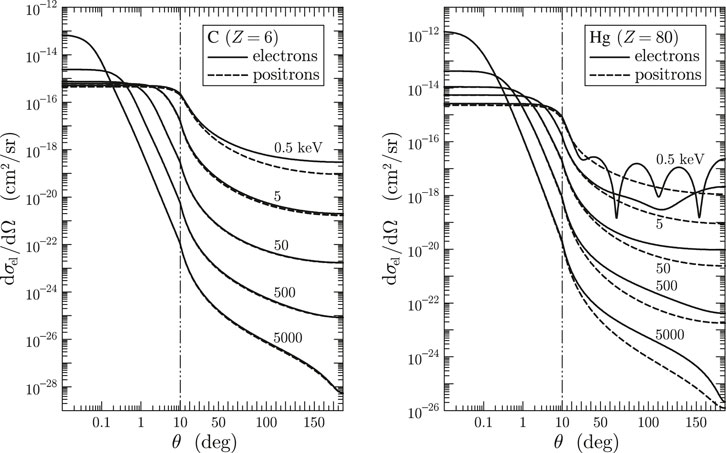
FIGURE 2. DCS for elastic scattering of electrons and positrons by carbon and mercury atoms as a function of the polar deflection angle θ. Notice the change from logarithmic to linear scale at θ = 10 deg.
The DCSs for these interaction mechanisms,
are functions of the angular deflection μ = (1 − cos θ)/2 and/or the energy loss W, or the photon energy E−. The corresponding total cross sections are obtained by integration of these DCSs over the allowed intervals of the relevant variables. The mean free path λ of electrons and positrons is
where
with the annihilation term present only for positrons.
Elastic scattering is characterized by the mean free path,
and the transport mean free paths, λel,ℓ, defined by
where Pℓ( cos θ) are Legendre polynomials with the argument cos θ = 1 − 2μ. The inverse first and second transport mean free paths can be expressed as
and
where the notation ⟨…⟩1 indicates the average value in a single collision.
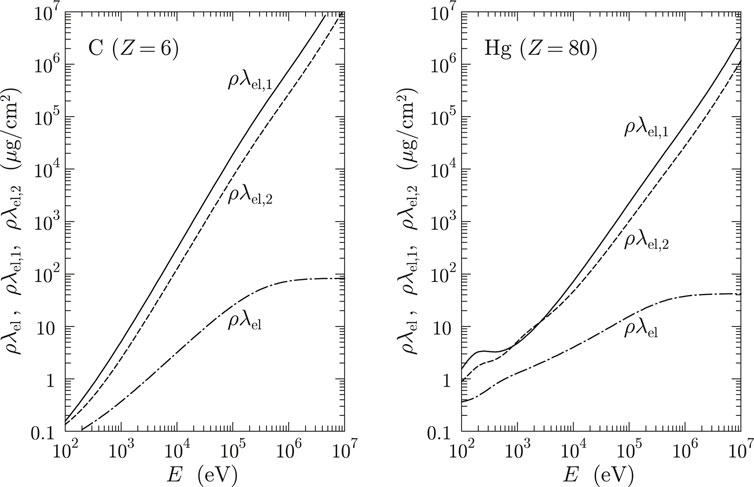
FIGURE 3. Elastic mean free path, λel, and first and second transport mean free paths, λel,1 and λel,2, for electrons scattered in carbon and mercury as functions of the kinetic energy of the projectile.
The mean free path λin between inelastic collisions is
The total cross section for bremsstrahlung emission is infinite because the corresponding DCS diverges as W−1 at W = 0 (see Ref. [10] and references therein).
A fundamental quantity in transport studies is the stopping power S (= average energy loss per unit path length), given by
where the terms in square brackets are the energy-loss DCSs for inelastic collisions and bremsstrahlung emission, respectively. Relatively small energy transfers also occur in elastic collisions, which manifest as the recoil of the target atom or as phonon excitations, and give rise to the so-called nuclear stopping power. Penelope disregards the energy loss in elastic events because the nuclear stopping power is typically four orders of magnitude smaller than S. Another relevant quantity is the energy-straggling parameter ( = increase of the variance of the energy distribution per unit path length) given by
We notice that the contributions from inelastic collisions to the stopping power and to the energy-straggling parameter can be expressed as
respectively, where
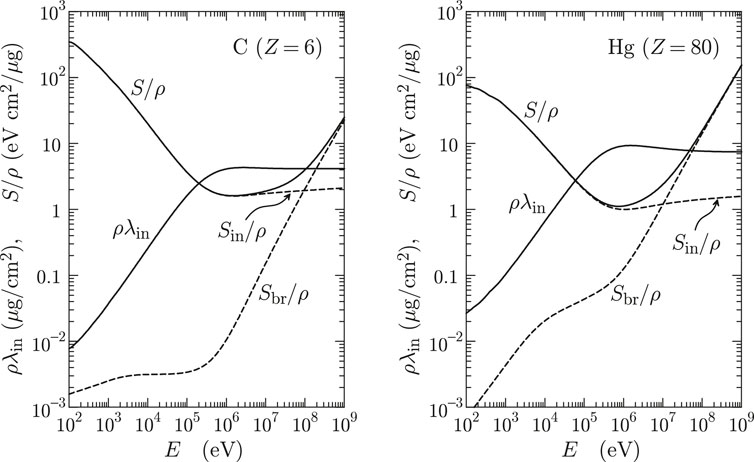
FIGURE 4. Mean free path of inelastic collisions and stopping powers for electrons in carbon and mercury as functions of the kinetic energy E. The plotted quantities are ρλin and S/ρ. The dashed curves represent the contributions from inelastic collisions and from bremsstrahlung emission to the stopping power.
2.3 Atomic Relaxation
Penelope simulates the emission of characteristic x rays and Auger electrons with energies larger than
3 Generation of Random Electron-Photon Showers
A detailed description of the sampling algorithms used to simulate the various interactions from their associated DCSs is given in the penelope manual [2]. Most continuous distributions are sampled numerically by means of the adaptive algorithm RITA (Rational Inverse Transform with Aliasing); Walker’s aliasing method [41] is utilized to sample discrete distributions with large numbers of possible outcomes. The adopted sampling methods are both fast and robust.
The simulation of photons follows the usual detailed procedure, where all interaction events in a photon history are simulated in chronological succession. The physics simulation subroutines set the distance s from the current position r to the next interaction, assuming the medium is infinite, by random sampling from the exponential distribution defined in Eq. 10. The program then propagates the photon the distance s along the ray, i.e., to a position
The simulation of electron and positron histories is more difficult because of the large number of interactions these particles undergo before being brought to rest. On average, an electron looses a few tens of eV at each individual interaction. Therefore, detailed simulation of electrons and positrons is feasible only in situations where the number of interactions is sufficiently small, that is, for energies up to about 50 keV, and for particles with higher energies traveling through thin material foils. To cope with this difficulty, charged particles are usually tracked by using condensed simulation schemes (class-I schemes in the terminology of Berger [42]) which consist in decomposing each particle trajectory into a number of steps (either of fixed or random lengths), and the global effect of all the interactions that occur along each step is described approximately by using multiple scattering theories. Because these theories apply to homogeneous infinite media, a limitation of class-I schemes occurs when a particle is close to a material interface: the step length must then be kept smaller than the distance to the nearest interface, to prevent the particle from entering the next medium. Therefore, in class-I simulations the geometry subroutines must keep control of the proximity of interfaces.
The practical alternative are class-II schemes [42], also called mixed schemes, which take advantage of the fact that the DCSs for interactions of high-energy charged particles are rapidly decreasing functions of the energy loss W and the polar scattering angle θ. Consequently, cutoffs Wc and θc can be set so that the number of “hard” interactions (i.e., interactions with energy loss or polar scattering angle larger than the corresponding cutoffs) that occur along each particle history is small enough to allow their individual simulation by random sampling from the corresponding restricted DCSs. The accumulated angular deflection caused by all soft interactions (with sub-cutoff energy transfers or angular deflections) that occur along a trajectory step between two successive hard interactions can be described by means of a multiple-scattering approach consistent with the DCSs restricted to soft events. The energy loss caused by soft interactions along the step can be obtained from a simple distribution having the exact first and second moments, as calculated from the energy-loss DCS restricted to soft interactions.
Class-II schemes are more accurate than purely condensed simulation because: 1) hard events are simulated exactly from the corresponding restricted DCSs, and 2) multiple scattering approximations have a milder effect when applied to soft interactions only. A further advantage of these schemes is that the tracking algorithm only requires computing intersections of particle rays (straight lines) with interfaces, instead of having to control the distances to the interfaces. In addition, class-II schemes allow verifying the stability of simulation results under variations of the cutoffs, as well as the accuracy of the multiple-scattering approximations adopted for describing the soft interactions. The only disadvantage of class-II schemes is that they require a more elaborate coding of the simulation program, and somewhat larger look-up tables.
Most general-purpose Monte Carlo codes for high-energy radiation transport (e.g., etran [43–45], its3 [46], egs4 [37], egsnrc [47], mcnp [48], Geant4 [4–6], fluka [49], egs5 [50] mcnp6 [51]) simulate charged particles by means of a combination of class-I and class-II schemes. By contrast, penelope [1, 2], and recently the penelope-based PenRed [52], make systematic use of class-II schemes for all interactions of electrons and positrons.
3.1 Simulation of Electron and Positron Trajectories
Penelope describes the transport of electrons and positrons by means of an elaborate class-II scheme, with fixed energy-loss cutoffs and an energy-dependent angular cutoff θc for elastic collisions, which is set internally by the program in terms of two user-defined simulation parameters. Particle trajectories are generated by using the random-hinge method [53], which operates similarly to detailed simulations, i.e., the transported particle is moved in straight “jumps,” and the energy and direction of movement change only through discrete events (hard interactions and hinges). With the appropriate set of DCSs, the method is applicable to any charged particle; class-II simulations of protons with the random-hinge method have been reported by Salvat and Quesada [54, 55].
3.1.1 Interactions With Energy Loss
Electrons and positrons lose energy through inelastic collisions and bremsstrahlung emission. These interactions are classified by the respective cutoff energy-loss values, Wcc and Wcr, which are assumed to be independent of the energy of the projectile. Interactions with energy loss W larger than the corresponding cutoff are considered as hard interactions and are simulated individually by sampling from the corresponding restricted DCSs. The slowing down caused by soft interactions is described by the restricted stopping power,
and the restricted energy straggling parameter,
A difficulty of class-II algorithms arises from the fact that the energy of the particle decreases along the step between two consecutive hard interactions. Because the cutoff energies Wcc and Wcr do not change with E, we can assume that, at least for small fractional energy losses, the DCSs for soft energy-loss events vary linearly with E. Under this assumption we can calculate the first moments of the distribution of the energy loss Ws of a particle with initial energy E0 after traveling a path length s under only the influence of soft events [2]. The mean and variance of this distribution are, respectively,
and
where the factors in curly braces account for the global effect of the energy dependence of the soft energy-loss DCS, within the linear approximation.
In practical simulations, the energy loss Ws due to soft interactions along a path length s is sampled from a distribution, P(Ws), that has the mean and variance of the actual energy-loss distribution, as given by Eqs. 25. When
where
• Case I. If X > 3, the energy loss is sampled from the truncated Gaussian distribution (normalisation is irrelevant here),
where the numerical factor 1.015387 corrects the standard deviation for the effect of the truncation. Notice that the shape of this distribution is very similar to that of the “true” energy-loss distribution.
• Case II. When 31/2 < X < 3, we use the uniform distribution3
with
and
• Case III. Finally, when X < 31/2, the adopted distribution is an admixture of a delta distribution and a uniform distribution,
with
It can be easily verified that these distributions have the required mean and variance. It is also worth noticing that they yield Ws values that are less than
Ws,max is normally much less than the kinetic energy E0 of the transported particle. Energy losses larger than E0 might be generated only when the step length s has a value of the order of the continuous slowing down approximation (CSDA) range, but this never happens in practical simulation. Despite the artificial shapes of the distributions given by Eqs 26, after a moderately large number of short steps, the distribution of the accumulated energy loss has the correct first and second moments and is similar in shape to the “true” distribution for soft interactions only, which is nearly Gaussian. Further improvements of the distribution of soft-energy losses would require considering higher order moments of the energy-loss in single interaction events.
3.1.2 Elastic collisions
Angular deflections of the particle trajectories are mostly caused by elastic collisions with the atoms of the material. To analyze the cumulative effect of multiple interactions, let us consider an electron that starts from the origin of coordinates moving in the direction of the z axis with energy E. Let θm and (x, y, z) denote the polar angle of the direction of motion and the position coordinates of the electron after traveling a path length s. Under the assumption that energy losses are negligible, the multiple-scattering theories of Goudsmit and Saunderson [56] and Lewis [57] provide exact expressions for the angular distribution, p(μm) with μm = (1 − cos θm)/2, which are determined by the so-called transport mean free paths λel,ℓ, Eq. 16. In addition, the Lewis theory for pure elastic scattering gives exact analytical expressions for the average values ⟨ cos θm⟩, ⟨ cos2θm⟩, ⟨z⟩, ⟨z cos θm⟩, ⟨z2⟩, and ⟨x2 + y2⟩. These quantities are completely determined by the values of the transport mean free paths λel,1 and λel,2.
In penelope the cutoff deflection μc, which separates hard and soft elastic collisions, varies with the energy E in a way that ensures that the simulation becomes purely detailed at low energies, where elastic scattering is more intense. The cutoff deflection is determined by two energy-independent user parameters, C1 and C2, which typically should be given small values, between 0 and 0.1. These two parameters are used to fix the mean free path between hard elastic events (i.e., the average step length between consecutive hard elastic collisions), which is defined as
where λel,1 is the first transport mean free path, and S is the stopping power due to both inelastic collisions and bremsstrahlung emission, Eq. 20. The equation
then fixes the cutoff μc as a function of the energy E of the projectile. The average angular deflection of the electron trajectory at the end of a step of length
That is, C1 defines an approximate upper limit for the cumulative average angular deflection along step. On the other hand, the average energy loss along the step is
so that C2 sets a limit to the average fractional energy loss along the step. An increase of C1 or C2 leads to increased values of both the mean free path between hard events,
It should be noted that C1 and C2 act within different energy domains. This is illustrated in Figure 5, where the lengths λel, λel,1 and E/S for electrons in carbon and mercury are represented as functions of the kinetic energy. The mean free path
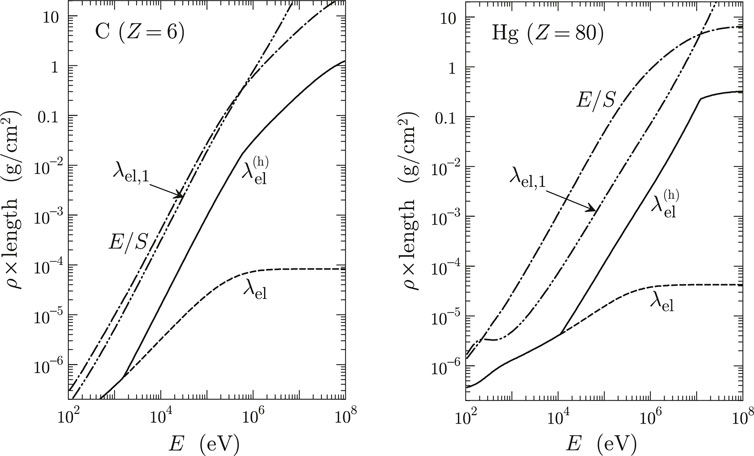
FIGURE 5. Elastic mean free path λel, first transport mean free path λel,1 and E/S(E) for electrons in carbon and mercury. The solid lines represent the mean free path between hard elastic events
The justification for the recipe (28) is that it automatically forces detailed simulation (μc = 0) at low energies, where elastic scattering dominates. In addition, when the energy increases, the portion of elastic collisions that are hard,
Assuming negligible energy losses, the angular distribution produced by the soft elastic collisions along a path length s is [57]
where μs ≡ (1 − cos θs)/2 is the accumulated deflection, and
The DCS for soft elastic events has a discontinuity at μc, which implies that for small path lengths the Legendre series (32) does not converge with a finite number of terms. Therefore, it is impractical to sample the multiple-scattering deflection μs from the distribution Fs(s; μs).
It is important to notice that soft inelastic collisions also cause a small deflection of the projectile. The scattering effect of these interactions is accounted for by considering their contributions to the soft transport mean free paths,
The combined (elastic plus inelastic) soft scattering process is then described by the transport mean free paths
Assuming that the energy loss is small, the first and second moments of the angular deflection after a path length s, under the sole action of soft elastic and soft inelastic interactions, are [2, 57]
and
In practical simulations the angular deflection μs after a path length s is sampled from an artificial distribution, P(μs), which is required to have the same moments,
of orders n = 1 and 2 as the real distribution, Eqs 36, but is otherwise arbitrary. In our programs we use the following
where U(a, b; x) denotes the normalised uniform distribution in the interval (a, b). The parameters obtained by requiring the aforesaid conditions are
and
This simple distribution is flexible enough to reproduce the combinations of first and second moments encountered in the simulations [notice that ⟨μs⟩, Eq. (36a), is always less than 0.5] and allows fast random sampling of the deflection μs.
3.1.3 Random-Hinge Method
As indicated above, hard interactions are simulated individually according to their restricted DCSs. Assuming that the energy loss due to soft collisions is small, the distance s traveled by an electron with initial energy E from its current position r to the next hard collision can be sampled from the familiar exponential distribution, with the total mean free path
That is, random values of s can be generated by using the sampling formula
where ξ is a random number uniformly distributed in (0,1).
Because of the effect of soft interactions, the kinetic energy of the transported particle varies along the step between two hard interactions. The accumulated angular deflection caused by all soft interactions that occur along a trajectory step is simulated as if it were caused by a single artificial event (a hinge), which occurs at a random position within the step. The energy loss along the step and the polar angular deflection at the hinge are sampled from approximate multiple-scattering distributions that have the correct means and variances, Eqs 25, 36, which are calculated beforehand from the DCSs restricted to soft interactions [2]. Unfortunately, the multiple-scattering theories do not provide enough information to determine the spatial distribution and the correlation between the direction and the position of the electron at the end of a step. The only characteristics readily available are the low-order moments given by the theory of Lewis.
The energy loss Ws and the angular deflection μs caused by multiple soft interactions along the step are sampled from artificial distributions, which are required to preserve the moments given by Eqs 25 and 36. Other details of these distributions are irrelevant, provided only that the fractional energy loss, ⟨Ws⟩/E, and the average soft deflection, ⟨μs⟩, in each step are small [1, 2]. A convenient feature of the adopted energy-loss distributions, which will be helpful below, is that they permit energy transfers up to a well defined maximum value Ws,max, Eq. 27, determined by the kinetic energy E of the projectile and the step length s.
In penelope, the angular deflection and the space displacement due to multiple soft collisions along the path length s are described by means of the random-hinge method [53], which operates as follows (Figure 6).
1) First, the program samples the length s of the step to the next hard interaction.
2) The energy loss Ws caused by all soft interactions along the step is sampled from the distribution given by Eqs 26, which has the correct mean and variance, Eqs 25, and approaches the normal distribution for sufficiently long steps.
3) The electron then flies a random distance τ, which is sampled uniformly in the interval (0, s), in the initial direction.
4) The artificial event (hinge) takes place at the end of the flight, where the electron changes its direction of movement. The polar deflection, μs = (1 − cos θs)/2, is sampled from the distribution (38) having the mean and variance evaluated from the DCSs of soft events at an energy E′ = E − (τ/s)Ws. The azimuthal deflection angle ϕs is sampled uniformly in (0, 2π)
5) Finally, the electron flies a distance s − τ in the new direction, to the position of the next hard interaction. The energy at the end of the step is set to E − Ws.
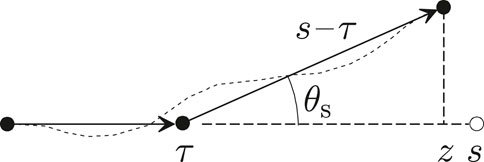
FIGURE 6. Random hinge method. The accumulated angular deflection θs caused by the soft interactions that occur along the step is applied at the hinge.
Thus, each step s is simulated as a sequence of two trajectory segments.
With this tracking algorithm, the code operates as in detailed simulations, i.e., the transported particle moves freely in straight trajectory segments, and the energy and direction of movement change only through discrete events (hard interactions and hinges). This strategy simplifies the simulation of transport in complex material structures consisting of homogeneous bodies with well-defined interfaces. When the electron crosses an interface, we only have to halt it at the crossing point, and resume the simulation in the new material. Because the distance τ to the hinge is distributed uniformly in (0, s), the particle reaches the interface with nearly correct average energy and direction [2]. We point out that this tracking scheme only requires computing intersections of particle rays and interfaces. In the case of a generic quadric surface, this is accomplished by solving a quadratic equation. The easiness of the ray-tracing method is at variance with class-I schemes, which require calculating the distance to the nearest interface at the beginning of each step; in the case of a quadric surface the calculation of that distance involves finding a root of a polynomial of up to 6th degree [58].
In spite of its simplicity, the random-hinge method competes in accuracy and speed with other, more sophisticated transport algorithms [59, 60]. Comparison of results from detailed and class-II simulations of electrons in an infinite medium [2] shows that the randomness of the hinge position leads to correlations between the angular deflection and the displacement that are close to the actual correlations. It is also worth noting that the possible positions of the next hard interaction fill the sphere of radius s centered at r, the beginning of the step.
It is convenient to consider that the energy Ws is lost at a constant rate along the step, i.e., as in the CSDA with an effective stopping power Ssoft = Ws/s. In previous versions of penelope, the energy loss Ws was deposited at the hinge. This yielded an artifact in the depth-dose distribution, which does not occur when the energy loss is distributed uniformly along the step [2]. The use of the CSDA instead of assuming a discrete loss at the hinge also reduces statistical uncertainties in the simulated distributions of fluence with respect to energy. In addition, the CSDA permits accounting for the reduced energy loss in segments that are truncated at interfaces: the energy of the electron at the intersection is E0 − s′Ssoft, where E0 denotes the energy at the beginning of the segment and s′ is the length of the segment before the interface.
A further advantage of considering that soft energy-loss interactions slow down electrons with constant stopping power is that the calculation of flight times is trivial. Consider an electron with initial energy E0, subject to the stopping power Ssoft. The time in which the electron moves along a trajectory segment of length s′ is given by
Inserting the relativistic expression of the velocity,
The integral is elementary and gives
where c is the speed of light in vacuum.
3.1.4 Variation of
Due to soft energy-loss interactions, the energy of the transported particle decreases along the step in an essentially unpredictable way. This implies that the mean free path
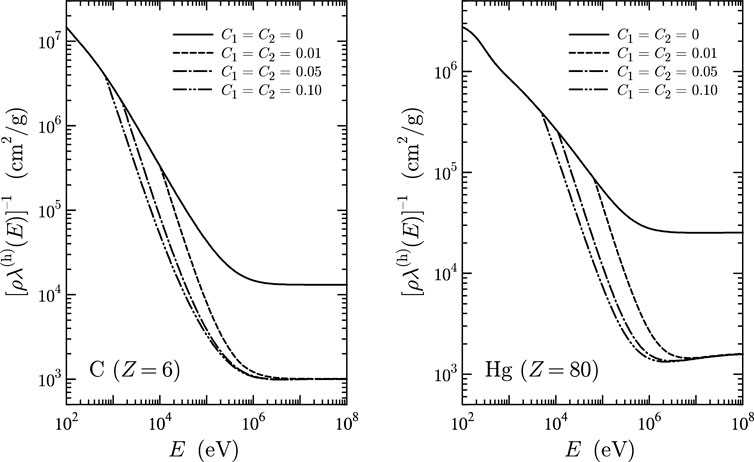
FIGURE 7. Inverse mean free path (interaction probability per unit path length) for hard interactions of electrons in carbon and mercury for the indicated values of the simulation parameters. The plotted curves were calculated with Wcc = Wcr = 100 eV.
To account for the variation of
Because this sum is constant with E, we can sample the step length s from the exponential distribution with the mean free path λT,min. When the sampled step length is larger than smax, the particle is moved a length s = smax and a delta interaction is assumed to occur at the end of the step. The introduction of delta interactions does not affect the reliability of the simulation results because of the Markovian character of the transport process.
Once the step length is determined, the soft energy loss Ws is sampled from the distribution defined by Eqs 26, with the moments given by Eqs 25. The soft angular deflection μs at the hinge is sampled from the distribution (38) with the moments (36) calculated at the energy Ehinge = E0 − τSsoft corresponding to the hinge (within the CSDA). On average, this is equivalent to assuming that the transport mean free paths
3.2 Selecting the Simulation Parameters
The speed and accuracy of the simulation of coupled electron-photon transport is determined by the values of the simulation parameters
The absorption energies
The use of different absorption energies in neighboring bodies may create visible artifacts in the space distribution of absorbed dose. For instance, if the values of
The random-hinge method for electrons and positrons is expected to work well when the accumulated effect (energy loss and angular deflection) of the soft interactions along a step is small. The cutoff energies Wcc and Wcr have a weak influence on the accuracy of the results provided that they are both smaller than the width of the bins used to tally energy distributions. It is worth recalling that the DCSs for inelastic collisions and bremsstrahlung emission decrease rapidly with the energy loss W (roughly as W−2 and W−1, respectively). As a consequence, for particles with energies larger than about 100 keV, when Wcc and Wcr are increased, the simulation speed tends to a saturation value. For these high energies, the gain in speed is small when the cutoffs are made larger than about 5 keV. On the other hand, these cutoff energies have an effect on the energy-straggling distributions, which are faithfully described only when the number of hard interactions is “statistically sufficient.” Therefore, the cutoff energies should not be too large. Our recommendation is to set the cutoff energies equal to one 100th of the typical energy of primary particles, or 5 keV, whichever is the smallest. Note that, for the sake of consistency, Wcc should be smaller than the absorption energy of electrons in the material,
The allowed values of the elastic-scattering parameters C1 and C2 are limited to the interval [0,0.2]. Because the energy dependence of the cross sections for soft interactions and of the hard mean free paths is effectively accounted for (see Section 3.1), these two parameters have a very weak influence on the results. The recommended practice is to set C1 = C2 = 0.05, which is fairly conservative. Before increasing the value of any of these parameters, it is advisable to perform short test simulations to verify that the results remain essentially unaltered when using the augmented parameter value (and that the simulation runs faster; if there is no gain in speed, keep the conservative values).
The parameter smax is the maximum allowed step length. Limiting the step length is necessary to account for the variation of the mean free path for hard events,
It is interesting to observe that when the parameters C1, C2, and Wcc are set to zero, our class-II scheme becomes purely detailed (i.e., nominally exact) simulation of elastic and inelastic collisions. Bremsstrahlung emission cannot be simulated detailedly because its DCS diverges at zero photon energy (and, hence, the total cross section is infinite), although the radiative stopping power is finite. When the input value of Wcr is negative, penelope sets Wcr = 10 eV and disregards the emission of photons with lower energies, thus performing an almost detailed simulation of radiative events. A clear advantage of our class-II scheme is that its accuracy and stability under variations of the user parameters can be numerically verified by simply comparing the simulation results with those of a detailed simulation.
4 C++ Classes and Coupling to Geant4
Linking the penelope physics and tracking subroutines to Geant4 was not trivial because 1) penelope transports electrons and positrons by using a class-II algorithm which operates differently to the tracking method used by Geant4, and 2) penelope builds its interaction models from a material database that is different from the one used by Geant4. To ensure consistency, and to reduce the interference between the two transport modes, the penelope tracking is allowed in a limited energy interval, which by default extends from Emin = 50 eV to Emax = 1 GeV. Electrons, positrons, and photons with energies higher than Emax are followed by Geant4 as ordinary particles. The user defines a threshold energy Ethr, necessarily less than Emax, at which the transported electron, positron or gamma is converted into a penelope-type particle by cloning its state variables, and the remaining part of the history, until its completion, is generated by the penelope classes. To prevent interfering with the Geant4 logic, electrons, positrons, and photons passed to the penelope classes are considered as particles of a special type (denoted as “pe-”, “pe+”, and “pgamma”, respectively) different from the Geant4 “ordinary” particles. In addition, secondary electrons, positrons, and photons released with initial energies less than Ethr are directly tracked by the penelope classes.
The C++ translation of the penelope physics and transport subroutines is organized in two directories: penG4include and penG4src, which store the corresponding header and source files, respectively. The coupling of the two simulation codes is organized as follows:
• The file penG4include/PenelopeDefines.hh includes the definitions of all the constants, global variables and global-scope methods. Similarly, common variables and namespaces are declared in penG4include/common-share.hh.
• The C++ penelope classes are organized into shared and thread-local sets according to the multi-thread design of Geant4. Thus, the penelope methods and data with thread-local scope are declared in penG4include/local.h and defined in *.cpp files contained in the penG4src/localSubs directory, whereas methods and data that are shared over threads are declared in penG4include/share.h and implemented in files named *.cpp and placed in the penG4src/shareSubs/directory.
• The classes PenInterface and PenPhys encapsulate the C++ penelope classes. They constitute the “bridge” between penelope and the classes of the Geant4 application using them.
• The class PenPhys encapsulates the Penelope physics functions that are called during the tracking of particles, and it works with the thread-local classes mentioned above. Its public methods are issued from the PenEMProcess class, which dictates the physics and tracking models that are applied and proposes changes in the state variables of the particle being tracked.
• PenInterface is a singleton class which contains all the methods shared over threads. In the Geant4 application, this class is used 1) to register each material in the DetectorConstruction class with its corresponding transport parameters EABS(1-3), C1, C2, WCC and WCR for tracking of “pe-”, “pe+”, and “pgamma” particles, and 2) to define the energy range (Emin, Emax) where the penelope tracking is applied. By default the code sets Emin = 50 eV and Emax = 1 GeV; these values can be set from the PenelopeEMPhysics constructor as indicated below. In addition, PenInterface is responsible for initializing the penelope classes. The class design also allows the user to create user-interface commands to set the transport parameters for each material.
• The remaining classes of the code interface define the penelope-type particles being tracked by the Geant4 application and the processes modeling their electromagnetic interactions with matter. The code defines three new particle types by using the G4ParticleDefinition constructor, which correspond to electrons, photons, and positrons that are tracked by penelope and clone the static properties (rest mass, charge, etc.) of ordinary Geant4 particles,
• PenElectron for a penelope-type electron, “pe-”,
• PenGamma for a penelope-type photon, “pgamma”,
• PenPositron for a penelope-type positron, “pe+”.
Thus, during the same simulation we may use either G4Electron, G4Gamma and G4Positron and follow particles with ordinary Geant4 electromagnetic physics, or PenElectron, PenGamma and PenPositron for tracking them with the penelope physics and tracking.
As mentioned above, particles with energy E higher than Ethr are tracked by Geant4. When a particle (electron, photon, or positron) reaches a kinetic energy below Ethr, it must be converted to the corresponding penelope-type particle to switch the tracking to penelope. With this purpose, two classes derived from G4VProcess were defined:
• PenEMProcess is the wrapper class for the penelope physics; it is only applicable to penelope-type particles. All the changes of the particle state variables are proposed via the process PostStepDoIt(), i.e., in the same way as for discrete interactions. In addition, the PenInterface singleton is initialized within PenEMProcess::BuildPhysicsTable(), which in multi-thread mode is invoked once the Geant4 execution gets initialized by, for instance, issuing (blank) run/initialize command in a macro file.
• PenPartConvertProcess is the process responsible for converting a Geant4-type particle into the equivalent penelope-type particle once its kinetic energy falls below the threshold energy Ethr. The value of Ethr, which must be PenPartConvertProcess constructor or using the SetThresholdEnergy() method. The class PenEMProcess is derived from G4VDiscreteProcess, it is of type fDecay and is only applicable to particles of types G4Electron, G4Gamma and G4Positron. It works by defining a special “decay” from the Geant4 ordinary particle to its corresponding penelope particle, keeping its dynamic properties (position, energy, direction of momentum, total time of flight…).
Notice that no process is defined to do the inverse conversion, i.e., we assume that once the penelope mode is entered, it remains active until the end of the transported particle history. It is also important to point out that the Geant4 production thresholds do not apply to the penelope physics and tracking.
Finally, a physics constructor named PenelopeEMPhysics derived from the generic G4VPhysicsConstructor, has been written to ease the inclusion of penelope physics into a Geant4 application by using a modular physics list. The value Ethr = 500 keV is assumed by default; it can be modified by passing the desired value as argument of the G4PenelopeEMPhysics constructor. Moreover, Emax can be set within the ConstructProcess() method via the PenInterface singleton. The values Ethr and Emax can also be set by issuing commands from a macro file. The PenelopeEMPhysics constructor registers in the ConstructParticles() method the penelope-type particles (PenElectron, PenGamma, and PenPositron). The ConstructProcess() method has been designed 1) to add PenPartConvertProcess as a discrete process that converts the ordinary Geant4 electrons, photons, and positrons, when their energies fall below Ethr, into penelope-type particles, and 2) to add PenEMProcess as the only discrete process for the penelope-type particles.
In what follows, for the sake of brevity, the combination of Geant4 and the penelope C++ methods and database will be named PenG4.
5 Validation of the penelope Classes
To verify the correctness of the implementation of the penelope physics and tracking scheme into Geant4, a series of simulations of monoenergetic pencil beams of electrons, positrons and photons incident on simple material structures have been performed. The considered geometries (see Figure 8) are either a homogeneous cylinder of radius r and thickness t1, or a number of stacked cylinders of the same radius and heights t1, t2, …. In all cases the radiation beam impinges along the z axis, which coincides with the symmetry axis of the cylinders.
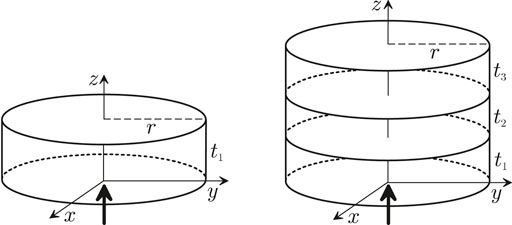
FIGURE 8. Schematic diagram of the geometries adopted in the example simulations. In all the examples, a pencil beam of particles impinges on the lower surface of the material cylinder along the z axis.
Simulations were performed by running the penelope Fortran code and the PenG4 C++ code under strictly equivalent conditions, i.e., for the same materials and geometry parameters, the same beam characteristics, and the same set of simulation parameters. As the two codes utilize different random number generators, their results are expected to be consistent (within estimated statistical uncertainties) but not identical. The simulated arrangements were selected so as to evidence the consistency of the two simulations, and to magnify the effect of interfaces in thin structures, which is where the penelope tracking is deemed to be superior. It is worth mentioning that the adopted values of the simulation parameters were set to magnify the relevant processes, rather than ensuring reliability of the results.
In the following paragraphs we give a brief description of the various cases considered for validation of PenG4, with plots of sample results. The provided results era expected to be helpful to users of PenG4 as a basic test to confirm that the code is being used correctly. All distributions are normalized per primary particle and thus, for instance, the integral of the depth-dose distribution D(z) over depth z equals the average energy deposited into the target by each incident particle. Each plotted distribution is accompanied with a small plot of the relative difference Δrel between the PenG4 and penelope values (dots) and its statistical uncertainty (gray bars). Generally, Δrel is less than its uncertainty, that is, the results from the two codes are statistically consistent.
1. Electron Beam on a Copper Cylinder
In this example a beam of 1 MeV electrons impinged on a copper cylinder (material ID = 29) having radius r = 1 cm and thickness t1 = 4.25 × 10⁻⁴ cm, about 75 elastic mean free paths of electrons with the initial energy. The parameters used in these simulations were Emax = Ethr = 1 MeV (i.e., all particles were of penelope type), C1 = C2 = 0.05, Wcc = Wcr = 1 keV,
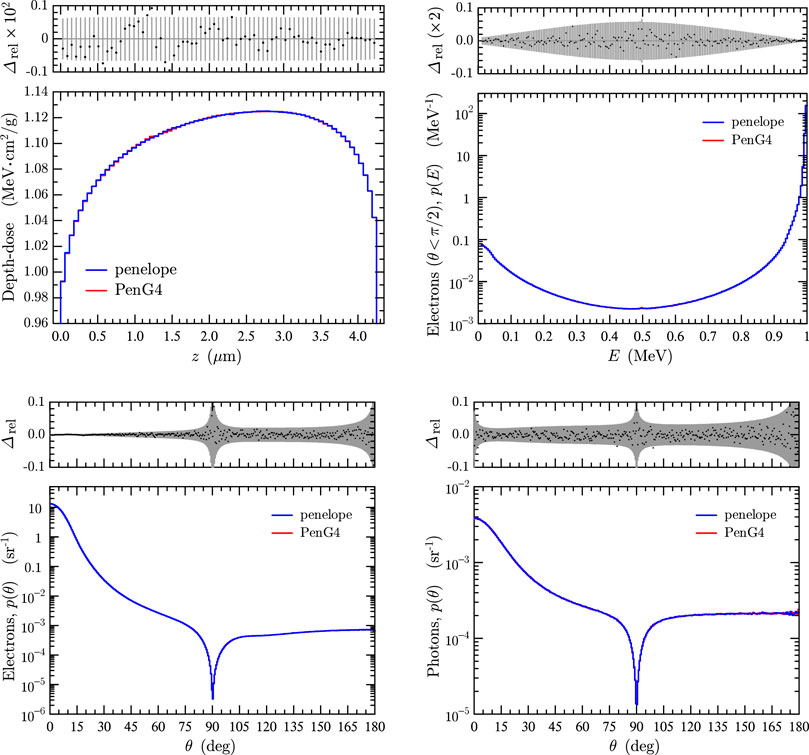
FIGURE 9. Simulation results for 1 MeV electrons incident on a copper cylinder, as described in the text. The blue histograms are results from penelope. Red histograms, practically invisible, are results from PenG4. The upper diagram in each plot displays the relative differences of the results (dots) and their associated statistical uncertainties with coverage factor = 3 (gray bars).
2. Electrons on a Tungsten Plate
Figure 10 shows partial results from simulations of 125 keV electrons impinging on a tungsten cylinder (material ID = 74) with radius r = 1 cm and thickness t1 = 24 μm, approximately equal to the CSDA range of incident electrons. The adopted simulation parameters were Emax = Ethr = 125 keV, C1 = C2 = 0.05, Wcc = Wcr = 1 keV,
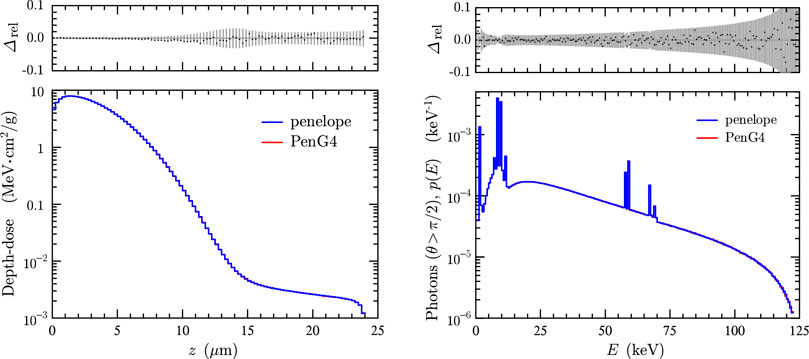
FIGURE 10. Simulation results for 125 keV electrons incident on a tungsten cylinder. Details are the same as in Figure 9.
3. Positron Beam on a Copper Foil
Simulations were performed for 1 MeV positrons incident on a copper foil (material ID = 29) having radius r = 1 cm and thickness t1 = 4.25 × 10⁻⁴ cm. The parameters used in these simulations were Emax = Ethr = 1.82952 MeV (i.e., 1.21 times the initial total energy of positrons, including their rest mass), C1 = C2 = 0.05, Wcc = Wcr = 1 keV,
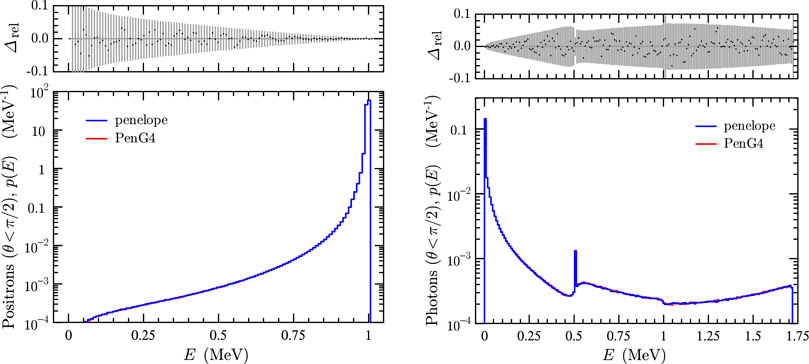
FIGURE 11. Simulation results for 1 MeV positrons on a copper foil. Details are the same as in Figure 9.
4. Photons on a 1.5” NaI Detector With Aluminium Backing
In this simulation example a 1.25 MeV photon beam impinges on a NaI cylinder (material ID = 253) covered with an aluminium cylinder (material ID = 13); the two cylinders have the same radius, r = 1.905 cm, and the heights of the NaI and the Al cylinders are t1 = 3.810 cm and t2 = 2.190 cm, respectively. Simulations were run with the parameters Emax = Ethr = 1.25 MeV, C1 = C2 = 0.1, Wcc = Wcr = 2 keV,
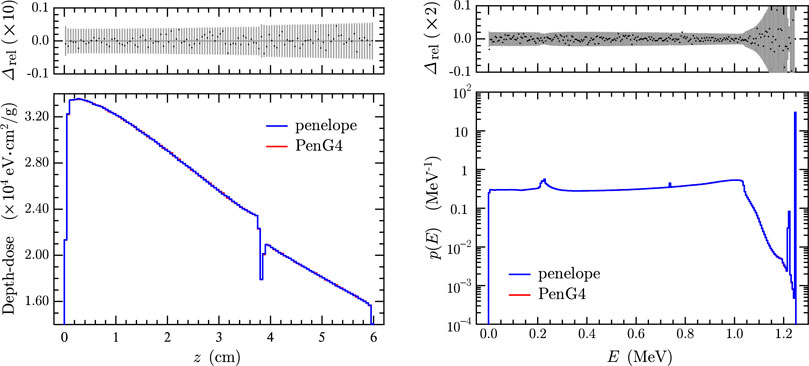
FIGURE 12. Simulation results for 1.25 MeV photons incident on a NaI cylinder with aluminium backing. Details are the same as in Figure 9.
5. Photons on a Stack of Three Cylinders of Different Materials
We performed simulations of a 1.25 MeV photon beam incident on a stack of three cylinders of radius 50 cm consisting of two layers of liquid water (t1 = 2 cm and t3 = 2 cm, material ID = 278) separated by a layer of aluminium (t2 = 1 cm, material ID = 13). The adopted simulation parameters were Emax = Ethr = 1.25 MeV, C1 = C2 = 0.1, Wcc = Wcr = 2 keV,
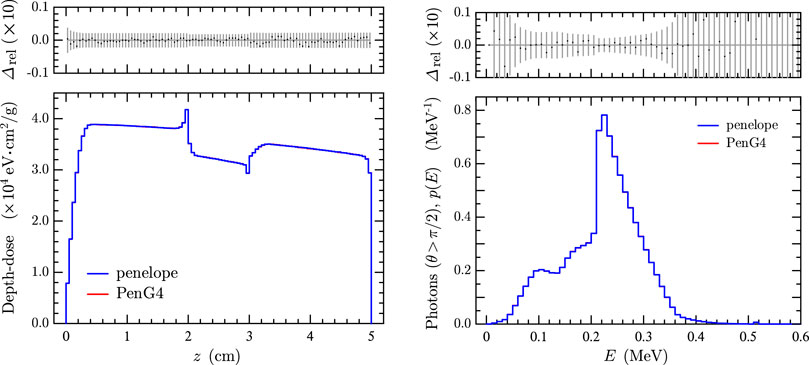
FIGURE 13. Results for a 1.25 MeV photon beam incident on a stack of three cylinders of water, aluminium, and water. Details are the same as in Figure 9.
6 Conclusion
The code system penelope implements reliable interaction models and a robust class-II mixed scheme for tracking electrons and positrons through complex geometrical structures. In the present article we have summarized the interaction models implemented in the code, and provided a concise description of the class-II algorithm used for tracking electrons and positrons, in a way that can be readily applied to other charged particles (see, e.g., Refs. [54, 55]).
Since there is ample evidence of the reliability of penelope’s simulation results for electrons/positrons and photons with energies from about 1 keV up to ∼1 GeV, we have translated the penelope physics and tracking subroutines to C++ and organized them to be accessible from Geant4 as an additional physics package. The new tool, named PenG4 has been shown to couple correctly to Geant4 and to yield results equivalent to those from the original penelope code.
Using the two codes, we have performed a set of test simulations with various incident particles and material structures, which were designed to explore different aspects of the transport physics, and we obtained consistent results. Inclusion of PenG4 as part of the Geant4 toolkit allows taking advantage of the multi-threading capabilities and advanced geometry and statistical tools of Geant4.
The PenG4 package, including the penelope C++ classes and physics database, is currently available from the authors, and it will soon be distributed through international agencies.
Data Availability Statement
The original contributions presented in the study are included in the article, further inquiries can be directed to the corresponding authors.
Author Contributions
All authors have contributed equally to the work.
Conflict of Interest
The authors declare that the research was conducted in the absence of any commercial or financial relationships that could be construed as a potential conflict of interest.
Publisher’s Note
All claims expressed in this article are solely those of the authors and do not necessarily represent those of their affiliated organizations, or those of the publisher, the editors and the reviewers. Any product that may be evaluated in this article, or claim that may be made by its manufacturer, is not guaranteed or endorsed by the publisher.
Acknowledgments
Financial support from the Spanish Ministerio de Ciencia, Innovación y Universidades/Agencia Estatal de Investigación/European Regional Development Fund, European Union, (projects nos. RTI2018-098117-B-C21 and RTI2018-098117-B-C22) is gratefully aknowledged. The work of VA was supported by the program “Ayudas para la contratación de personal investigador en formación de carácter predoctoral, programa VALi+d” under grant number ACIF/2018/148 from the Conselleria d’Educació of the Generalitat Valenciana and the Fondo Social Europeo (FSE). VG acknowledges partial support from FEDER/MCIyU-AEI under grant FPA2017-84543-P, by the Severo Ochoa Excellence Program under grant SEV-2014-0398 and by Generalitat Valenciana through the project PROMETEO/2019/087.
Footnotes
1The name is an acronym that stands for “PENetration and Energy LOss of Positrons and Electrons.”
2When small angles dominate,
3The normalized uniform distribution in the interval (a, b), with a < b, is
References
1. Baró J, Sempau J, Fernández-Varea JM, Salvat F. PENELOPE: An Algorithm for Monte Carlo Simulation of the Penetration and Energy Loss of Electrons and Positrons in Matter. Nucl Instr Methods Phys Res Section B: Beam Interactions Mater Atoms (1995) 100:31–46. doi:10.1016/0168-583x(95)00349-5
2. Salvat F. penelope-2018: A Code System for Monte Carlo Simulation of Electron and Photon Transport. Boulogne-Billancourt, France: OECD Nuclear Energy Agency, document NEA/MBDAV/R(2019)1 (2019). doi:10.1787/32da5043-en
3. Sempau J, Fernández-Varea JM, Acosta E, Salvat F. Experimental Benchmarks of the Monte Carlo Code PENELOPE. Nucl Instr Methods Phys Res Section B: Beam Interactions Mater Atoms (2003) 207:107–23. doi:10.1016/s0168-583x(03)00453-1
4. Agostinelli S, Allison J, Amako K, Apostolakis J, Araujo H, Arce P, et al. Geant4—A Simulation Toolkit. Nucl Instrum Meth A (2003) 506:250–303. doi:10.1016/S0168-9002(03)01368-8
5. Allison J, Amako K, Apostolakis J, Araujo H, Arce Dubois P, Asai M. Geant4 Developments and Applications. IEEE Trans Nucl Sci (2006) 53:270–8. doi:10.1109/TNS.2006.869826
6. Allison J, Amako K, Apostolakis J, Arce P, Asai M, Aso T. Recent Developments in Geant4. Nucl Instrum Meth A (2016) 835:186–225. doi:10.1016/j.nima.2016.06.125
7. Fano U. Penetration of Protons, Alpha Particles, and Mesons. Annu Rev Nucl Sci (1963) 13:1–66. doi:10.1146/annurev.ns.13.120163.000245
8. Inokuti M. Inelastic Collisions of Fast Charged Particles with Atoms and Molecules-The Bethe Theory Revisited. Rev Mod Phys (1971) 43:297–347. doi:10.1103/revmodphys.43.297
10. Salvat F, Fernández-Varea JM. Overview of Physical Interaction Models for Photon and Electron Transport Used in Monte Carlo Codes. Metrologia (2009) 46:S112–S138. doi:10.1088/0026-1394/46/2/s08
11. Cromer DT, Liberman D. Relativistic Calculation of Anomalous Scattering Factors for X Rays. J Chem Phys (1970) 53:1891–8. doi:10.1063/1.1674266
12. Cullen DE, Hubbell JH, Kissel L. EPDL97 the Evaluated Photon Data Library, ′97 Version. In: Tech. Rep. UCRL-50400. Livermore, CA: Lawrence Livermore National Laboratory (1997).
13. Brusa D, Stutz G, Riveros JA, Fernández-Varea JM, Salvat F. Fast Sampling Algorithm for the Simulation of Photon Compton Scattering. Nucl Instr Methods Phys Res Section A: Acc Spectrometers, Detectors Associated Equipment (1996) 379:167–75. doi:10.1016/0168-9002(96)00652-3
14. Biggs F, Mendelsohn LB, Mann JB. Hartree-Fock Compton Profiles for the Elements. At Data Nucl Data Tables (1975) 16:201–309. doi:10.1016/0092-640x(75)90030-3
15. Sabbatucci L, Salvat F. Theory and Calculation of the Atomic Photoeffect. Radiat Phys Chem (2016) 121:122–40. doi:10.1016/j.radphyschem.2015.10.021
16. Liberman DA, Cromer DT, Waber JT. Relativistic Self-Consistent Field Program for Atoms and Ions. Comp Phys Commun (1971) 2:107–13. doi:10.1016/0010-4655(71)90020-8
17. Salvat F, Fernández-Varea JM. Radial: A Fortran Subroutine Package for the Solution of the Radial Schrödinger and Dirac Wave Equations. Comp Phys Commun (2019) 240:165–77. doi:10.1016/j.cpc.2019.02.011
19. Pratt RH, Tseng HK. Behavior of Electron Wave Functions Near the Atomic Nucleus and Normalization Screening Theory in the Atomic Photoeffect. Phys Rev A (1972) 5:1063–72. doi:10.1103/physreva.5.1063
20. Sauter F. Über den atomaren Photoeffekt in der K-Schale nach der relativistischen Wellenmechanik Diracs. Ann Phys (1931) 403:454–88. doi:10.1002/andp.19314030406
21. Berger MJ, Coursey JS, Zucker MA, Chang J. Stopping-power and Range Tables for Electrons, Protons, and Helium Ions. Gaithersburg, MD: Tech. rep., Institute of Standards and Technology (2005). Available at: www.nist.gov/pml/data/star/index.cfm.
22. Salvat F, Jablonski A, Powell CJ. Elsepa-Dirac Partial-Wave Calculation of Elastic Scattering of Electrons and Positrons by Atoms, Positive Ions and Molecules. Comp Phys Commun (2005) 165:157–90. doi:10.1016/j.cpc.2004.09.006
24. Desclaux JP. A Multiconfiguration Relativistic Dirac-Fock Program. Comp Phys Commun (1975) 9:31–45. doi:10.1016/0010-4655(75)90054-5
26. Furness JB, McCarthy IE. Semiphenomenological Optical Model for Electron Scattering on Atoms. J Phys B: Mol Phys (1973) 6:2280–91. doi:10.1088/0022-3700/6/11/021
27. Liljequist D. A Simple Calculation of Inelastic Mean Free Path and Stopping Power for 50 eV-50 keV Electrons in Solids. J Phys D: Appl Phys (1983) 16:1567–82. doi:10.1088/0022-3727/16/8/023
28. Sternheimer RM. The Density Effect for the Ionization Loss in Various Materials. Phys Rev (1952) 88:851–9. doi:10.1103/physrev.88.851
29. Bote D, Salvat F. Calculations of Inner-Shell Ionization by Electron Impact with the Distorted-Wave and Plane-Wave Born Approximations. Phys Rev A (2008) 77:042701. doi:10.1103/physreva.77.042701
30. Llovet X, Powell CJ, Salvat F, Jablonski A. Cross Sections for Inner-Shell Ionization by Electron Impact. J Phys Chem Reference Data (2014) 43:013102. doi:10.1063/1.4832851
31. Seltzer SM, Berger MJ. Bremsstrahlung Spectra from Electron Interactions with Screened Atomic Nuclei and Orbital Electrons. Nucl Instr Methods Phys Res Section B: Beam Interactions Mater Atoms (1985) 12:95–134. doi:10.1016/0168-583x(85)90707-4
32. Seltzer SM, Berger MJ. Bremsstrahlung Energy Spectra from Electrons with Kinetic Energy 1 keV-10 GeV Incident on Screened Nuclei and Orbital Electrons of Neutral Atoms with Z = 1-100. At Data Nucl Data Tables (1986) 35:345–418. doi:10.1016/0092-640x(86)90014-8
33. Acosta E, Llovet X, Salvat F. Monte Carlo Simulation of Bremsstrahlung Emission by Electrons. Appl Phys Lett (2002) 80:3228–30. doi:10.1063/1.1473684
34. Poškus A. BREMS: A Program for Calculating Spectra and Angular Distributions of Bremsstrahlung at Electron Energies Less Than 3 MeV. Comput Phys Commun (2018) 232:237–55. doi:10.17632/mvd57skzd9.1
35. Kissel L, Quarles CA, Pratt RH. Shape Functions for Atomic-Field Bremsstrahlung from Electrons of Kinetic Energy 1-500 keV on Selected Neutral Atoms 1 ≤ Z ≤ 92. At Data Nucl Data Tables (1983) 28:381–460. doi:10.1016/0092-640x(83)90001-3
37. Nelson WR, Hirayama H, Rogers DWO. The EGS4 Code System. Stanford, CA: Stanford Linear Accelerator Center (1985).
38. Perkins ST, Cullen DE, Chen MH, Hubbell JH, Rathkopf J, Scofield J. Tables and Graphs of Atomic Subshell and Relaxation Data Derived from the LLNL Evaluated Atomic Data Library (EADL), Z = 1–100. Livermore, CA: Lawrence Livermore National Laboratory (1991).
39. Deslattes RD, Kessler EG, Indelicato P, de Billy L, Lindroth E, Anton J. X-ray Transition Energies: New Approach to a Comprehensive Evaluation. Rev Mod Phys (2003) 75:36–99. doi:10.1103/revmodphys.75.35
41. Walker AJ. An Efficient Method for Generating Discrete Random Variables with General Distributions. ACM Trans Math Softw (1977) 3:253–6. doi:10.1145/355744.355749
42. Berger MJ. Monte Carlo Calculation of the Penetration and Diffusion of Fast Charged Particles. In: B Alder, S Fernbach, and M Rotenberg, editors. Methods in Computational Physics. New York, NY: Academic Press (1963). 135–215.
43. Berger MJ, Seltzer SM. An Overview of ETRAN Monte Carlo Methods. In: TM Jenkins, WR Nelson, and A Rindi, editors. Monte Carlo Transport of Electrons and Photons. New York, NY: Plenum (1988).
44. Berger MJ, Seltzer SM. Applications of ETRAN Monte Cario Codes. In: TM Jenkins, WR Nelson, and A Rindi, editors. Monte Carlo Transport of Electrons and Photons. New York, NY: Plenum (1988).
45. Berger MJ, Seltzer SM. ETRAN — Experimental Benchmarks. In: TM Jenkins, WR Nelson, and A Rindi, editors. Monte Carlo Transport of Electrons and Photons. New York, NY: Plenum (1988).
46. Halbleib JA, Kensek RP, Mehlhorn TA, Valdez GD, Seltzer SM, Berger MJ. ITS Version 3.0: the Integrated TIGER Series of Coupled Electron/photon Monte Carlo Transport Codes. In: Tech. Rep. SAND91-1634. Albuquerque, NM: Sandia National Laboratories (1992).
47. Kawrakow I, Rogers DWO. EGSnrc Code System: Monte Carlo Simulation of Electron and Photon Transport. In: Tech. Rep. PIRS-701. Ottawa: National Research Council of Canada (2001).
48.X-5 Monte Carlo Team. MCNP—A General Monte Carlo N-Particle Transport Code). Los Alamos, NM: Los Alamos National Laboratory (2003).
49. Ferrari A, Sala PR, Fassò A, Ranft J. Fluka: A Multi-Particle Transport Code. In: Tech. Rep. CERN-2005-00X. Geneva: CERN (2005). doi:10.2172/877507
50. Hirayama H, Namito Y, Bielajew AF, Wilderman SJ, Nelson WR. The EGS5 Code System. Tech. Rep. SLAC-R-730. Menlo Park, CA: Stanford Linear Accelerator Center (2006).
51. Goorley JT, James MR, Booth TE, Brown FB, Bull JS, Cox LJ, et al. Initial MCNP6 Release Overview - MCNP6 Version 1.0. Los Alamos, NM: Los Alamos National Laboratory (2013).
52. Giménez-Alventosa V, Giménez Gómez V, Oliver S. PenRed: An Extensible and Parallel Monte-Carlo Framework for Radiation Transport Based on PENELOPE. Comp Phys Commun (2021) 267:108065. doi:10.1016/j.cpc.2021.108065
53. Fernández-Varea JM, Mayol R, Baró J, Salvat F. On the Theory and Simulation of Multiple Elastic Scattering of Electrons. Nucl Instr Methods Phys Res Section B: Beam Interactions Mater Atoms (1993) 73:447–73. doi:10.1016/0168-583x(93)95827-r
54. Salvat F. A Generic Algorithm for Monte Carlo Simulation of Proton Transport. Nucl Instr Methods Phys Res Section B: Beam Interactions Mater Atoms (2013) 316:144–59. doi:10.1016/j.nimb.2013.08.035
55. Salvat F, Quesada JM. Nuclear Effects in Proton Transport and Dose Calculations. Nucl Instr Methods Phys Res Section B: Beam Interactions Mater Atoms (2020) 475:49–62. doi:10.1016/j.nimb.2020.03.017
56. Goudsmit S, Saunderson JL. Multiple Scattering of Electrons. Phys Rev (1940) 57:24–9. doi:10.1103/physrev.57.24
57. Lewis HW. Multiple Scattering in an Infinite Medium. Phys Rev (1950) 78:526–9. doi:10.1103/physrev.78.526
58. Bielajew AF. HOWFAR and HOWNEAR: Geometry Modeling for Monte Carlo Particle Transport. In: Tech. Rep. PIRS-0341. Ottawa: National Research Council of Canada (1995).
59. Kawrakow I, Bielajew AF. On the Condensed History Technique for Electron Transport. Nucl Instr Methods Phys Res Section B: Beam Interactions Mater Atoms (1998) 142:253–80. doi:10.1016/s0168-583x(98)00274-2
Keywords: coupled electron-photon transport, Monte Carlo simulation, PENELOPE code system, random-hinge method, Geant4 toolkit
Citation: Asai M, Cortés-Giraldo MA, Giménez-Alventosa V, Giménez Gómez V and Salvat F (2021) The PENELOPE Physics Models and Transport Mechanics. Implementation into Geant4. Front. Phys. 9:738735. doi: 10.3389/fphy.2021.738735
Received: 09 July 2021; Accepted: 18 October 2021;
Published: 14 December 2021.
Edited by:
Laurent Ottaviani, Aix-Marseille Université, FranceReviewed by:
Matteo Duranti, Istituto Nazionale di Fisica Nucleare di Perugia, ItalyTuba Conka Yildiz, Türkisch-Deutsche Universität, Turkey
Copyright © 2021 Asai, Cortés-Giraldo, Giménez-Alventosa, Giménez Gómez and Salvat. This is an open-access article distributed under the terms of the Creative Commons Attribution License (CC BY). The use, distribution or reproduction in other forums is permitted, provided the original author(s) and the copyright owner(s) are credited and that the original publication in this journal is cited, in accordance with accepted academic practice. No use, distribution or reproduction is permitted which does not comply with these terms.
*Correspondence: Miguel A. Cortés-Giraldo, miancortes@us.es; Francesc Salvat, francesc.salvat@ub.edu
 Makoto Asai
 Miguel A. Cortés-Giraldo
 Vicent Giménez-Alventosa3
  Vicent Giménez Gómez
 Francesc Salvat