A Study on Drivers of Water Consumption in China From a Complex Network Perspective
 Ruijin Du
 Xiaoxia Zheng
 Lixin Tian1,4*
 - 1Institute of Applied System Analysis, Jiangsu University, Zhenjiang, China
- 2The Physics Department, School of Arts and Sciences, Boston University, Boston, MA, United States
- 3School of Mathematical Sciences, Jiangsu University, Zhenjiang, China
- 4School of Mathematical Sciences, Nanjing Normal University, Nanjing, China
- 5School of Economics, Nanjing University of Finance and Economics, Nanjing, China
Water consumption has been one of the most important topics in the field of environment and economy. Even though the driving factors of water consumption have been well studied, it is still a daunting task to reveal the influence of the status of provinces in the entire supply chain. By combining the multi-regional input-output (MRIO) model and complex network theory, an inter-provincial virtual water transfer (V WT) network was constructed to analyze the overall structural characteristics of the network model and identify the structural roles of each province. The constructed inter-provincial V WT network exhibited the characteristics of a small-world network, that is, virtual water can be easily transferred from one province to another. Moreover, network analysis revealed that provinces with different positions in the V WT network played discrepant structural roles. Panel regression analysis was further used to quantify the impact of provincial structural roles on their water consumption. The results showed that water consumption in China largely depended on some structural role characteristics in the V WT network. Out-degree and out-strength characterizing the ability of direct exporting virtual water exerted significant positive influences, while in-closeness featuring the indirect virtual water importing rate had a significant negative effect on water usage. This indicated that adjusting the uneven provincial consumption structure, the direct production demand of downstream provinces and the indirect production activities in the supply chain would help reduce water consumption. Therefore, to come true the goal of water conservation in China, it would be necessary to improve the trade structure between direct and indirect exporters and importers in the entire supply chain.
1 Introduction
The State of Food and Agriculture 2020 report released by Food and Agriculture Organization of the United Nations pointed out that due to factors such as population growth, socio-economic development and the world’s shortage of fresh water resources, 3.2 billion people worldwide are facing water shortages, and about 1.2 billion people live in agricultural areas with extreme water shortages [1]. In the past 100 years, global demand for water has increased by 6 times, and will continue to grow steadily at a rate of about 1% per year in the future [2]. With water resources per capita only a quarter of the world average, China has a serious water shortage, which will be exacerbated by climate change and environmental pollution and ecosystem damage [3, 4]. The scarcity of water resources has become a serious challenge facing the sustainable development of human society.
The concept of virtual water provides new idea for solving the problem of water scarcity. Different from physical water, virtual water contains the amount of water needed to produce goods and services, which provides a more systematical perspective for investigating related issues [5, 6]. It not only has further increased understanding of trade and water management issues, both locally, regionally and globally, but also has provided positive implications to the successful and sustainable development of water resources [7]. Compared with trans-basin water transfer projects, virtual water strategy has the characteristics of easier operation, more convenient and lower cost [8].
In the existing literature, the evaluation, driving factors and economic benefits of virtual water flow have attracted extensive attention from researchers [9, 10]. For research methods, Input-output model has been universally selected to calculate virtual water flow [11, 12]. The input-output table uncovers the relationship between production and consumption in all economies, which provides an approach to track the flow of virtual water in the economic system [13, 14]. Many previous studies focused on the use of input-output (IO) analysis to account for virtual water in a country or single region [15, 16]. Given the imbalance of regional production and consumption structure in China, it is essential to reveal the virtual water flow between provinces. Multi-regional input-output (MRIO) model can be employed to system atically explain the input-output relationship between different sectors in different regions, so as to trace how the resource and environment influenced by the consumption activities in one region is transferred to a specific production sector in another region through the cross-regional supply chain [4]. MRIO model has a comprehensive system boundary to avoid the defects of incomplete supply chain, which has been universally chosen to quantify the virtual water flow between regions [17, 18].
Based on the analysis of IO and MRIO, researchers have revealed the factors affecting water consumption from different perspectives. Some of these studies focus on the impact of virtual water on water consumption [19–21]. For example, Wang et al. found a significant correlation between virtual water imports and water consumption [22]. In addition, the Logarithmic Mean Divisional Index (LMDI) method can decompose all factors without residuals, which is used to quantitatively analyze the driving effect of variables on changes in water consumption [23, 24]. Structural decomposition analysis (SDA) combined with input-output analysis is used to reveal the economic reasons for changes in water consumption, including population, GDP per capita, water use intensity, technology, and final demand [25, 26]. Liu et al. demonstrated that increasing the export of virtual water in goods and services greatly increases water consumption [26]. These works laid a solid basic to analysis the effect of individual economic activities in regional water consumption and provided valuable implications for reducing regional water consumption.
In China, with the increasingly close inter-provincial trade, the national economy has become an intricate giant system in which each province plays its own unique role and interacts with each other. The water consumption of a province is not only driven by its own development needs, but also affected by other provinces. Although, the economic scale of a province or sector may be relatively small, it may become an important driver of water consumption due to its pivotal position in the national economic system. In other words, the actions to achieve the national water saving goal should not be limited to a certain province, but the national economic system should be regarded as a complete supply chain. Therefore, it is necessary to identify the structural role played by each province and evaluate its impact on water consumption in China.
Emphasizing the system structure and analyzing the system function from the structural perspective is the research idea of complex network theory. Many researchers have found that the function of a network depends on its structure, and the performance of individuals largely depends on their status in the network [27–30]. So far, complex network theory has been universally applied in many scientific fields such as economics [31], finance and trading [32], energy [33–35], climate [36–38]. The existing literature showed that complex network method has significant advantages in identifying the structural roles of nodes in both theoretical and realistic networks.
Different from previous researches on water consumption, this paper designed a novel framework from a complex network perspective. An inter-provincial virtual water transfer (VWT) network model was built to analyze the overall structural characteristics of China’s supply chain. By combining multi-regional input-output analysis and complex network analysis, the structural role of each province in the network was identified. Finally, a panel regression model was used to quantify the contribution of provincial structural effects on water consumption.
2 Data and Methodology
2.1 Data
The multi-regional input-output (MRIO) model has been universally chosen for revealing the virtual water flows between regions [39]. In a MRIO framework, regions are linked together by trade. The MRIO table used in this study contains 30 provincial-level administrative regions, including 23 provinces, three autonomous regions and four municipalities at the year 2007, 2010, 2012, and 2015. The MRIO data is obtained from CEADs database1, published papers and books [40–42]. The data on water consumption and population at the year 2007, 2010, 2012, and 2015 are taken from China Statistical Yearbook [43–46] and China Urban-Rural Construction Statistical Yearbook [47–50]. For the sake of brevity, we use particular codes in figures to abbreviate the name of different provinces, which are shown in Table A1 in the Appendix.
2.2 Estimation of Inter-Provincial Virtual Water Flows
Multi-regional input-output table provides a useful approach that can be used to reveal the virtual water flows among sectors or regions [42]. As shown in Table 1, Chinese economic system consists of N regions. The goods or services imported from Region i to Region j can serve either as intermediate use (denoted by xij) or final use (denoted by fij). Thus, the total output in Region i, denoted by xi, is the sum of intermediate inputs and the final demand, which is shown in Eq. 1.
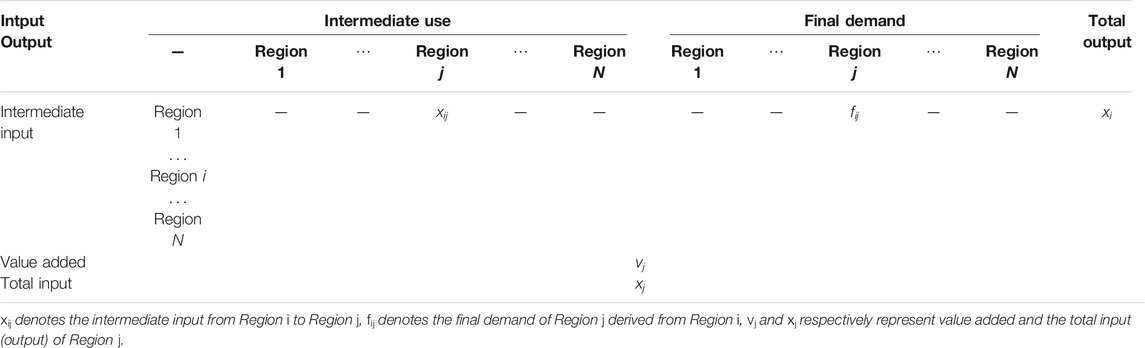
TABLE 1. Multi-regional input-output table.
The direct consumption coefficient aij reflects the required quantity of imports from Region i per unit output in Region j, which is expressed as:
By substituting Eq. 2 into Eq. 1, the matrix expression of the basic form of MRIO model is obtained as following:
It follows from Eq. 3 that
where I is a N-by-N identity matrix. (I − A)−1 is Leontief inverse matrix, which contains both direct and indirect inputs required to meet one unit of final demand in monetary value [51].
In multi-regional input-output analysis of China, the direct water intensity coefficient WIi of province i is defined as:
where Yi and xi respectively represent the water consumption and total output of province i. By multiplying the direct water intensity coefficient by Leontief inverse matrix, the total virtual water coefficient ɛ can be expressed as following:
Combined with the total virtual water coefficient matrix and the final demand matrix, the inter-provincial virtual water transfer amount T can be calculated, which is expressed as:
2.3 Inter-Provincial Virtual Water Transfer Network
2.3.1 Network Construction
In this study, the nodes are provinces in China, and the edges are the virtual water transfer relationships between the nodes. The weight of an edge is the amount of virtual water transfer from one province to another. In this way, a directed and weighted inter-provincial virtual water transfer (VWT) network is constructed. Centrality is a concept commonly used in complex network analysis to express the degree to which a point is the center of the entire network. In other words, the centrality of nodes reflects their importance in the network. There are many indicators for measuring centrality, including: strength centrality, closeness centrality, betweenness centrality and so on.
2.3.2 The Overall Structural Characteristics
1) Network density
The network density D, is defined as the ratio of the number of edges that actually exist in the network to the number of all possible edges. For a directed network, it can be calculated as follows [36, 52]:
where E is the number of edges of the network, N is the number of nodes. The network density represents the scale of inter-provincial VWT in China. It not only reflects the influence of the entire network on nodes, but also the mutual influence between nodes. The greater the network density, the greater the possibility that the network will affect the nodes, and the closer the relationship between the nodes.
2) Average clustering coefficient
The clustering coefficient quantifies the degree to which the neighboring nodes of a node gather together to form a cluster (complete graph). It can be calculated by the ratio of the number of edges that actually exist between the neighboring nodes of a node and all the possible edges between the neighboring nodes. The average clustering coefficient of a network is defined as the average of the clustering coefficients of all nodes in the network, which can be calculated as follows [53]:
where
3) Average shortest path length
The distance dij between nodes i and j is defined as the number of edges on the shortest path connecting i and j. The average shortest path length of a network, L, is the average of the distances between all pairs of nodes in the network. In this paper, it reflects the efficiency of inter-provincial virtual water transfer in China, and can be calculated as [54]:
where N is the number of nodes in the network.
2.3.3 Role Characteristics
1) Degree centrality
The node degree is the number of edges connected to the node, which is the most direct measure of the centrality of the node in network analysis. The greater the degree of a node, the more important the node is in the network. In a directed network, since the edges have directions, the node degree includes in-degree and out-degree. The in-degree of a node is the number of edges with the node as the end point, and the out-degree of the node is the number of edges with the point as the starting point. In this paper, the in-degree
where N is the number of nodes in the inter-provincial VWT network, Aij (Aji) is an element in the adjacency matrix of the network. If there is an edge connecting from node i (j) to node j (i), Aij (Aji) = 1, otherwise Aij (Aji) = 0.
2) Strength centrality
One of the centrality measures for a node is its strength. The strength of one node represents the total weight of the edges connected to the node. Since the network is directed, the strength is classified into in-strength and out-strength. In-strength and out-strength respectively reflect the total weight of all incoming and outgoing edges of a node. Here, in-strength
where N is the number of nodes in the inter-provincial VWT network, Wij (Wji) denotes the weight of the edge connecting i (j) to j (i). The net virtual water (NVW) inflow of node i is denoted as NVWi,
3) Closeness centrality
Closeness centrality reflects how easy it is for a node to access other nodes, and is defined by the inverse of the average length of the shortest path connecting one node to all other nodes in the network [52]. In a directed network, in-closeness is used to measure how many steps are required at least if other nodes want to access a given node, reflecting how easy it is for other nodes to access the given node. The higher the in-closeness of one node, the easier it is for other nodes to access it. While out-closeness measures how many steps a given node takes at least to access every other node. The greater the out-closeness of one node, the easier it is for the node to access other nodes. In this paper, in-closeness
where N is the number of nodes in the inter-provincial VWT network, dij (dji) represents the length of the shortest path from node i (j) to node j (i).
2.4 Selection of Panel Regression Model and Variables
In the inter-provincial VWT network, the roles of provinces on water consumption are different and change over time. On the one hand, due to regional heterogeneity, different provinces play different roles. On the other hand, the role of provinces in the network evolves dynamically over time. Therefore, the panel regression model can be used to analyze the relationship between the roles of provinces and water consumption in China from the spatial and temporal dimensions:
Xit, Yit and controlit separately represent the set of core explanatory variables, explained variable and control variables. β1it and β2it are the coefficients of explanatory variables and control variables. γit is the residual.
1) Explained variable
This paper aims to use panel regression model to evaluate the drivers of water consumption in China. The water consumption of each province is selected as explained variable.
2) Core explanatory variables
Indicators reflecting the structural centrality of the inter-provincial VWT network are chosen as core explanatory variables, including: in-degree (Din), out-degree (Dout), in-strength (Sin), out-strength (Sout), in-closeness (Cin) and out-closeness (Cout).
3) Control variables
Control variables are used to eliminate some important common factors affecting virtual water consumption in the province. The increase in the urbanization rate and the improvement of the water-saving system will drive the reduction of water consumption. The final demand represents the final use or consumption of the social total products by consumers. If a province has a high consumption capacity, this drive the province’s water use from production to consumption to a certain extent. In addition, there are differences in production technology in different provinces. Advanced technology can promote the reduction of water consumption. Water intensity reflects the difference in production technology, and thus can effectively describe the difference in water consumption between different provinces. Therefore, in this paper, urbanization rate (U)2, final demand (F) and water intensity (WI) are selected as control variables. In order to eliminate potential multicollinearity between variables, each variable in the panel regression model is estimated separately.
3 Results
3.1 The Overall Structural Characteristics of VWT Network
The initial inter-provincial VWT network based on MRIO table in China is a fully connected network. In complex network theory, it is difficult to reveal the essential characteristics for a fully connected network [36]. To better understand the basic structural characteristics of virtual water transfer flows between provinces, it is essential to set a threshold to eliminate the disturbance of edges with negligible weights. Firstly, the edges in the initial VWT network from 2007 to 2015 are sorted by weight. Then, we find that at most 40% of the edges have transferred more than 80% of the total virtual water flow. The remaining more than 60% edges are very weak connections, which are relatively trivial for structural analysis. Figure 1 shows the distribution of the ratio of edge weight to total weights in the initial VWT network during the period 2007–2015, arranged in ascending order from left to right. The yellow dashed line represents the critical threshold for filtering out those unimportant edges, which is set to guarantee the total weight of the removed edges accounts for 20%. Thus, only those edges that accounted for 80% of the total volume of the virtual water transfer are retained in the final networks. The inter-provincial VWT networks in 2007, 2010, 2012, and 2015 are shown in Figure 2. During 2007–2015, virtual water flow played an increasingly important role in water usage of China. The virtual water flow was 233.6, 228.6, 239.2, and 251.6 billion cubic meters for 2007, 2010, 2012, and 2015 respectively. In other words, the virtual water flow has increased by more than 7% in the past few years. Figure 2A shows the virtual water in Xinjiang, the largest exporting province at that time, was mainly transferred to the Central region in 2007, then to the South Coast region through the East Coast in 2010 (shown in Figure 2B) and 2012 (shown in Figure 2C). By 2015, Jiangsu has replaced Xinjiang as the largest exporter, the virtual water in which were mainly transported to the South Coast region (shown in Figure 2D).
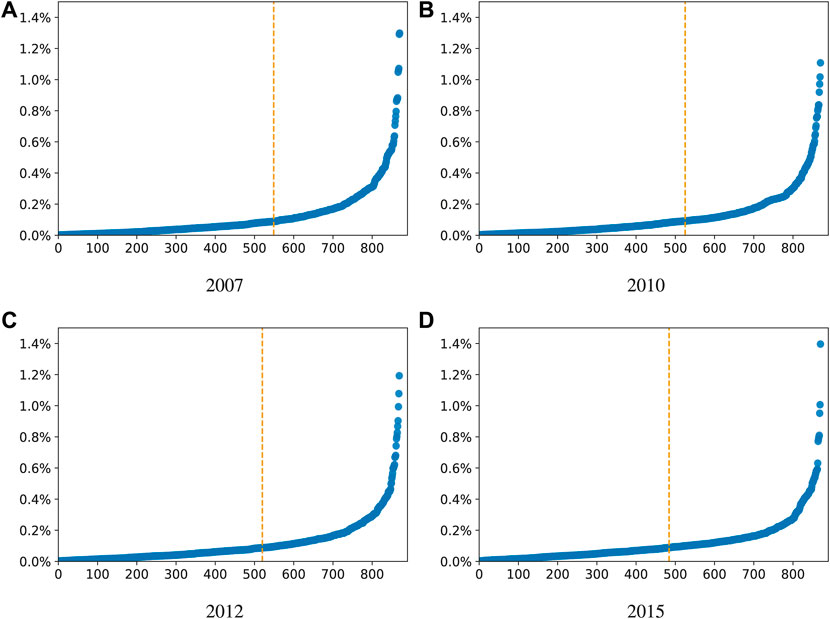
FIGURE 1. The distribution of the ratio of edge weight to total weights in the initial VWT network, arranged in ascending order from left to right. (A) 2007; (B) 2010; (C) 2012; (D) 2015.
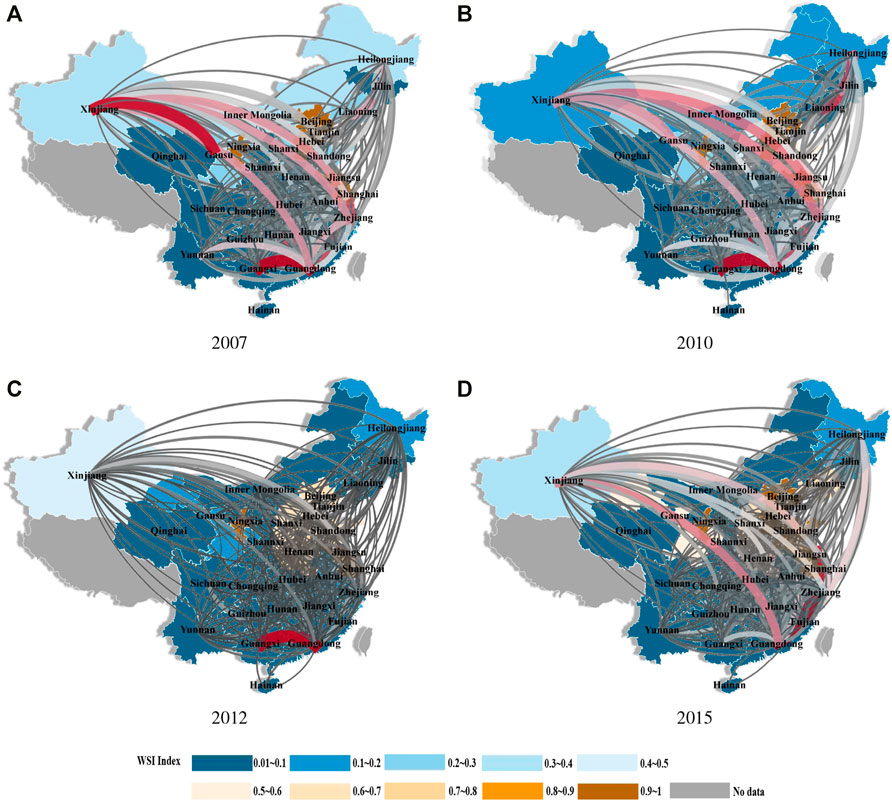
FIGURE 2. Inter-provincial virtual water transfer networks at 2007 (A), 2010 (B), 2012 (C), and 2015 (D). The clockwise bending direction of the curve represents the virtual water flow direction. The width of the curve represents the amount of virtual water transfer. The color shades reflect the WSI values.
It can be found from Table 2 that the network structure has characteristics of evolution with time. From 2007 to 2015, the density of inter-provincial virtual water transfer networks showed an increasing trend, indicating that network connections have become closer. The growing network density reflected the increasing frequency of virtual water transfer between provinces, which was related to the rapid development of inter-provincial trade in China. The average clustering coefficient was roughly around 0.6, implying that the probability of virtual water transfer between neighboring provinces was relatively high. The average shortest path length of the network experienced a slight fluctuation around 1.6, which showed a quite fast transfer speed of virtual water between provinces. The small average shortest path length indicated that the virtual water in one province could flow either directly or indirectly through at most one intermediate province to the destination province. Large average clustering coefficient and small average shortest path length made the inter-provincial virtual water transfer network exhibit the characteristics of a small world network, where most nodes were non-adjacent and could reach every other node in relative small steps [57].
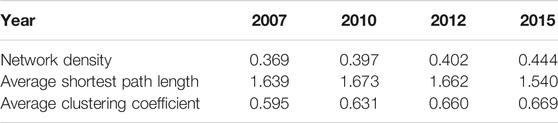
TABLE 2. The overall structural characteristics of inter-provincial VWT network.
3.2 Structural Roles of Provinces in the VWT Network
The structural roles of each province in the inter-provincial VWT network were identified with the aid of complex network analysis. It is widely known that the node degree characterizes the position of the node in a network. It can be seen from Figure 3 that several provinces have sustained high out-degrees over these years, which indicated that those provinces had many exporting partners. The changes in the number of exporting partners differed greatly among those provinces with high out-degrees. The number for exporting partners has shown a slight upward trend for Jiangsu, Anhui, Henan and Hunan provinces, while a slight decline for Guangxi province. The changes in the number of exporting partners differed greatly among these provinces with high out-degrees. The number for exporting partners has shown a slight upward trend for Jiangsu, Anhui, Henan and Hunan provinces, while a slight decline for Guangxi province. Compared with the case of out-degree, provinces with relatively high in-degree have many import partners. Over these years, the number of importing partners has grown slightly for Guangdong, Zhejiang and Henan provinces, while declined slightly for Shanghai. In particular, Jiangsu and Guangdong with both high in-degree and out-degree values had a close virtual water transfer relationship with other provinces, which was consistent with their economic status in the entire supply chain of China.
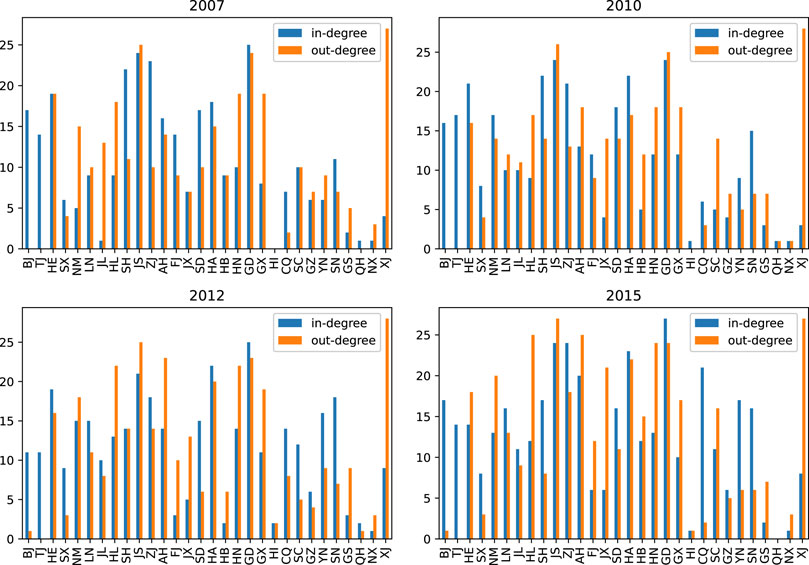
FIGURE 3. The distribution of in-degree and out-degree of each province in the inter-provincial VWT network.
Another important role character is the node strength. The in-strength and out-strength of each province in the VWT network were shown in Figure 4. Jiangsu, Xinjiang, Guangdong, Anhui and Heilongjiang with high out-strengths, were the main virtual water suppliers. On the contrary, provinces including Jiangsu, Guangdong, Zhejiang, Henan and Shanghai had high in-strengths and were the main virtual water consumption markets. In addition, water stress index (WSI) was employed to evaluate the scarcity of water resources in a region. It is calculated by the ratio of water withdrawn to available water. The range of WSI values is between 0.01 and 1. A WSI of 0.5 is usually set as a threshold of medium and high water stress [58, 59]. The shade of the color on the map in Figure 2 represents the WSI value of each province. Combined with the results in Figures 2, 4, it can be found that the positions among these provinces are different. In 2007, 2010, 2012, and 2015, Beijing, Shanghai, Tianjin and Jiangsu are provinces with severe water shortage due to extremely high WSI values. Beijing, Shanghai and Tianjin are the main NVW importers. However, Jiangsu was the main NVW exporter, ranking second in net exports. Xinjiang, Heilongjiang, Guangxi, Anhui, Guangdong and Zhejiang were rich in water resources. Especially in Guangxi, Anhui, Guangdong and Zhejiang, WSI was lower than 0.1. However, the situation between them was quite different. Xinjiang, Heilongjiang, Guangxi, and Anhui were the main NVW exporters during 2007–2015, while Guangdong and Zhejiang were the main NVW importers, ranking the top two in terms of net imports.
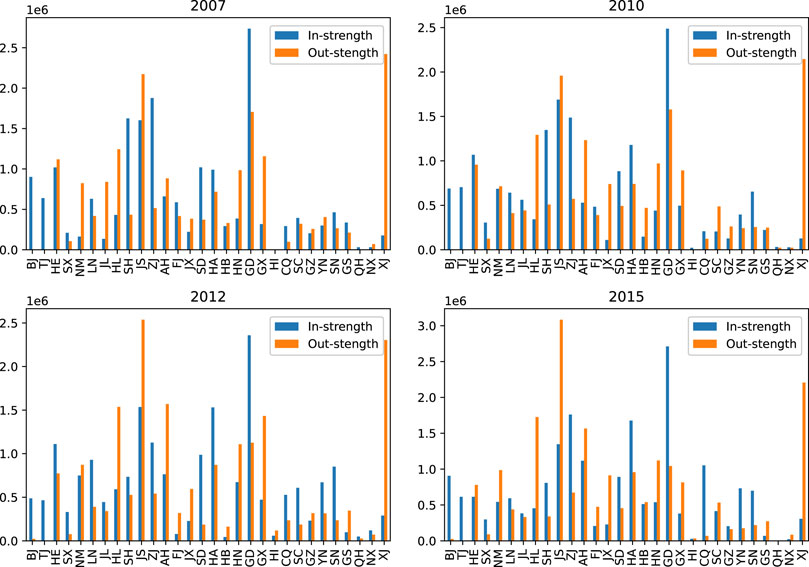
FIGURE 4. The distribution of in-strength and out-strength of each province in the inter-provincial VWT network.
The closeness of a node accounts for the importance of the node from another perspective. Figure 5 shows that the values of in-closeness and out-closeness were relatively large, indicating that the virtual water transfer speed was fast. In particular, the out-closeness values of Jiangsu, Guangdong and Xinjiang were all above 0.8, which imply that virtual water in these provinces could flow to other provinces through relative short paths. Moreover, the values of in-closeness and out-closeness both showed a slight upward trend. This trend demonstrated that changes in province would soon spread to other provinces due to closer connections between provinces.
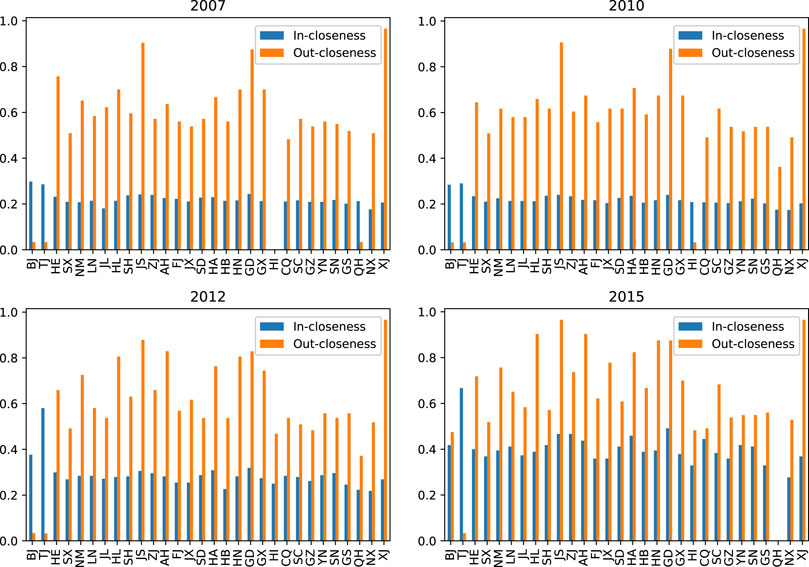
FIGURE 5. The distribution of in-closeness and out-closeness of each province in the inter-provincial VWT network.
3.3 Impact of Structural Roles of Provinces on Water Consumption in China
The stability of a complex network depends largely on its structure. Therefore, in the inter-provincial VWT network, the structural role of provinces has a significant impact on their water consumption. To test this assumption, panel regression analysis was applied to examine the impact of structural roles of provinces on their water consumption. Here the fixed effects model was selected as the panel regression model through Hausman test. In this paper, water consumption is chosen as the explained variable, Din, Dout, Sin, Sout, Cin and Cout are the core explanatory variables, and urbanization rate, final demand and water intensity were the control variables.
Table 3 lists the descriptive statistics of the variables considered. Significant differences between some variables can be found from this table. Before substituting into the panel regression model, all variables need to be normalized to eliminate the impact of different dimensions between variables, so that equivalent comparisons can be made between the effects of variables. The results of unit root test and co-integration test showed that all normalized variables were stable, and there was a co-integration relationship between variables, as shown in Tables 4, 5.
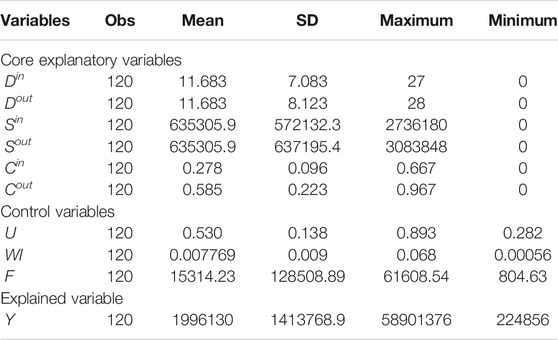
TABLE 3. Descriptive statistics of the variables.
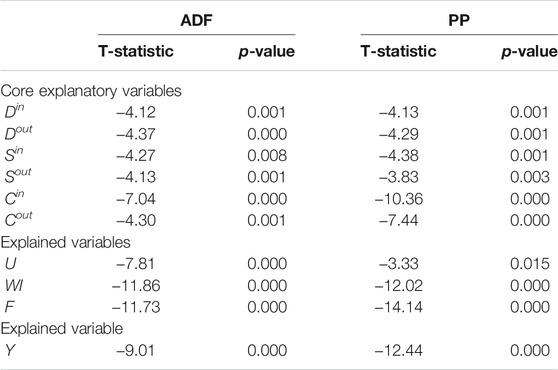
TABLE 4. Results of unit root test.

TABLE 5. Results of residual cointegration test.
The correlation between variables was shown in Table 6. The results showed that there was a strong correlation between some variables. For instance, the correlation between in-degree and in-strength was 0.906 and the significance level was less than 1%. Thus, this paper constructed six panel regression models to evaluate the influence of the structural characteristics of inter-provincial VWT network on water consumption, and the other two models were used to evaluate the influence of control variables and all variables on water consumption. Table 7 showed the results of the panel regression model. Model 1 measured the impact of control variables on water consumption. The results showed that both water intensity and final demand had a significant positive impacts on water consumption. Specifically, water intensity characterized by technical effects was an important driving force for changes in water consumption [42]. Technological progress and improvement of technical efficiency have led to a reduction in water intensity and greatly reduced water consumption. Final demand was the continuous driving force of economic growth, which in turn would drive water consumption. The level of urbanization had a weak but significantly negative effect on water consumption. The urbanization process accompanied by industrial agglomeration and technological progress has promoted the improvement of water use efficiency and the reduction of water consumption [60]. In addition, the high population density brought about by urbanization made infrastructure sharing inevitable, which also contributed to the reduction of water consumption to a certain extent.
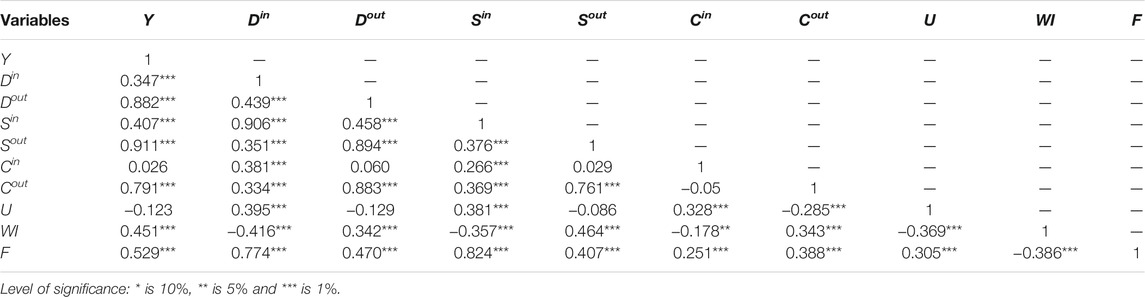
TABLE 6. The correlation of variables.
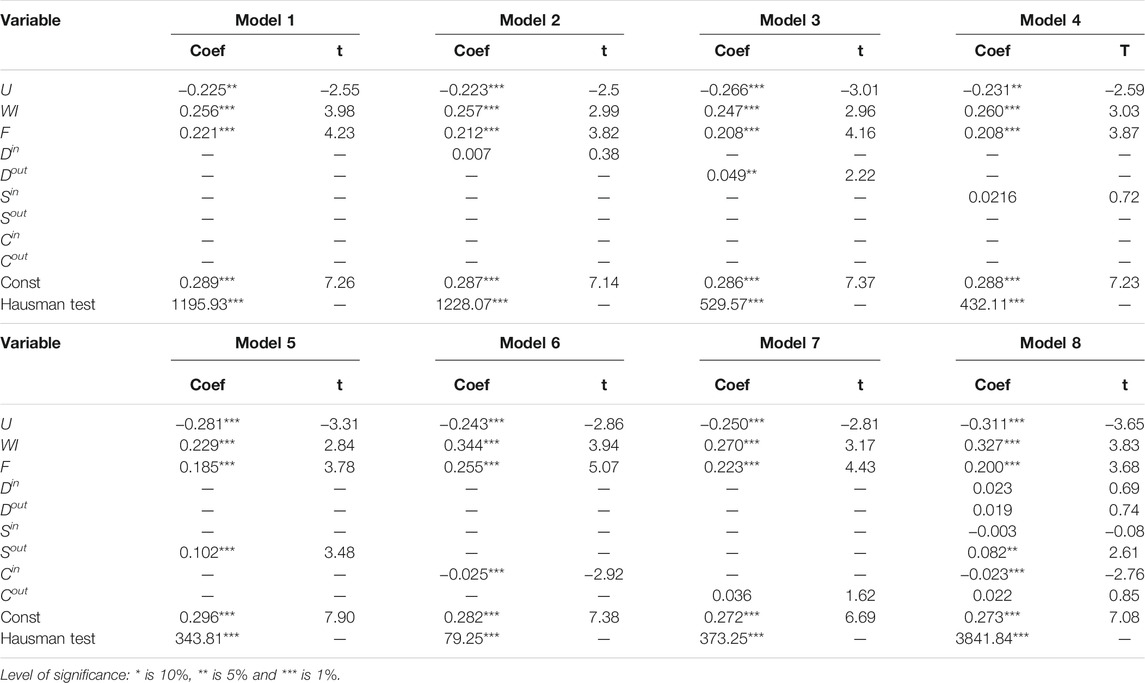
TABLE 7. Results of the panel regressions.
In models 2–7, the effects of the six structural roles (in-degree, out-degree, in-strength, out-strength, in-closeness and out-closeness) of provinces on water consumption in China were evaluated. The results of panel regression analysis showed that out-degree and out-strength had a significant positive effect, while in-closeness had a significant negative effect. In-degree, in-strength and out-closeness had no significant impact on water consumption. The impacts of out-degree indicated that the provinces would consume more water if they had more exporting partners. Similar situation occured when the impact of out-strength was investigated. Provinces exporting more virtual water tended to consume more water. The reason lies in the products with plenty of virtual water embodied in, produced by these provinces are not only to meet the needs of the province, but also to be exported to downstream provinces. This demonstrated that water consumption was mainly affected by direct production demand from downstream provinces. Therefore, by controlling the direct production demand from downstream provinces, water consumption could be significantly reduced. Conversely, the significant negative impact of in-closeness indicated that the transferring speed of the virtual water played a key role in water consumption. One province would consume less water resource if products would be imported from other province in a very short time. Thus, this province was often considered as a direct or indirect downstream market for many provinces in the production chain. In other words, if the production demand of a downstream province would be quickly filled from the upstream provinces, resulting in its less consumption of water resources. The impact of in-closeness indicated that indirect production demand would also significantly drive water consumption. In conclusion, the reduction of water resources should be implemented in both direct and indirect production activities.
4 Discussion and Conclusion
This paper aims to evaluate the impact of structural effects of provinces in China on their water consumption. First, the multi-regional input-output analysis and complex network method were combined to construct the inter-provincial virtual water transfer (VWT) network. Then the structural characteristics of provinces in the VWT network model were identified. Finally, panel regression analysis was applied to evaluate the contribution of provinces’ structural effects to their water consumption.
In the VWT network, virtual water establishes different paths through inter-provincial transfer and flows to the final consumer. The analysis of the inter-provincial VWT network can help decision makers better understand the current virtual water flow situation, the role of provinces and the flow path. First, the results reveled the overall characteristics of the inter-provincial VWT network. The network density has shown an upward trend, reflecting the increasing frequency of virtual water transfers between provinces. The high average clustering coefficient indicated that there were many local clusters in the VWT network. In addition, the path of virtual water flowing from one province to another was relatively smooth. The analysis of the average shortest path length showed that virtual water transfer from one province to another only needed to pass through 1.6 provinces, which means that the provinces were quite close to each other in the inter-provincial VWT network. The high average clustering coefficient and small average shortest path length showed that the VWT network had a small-world nature, which meant that the virtual water in one province would soon be transferred to the other.
Network analysis also showed that provinces have different level of significance and played different roles in the inter-provincial VWT network. The results showed that during the period from 2007 to 2015 there was a obvious imbalance between the import and export of the VWT network. Guangdong, Zhejiang, Jiangsu, Shanghai and Henan with many importing partners, were provinces with plenty of virtual water inflows. Some provinces, such as Xinjiang, Jiangsu, Guangxi, Anhui and Heilongjiang, not only had many exporting parters, but also a large amount of virtual water outflow. Xinjiang, Heilongjiang, Guangxi and Anhui were the main NVW exporters, while Guangdong and Zhejiang with extremely low WSI values (<0.1), were the main NVW importers. In other words, Guangdong and Zhejiang with abundant water resources have exacerbated water shortages in other provinces by importing virtual water from them. The water scarce situations differ greatly between Beijing, Shanghai, Tianjin and Jiangsu, which had extremely high WSI values. Beijing, Shanghai and Tianjin were the main NVW importers, while Jiangsu was the main NVW exporter, ranking second in net exports. That is to say, the water scarcity situation in Beijing, Shanghai and Tianjin has been in alleviated through the net import of virtual water, while the large net export of virtual water in Jiangsu has further exacerbated the water shortage situation. In addition, the results showed that changes in other provinces could easily flow into Tianjin with high in-closeness, while virtual water from Jiangsu, Xinjiang and Guangdong with high out-closeness could easily be transferred to other provinces.
Panel regression analysis showed that some structural effects in the inter-provincial VWT network significantly determined water consumption related to economic activities in the province. Out-degree and out-strength played a significant positive effect, while in-closeness played a significant negative effect. The relationship between water consumption and the number of trading partners, as well as the virtual water transfer volume, showed that water consumption growed with the increase in the number of export partners and the increase in export volume. Therefore, adjusting the direct production demand and consumption structure of downstream provinces would help reduce water consumption in China. Further investigation on the impact of in-closeness indicated that indirect production activities would significantly affect water consumption. Therefore, the reduction of water consumption in China should be based on the direct and indirect relationship in the production process.
This paper focuses on the contribution of the structural roles of provinces in the VWT network to their water consumption. There are some shortcomings in the research. One limitation is that although some important factors are considered as control variables, there are still some variables that are not included, such as climate change, This is a gap that still exists in the existing knowledge system. Studying the impact of the structural roles of various sectors in the industrial chain on water consumption can provide valuable information for rationally reshaping the industrial structure and reducing water consumption. Another limitation is that this paper considers the impact of structural roles on water consumption at the provincial level, not at the sectoral level. This is a gap that still exists in the existing knowledge system. Studying the impact of the structural roles of various sectors in the industrial chain on water consumption can provide valuable information for rationally reshaping the industrial structure and reducing water consumption. All of these will be improved in future work.
Data Availability Statement
The original contributions presented in the study are included in the article/Supplementary Material, further inquiries can be directed to the corresponding author.
Author Contributions
RD, LT, and LQ designed research; RD, XZ, QW, LT, KL, LQ, and GF performed research; RD, XZ, QW, and GF analyzed data; RD, XZ, KL, LT, and LQ wrote the paper.
Funding
This research was financially supported by the National Natural Science Foundation of China (Grant Nos. 71974080, 61973143, 11731014, 11901247, 71774077, 51876081, and 19A297), the Major Program of National Natural Science Foundation of China (Grant No. 71690242), National Key Research and Development Program of China (Grant No. 2020YFA0608601).
Author Disclaimer
Frontiers Media SA remains neutral with regard to jurisdictional claims in published maps and institutional affiliations
Conflict of Interest
The authors declare that the research was conducted in the absence of any commercial or financial relationships that could be construed as a potential conflict of interest.
Publisher’s Note
All claims expressed in this article are solely those of the authors and do not necessarily represent those of their affiliated organizations, or those of the publisher, the editors and the reviewers. Any product that may be evaluated in this article, or claim that may be made by its manufacturer, is not guaranteed or endorsed by the publisher.
Acknowledgments
KL thanks Foundation for High-Level Entrepreneurial and Innovative Talents of Jiangsu Province, and Research Grants for High-Level Talents of Jiangsu University.
Footnotes
2The urbanization rate is a measure of urbanization, the urbanization rate of a province is defined as the ratio of the urban population to the total population of the province.
References
1.FAO. The State of Food and Agriculture 2020 Report (2020). Available from: http://www.fao.org/publications/sofa/en/.
2.USESCO. The Unite Nations World Water Development Report 2020 (2020). Available from: http://zh.unesco.org/events/.
3. Tao S, Zhang H, Feng Y, Zhu J, Cai Q, Xiong X, et al. Changes in China's Water Resources in the Early 21st century. Front Ecol Environ (2020) 18:188–93. doi:10.1002/fee.2164
4. Zhang Y, Chen Y, Huang M. Water Footprint and Virtual Water Accounting for China Using a Multi-Regional Input-Output Model. Water (2019) 11:34. doi:10.3390/w11010034
5. Zhang X, Liu J, Zhao X, Yang H, Deng X, Jiang X, et al. Linking Physical Water Consumption with Virtual Water Consumption: Methodology, Application and Implications. J Clean Prod (2019) 228:1206–17. doi:10.1016/j.jclepro.2019.04.297
6. Zhao X, Liu J, Liu Q, Tillotson MR, Guan D, Hubacek K. Physical and Virtual Water Transfers for Regional Water Stress Alleviation in China. Proc Natl Acad Sci USA (2015) 112:1031–5. doi:10.1073/pnas.1404130112
7.“Virtual Water” Innovator Awarded 2008 Stockholm Water Prize. 2008. Available from: http://sa.indiaenvironmentportal.org.in/files/Virtual%20water.pdf.
8. Yang H, Zehnder A. “Virtual Water”: An Unfolding Concept in Integrated Water Resources Management. Water Resour Res (2007) 43. doi:10.1029/2007WR006048
9. Qian Y, Tian X, Geng Y, Zhong S, Cui X, Zhang X, et al. Driving Factors of Agricultural Virtual Water Trade between China and the Belt and Road Countries. Environ Sci Technol (2019) 53:5877–86. doi:10.1021/acs.est.9b00093
10. Wang L, Zou Z, Liang S, Xu M. Virtual Scarce Water Flows and Economic Benefits of the Belt and Road Initiative. J Clean Prod (2020) 253:119936. doi:10.1016/j.jclepro.2019.119936
11. Qasemipour E, Tarahomi F, Pahlow M, Malek Sadati SS, Abbasi A. Assessment of Virtual Water Flows in iran Using a Multi-Regional Input-Output Analysis. Sustainability (2020) 12:7424. doi:10.3390/su12187424
12. Zhang C, Anadon LD. A Multi-Regional Input-Output Analysis of Domestic Virtual Water Trade and Provincial Water Footprint in China. Ecol Econ (2014) 100:159–72. doi:10.1016/j.ecolecon.2014.02.006
13. Zhai M, Huang G, Liu L, Xu X, Li J. Transfer of Virtual Water Embodied in Food: A New Perspective. Sci Total Environ (2019) 659:872–83. doi:10.1016/j.scitotenv.2018.12.433
14. An T, Wang L, Gao X, Han X, Zhao Y, Lin L, et al. Simulation of the Virtual Water Flow Pattern Associated with Interprovincial Grain Trade and its Impact on Water Resources Stress in China. J Clean Prod (2021) 288:125670. doi:10.1016/j.jclepro.2020.125670
15. White DJ, Feng K, Sun L, Hubacek K. A Hydro-Economic MRIO Analysis of the Haihe River Basin's Water Footprint and Water Stress. Ecol Model (2015) 318:157–67. doi:10.1016/j.ecolmodel.2015.01.017
16. Wu XJ, Sun J, Liu J, Ding YK, Huang GH, Li YP. Ecological Network-Based Input-Output Model for Virtual Water Analysis in China. IOP Conf Ser Earth Environ Sci (2020) 435:012010. doi:10.1088/1755-1315/435/1/012010
17. Wiedmann T. A Review of Recent Multi-Region Input-Output Models Used for Consumption-Based Emission and Resource Accounting. Ecol Econ (2009) 69:211–22. doi:10.1016/j.ecolecon.2009.08.026
18. Qu S, Liang S, Konar M, Zhu Z, Chiu ASF, Jia X, et al. Virtual Water Scarcity Risk to the Global Trade System. Environ Sci Technol (2018) 52:673–83. doi:10.1021/acs.est.7b04309
19. Xiong Y, Tian X, Liu S, Tang Z. New Patterns in China's Water Footprint: Analysis of Spatial and Structural Transitions from a Regional Perspective. J Clean Prod (2020) 245:118942. doi:10.1016/j.jclepro.2019.118942
20. Tian Z, Fang D, Chen B. Three-scale Input-Output Analysis for Energy and Water Consumption in Urban Agglomeration. J Clean Prod (2020) 268:122148. doi:10.1016/j.jclepro.2020.122148
21. Wang YB, Wu PT, Zhao XN, Engel BA. Virtual Water Flows of Grain within China and its Impact on Water Resource and Grain Security in 2010. Ecol Eng (2014) 69:255–64. doi:10.1016/j.ecoleng.2014.03.057
22. Wang X, Hu J. Research on Virtual Water in the Chinese International Grain Trade. Me (2015) 06:735–46. doi:10.4236/me.2015.66070
23. Ang BW, Zhang FQ. A Survey of index Decomposition Analysis in Energy and Environmental Studies. Energy (2000) 25:1149–76. doi:10.1016/S0360-5442(00)00039-6
24. Ang BW. Decomposition Analysis for Policymaking in Energy:. Energy Policy (2004) 32:1131–9. doi:10.1016/S0301-4215(03)00076-4
25. Cazcarro I, Duarte R, Sánchez-Chóliz J. Economic Growth and the Evolution of Water Consumption in Spain: A Structural Decomposition Analysis. Ecol Econ (2013) 96:51–61. doi:10.1016/j.ecolecon.2013.09.010
26. Liu J, Zhao X, Yang H, Liu Q, Xiao H, Cheng G. Assessing China's "developing a Water-Saving Society" Policy at a River basin Level: A Structural Decomposition Analysis Approach. J Clean Prod (2018) 190:799–808. doi:10.1016/j.jclepro.2018.04.194
27. Newman MEJ. The Structure and Function of Complex Networks. SIAM Rev (2003) 45:167–256. doi:10.1137/S003614450342480
28. Dong G, Fan J, Shekhtman LM, Shai S, Du R, Tian L, et al. Resilience of Networks with Community Structure Behaves as if under an External Field. Proc Natl Acad Sci USA (2018) 115:6911–5. doi:10.1073/pnas.1801588115
29. Liu Y, Sanhedrai H, Dong G, Shekhtman LM, Wang F, Buldyrev SV, et al. Efficient Network Immunization under Limited Knowledge. Natl Sci Rev (2020) 8(8). doi:10.1101/2020.04.07.20056606
30. Dong G, Wang F, Shekhtman LM, Danziger MM, Fan J, Du R, et al. Optimal Resilience of Modular Interacting Networks. Proc Natl Acad Sci USA (2021) 118:e1922831118. doi:10.1073/pnas.1922831118
31. Chen K, Luo P, Sun B, Wang H. Which Stocks Are Profitable? A Network Method to Investigate the Effects of Network Structure on Stock Returns. Physica A: Stat Mech its Appl (2015) 436:224–35. doi:10.1016/j.physa.2015.05.047
32. Gao X, Fang W, An F, Wang Y. Detecting Method for Crude Oil price Fluctuation Mechanism under Different Periodic Time Series. Appl Energ (2017) 192:201–12. doi:10.1016/j.apenergy.2017.02.014
33. Du R, Dong G, Tian L, Wang Y, Zhao L, Zhang X, et al. Identifying the Peak point of Systemic Risk in International Crude Oil Importing Trade. Energy (2019) 176:281–91. doi:10.1016/j.energy.2019.03.127
34. Du R, Wang Y, Dong G, Tian L, Liu Y, Wang M, et al. A Complex Network Perspective on Interrelations and Evolution Features of International Oil Trade, 2002-2013. Appl Energ (2017) 196:142–51. doi:10.1016/j.apenergy.2016.12.042
35. Sun X, Li J, Qiao H, Zhang B. Energy Implications of China's Regional Development: New Insights from Multi-Regional Input-Output Analysis. Appl Energ (1962) 196:118–31. doi:10.1016/j.apenergy.2016.12.088
36. Jiang M, An H, Gao X, Liu S, Xi X. Factors Driving Global Carbon Emissions: A Complex Network Perspective. Resour Conservation Recycling (2019) 146:431–40. doi:10.1016/j.resconrec.2019.04.012
37. Fan J, Meng J, Ashkenazy Y, Havlin S, Schellnhuber HJ. Network Analysis Reveals Strongly Localized Impacts of El Niño. Proc Natl Acad Sci USA (2017) 114:7543–8. doi:10.1073/pnas.1701214114
38. Meng J, Fan J, Ashkenazy Y, Havlin S. Percolation Framework to Describe El Niño Conditions. Chaos (2017) 27:035807. doi:10.1063/1.4975766
39. Dong H, Geng Y, Fujita T, Fujii M, Hao D, Yu X. Uncovering Regional Disparity of China's Water Footprint and Inter-provincial Virtual Water Flows. Sci Total Environ (2014) 500-501:120–30. doi:10.1016/j.scitotenv.2014.08.094
40. Liu W, Chen J, Tang Z, Liu H, Han D, Li F. Theory and Practice of Compiling China 30-province Inter-regional Input-Output Table of 2007. Beijing: China Statistics Press (2012). (in Chinese).
41. Liu W, Chen J, Tang Z, Liu H, Han D, Li F. Input-output Table of China’s 30 Provinces, Autonomous Regions and Municipalities in 2010. Beijing: China Statistics Press (2014). (in Chinese).
42. Cai B, Zhang W, Hubacek K, Feng K, Li Z, Liu Y, et al. Drivers of Virtual Water Flows on Regional Water Scarcity in China. J Clean Prod (2019) 207:1112–22. doi:10.1016/j.jclepro.2018.10.077
43.National Bureau of Statistics of China. China Statistical Yearbook 2008. Beijing: China Statistics Press (2008).
44.National Bureau of Statistics of China. China Statistical Yearbook 2011. Beijing: China Statistics Press (2011).
45.National Bureau of Statistics of China. China Statistical Yearbook 2013. Beijing: China Statistics Press (2013).
46.National Bureau of Statistics of China. China Statistical Yearbook 2016. Beijing: China Statistics Press (2016).
47.Ministry of Housing and Urban-Rural Development. China Urban-Rural Construction Statistical Yearbook 2008. Beijing: China Statistics Press (2008).
48.Ministry of Housing and Urban-Rural Development. China Urban-Rural Construction Statistical Yearbook 2011. Beijing: China Statistics Press (2011).
49.Ministry of Housing and Urban-Rural Development. China Urban-Rural Construction Statistical Yearbook 2013. Beijing: China Statistics Press (2013).
50.Ministry of Housing and Urban-Rural Development. China Urban-Rural Construction Statistical Yearbook 2016. Beijing: China Statistics Press (2016).
51. Miller R, Blair P. Input-output Analysis: Foundations and Extensions. Cambridge: Cambridge University Press (2009).
52. Jiang M, Gao X, Guan Q, Hao X, An F. The Structural Roles of Sectors and Their Contributions to Global Carbon Emissions: A Complex Network Perspective. J Clean Prod (2019) 208:426–35. doi:10.1016/j.jclepro.2018.10.127
53. Bhattacharya S, Sinha S, Roy S. Impact of Structural Properties on Network Structure for Online Social Networks. Proced Comput Sci (2020) 167:1200–9. doi:10.1016/j.procs.2020.03.433
54. Furukoshi A, Damke M. System and Method for Operating a Large-Scale Wireless Network. US (2013). p. US8391183 B2.
55. Wang X, Wei W, Ge J, Wu B, Bu W, Li J, et al. Embodied Rare Earths Flow between Industrial Sectors in China: A Complex Network Approach. Resour Conservation Recycling (2017) 125:363–74. doi:10.1016/j.resconrec.2017.07.006
56. Freeman LC. Centrality in Social Networks Conceptual Clarification. Social Networks (1978) 1:215–39. doi:10.1016/0378-8733(78)90021-7
57. Carvalho VM. From Micro to Macro via Production Networks. J Econ Perspect (2014) 28:23–48. doi:10.1257/jep.28.4.23
58. Pfister S, Koehler A, Hellweg S. Assessing the Environmental Impacts of Freshwater Consumption in LCA. Environ Sci Technol (2009) 43:4098–104. doi:10.1021/es802423e
59. Zhang C, Zhong L, Liang S, Sanders KT, Wang J, Xu M. Virtual Scarce Water Embodied in Inter-provincial Electricity Transmission in China. Appl Energ (2017) 187:438–48. doi:10.1016/j.apenergy.2016.11.052
60. Avazdahandeh S, Khalilian S. The Effect of Urbanization on Agricultural Water Consumption and Production: the Extended Positive Mathematical Programming Approach. Environ Geochem Health (2021) 43:247–58. doi:10.1007/s10653-020-00668-2
Appendix
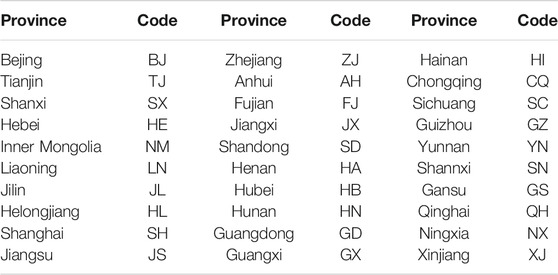
TABLE 1A. Provinces and their codes.
Keywords: water consumption, virtual water transfer, complex network, multi-regional input-output model, panel regression analysis
Citation: Du R, Zheng X, Tian L, Liu K, Qian L, Wu Q and Fang G (2021) A Study on Drivers of Water Consumption in China From a Complex Network Perspective. Front. Phys. 9:769420. doi: 10.3389/fphy.2021.769420
Received: 02 September 2021; Accepted: 12 October 2021;
Published: 25 November 2021.
Edited by:
Yongxiang Xia, Hangzhou Dianzi University, ChinaReviewed by:
Junhao Peng, Guangzhou University, ChinaLin Chen, Northwestern Polytechnical University, China
Xiangyun Gao, China University of Geosciences, China
Copyright © 2021 Du, Zheng, Tian, Liu, Qian, Wu and Fang. This is an open-access article distributed under the terms of the Creative Commons Attribution License (CC BY). The use, distribution or reproduction in other forums is permitted, provided the original author(s) and the copyright owner(s) are credited and that the original publication in this journal is cited, in accordance with accepted academic practice. No use, distribution or reproduction is permitted which does not comply with these terms.
*Correspondence: Lixin Tian, tianlx@ujs.edu.cn