Dynamics of Racial Residential Segregation and Gentrification in New York City
 Felipe G. Operti1
  André A. Moreira1
  Saulo D. S. Reis1
  Andrea Gabrielli2,3 Hernán A. Makse4
  José S. Andrade Jr.1*
- 1Departamento de Física, Campus Do Pici, Universidade Federal Do Ceará, Fortaleza, Brazil
- 2Dipartimento di Ingegneria, Università Degli Studi Roma Tre, Rome, Italy
- 3Enrico Fermi Research Center (CREF), Rome, Italy
- 4Levich Institute and Physics Department, City College of New York, New York, NY, United States
Racial residential segregation is interconnected with several other phenomena such as income inequalities, property values inequalities, and racial disparities in health and education. Furthermore, recent literature suggests the phenomenon of gentrification as a cause of perpetuation or increase of racial residential segregation in some American cities. In this paper, we analyze the dynamics of racial residential segregation for white, black, Asian, and Hispanic citizens in New York City in 1990, 2000, and 2010. It was possible to observe that segregation between white and Hispanic citizens and between white and Asian ones has grown, while segregation between white and black is relatively stable. Furthermore, we analyzed the per capita income and the Gini coefficient in each segregated zone, showing that the highest inequalities occur in the zones where there is an overlap of high-density zones of pair of races. Focusing on the changing of the density of population across the city during these 20 years, and by analyzing white and black people’s segregation, our analysis reveals that a positive flux of white (black) people is associated with a substantial increase (decrease) of the property values, as compared with the city mean. Furthermore, by clustering the region with the higher density of black citizens, we measured the variation of area and displacement of the four most significant clusters from 1990 to 2010. The large displacements (
Introduction
Although it is not a recent phenomenon, racial residential segregation (RRS) continues to permeate the United States metropolitan areas and it is still an object of study for scientists of different areas [1–25]. The decrease of RRS in American cities is controversial and drastically varies from one city to another Furthermore, it shows different trends according to the race analyzed. For example, several studies show that the segregation between white and black citizens has decreased in the last 50 years [2, 6, 10, 15]. Instead, segregation between white and Hispanic, and white and Asian citizens has increased [10, 15].
Several indexes were developed to quantify RRS [1, 3–5, 14, 16, 19, 23–25]. The first and still most used nowadays is the dissimilarity index created by Duncan and Duncan in 1955 [25]. Subsequently, in 1988, Massey and Denton [23] defined five distinct axes of measurement of residential segregation: evenness, exposure, concentration, centralization, and clustering. The authors affirmed that, to fully analyze residential segregation, at least five indexes corresponding to the five spatial dimensions are necessary. Meanwhile, in 2004, Reardon and O’Sullivan’s developed several measures of multigroup segregation and, among them, the authors consider the Information Theory Index the most conceptually and mathematically satisfactory measure to quantify residential segregation [16].
The RRS is the cause and effect of several inequalities. Studies show the relations between racial segregation and income inequalities [11] and property values inequalities. Furthermore, RRS causes racial disparities in health and education [11, 17, 20, 21]. In New York City, for instance, the mortality rates of black citizens vary substantially by locality according to the pattern of racial segregation [21].
In recent years, some researchers also suggest that the phenomenon of gentrification is a cause of perpetuation or even of the increase of RRS [26–29]. Gentrification is defined by The Encyclopedia of Housing [30, 31] as:
The process by which central urban neighborhoods that have undergone disinvestment and economic decline experience a reversal, reinvestment, and the in-migration of a relatively well-off, middle and upper middle-class population.
The main reason to indicate gentrification as a cause of perpetuation of racial segregation is the presumed displacement of the low-income class, in many cases predominantly black and/or Hispanic citizens, from their native neighborhoods during the gentrification process [26, 29, 30, 32, 33]. Taking the example of New York City once again, there is an intense debate about the gentrification of regions inside the neighborhoods of Harlem and the borough of Brooklyn [34–36]. Important to note, gentrification is a socio-economic phenomena with positive and negative impacts still under discussion by the scientific community. Therefore, it present more nuanced outcomes, and even lead to opportunity benefits, reduce out-migration pressure, and promote long-term affordability [37].
This paper aims to study the dynamics of RRS in New York City from 1990 to 2010. Here, we developed a method able both to measure RRS and to delimit the segregated zones. Indeed, differently from previous measures [38], our approach provides a clusterization inside high density areas, allowing a detailed description of the dynamics of such clusters.
Within the limit of the segregated zones, we analyze the per capita income in each high-density zone of population (defined by race) and in the zones of overlaps between them. To quantify income inequality, we calculate the Gini coefficient in each location. Then, we study the per capita income variation and the properties values for the census tracts that change zone during these 20 years. Finally, we focus on the segregation between white and black citizens. Notably, we use a simplified version of the City Clustering Algorithm (CCA) [39–47] to cluster the high-density zone of black citizens and measure the displacement and area of the four most significant clusters. One of these clusters includes the neighborhood of Harlem, and another one is inside the borough of Brooklyn.
The paper is structured as follows: first, we introduce our method. Then, we show the results of the application of the technique to New York City. After discussing the results, we finally present our conclusions.
Methods
The method consists of the following steps: first, we define the limits of the city using the City Clustering Algorithm (CCA) [39–47]. Second, we find the high-density zones for white, black, Asian, and Hispanic citizens. Finally, we measure the RRS through the Overlap Coefficient.
The CCA is an algorithm introduced to define the boundaries of metropolitan areas [39–47]. Its result depends on two parameters: a population density threshold D* (in people/km2), and a cutoff length ℓ (in km). The elementary information for population data is provided in census tract, where the tracts are geographic regions defined by the United States Census Bureau [48] (see Supplementary Appendix A for more information about the database). From the total population and area of a given tract, we calculate its population density Di. At this point, following the CCA, we assume that only the tracts with Di > D* are populated.
The next step of the algorithm is clusterization. In this step, we define the urban center. For each populated tract, we draw a circle of radius ℓ with a center in the centroid of the tract. All populated tracts with the centroid inside the circle belong to the same cluster and, therefore, the same city. We choose the parameter D* and ℓ respecting the isometry between area and population of the cities [39–41]. We apply the algorithm for the entire country and, subsequently, extract only the cluster equivalent to New York City.
The importance of using the CCA to define the urban area of New York City is due to the fact that RRS profoundly depends on the definition of urban areas [2, 3, 5]. For example, it was shown in [39, 41] that the Metropolitan Urban Areas (MSA) have large inhabited regions. Instead, our research aims to analyze RRS in a very dense urban area, specifically New York City.
We define the high-density (HD) zones as the set of tracts inside the city with a high population density of a specific race. The HD zone of a specific race r is defined applying a density threshold
Figure 1 shows the parameter p as a function of
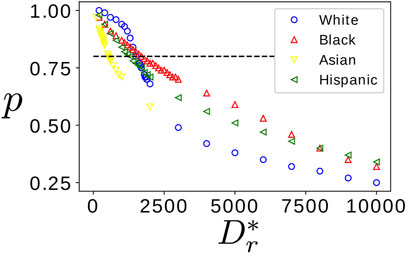
FIGURE 1. Variation of p as a function of parameter
Here we quantify the RRS between two races and two HD zones in terms of the Overlap coefficient (or Szymkiewicz-Simpson coefficient [49]) as,
where Xr and Xr′ are respectively the HD zone areas of races r and r′. Coefficient Orr′ is the sharing area between the HD zone of race r and the HD zone of race r′ divided by minimum area between the two zones. Therefore, the overlap coefficient is a real number between 0 and 1. When it is next to 0 (low overlap), the coefficient indicates high segregation, while when it is next to 1 (high overlap), it indicates low segregation. As defined, the overlap coefficient is a measure between a pair of races and may be considered a two-fold measure. Here we choose this one-versus-one strategy [50] to investigate the changing dynamics between all pairs of races. In what follows, we show that this is an efficient strategy to study the multiracial dynamics of the system.
Results
First, we define the limits of New York City by applying the CCA to the population data in 2010 (see Supplementary Appendix A for more details about the data). Then, we calculate the HD zone for white, black, Asian, and Hispanic for 1990, 2000, and 2010. In Figure 2, we show the HD zone for white and black citizens with the respective Overlap zone in the year 2010. Table 1 shows each race’s population and population density for the years of 1990, 120 2000, and 2010 for the New York City area defined by the CCA.
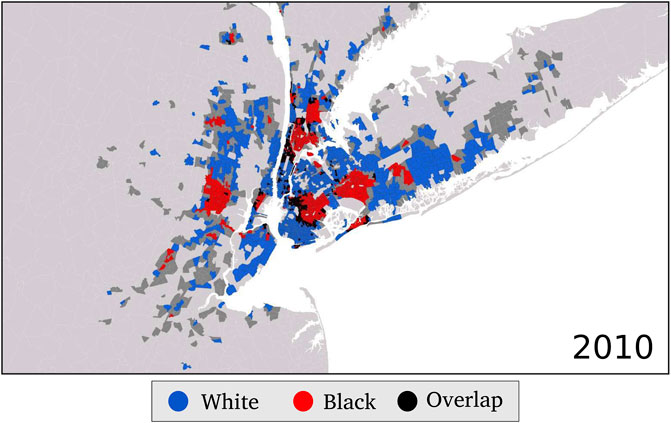
FIGURE 2. HD zone for white and black. We show the HD zone for white (blue) and black (red) citizens with the respective Overlap zone (black) in the year 2010. Dark grey tracts are part of the city that does not belong to any zone, while light grey tracts are not part of New York City.
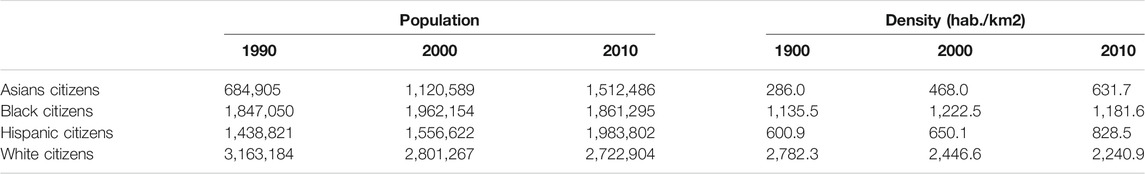
TABLE 1. Demographic data
For each pair of races, we calculate the Overlap coefficients. Table 2 shows that the segregation between white and black and black and Asian citizens remains relatively stable during the time interval. While segregation between white and Hispanic, white and Asian, and Hispanic and Asian has increased, the segregation between black and Hispanic citizens has decreased. Black people are frequently the most segregated, having a high overlap coefficient only with Hispanics.

TABLE 2. Overlap coefficients.
After defining the HD zones and the Overlap zones, we calculate the average per capita income of each race inside each zone for 1990, 2000, and 2010. Figure 3 presents these results. Clearly, white citizens earn more than all the other races in all zones, except in those where there is segregation between white and Asian citizens. Black and Hispanic citizens earn less than whites in all zones. Moreover, Figure 3 shows that income inequality between white and black citizens is more significant in the Overlap zone than in the zones 100% white and black.
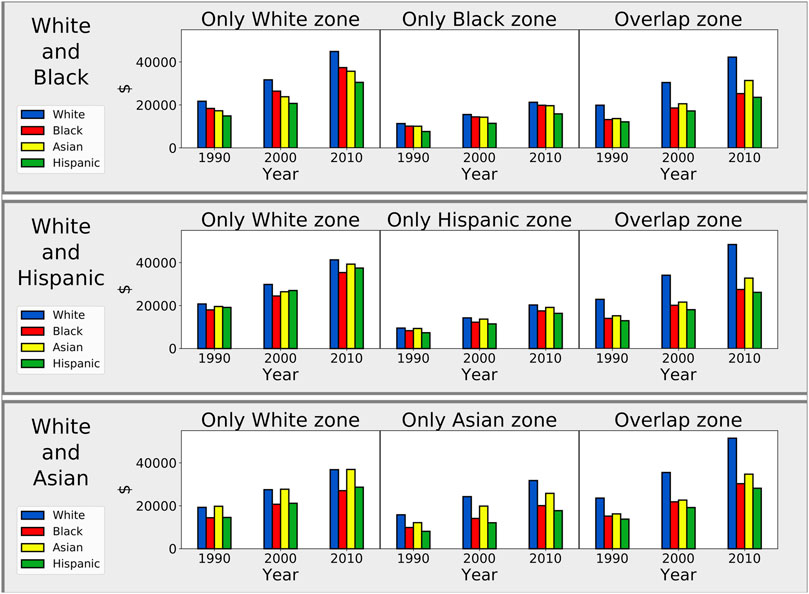
FIGURE 3. Per capita income analysis. The mean per capita income in US dollars of White citizens compared to the mean per capita income of Black citizens (top panel), to the mean per capita income of Asian citizens (middle panel), and to the mean per capita income of Hispanic citizens (bottom panel) for the HD Only zones and Overlap zones. For each zone, the mean per capita income of White citizens (blue bars) is consistently higher than the ones of Black citizens (red bars), Asian citizens (yellow bars), and Hispanic citizens (green bars).
In order to identify the per capita income inequalities in the segregation between pairs of races (white and black, white and Hispanic, and white and Asian), we calculate the Gini coefficient [51] for each case (see Figure 4). The Gini coefficient varies from 0 to 1. When it is next to 0, there is no inequality, while when it is next to 1, inequality is maximum [51]. Figure 4 shows that inequality is more significant in the Overlap zones in all cases in favor of whites.
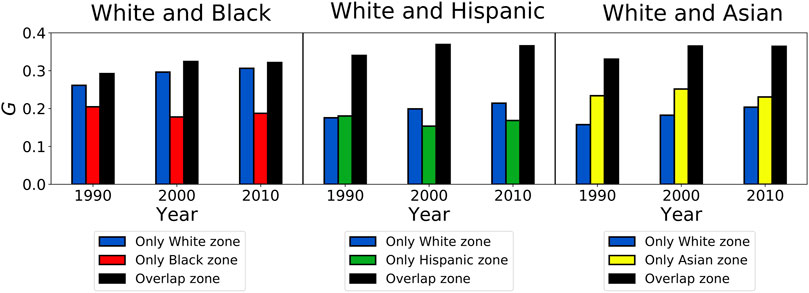
FIGURE 4. Gini coefficient for the years of 1990, 2000, and 2010. Gini coefficient in the HD only zones and the Overlap zones to study segregation between white and black, white and Hispanic, and white and Asian.
We also analyze the tracts that migrated from one zone to another from 1990 to 2010 for the cases of segregation between white and black citizens in Figure 5; white and Asian citizens in Figure 6; and white and Hispanic citizens in Figure 7. The colors in the maps in Figures 5–7 show the alternatives of migration of the tracts from one zone to another. For each case, we calculate the average variation of the per capita income, ΔI, and the average variation of the properties values, ΔH, as
and,
where the differences ΔI or ΔH are calculated between two given years y1 and y2, N is the number of tracts of the analyzed pairs of races, δIi and δHi are the variations of the per capita income and properties values of tract i, respectively, and
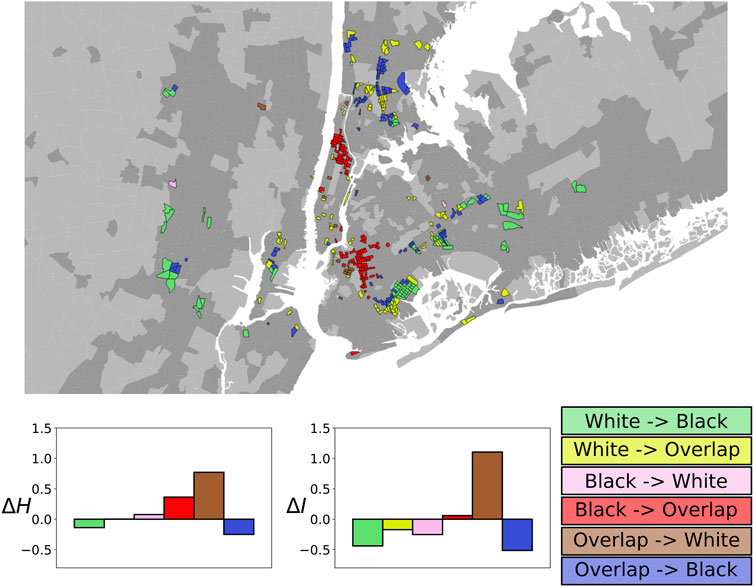
FIGURE 5. Tracts that migrated from one zone to another or to the Overlap zone from 1990 to 2010: white and black citizens. Tracts that changed zone from 1990 to 2010 are shown on the map, while the colors indicate the change from white to black (green), from white to overlap (yellow), from black to white (pink), from black to overlap (red), from overlap to white (brown), and from overlap to black (blue). Furthermore, for each migration alternative, the values of ΔH and ΔI are shown at the bottom panels.
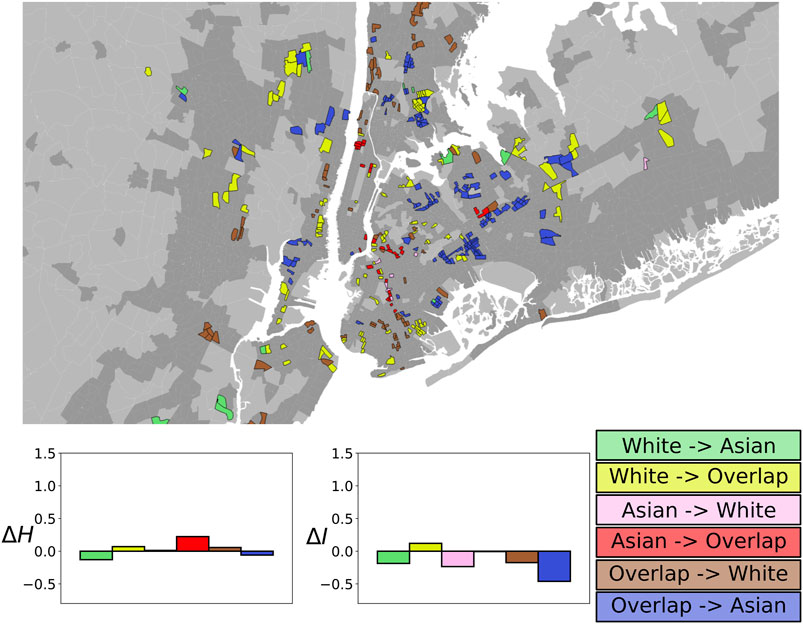
FIGURE 6. Tracts that migrated from one zone to another or to the Overlap zone from 1990 to 2010: white and Asian citizens. Tracts that changed zone from 1990 to 2010 are shown on the map, while the colors indicate the change from white to Asian (green), from white to overlap (yellow), from Asian to white (pink), from Asian to overlap (red), from overlap to white (brown), and from overlap to Asian (blue). Furthermore, for each migration alternative, the values of ΔH and ΔI are shown at the bottom panels.
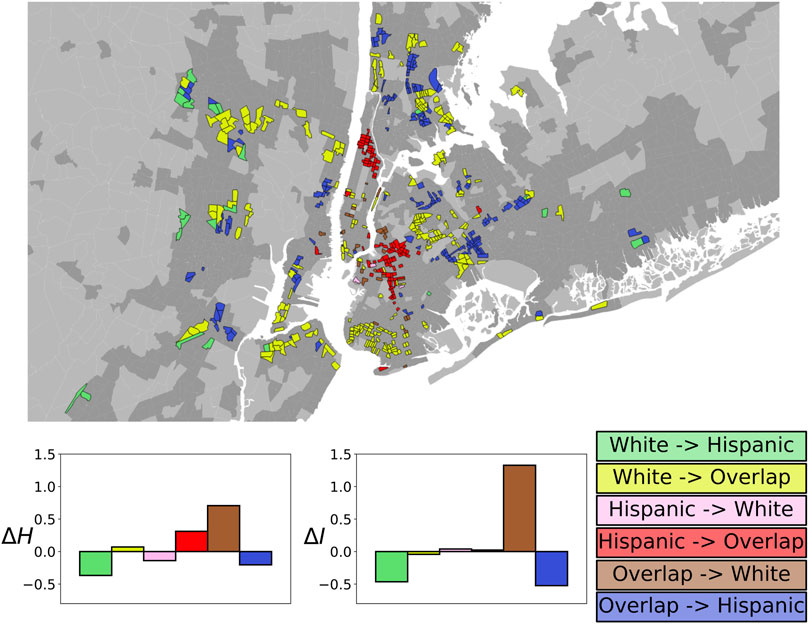
FIGURE 7. Tracts that migrated from one zone to another or to the Overlap zone from 1990 to 2010: white and Hispanic citizens. Tracts that changed zone from 1990 to 2010 are shown on the map, while the colors indicate the change from white to Hispanic (green), from white to overlap (yellow), from Hispanic to white (pink), from Hispanic to overlap (red), from overlap to white (brown), and from overlap to Hispanic (blue). Furthermore, for each migration alternative, the values of ΔH and ΔI are shown at the bottom panels.
At this point, let us focus on the segregation between white and black citizens and the flux of people from 1990 to 2010 inside the tracts that migrated from one zone to another or to the Overlap zone. The flux of people of a race X inside a tract corresponds to the variation of this people inside tract i compared with the mean variation of them in the whole city. Similarly to Eqs. 2, 3, the average flux ΔFluxX is defined as,
where
Still focusing on the segregation between white and black citizens, we show in Figure 8 the variation of income, the variation of properties values, and the flux of people in the tracts that change zone between the years 1990 and 2010.
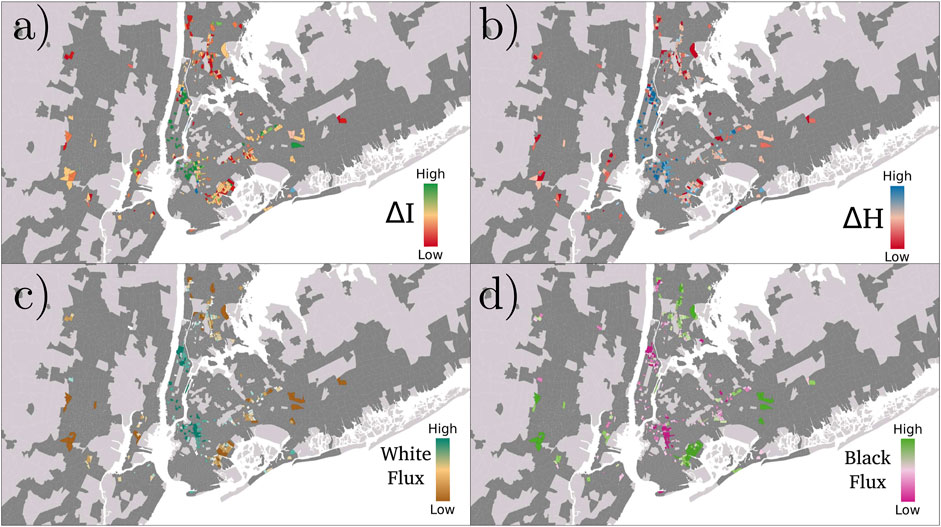
FIGURE 8. Segregation between white and black. (A) the variation of the per capita income, (B) the variation of the properties values, (C) the incoming flux of white, and (D) the incoming flux of black for the tracts that migrated from one zone to another or to the Overlap zone from 1990 to 2010.
For the tracts presented in Figure 8, in Figure 9 we compare the variation of the flux of white and black citizens with the variation of the properties values. It shows that where the flux of white citizens is on average positive, the properties values increase more than the mean. On the other hand, where the flux of black citizens is negative on average the properties values decreases more than the mean.
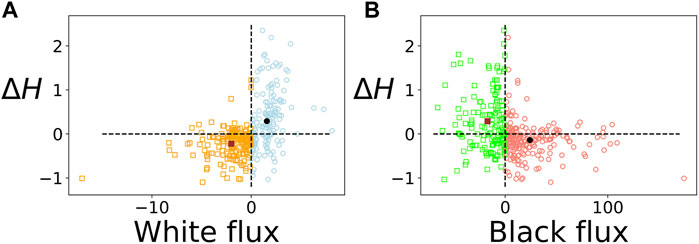
FIGURE 9. Variation of properties values as a function of the flux of white and black citizens for the tracts that change zone from 1990 to 2010. (A) Variation of the properties values as a function of the flux of white citizens. The tracts with an outgoing flux of white are shown in orange, while the tracts with an incoming flux of white are shown in blue. The red square is the centroid of the outgoing flux, while the black circle is the centroid of the incoming flux. (B) Variation of the properties values as a function of the flux of black citizens. The tracts with an outgoing flux of black are shown as green squares, while the tracts with an incoming flux of black are shown as red circles. The red square is the centroid of the outgoing flux, while the black circle is the centroid of the incoming flux.
Next we investigate the displacement of black citizens in New York City. We divide the HD black zone into clusters by using the CCA. Indeed, we ignore the threshold D* and apply the cutoff length ℓ′. The parameter ℓ′ is chosen by analyzing the distribution of the area of the tract. We consider each tract area as a circle with the same area. A mean radius of
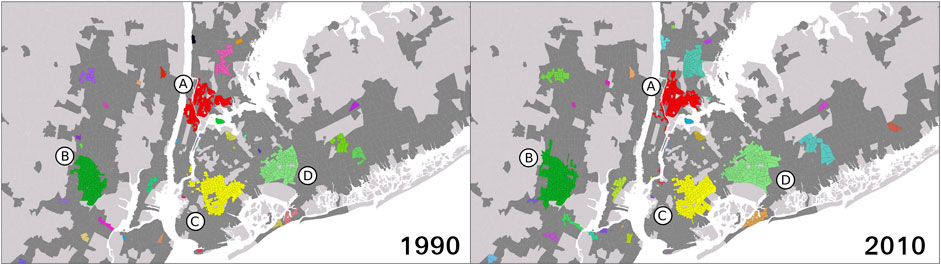
FIGURE 10. Clusterization of the HD black zone for the years of 1990 and 2010. The clusterization of the HD black zone using the parameter ℓ′ = 1.5 km for 1990 and 2010. We highlight the four most significant clusters (A) (in red), (B) (in dark green), (C) (in yellow), and (D) (in light green).
For the four most significant clusters (A, B, C, and D), in Table 3 we show the area of each of them for the years 1990 and 2010. Also presented are the displacements of the cluster’s centroids, highlighting the fact that clusters A and C have a displacement about three times higher than clusters B and D. In Figure 11, we show the displacement of clusters A and C from 1990 to 2010. Cluster A includes a region in the neighborhood of Harlem, while cluster B is located inside the boroughs of Brooklyn. Also shown in Figure 11 is the variation of the per capita income ΔI for the tracts that change zone in the analyzed period.
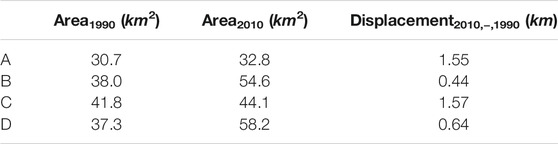
TABLE 3. Areas and displacements of the four biggest clusters of the HD black zone.
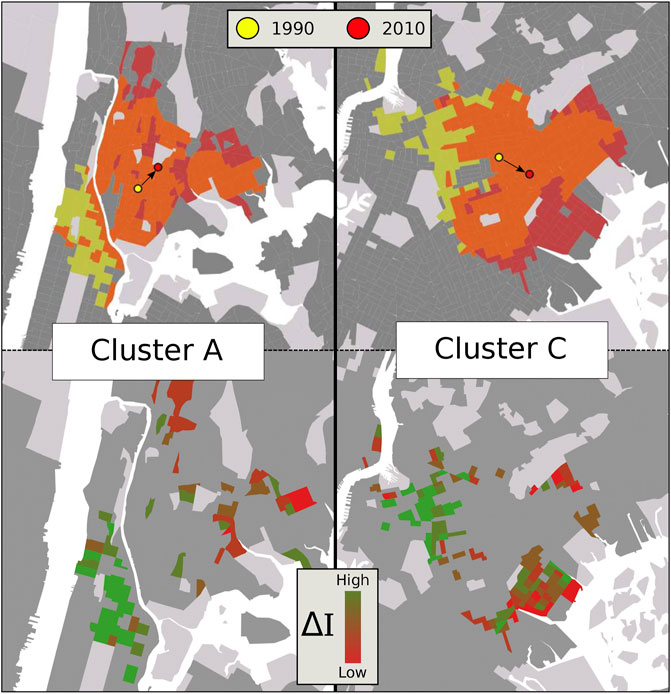
FIGURE 11. Displacement of clusters A and C and the variation of per capita income. Displacement of cluster A, equivalent to the neighborhood of Harlem and the borough of Bronx, and C, representing the borough of Brooklyn). The yellow areas represent the clusters for 1990, while red areas represent the clusters for 2010, with their respective centroids. The panels at the bottom show qualitatively the variation of the per capita income for the tracts that change zone in the period.
Comparison With the Dissimilarity Index
In order to verify the robustness of our method, we compare the Overlap coefficient defined in Eq. 1 with the dissimilarity index [25]:
where ri is the population of race r in tract i and
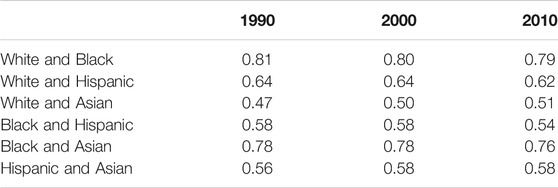
TABLE 4. Dissimilarity index Drr′.
To analyze the correlation between the two indices, we plot in Figure 12 the dissimilarity indexes Drr′ found for New York City as a function of their respective Overlap coefficients Orr′ (where Xr is the HD zone of race a and Xr′ of race b). As depicted, the least-squares fit to the data points of a linear relation, Drr′ = mOrr′ + b, gives m = − 0.57 ± 0.01 and b = 0.90 ± 0.01, with a Pearson correlation coefficient of ρ = − 0.96. Note that, even though the indices exhibit a strong correlation, they essentially provide different information. While Drr′ refers to the absolute difference between the fractions of races r and r′, the Orr′ index is a measure for the overlap area occupied by the races, as defined by the CCA algorithm. Furthermore, since Orr′ makes use of the HD zones, it also provides an overview of the geographical information of segregated/integrated areas and their dynamics over time.
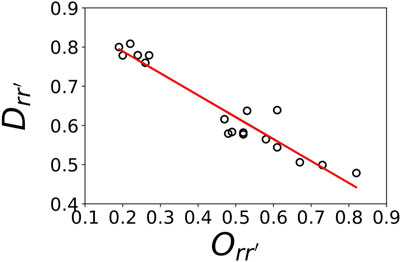
FIGURE 12. Dissimilarity index D as a function of the Overlap coefficient O. The red line least-squares shows a strong correlation between the two indices with an angular coefficient m = − 0.57 ± 0.1 and the Pearson correlation coefficient, ρ = − 0.96.
Discussion
We developed a new method to measure and define the topography of RRS and applied it to the metropolitan area of New York City for 1990, 2000, and 2010. Even though several studies show that, on average, segregation between white and black citizens in the United States has decreased in the last fifty years [2, 6, 10, 15] our results for the overlap index show that it has remained relatively stable during the time interval 1990–2010 in the metropolitan area of New York City. For the dissimilarity index, we found a slight decrease of segregation between white citizens and black citizens. The same pattern can be identified for black and Asian citizens. Instead, segregation between white and Asian citizens, and Hispanic and Asian citizens has grown for both indexes. Additionally, while the segregation between white and Hispanics citizens increased for the overlap index, it slightly decreased for the dissimilarity index. Compared to 1990, a decrease in segregation in 2010 could only be observed between black and Hispanic citizens.
To better understand the information provided by the CCA analysis applied to the mapping of geographical racial communities and the effectiveness of the Overlap Index, the choice of NYC is justifiable due to the richness of scientific literature on the topic related to the city. The behavior of the present analysis on different regions of the world becomes a topic for future work. The Overlap index, as presented, has some limitations since it only considers two racial groups at a time. A possible generalization of the Overlap index would be to extend it to a multi-group analysis. This generalization could result in losing part of the information the metric provides to the dynamical analysis presented, and therefore it also is left for future works.
By analyzing the per capita income, we observe that white citizens earn more than the other races in all the regions, except when analyzing the segregation between whites and Asians, since Asian citizens have a similar income to white citizens. Regarding the segregation between white and black citizens, we verify that black citizens earn less than white citizens in all the regions. Furthermore, the inequality between white and black citizens is more significant in the areas of a high density of population of both races. The Gini coefficient confirms this result. We show that it is higher in regions with a high population density of two or more races.
Furthermore, we study the segregation between white and black and the segregation between white and Hispanic citizens. We analyze the tracts that change population density from 1990 to 2010 from regions of a high density of black, Hispanic, or overlap with white citizens to a region where white citizens are the only ones to present a high population density. Our results indicate that the per capita income and properties values increased more than the city average in this region. Conversely, in the tracts that migrated from a region of overlap to a region with a high population density of only black or Hispanic citizens, the per capita income and the properties values increased less than the average.
Focusing on the segregation between white and black citizens, we analyze the flux of white and black citizens as a function of the variation of the properties values. Where the flux of white citizens is positive, the real state properties values increased more than the city average, while, where the flux of black citizens is positive, the properties values increased less than the city average. Therefore, our analysis suggests that the flux of ethnic groups with higher income increases the overall cost of living in a given area, evicting the lower-income population. Although this is the standard explanation for the gentrification phenomenon, the present work provides a technical and deterministic method of diagnosing it in real-world data sets. We hope that this may help to better understand the role of the forces that create the patterns of city segregation by the use of agent-based modeling [52, 53, 54].
Previous studies [34–36] questioned the effects of gentrification in the neighborhood of Harlem and the borough of Brooklyn. Here, by clustering the region of a high density of black citizens, we calculated the displacements of the clusters including an area inside the neighborhood of Harlem, and inside the borough of Brooklyn to be, respectively 1.55 km and 1.57 km in 20 years. These results confirm in a quantitative way the displacement of black citizens in Harlem and the borough of Brooklyn.
Data Availability Statement
Data Availability Section must read: All the data used in this paper is extracted from the National Historical Geographic Information System (NHGIS) [55]. The platform provides population, housing, agricultural, and economic data with GIS compatible boundary files for geographic units in the United States from 1790 to the present. Population data has been extracted from the platform according to race, per capita income data, and the number of owner-occupied housing units by value.
Author Contributions
FO, AG, HM, and JA contributed to the conception and formulation of the project. FO, SS, AM, AG, HM, and JA contributed to the analysis and writing of the manuscript.
Funding
We gratefully acknowledge CNPq, CAPES, FUNCAP, and the National Institute of Science and Technology for Complex Systems in Brazil for their financial support.
Conflict of Interest
The authors declare that the research was conducted in the absence of any commercial or financial relationships that could be construed as a potential conflict of interest.
Publisher’s Note
All claims expressed in this article are solely those of the authors and do not necessarily represent those of their affiliated organizations, or those of the publisher, the editors and the reviewers. Any product that may be evaluated in this article, or claim that may be made by its manufacturer, is not guaranteed or endorsed by the publisher.
Acknowledgments
We especially thank our colleagues and friends of the Complex System group of the Universidade Federal do Ceará for the countless discussions, in particular Samuel Morais da Silva.
Supplementary Material
The Supplementary Material for this article can be found online at: https://www.frontiersin.org/articles/10.3389/fphy.2021.777761/full#supplementary-material
References
1. Chodrow PS. Structure and Information in Spatial Segregation. Proc Natl Acad Sci USA (2017) 114(44):11591–6. doi:10.1073/pnas.1708201114
2. Roberto E, Hwang J. Barriers to Integration: Physical Boundaries and the Spatial Structure of Residential Segregation (2017). arXiv. 2017; arXiv: 1509.02574.
3. Roberto E. The Divergence Index: A Decomposable Measure of Segregation and Inequality (2015). arXiv. 2015. arXiv: arXiv:1508.01167.
4. Louf R, Barthelemy M. Patterns of Residential Segregation. PLoS One (2016) 11(6):e0157476. doi:10.1371/journal.pone.0157476
5. Roberto E. The Spatial Proximity and Connectivity Method for Measuring and Analyzing Residential Segregation. Sociological Methodol (2018) 48(1):182–224. doi:10.1177/0081175018796871
6. Firebaugh G, Farrell CR. Still Large, but Narrowing: The Sizable Decline in Racial Neighborhood Inequality in Metropolitan America, 1980-2010. Demography (2016) 53(1):139–64. doi:10.1007/s13524-015-0447-5
7. Lichter DT, Parisi D, Taquino MC. Toward a New Macro-Segregation? Decomposing Segregation within and between Metropolitan Cities and Suburbs. Am Sociol Rev (2015) 80(4):843–73. doi:10.1177/0003122415588558
8. S. Fowler C. Segregation as a Multiscalar Phenomenon and its Implications for Neighborhood-Scale Research: the Case of South Seattle 1990-2010. Urban Geogr (2016) 37(1):1–25. doi:10.1080/02723638.2015.1043775
9. Boustan LP. Racial Residential Segregation in American Cities. The Oxford Handbook of Urban Economics and Planning (2012). doi:10.1093/oxfordhb/9780195380620.013.0015Racial Residential Segregation in American Cities
10. Logan JR, Stults BJ. The Persistence of Segregation in the Metropolis: New Findings from the 2010 Census. 2010. Available at: https://s4.ad.brown.edu/Projects/Diversity/Data/Report/report2.pdf(Accessed 4th September 2020).
11. Watson T. Inequality and the Measurement of Residential Segregation by Income in American Neighborhoods. Rev Income Wealth (2009) 55(3):820–44. doi:10.1111/j.1475-4991.2009.00346.x
12. Reardon SF, Farrell CR, Matthews SA, O’Sullivan D, Bischoff K, Firebaugh G. Race and Space in the 1990s: Changes in the Geographic Scale of Racial Residential Segregation, 1990-2000. Soc Sci Res (2009) 38:55–70. doi:10.1016/j.ssresearch.2008.10.002
13. Reardon SF, Matthews SA, O’Sullivan D, Lee BA, Firebaugh G, Farrell CR, et al. The Geographic Scale of Metropolitan Racial Segregation. Demography (2008) 45(3):489–514. doi:10.1353/dem.0.0019
14. Jargowsky PA, Kim J. (2018) A Measure of Spatial Segregation: The Generalized Neighborhood Sorting Index. National Poverty Center Working Paper Series. Available at: http://www.npc.umich.edu/publications/working_papers/.(Accessed 12th March 2018).
15. Logan JR, Stults BJ, Farley R. Segregation of Minorities in the metropolis: Two Decades of Change. Demography (2004) 41(1):1–22. doi:10.2307/151521010.1353/dem.2004.0007
16. Reardon SF, O'Sullivan D. 3. Measures of Spatial Segregation. Sociological Methodol (2004) 34:121–62. doi:10.1111/j.0081-1750.2004.00150.x
17. Acevedo-Garcia D, Lochner KA, Osypuk TL, Subramanian SV. Future Directions in Residential Segregation and Health Research: A Multilevel Approach. Am J Public Health (2003) 93(2):215–21. doi:10.2105/AJPH.93.2.215
18. Charles CZ. The Dynamics of Racial Residential Segregation. Annu Rev Sociol (2003) 29:167–207. doi:10.1146/annurev.soc.29.010202.100002
19. Reardon SF, Firebaugh G. 2. Measures of Multigroup Segregation. Sociological Methodol (2002) 32(1):33–67. doi:10.1111/1467-9531.00110
20. Williams DR, Collins C. Racial Residential Segregation: A Fundamental Cause of Racial Disparities in Health. Public Health Rep (2001) 116(5):404–16. doi:10.1093/phr/116.5.40410.1016/s0033-3549(04)50068-7
21. Fang J, Madhavan S, Bosworth W, Alderman MH. Residential Segregation and Mortality in New York City. Soc Sci Med (1998) 47(4):469–76. doi:10.1016/S0277-9536(98)00128-2
22. Massey DS, Denton NA. American Apartheid. Cambridge: Harvard Univ Pr. (1998). isbn-10: 0674018214.
23. Massey DS, Denton NA. The Dimensions of Residential Segregation. Social Forces (1988) 67(2):281–315. doi:10.2307/2579183
24. Winship C. A Revaluation of Indexes of Residential Segregation. Soc Forces (1977) 55(4):1058–66. doi:10.2307/2577572
25. Duncan OD, Duncan B. A Methodological Analysis of Segregation Indexes. Am Sociological Rev (1955) 20:210–7. doi:10.2307/2088328
26. Helbrecht I. Gentrification and Displacement. SpringerVS (2018) 1–7. doi:10.1007/978-3-658-20388-7_1
27. Brown-Saracino J. Explicating Divided Approaches to Gentrification and Growing Income Inequality. Annu Rev Sociol (2017) 43:515–39. doi:10.1146/annurev-soc-060116-053427
28. Lees L. Gentrification, Race, and Ethnicity: Towards a Global Research Agenda. City & Community (2016) 15(3):208–14. doi:10.1111/cico.12185
29. Freeman L. Neighbourhood Diversity, Metropolitan Segregation and Gentrification: What Are the Links in the US. Urban Stud (2009) 46(10):2079–101. doi:10.1177/0042098009339426
30. Freeman L, Braconi F. Gentrification and Displacement New York City in the 1990s. J Am Plann Assoc (2004) 70(1):39–52. doi:10.1080/01944360408976337
32. Curran W. 'From the Frying Pan to the Oven': Gentrification and the Experience of Industrial Displacement in Williamsburg, Brooklyn. Urban Stud (2007) 44(8):1427–40. doi:10.1080/00420980701373438
33. Zuk M, Bierbaum AH, Chapple K, Gorska K, Loukaitou-Sideris A. Gentrification, Displacement, and the Role of Public Investment. J Plann Lit (2017) 33(1):31–44. doi:10.1177/0885412217716439
34. Zukin S, Trujillo V, Frase P, Jackson D, Recuber T, Walker A. New Retail Capital and Neighborhood Change: Boutiques and Gentrification in New York City. City & Community (2009) 8(1):47–64. doi:10.1111/j.1540-6040.2009.01269.x
35. Lees L. Super-gentrification: The Case of Brooklyn Heights, New York City. Urban Stud (2003) 40(13):2487–509. doi:10.1080/0042098032000136174
36. Schaffer R, Smith N. The Gentrification of Harlem. Ann Assoc Am Geogr (1986) 76(3):347–65. doi:10.1111/j.1467-8306.1986.tb00124.x
37. Brummet Q, Reed D. The Effects of Gentrification on the Well-Being and Opportunity of Original Resident Adults and Children. FRB of Philadelphia (2019) 19–30. Working Paper No. doi:10.21799/frbp.wp.2019.30
38. Dmowska A, Stepinski TF, Netzel P. Comprehensive Framework for Visualizing and Analyzing Spatio-Temporal Dynamics of Racial Diversity in the Entire United States. PLoS One (2017) 12(3):e0174993. doi:10.1371/journal.pone.0174993
39. Operti FG, Oliveira EA, Carmona HA, Machado JC, Andrade JS. The Light Pollution as a Surrogate for Urban Population of the US Cities. Physica A: Stat Mech its Appl (2018) 492:1088–96. doi:10.1016/j.physa.2017.11.039
40. Caminha C, Furtado V, Pequeno THC, Ponte C, Melo HPM, Oliveira EA, et al. Human Mobility in Large Cities as a Proxy for Crime. PLoS One (2017) 12(2):e0171609. doi:10.1371/journal.pone.0171609
41. Oliveira EA, Andrade JS, Makse HA. Large Cities Are Less green. Sci Rep (2014) 4:4235. doi:10.1038/srep04235
42. Rozenfeld HD, Rybski D, Gabaix X, Makse HA. The Area and Population of Cities: New Insights from a Different Perspective on Cities. Am Econ Rev (2011) 101(5):2205–25. doi:10.1257/aer.101.5.2205
43. Rozenfeld HD, Rybski D, Andrade JS, Batty M, Stanley HE, Makse HA. Laws of Population Growth. Proc Natl Acad Sci (2008) 105(48):18702–7. doi:10.1073/pnas.0807435105
44. Makse HA, Andrade JS, Batty M, Havlin S, Stanley HE. Modeling Urban Growth Patterns with Correlated Percolation. Phys Rev E (1998) 58(6):7054–62. doi:10.1103/PhysRevE.58.7054
45. Makse HA, Havlin S, Stanley HE. Modelling Urban Growth Patterns. Nature (1995) 377:608–12. doi:10.1038/377608a0
46. Arcaute E, Hatna E, Ferguson P, Youn H, Johansson A, Batty M. Constructing Cities, Deconstructing Scaling Laws. J R Soc Interf (2015) 12(102):20140745. doi:10.1098/rsif.2014.0745
47. Arcaute E, Molinero C, Hatna E, Murcio R, Vargas-Ruiz C, Masucci AP, et al. Cities and Regions in Britain through Hierarchical Percolation. R Soc Open Sci (2016) 3(4):150691. doi:10.1098/rsos.150691
48.US Census Bureau. (2018) US Census Bureau. Available at: http://www.census.gov (Accessed 9th March 2018)
49. M.K V, K K. A Survey on Similarity Measures in Text Mining. Mlaij (2016) 3(1):19–28. doi:10.5121/mlaij.2016.3103
51. Gini C. Variabilità e mutabilità. Reprinted in Pizetti. Salvemini. Memorie di metodologica statistica. Rome: Libreria Eredi Virgilio Veschi (1955).
52. Schelling TC. Dynamic models of segregation. J Math Sociol (1971) 1(2):143–186. doi:10.1080/0022250X.1971.9989794
53. Clark WA. Residential preferences and neighborhood racial segregation: A test of the Schelling segregation model. Demography (1991) 28(1):1–19. doi:10.2307/2061333
54. Clark WA, Fossett M. Understanding the social context of the Schelling segregation model. Proc Natl Acad of Sci USA (2008) 105(11):4109–14. doi:10.1073/pnas.0708155105
Keywords: physics of cities, census, racial residential segregation, gentrification, city clustering algorithm
Citation: Operti FG, Moreira AA, Reis SDS, Gabrielli A, Makse HA and Andrade JS (2022) Dynamics of Racial Residential Segregation and Gentrification in New York City. Front. Phys. 9:777761. doi: 10.3389/fphy.2021.777761
Received: 15 September 2021; Accepted: 16 November 2021;
Published: 03 February 2022.
Edited by:
Haroldo V. Ribeiro, State University of Maringá, BrazilReviewed by:
Luiz G. A. Alves, Northwestern University, United StatesSebastian Goncalves, Federal University of Rio Grande do Sul, Brazil
Copyright © 2022 Operti, Moreira, Reis, Gabrielli, Makse and Andrade. This is an open-access article distributed under the terms of the Creative Commons Attribution License (CC BY). The use, distribution or reproduction in other forums is permitted, provided the original author(s) and the copyright owner(s) are credited and that the original publication in this journal is cited, in accordance with accepted academic practice. No use, distribution or reproduction is permitted which does not comply with these terms.
*Correspondence: José S. Andrade Jr., soares@fisica.ufc.br