A Conversion for Average Grain Size Based on Gamma Ray Well Log: Application in the Second Member of Xujiahe Formation of Anyue Area, Sichuan Basin
 Liang Chen
 Hancheng Ji
 Nansheng Qiu
 Liang Zhang
- 1State Key Laboratory of Petroleum Resources and Prospecting, Beijing, China
- 2China College of Geosciences, China University of Petroleum, Beijing, China
The grain sizes of clastic rock sediments serve as important depositional indicators that are significant in sedimentology and petroleum geology studies. Generally, gamma ray, spontaneous-potential and resistivity well logs are utilized to qualitatively characterize variations in sediment grain size and determine the lithology in clastic reservoirs. However, grain size analysis of modern sedimentary samples collected from active rivers and deltas indicates that the percentage of fine depositional component has a logarithmic relationship with the average grain size in delta and river systems. Using the linear relationship to process the lithology interpretation, siltstones or mudstone is likely to be interpreted as sandstone. Therefore, a logarithmic conversion formula was built up between the gamma ray logs and measured grain size for the second member of the Xujiahe Formation of Anyue Area in the Sichuan Basin. Using the formula, the average grain size and lithology of the exploration wells were determined for the interest intervals. Furthermore, the calculated grain size gives a better understanding of the controlling factors of hydrocarbon-bearing reservoirs in the study area.
Introduction
The grain size of fluvial-sandy deposition reflects hydrodynamic features and sedimentary cycles and is thus important in the analysis of depositional environments [1–5]. In addition, the grain size and sorting has a strong influence on the original porosity of hydrocarbon reservoirs [6, 7], and they are usually utilised in reservoir evaluation [8, 9]. To get the grain size information in subsurface settings, it is commonly assumed that the value of the gamma ray log has an inverse relationship with the sediment grain size, especially for sandy deposits. Many studies on sedimentology, stratigraphy, and other similar subjects generally utilise the gamma ray well log in the analysis of sedimentary facies and sequence cycles [10–15]. The shape of the GR curve is generally thought to be similar to the grain size curve presented in [16] phi, which is derived from the logarithm of the grain size. [17] have studied the grain size distributions of 47 subsurface samples from marine delta depositions of the Lower Cretaceous Safaniya Sandstone Member in Northwest Saudi Arabia, and the results indicate that the average grain size in phi has a linear relationship with the shale content, which implies a logarithmic relationship between raw grain size and fine sediments. They also recommended using well logs that are related to the content of fine depositions to calculate the average grain size but did not perform further work.
Another important application of the gamma ray log is to quantitively calculate the shale content, and according to the shale content the lithology in sandstone reservoirs could be determined [18]. In petroleum borehole, the value of a gamma ray well log is controlled by the content of shales and clays which are considered as the dominant factor due to the strong absorption to radioactive substances [18–20]. Moreover, the relationship between the gamma ray value and shale content is not always linear, and a modification maybe needed [21].
Either the non-linear relationship between the gamma value and grain size or shale content may mislead the estimation of sandstone thickness and distribution in sandstone reservoirs using gamma ray logs. However, the influence of the non-linear relationships mentioned above on the sandstone reservoir studies has not been well evaluated yet. In the present study, modern sedimentary samples from Qinghai Lake and Hailar River, China, were used for grain size analysis to investigate the relationship between grain size and fine-grain deposits in river depositional environments as a supplementary for the study of [17]; and a logarithmic empirical formula was built up between the gamma ray well log and grain size for the second member of the Xujiahe Formation in the Anyue Area, Sichuan Basin. In terms of the formula, the grain size, lithology and sandstone thickness were determined for the interest intervals of the study area. Compared with the sandstone thickness determined by the shale content calculate from gamma ray logs, the possible error caused by using gamma ray logs to estimate lithology was evaluated. Furthermore, the raw grain size of the study area, converted from the gamma ray value using the logarithmic empirical formula, provides an opportunity to further assess the hydrocarbon possibility of the studied reservoirs. The present study attempts to emphasize the significance of the non-linear relationship between gamma ray value and grain size and the resultant influence on the grain size and lithology estimation.
Geological Settings
The Xujiahe Formation of Anyue Area, Sichuan Basin
Sichuan Basin is an important petroliferous basin in China and belongs to one of the second order tectonic units of the northwest Yangtze platform (Figure 1A). This basin is surrounded by several large-scale folds and boundary faults, and has experienced long-term tectonic evolution including the Caledonian orogeny in the Late Silurian, Indosinian movement in the Late Middle Triassic Series and Yanshan movement in the Late Jurassic [22–25]. The Anyue Area is situated in the centre of the Sichuan Basin with an area of 1,500 km2 (Figure 1A). The Late Triassic Xujiahe Formation represents the development of a gentle slope formed on a carbonate basement in the Anyue Area, and the onset of clastic sediment input to the study area [26, 27] (Figure 1B).
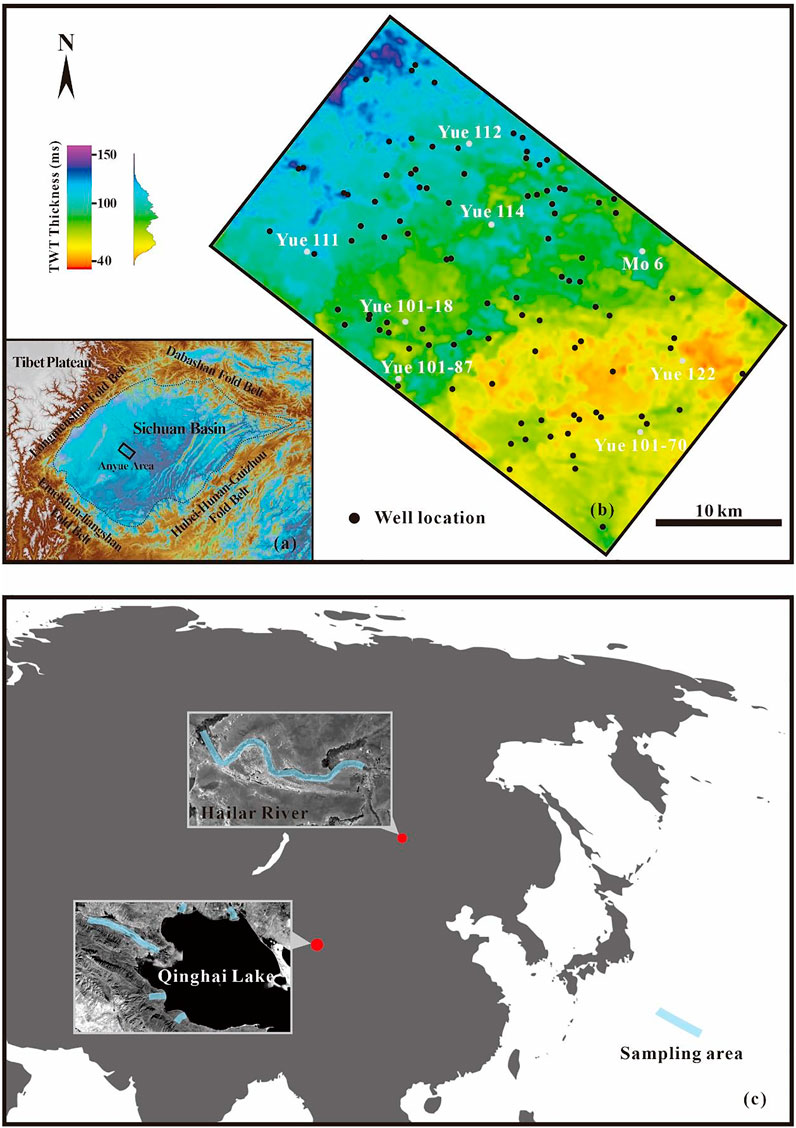
FIGURE 1. (A) shows the location of the Anyue Area in the Sichuan Basin, and illustrates the primary tectonic structures around the Sichuan Basin. (B) Isochore map of time thickness of the second member of the Xujiahe Formation showing the exploration wells. The time thickness map was developed from 3D seismic data. The names of the key wells are shown in (B), and the location of these key wells is marked by grey points. (C) location map of the Hailar River and Qinghai Lake showing the sampling area.
The Xujiahe Formation, commonly divided into six members, was deposited during the Late Triassic period from 205 to 195 Ma with a thickness of a hundred meters of continental sediments [28]. The first, third and fifth members are dominated by mudstone, shale and siltstone with some beds of carbonaceous shale and coal. In the second, fourth and sixth members, the lithology is characterised by fine to medium-grained sandstone with grey colour [28]. The second member of Xujiahe Formation records the lake level fluctuation and lacustrine and delta deposits with a thickness of 50–80 m (Figure 2). The study interval, i.e., the second member is divided into five sub-members.
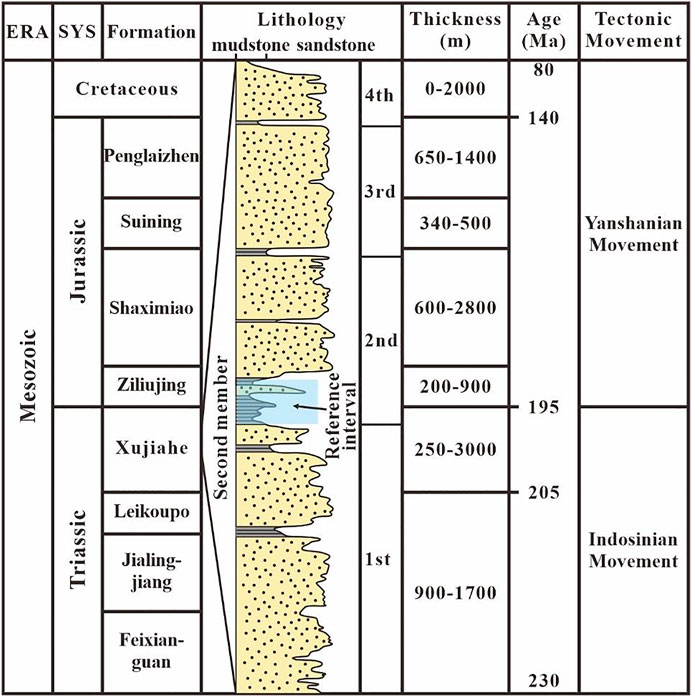
FIGURE 2. Stratigraphy framework of the study area showing the formation age and thickness, the tectonic movements and the lithology of the second member of the Xujiahe Formation (Modified from [28]). The blue transparent block indicates the reference interval for the normalization of gamma ray well logs.
Qinghai Lake and Hailar River
Qinghai Lake, located in the north-eastern part of Qinghai-Tibet Plateau, is the largest interior lake in China, and was formed through rifting with an area of 4,800 km2 [29] (Figure 1C). Two fan delta systems were built along the northern lakeshore with the Shaliu River and the Hargai River flowing into the lake. The Heima River from the southern mountain range forms the third largest fan delta of the Qinghai Lake on the southern lakeshore. The Buha River, as the dominant runoff, reach the lake from the west and generates the largest delta of the Qinghai Lake on the western lakeshore.
The Hailar River is a large-scale meandering river with a length of 655 km and a drainage area of 54.8 thousand km2 in north-eastern China [30] (Figure 1C). It discharges from the western side of the Great Khingan and flows from east to west. Flood peaks occur twice a year in May and August, and average annual runoff of the Hailar River is 36.62 million m3 [30].
Dataset and Methodology
Dataset
One hundred and eleven modern sedimentary samples were collected from the Qinghai Lake and Hailar River to conduct the grain size analysis. The samples were from channel-related deposits on the fan delta, braided river plain or meandering rivers. Only sandy sediments were selected, while conglomerates were not used. Twenty-two of the collected samples were obtained from the bottom of active channels, sixty samples were obtained from point bars, and twenty-nine samples were obtained from abandoned channels.
To study the grain size information and lithology of the Xujiahe Formation, 112 samples from five wells drilling the Xujiahe Formation were provided by the Sinopec Southwest Oil and Gas Branch. Sixty-eight wells with gamma ray logs were utilised to calculate the average grain size, map the distribution of sandy depositions. Furthermore, two hundred- and seventy-meters drilling cores of five wells were employed to interpret depositional environments combined with the analysis of the geometries of well logs. Sixty-eight production reports of the study wells were acquired from the oil company to evaluate the relationship between calculated grain size and hydrocarbon possibility.
Method for Grain Size Analysis
The laser particle size analyser, Mastersizer 3000 produced by Malvern was utilised to perform the grain size analysis for modern sediment samples. This instrument extracts signals of grain size distribution by measuring the intensity of scattered light across the sample solvent. The device can measure grain sizes with ranges between 0.01 and 3,500 μm, covering clay, silt, fine-grained sand, medium-grained sand and coarse-grained sand. The measurement has a repeatability error of <0.5% and an accuracy error of <1%. A wet process was used meaning that the modern sedimentary samples were put into a liquid disperser (distilled water in the present study) The testing time for the samples and the background value was set as 10 s, and each sample was tested 3 times to ensure the repeatability of result. Between subsequent measurements, the sample container was cleaned by distilled water until no grain size signal was received to exclude no sample pollution occurred.
Since a lot of particles of the subsurface samples from the Xujiahe Formation, such as quartz, feldspar et al., are cracked duo to the strong compaction (discussed in the section of diagenesis), the grain size cannot be assessed using the laser particle size analyser. As a consequence, the samples were processed into casting thin sections, and the average grain size of the subsurface samples was determined using the Olympus BX51 transmission and reflecting microscope. For each sample, 100 grains from ten views were selected randomly and manually, and their diameter was measured. The average value of the measured diameter was used to characterise the average grain size.
Petrology and Interpretation of Sedimentary Facies
It is commonly thought that the radioactivity of sandstone is mainly caused by clay minerals [18], and through diagenesis, a large amount of authigenic clay minerals can be generated. Therefore, it is necessary to study the petrology and diagenesis of subsurface samples to assess the influence of authigenic clay minerals on radioactivity. Casting thin sections were observed under Olympus B51 transmission and reflected microscope, and the petrological classification was plotted in a triangle chart. The subsurface samples were ground into powders for X-ray diffraction analysis, which was carried out using a Bruker D2 Phaser instrument providing the mineralogical composition of subsurface samples.
To provide a constrain on depositional environments of subsurface samples, sedimentary structures observed from cores and the well log responses were integrated to identify the sedimentary facies of the second member of Xujiahe Formation of the Anyue Area.
Lithology Interpretation and Sandstone Content
There is a regional mudstone interval in the second member of the Xujiahe Formation which is defined as a reference interval (Figure 2). The gamma ray well logs used in the present study have been normalized referring to this interval: the gamma ray readings of this interval represent 100% shale and are defined as the maximum value. The Depth calibration was conducted by the Research Institute of Southwest Oil and Gas Field. Consequently, the normalization was conducted by the following formula:
In the present study, the lithology is determined by the grain size which is calculated from the normalized gamma ray readings based on an empirical formula between gamma ray logs and measured grain size, and the sandstone is defined as the calculated grain size over 0.01 mm. The lithology interpretation provided by the Sichuan Oil Field was used in this paper as a comparison. In the results of the Sichuan Oil Field, the sandstone is determined based on the shale content calculated using the following formula
where Vsh is the volume proportion of shale, GR is the given gamma ray reading, GRmin and GRmax represent the 0% shale and 100% shale, respectively. It commonly is thought that the sandstone has a shale volume lower than 50% [18]. In the present study, the normalized gamma ray readings are equal to Vsh.
Results
Grain Size Analysis
The results of representative modern sedimentary samples were shown in the cumulative frequency diagram (Figure 3). The grain size was represented by the average, and the fine sediment content was defined as the volume percentage of particles with a diameter lower than 0.01 mm.
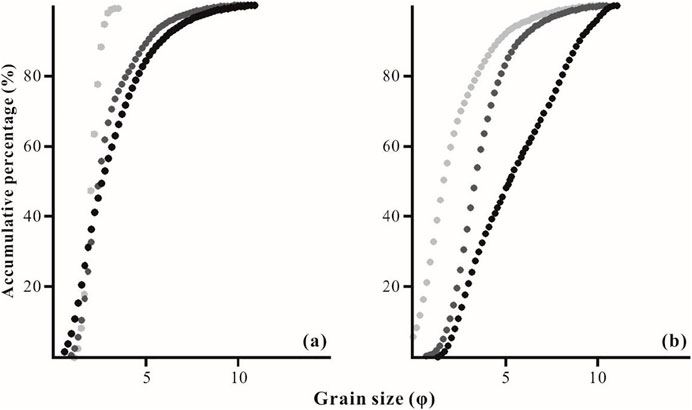
FIGURE 3. Cumulative curves of representative modern sediment samples. (A) showing the samples from Hailar River, and (B) for samples from Qinghai Lake. The curves have a two-segment-line feature, and the grey, dark grey and black points represent the samples with the good, medium and poor sorting in these two areas, respectively.
The probability cumulative percentage diagram of samples from the Hailar River shows that the curves have two segmented straight lines (Figure 3A). The average grain size varies between 0.04 and 0.42 mm, and these samples are well sorted with sorting coefficient ranging from 1.52 to 7.8 and an average value of 2.35, where the sorting coefficient is defined as the ratio of raw grain size accumulating to 25% to that accumulating to 75%. The average proportion of the fine sediments (grain size <0.01 mm) is 6.7% with a range of 25.5 to 0%. The cross-plot in Figure 4A suggests an exponential relationship between the volume percentage of fine sediments and the average grain size. The volume percentage of fine sediments shows sharp decrease with increasing average grain size until the latter reaches 100 μm. However, further increase of the average grain size results only in a slight reduction of the fine fraction. The formula fit to the data is shown in Figure 4A.
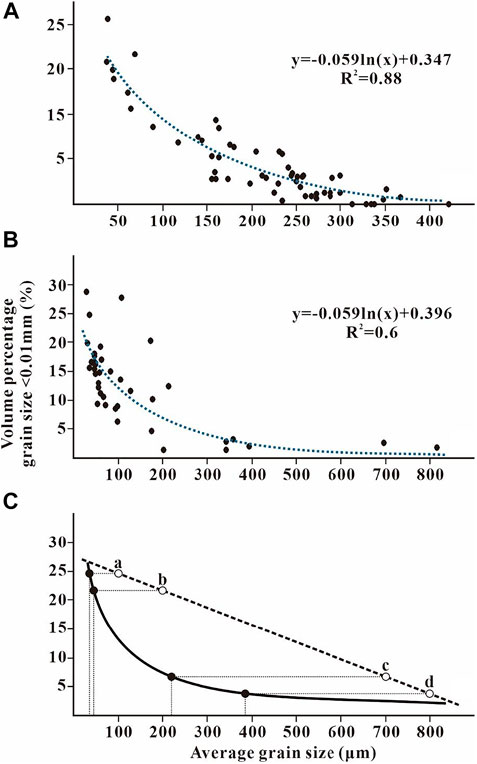
FIGURE 4. Scatter diagrams of average grain size against percentage content of fine sediments (grain size <0.01 mm). (A) and (B) represent samples from Hailar River and Qinghai Lake, respectively. Two formulas, which fit the points, are shown in the panels and the dotted lines represent the fitting trend. In (C), the dotted line represents the linear relationship used to estimate the grain size by fine sediments, and the black line presents the relationship between the grain size and fine sediments. The hollow points (a–d) give four examples of the estimation of grain size, and the corresponding black points showing the true grain size with the same fine sediment content.
The grain size distribution of samples from the Qinghai Lake also has a bimodal distribution shown in the frequency diagram (Figure 3B). The average grain size ranges from 0.01 to 0.65 mm, which corresponds to mud, silt and fine-grained to coarse-grained sand. The sorting of the samples was worse than their counterparts from the Hailar River, with an average sorting coefficient of 6.74. The volume percentage of the fine fraction varies between 28.7 and 0.8%, and it also has an exponential relationship with the average grain size which can be described with the formula shown in Figure 4B. The rate of decline in the volume percentage of fine sediments also decreases sharply at the average grain size of 100 μm.
The relationship between the average grain size and the proportion of the fine fraction is very similar in the two datasets. Therefore, we conclude that in river systems, the proportion of the fine fraction has an exponential relationship with the average grain size. A formula is built up, integrating the data of Hailar River and Qinghai Lake, to express the relationship between grain size and fine sediments:
where G is the average grain size in μm, f is the proportion of fine sediments. This formula implies that (1) the fine sedimentary composition has an exponential relation with the average grain size in the studied fluvial depositional environment and (2) the proportion of fine sediments becomes insensitive to changes in the average grain size if the latter exceeds 100 μm.
Well Yue 112 has full drilling cores of 150 m length for the second member of the Xujiahe Formation, and 96 samples were collected at intervals not exceeding 1 m. This allowed us to investigate the relationship between the average grain size and the values of gamma ray logs and the clay content obtained from the XRD analysis. The clay mineral content, which includes both the original and the authigenic clay minerals in the subsurface samples, was determined with X-ray diffraction. The plot of clay mineral content against average grain size shows the existence of no apparent relationship between the clay mineral content and the average grain size (Figure 5B). In contrast, the plot of the average grain size against the normalized gamma ray readings shows a negative relationship. It can be inferred that the gamma ray log is associated with the originally clay minerals related to the, and the authigenic clay minerals formed during diagenesis do not contribute to the radioactivity of sedimentary rocks. Therefore, for our study area, the gamma ray log can be suggested that the gamma ray well log could reflect original-deposition signals of fine sediments and is properly used in grain size assessment in terms of the logarithmic relationship.
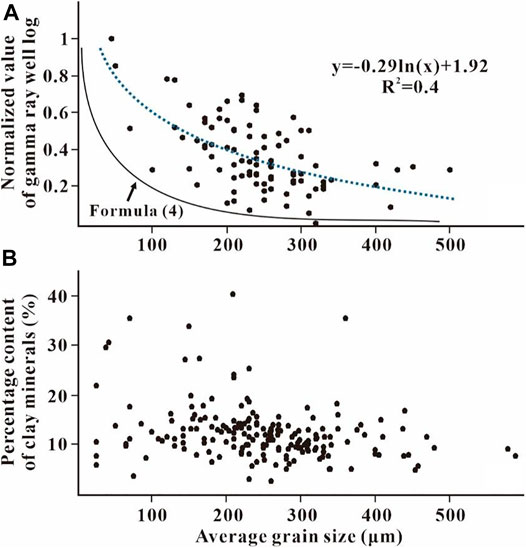
FIGURE 5. Scatter diagrams of the average grain size against normalised value of gamma ray well logs (A) and percentage content of clay minerals measured by X-ray diffraction (XRD) (B). The formula in (A) using a logarithmic format to fit the relationship, and the dotted line represents the fitting trend. (B) Shows an obscure relationship between the average grain size and clay mineral content.
Petrology and Diagenesis of the Xujiahe Formation
Results of microscope observations and X-ray diffraction (XRD) for subsurface samples are shown in the triangular chart (Figure 6) and mineral content histogram (Figure 7), respectively. The observation of the thin section suggests that most common lithology is feldspathic quartz sandstone followed by quartz sandstone and lithic quartz sandstone, indicating a high compositional maturity (Figure 6). Figure 7 illustrates the mineral content yielded by XRD. The volume proportion of quartz ranges from 26 to 91% with an average value of 65.9%. Plagioclase has a maximum proportion of 32% with an average of 13%; it is also commonly observed through transitional microscope (Figure 8). In contrast, orthoclase is rarely observed and comprises of an average content of 9%. The percentage content of total feldspar varies between 48.8 and 5.2% with an average value of 20.1%. Clay minerals have a maximum content of 40% with an average of 12%. The calcite and dolomite are encountered occasionally and generally account for approximately 7%, with the maximum content reaching up to 30%. Other minerals, including ankerite and anatase, are detected by XRD (Figure 7). Lithic fragments, of which biotite, flint and quartz are the most dominant in that order, are encountered occasionally (Figures 8B,D). The volume proportion of lithic fragments varies between 20 and 2% with an average value of 7%. Interstitial matter consisting of calcsparite cements with an average content of 5% and some matrix, and authigenic clay minerals are also observed (Figure 8C).
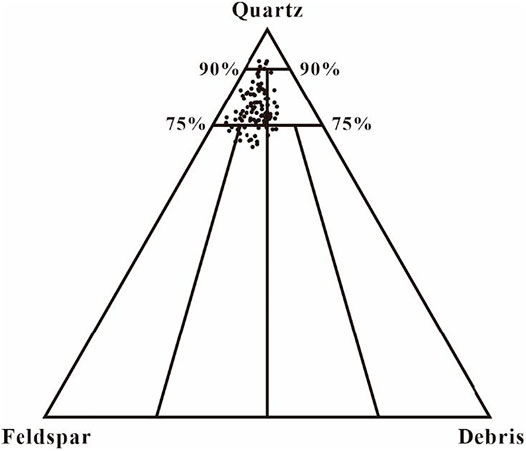
FIGURE 6. Triangle chart of lithology showing the sandstone type of the study interval dominated by feldspathic quartz sandstone.
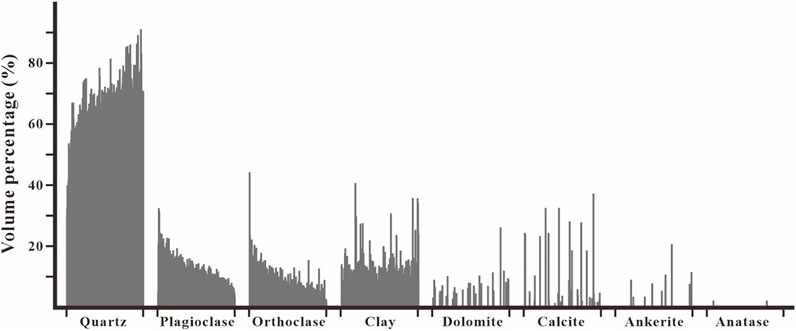
FIGURE 7. Histogram of X-ray diffraction (XRD) results showing the volume percentage of main minerals of each subsurface sample.
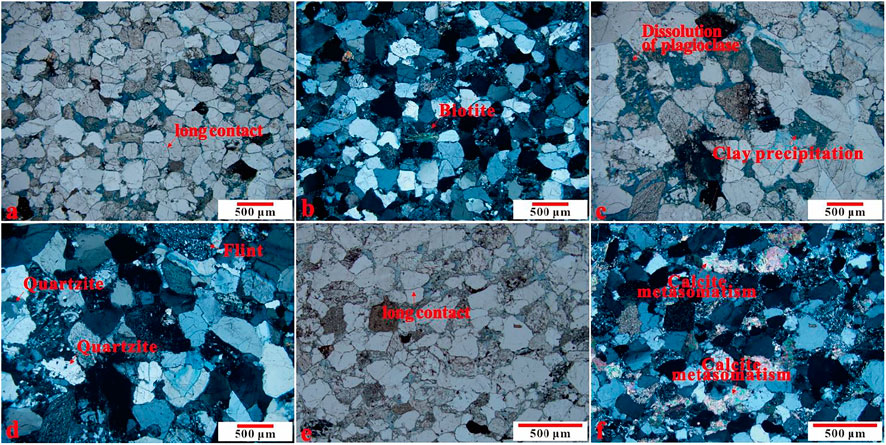
FIGURE 8. Micrographs of subsurface samples (A) and (B) Medium-grain feldspathic quartz sandstone showing strong compaction with long contact (A) and biotite, which is a common lithic fragment in the study intervals (B), Well Yue 112, 2,386 m, plane-polarised and orthogonal-polarised light, respectively; (C) and (D) Coarse-grain feldspathic quartz sandstone showing plagioclase dissolution and clay precipitation as a result of feldspar dissolution (C) and representative lithic fragment (D), Well Yue 112, 2,452 m, plane-polarised and orthogonal-polarised light, respectively; (E) and (F) Fine-grain feldspathic quartz sandstone showing strong compaction with long contact (E) and calcite metasomatism (F), Well Yue 112, 2,470 m, plane-polarised and orthogonal-polarised light, respectively.
Diagenesis, especially feldspar dissolution in an environment without difunctional carboxyl would result in the precipitation of clay minerals [31], which may have a significant content of radioactive elements. This would cause that the gamma ray log does not reflect the proportion of the primary fine-grained material. Therefore, it is necessary to investigate the diagenesis of subsurface samples to reveal whether clay precipitation occurs within the interval of interest.
The primary diagenetic process of the subsurface samples was compaction. Even though the present sample depth ranges between 2,700 and 2,300 m, the Xujiahe Formation was buried over 4,000 m [28]. Grains show a feature of long contact under observation through a polarising microscope (Figures 8A,E). Concave-convex or sutured contact is scarcely observed. The contact relation implies strong compaction which is corroborated by the presence of grain breakage in the thin sections (Figures 8A–C).
Metasomatism and dissolution are ways of secondary diagenesis in the studied samples. Dissolution mostly occurred in the plagioclase (Figure 8F). The average surface porosity generated by feldspar dissolution varies between 9.42 and 1%, and authigenic clay mineral precipitation can be observed (Figure 8C). The microphotographs show that crystalline calcite replaces the quartz, dissolved remnant of feldspar, feldspar and some clay matrix (Figure 8F). On account of the replacement of feldspar remnants by calcite, we suggest that feldspar dissolution is antecedent to calcite metasomatism.
Interpretation of Sedimentary Facies
Previous studies about sedimentary facies of the Xujiahe Formation in Anyue area commonly suggested that the depositional environment was either a lacustrine delta or meandering river system [27, 32–34]. Based on analyses of drilling cores and well logs, delta front and delta plain deposits were identified in the study area.
The interpreted delta front is dominated by silt, well-sorted fine-grained and medium-grained sandstones with grey or dark grey colours. Deposition of grey and dark grey fine-grained and medium-grained sandstone with fining-upward trends (Figure 10), cross-bedding, erosional base and parallel bedding (Figures 9A–C) shown in drilling cores was interpreted as subaqueous distributary channels. Bioturbation and slump structures were also observed in the beds interpreted as delta front deposits (Figure 9D). In the gamma ray well log, the subaqueous distributary channels show a box-shaped or bell-shaped geometry (see Ⅲ in Figure 10). Grey and dark grey silt and mud beds are interpreted as subaqueous inter-channel deposits (Figures 9E,F) which is featured by continuous high gamma ray readings in well logs. The interval with funnel-shaped geometry in the gamma ray log is interpreted as a mouth bar (see Ⅴ in Figure 10). Silt with wavy and horizontal bedding develops in the bottom of the mouth bar (Figures 9G,H) and coarsens upwards to fine-grained sandstone with parallel bedding and cross-bedding (Figure 10).
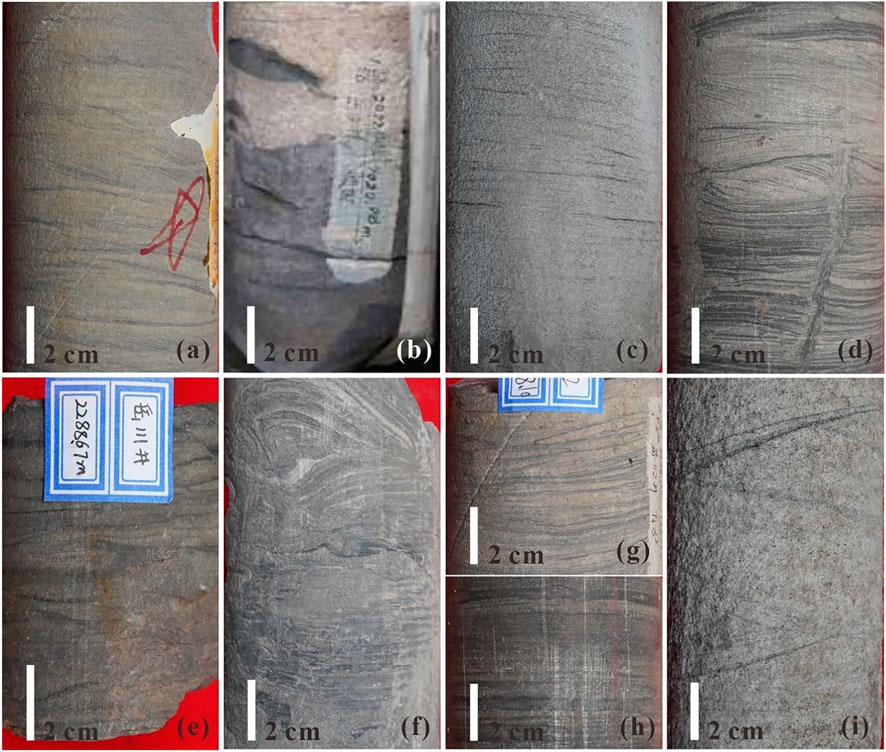
FIGURE 9. Photographs of drilling cores. (A) Fine-grained sandstone, plate cross bedding, Well Yue 112, 2,898.3 m; (B) Medium-grained sandstone, erosional base, Well Yue 3, 2,022.8 m; (C) Medium-grained sandstone, parallel bedding, Well Yue 101-87, 2,677.5 m; (D) Fine-grained sandstone interbedding mudstone, cross bedding, bioturbation and soft-sediment deformation, Well Yue 112, 2,407.7 m; (E) Silt mudstone, lenticular bedding, Well Yue 111, 2,288.6 m; (F) Siltstone, convolute bedding, Well Yue 101-87, 2,629.4 m; (G) Siltstone interbedding mudstone, wavy bedding, Well Yue 114, 2,256.5 m; (H) Mudstone, horizontal bedding, Well Yue 112, 2,348.1 m; (I) Coarse-grained sandstone, cross bedding, Well Yue 112, 2,342.3 m.
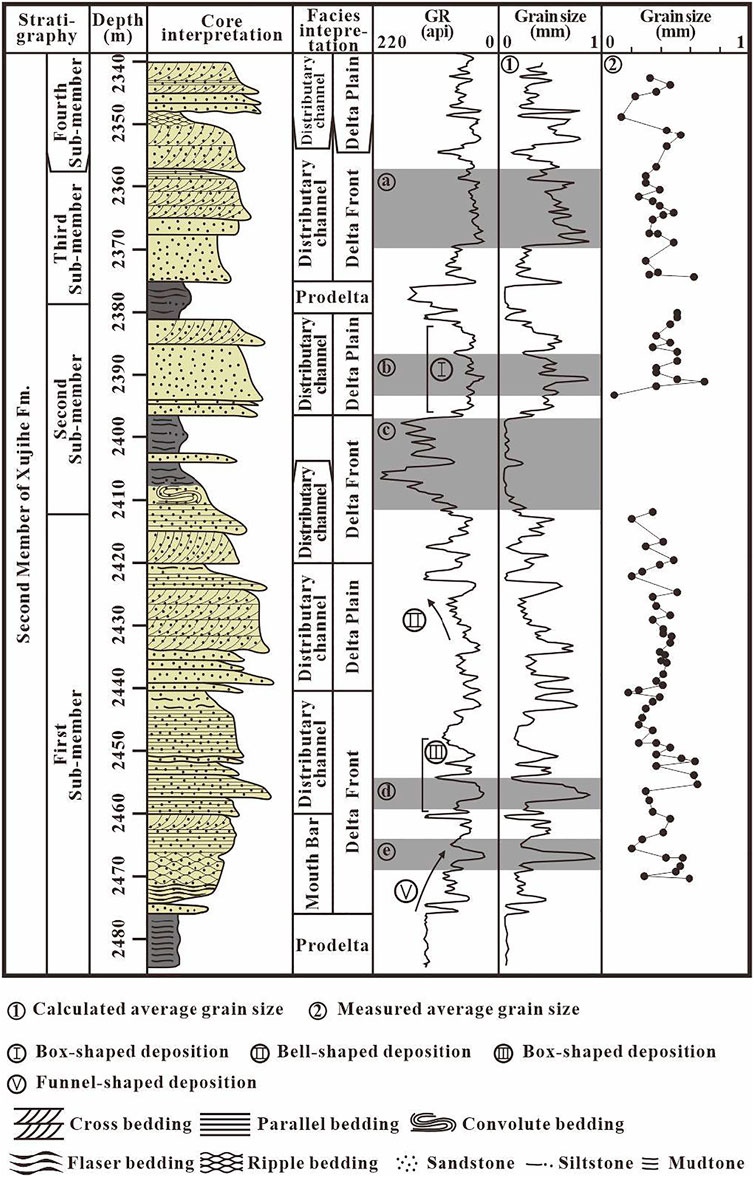
FIGURE 10. Histogram of Well Yue 112 showing drilling core log with sedimentary structure, facies interpretation, calculated grain size and measured grain size. The transparent grey blocks indicate representative difference between gamma ray well logs and the calculated grain size. Arrows with Roman numerals mark well log features for facies interpretation.
The delta plain deposits are dominated by well-sorted, medium-grained and coarse-grained sandstone of grey colour. Fine deposits were rarely observed in the cores. The deposits with parallel and cross-bedding are interpreted in terms of distributary channel fills (Figure 9G). In gamma ray well logs, these channels exhibit box-shaped or bell-shaped geometry (see Ⅰ and Ⅱ in Figure 10).
Discussion on Grain Size Calculation and Lithology Interpretation Using Gamma Ray Logs
Through the grain size analysis in the present study and the study of [17]; it has been revealed that the average grain size has a logarithmic relationship with the proportion of the fine fraction in delta and river systems (Figure 4). As discussed in the section of grain size analysis, the proportion of fine sediments decreases slowly with the increasing in the grain size. When using a linear relationship between the shale content and grain size to determine the lithology, the mis-interpretation may occur. The possible error is discussed in two circumstances below.
When using a linear relationship to evaluate the grain size and lithology using shale volume, the maximum shale volume is defined as clay or pure shale, and the minimum shale volume is defined as coarse-grained sediments. Therefore, a linear relationship between fine sediments and grain size is built up shown by the dotted line in Figure 4C. The first circumstance is for the sediments with lower grain size than 0.1 mm. In this circumstance, the grain size is a little over-estimated using the shale volume, and the predicted rangeability of the grain size with the shale volume is higher than the true variation (Figure 4C). For the circumstance with grain size higher than 0.1 mm, the grain size is more over-estimated using the linear relationship than the first circumstance, and the predicted fluctuation of grain size is much lower than the true variation (Figure 4C). Consequently, it suggests that when using a linear relationship to assess the grain size, the grain size of fine sediments is well reflected relative to the coarse sediments, but the grain size is generally over-estimated, which especially leads to regard siltstones as sandstones. Therefore, a conversion, in terms of the logarithmic relationship between average grain size and fine sediments, is needed to determine the lithology.
The gamma ray log is generally used to calculate the shale volume in clastic reservoirs, since the shale content is the predominant factor controlling the gamma ray readings [18]. However, the relationship between gamma ray logs and shale volume is not linear, and a modification for pre-Tertiary rocks has been reported by [21]. The modified shale volume is expressed as
where Vmsh is the modified shale volume, and Vsh is the shale volume calculated using Formula 1. In the present study, the gamma ray logs are normalized, and the normalized gamma ray value is equal to the shale volume (Vsh) calculated by Formula 1. Herein, the shale volume is used to represent the proportion of fine sediments. Substituting Formula 3 into the Formula 2 for f obtains
According to Formula 4, the variation of grain size following Vsh (normalized gamma ray logs) is shown in Figure 5A by the black curve. It shows a non-linear relationsip, and the tendency is similar to a logarithmic relationship between the grain size and fine sediments shown in Figure 3. Therefore, the grain size and lithology may be also mis-estimated using gamma ray logs according to a linear relationship. One thing should be noted is that the reason leading this mis-estimation is the dramatic decrease in gradient of Formula 4 around 100 μm. In this range of grain size, the lithology changes between siltstones and sandstones.
Application to the Xujiahe Formation of Anyue Area, Sichuan Basin
The interpretation of sedimentary facies suggests that the dominant depositional environments of the second member of Xujiahe Formation in the Anyue Area, Sichuan Basin, are the delta front and delta plain. Based on the grain size analysis of the modern sediment samples, a logarithmic relationship is assumed between the average grain size and the proportion of the fine material for the delta and river systems. As the logarithmic relationship, an empirical formula using logarithmic format was used to fit the relationship between the normalized gamma ray logs and grain size, and the formula is shown in Figure 5A with a correlation coefficient of 0.4. This formula indicates that the gamma ray log response appears to be sensitive to the variation in average grain size if the latter is below 100 μm. Above this grain size, the gamma ray values does not change significantly. Consequently, the average grain sizes of 68 wells were calculated using the normalized gamma ray logs based on the formula in Figure 5A obtained from Well Yue 112. Certainly, Formula 4 can be used to produce the grain size calculation using the normalized gamma ray logs, but the fitting formula built up using the data from the study area is more reasonable. As Figure 5A showing, although the Formula 4 has a similar tendency with the formula in Figure 5A, but the fitting curve of Formula 4 is under the measured grain size. This may be caused by using shale volume in Formula 4 instead of the proportion of fine sediments.
Detailed grain size information gives a better understanding of the sandstone distributioni and contributes to the evaluation of the hydrocarbon potential. In this research, we used the second member of Xujiahe Formation in the Anyue Area, Sichuan Basin, as an example to illustrate the significance of calculated grain size using the logarithmic relationship on investigating sandstone distribution and hydrocarbon potential.
Application to the Distribution of Sandstone
Comparing the variations in the values of gamma ray well logs, the calculated average grain size and measured average grain size of the Well Yue 112, it is found that 1) the calculated average grain size of some layers is lower than 0.01 mm, but these layers have a relative low gamma ray reading and are commonly interpreted as sandstone (see grey block c in Figure 10, 2) some layers with only a slightly lower gamma ray values are calculated as coarse-grained sandstone (see grey block b and e in Figure 10, 3) the variations in the calculated average grain size for sandstones show a more feasible depositional cyclicity than that expressed by the gamma ray well log (see grey block b and d in Figure 10).
The isoline maps of sandstone percentage of the study intervals were produced by Sichuan Oil Company, China Petrochemical Corporation through exploratory and production wells (Figure 11), and the mapping method has been introduced in the section of lithology interpretation. Internal reports of the oil company document the average sandstone content as a percentage of the thickness for each sub-member, ranging between 40 and 68%, and progressively increasing from the first to the fourth sub-member. For each sub-member, the percentage of thickness contributed by sandstone increases from southeast to northwest and is over 40% in most areas. Figures 11A–C show two successive areas of low sandstone ratio around Well Yue 101-18 and the zone of Well Yue 101-70, 122 and Mo 6 in the first, second and third sub-members. This result gives a rough outline of sandstone distribution. However, as the second member of Xujiahe Formation is entirely sand-rich, describing the sandstone distribution is not enough for the efficient delineation of reservoirs. In addition, the percentage sandstone thickness would be overestimated using shale volume calculated by the gamma ray logs, further increasing the uncertainty of the reservoir mapping.
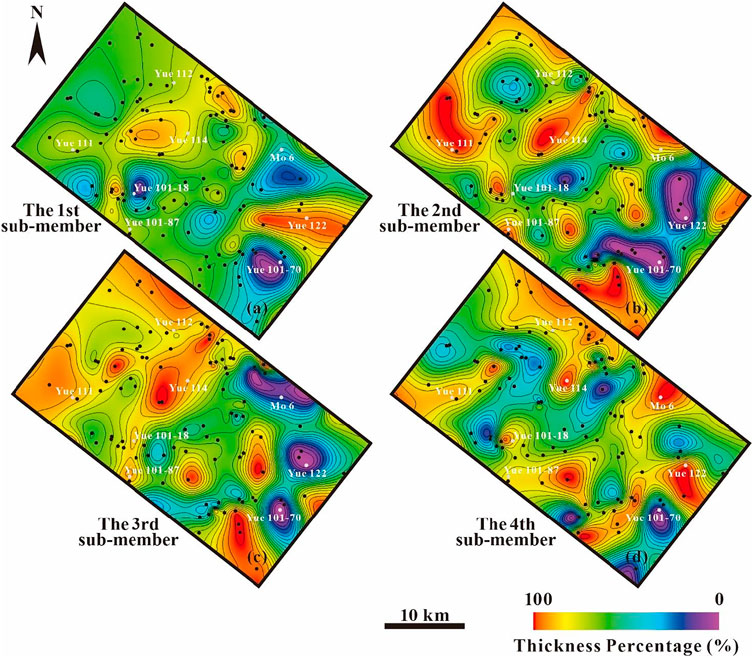
FIGURE 11. Isoline maps of the sandstone content as a percentage of the thickness for each study intervals. The sandstone thickness is calculated by the Sichuan Oil company, and the lithology interpretation is according to the shale volume estimated using gamma ray well logs.
Through the suggested method, the average grain size of the study wells is obtained, and the sandstone is determined by the calculated grain size. In the present study, the isoline maps for the thickness percentage of 1) sandstones and 2) only medium-grained and coarse-grained sandstones were generated. Figures 12A,C,E,G show that the isoline maps of sandstone percentage have the same trend with those developed by the Sichuan Oil Company, but the areas with high sand ratio have a lower maximum value. The maximum percentage reported by the Sichuan Oil Company reached 90% and even 100% in some areas; however, our results were generally lower than 90% (Figures 12A,C,E,G).
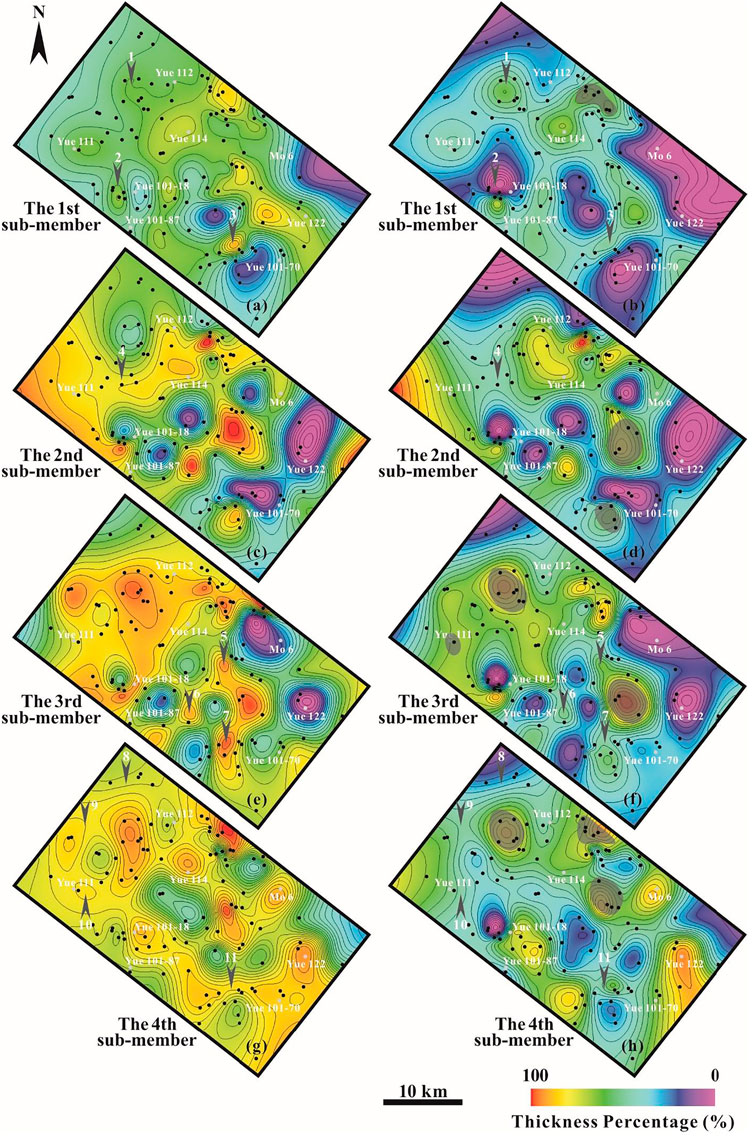
FIGURE 12. Isochore maps of the percentage of thickness comprising of (1) all sandstones (A,C,E, and G) and (2) medium- and coarse-grained sandstones (B, D, F, and H) after grain size calculation from the gamma ray log. The transparent black blocks indicate the prolific well zones. The grey arrows marked by numbers show the inconsistent areas between the distribution of all sandstone and medium- and coarse-grained sandstone.
The mapping of sandstone distribution using the calculated average grain size is not only more accurate than the results of the oil field which is generated using the shale volume to determine the lithology, but also gives more detailed information that exhibit the distribution of sandstone with different grades of grain size. Figures 12B,D,F,H illustrate the distributions of medium-grained + coarse-grained sandstone. These two maps show similar trends, but the percentage content shows an overall decline not only in space but also in different period. In addition, several areas, marked by grey arrows, show inconsistency between sandstone distribution and medium-grained + coarse-grained sandstone distribution in Figure 12.
Application to Prediction of the Hydrocarbon Potential
The grain size is a significant factor in the estimation of reservoir properties including porosity and permeability. It is commonly thought that reservoirs with relatively large grain sizes or well sorting have a good porosity and permeability under the same conditions (e.g., diagenesis, burial depth) [35]. The diagenesis of the study intervals is dominated by compaction with moderate dissolution of feldspar. Therefore, grain size and sorting would greatly influence the porosity and permeability. In the present study, the influence of grain size is emphasized. However, without a reliable assessment of the average grain size, it is difficult to investigate either the relationship between grain size and reservoir properties, or the relationship between the grain size and the hydrocarbon potential.
Without grain size information, the previous works of Sichuan Oil Company attempted to study the relation between cumulative thickness of sandstone and hydrocarbon bearing reservoirs in a single well. The results are plotted in Figure 13 and indicate no clear correlation between the thickness of sandstone and the hydrocarbon potential. There are two possible reasons for the weak correlation. Firstly, as discussed above, the thickness of sandstone is likely to be over-estimated according to the shale volume calculated using Formula 1. The second is that the hydrocarbon accumulation may be selective about the grain size, and a sweeping statistic on the sandstone thickness is not enough.
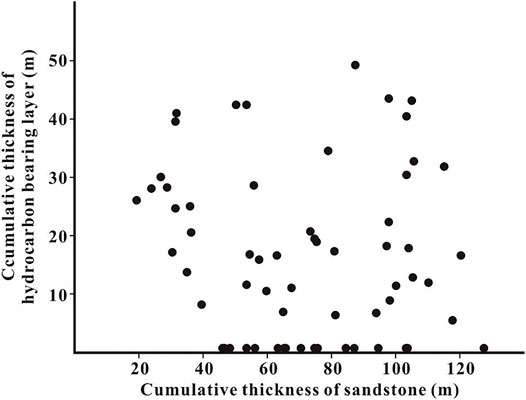
FIGURE 13. Scatter diagram of accumulative thickness of hydrocarbon bearing layers against cumulative thickness of sandstone in a single well.
In the present study, sandstones are divided into fine-grained, medium-grained and coarse-grained sandstone in terms of the calculated average grain size, and the statistical analysis focus on the relative thickness of sandstones with different grain sizes in a single oil-gas bearing reservoir. Figure 14 illustrates the thickness proportion of fine-grained, medium-grained and coarse-grained sandstone in the cumulative thickness of oil-gas bearing reservoirs in every study well with production information. In most of the wells, the medium-grained and coarse-grained sandstones dominate the oil-gas bearing reservoirs, and only in a few wells are the hydrocarbons discharged into fine-grained sandstones. Herein, we conclude that valid reservoirs for hydrocarbon charging in our study area are dominated by medium-grained and coarse-grained sandstone. The high-yield wells are highlighted by transparent red blocks on the isochore maps of thickness percentage of medium-grained + coarse-grained sandstone (Figures 12B,D,F,H). In most of the high-yield wells, these grain size categories constitute a large percentage of the cumulative thickness. For our study area, this relation can be used as a criterion to delineate potential hydrocarbon-bearing reservoirs.
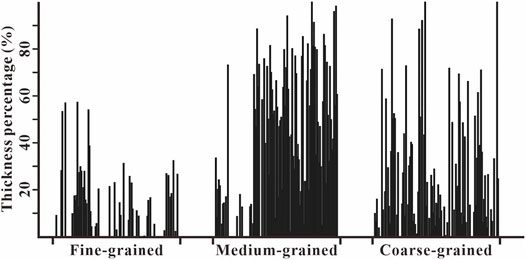
FIGURE 14. Histogram of the contents of fine-grained, medium-grained, and coarse-grained sandstone as a percentage of the cumulative thickness content of hydrocarbon bearing layers for the study wells.
Conclusion
Results of grain size analysis of modern depositional samples from river and delta environments reveal that the average grain size has a logarithmic relationship with the content of fine sediments defined as particles with a grain size lower than 0.01 mm. It demonstrates that when using linear relationship to determine the grain size and lithology, mis-estimation could occur and the rangeability of grain size would be over-estimated for fine sediments and under-estimated for coarse sediments. For subsurface sediments, the shale volume calculated using gamma ray well log is chosen to represent the content of fine sediments and to calculate the average grain size, since the value of gamma ray well log effectively reflects the content of original-deposited clay minerals. A formula was built up for the relationship between grain size and shale volume which is calculated using gamma ray logs.
Using this formula, the average grain size was calculated for all wells in the entire study interval. The results were applied for calibrating the lithological interpretation. Sandy deposits were possible to further sub-divide to fine-grained, medium-grained and coarse-gained sandstone, allowing the detailed mapping of sandstone distribution and revealing that the hydrocarbon-bearing reservoirs of our study areas are dominated by medium-grained and coarse-grained sandstone. The assessment of the grain size variation can also contribute to the reconstruction of sedimentary environments and depositional cycles. Consequently, this study suggests that the conversion of gamma ray well logs in terms of the logarithmic relationship is necessary for lithology interpretation in sandstone reservoirs.
Data Availability Statement
The original contributions presented in the study are included in the article/Supplementary Material, further inquiries can be directed to the corresponding author.
Author Contributions
LC organized the work and manuscript. HJ and NQ are in charge of the data analysis and revision of the manuscript. LZ carried out the laboratory works.
Funding
We are grateful to the Ministry of Science and Technology of the People’s Republic of China for the funding (2016ZX05047-003) that supported this work.
Conflict of Interest
The authors declare that the research was conducted in the absence of any commercial or financial relationships that could be construed as a potential conflict of interest.
Publisher’s Note
All claims expressed in this article are solely those of the authors and do not necessarily represent those of their affiliated organizations, or those of the publisher, the editors and the reviewers. Any product that may be evaluated in this article, or claim that may be made by its manufacturer, is not guaranteed or endorsed by the publisher.
Acknowledgments
We also thank Professor Zhaohua Zhou, Shi Shi, and Guangzhen Chu for the feedback during a long-term collaboration that resulted in this paper.
References
1. Gilbert GK, Murphy EC. The Transportation of Debris by Running Water. California: U.S. Geological Survey (1914).
2. Goldbery R. Use of Grain-Size Frequency Data to Interpret the Depositional Environment of the Pliocene Pleshet Formation, Beer Sheva, Israel. J Sediment Res (1980) 50:843–856. doi:10.1306/212f7b08-2b24-11d7-8648000102c1865d
3. Purkait B, Majumdar DD. Distinguishing Different Sedimentary Facies in a Deltaic System. Sediment Geology (2014) 308:53–62. doi:10.1016/j.sedgeo.2014.05.001
4. Wang X, Ke X. Grain-size Characteristics of the Extant Tidal Flat Sediments along the Jiangsu Coast, China. Sediment Geology (1997) 112:105–122. doi:10.1016/s0037-0738(97)00026-2
5. Yamashita S, Nakajo T, Naruse H, Sato T. The Three-Dimensional Distribution of Sedimentary Facies and Characteristics of Sediment Grain-Size Distribution in a sandy Tidal Flat along the Kushida River Estuary, Ise Bay, central Japan. Sediment Geology (2009) 215:70–82. doi:10.1016/j.sedgeo.2009.01.002
6. Beard DC, Weyl PK. Influence of Texture on Porosity and Permeability of Unconsolidated Sand. AAPG Bull (1973) 57. doi:10.1306/819a4272-16c5-11d7-8645000102c1865d
7. Shepherd RG. Correlations of Permeability and Grain Size. Ground Water (1989) 27:633–638. doi:10.1111/j.1745-6584.1989.tb00476.x
8. Mckinley JM, Atkinson PM, Lloyd CD, Ruffell AH, Worden RH. How Porosity and Permeability Vary Spatially with Grain Size, Sorting, Cement Volume, and Mineral Dissolution in Fluvial Triassic Sandstones: The Value of Geostatistics and Local Regression. J Sediment Res (2011) 81:844–858. doi:10.2110/jsr.2011.71
9. Sanei H, Ardakani OH, Ghanizadeh A, Clarkson CR, Wood JM. Simple Petrographic Grain Size Analysis of Siltstone Reservoir Rocks: An Example from the Montney Tight Gas Reservoir (Western Canada). Fuel (2016) 166:253–257. doi:10.1016/j.fuel.2015.10.103
10. Chen L, Ji H, Zhang L, Zhu Y, Fang Z, Patacci M. Rift Activity and Sequence Stratigraphy of the Oligocene Dongying Formation in the Nanpu Sag, Eastern China: Implications for Rift Sequence Stratigraphy in Lacustrine Basins. Geol J (2020) 55:1163–1178. doi:10.1002/gj.3490
11. Jia H, Ji H, Wang L, Yang D, Meng P, Shi C. Tectono-sedimentary and Hydrocarbon Potential Analysis of Rift-Related Successions in the Dehui Depression, Songliao Basin, Northeastern China. Mar Pet Geology (2016) 76:262–278. doi:10.1016/j.marpetgeo.2016.05.002
12. Lemons DR, Chan MA. Facies Architecture and Sequence Stratigraphy of fine-grained Lacustrine Deltas along the Eastern Margin of Late Pleistocene Lake Bonneville, Northern Utah and Southern Idaho. AAPG Bull (1999) 83:635–665. doi:10.1306/00aa9c14-1730-11d7-8645000102c1865d
13. Martins-Neto MA, Catuneanu O. Rift Sequence Stratigraphy, Regional Geology and Tectonics: Phanerozoic Rift Systems and Sedimentary Basins. Elsevier (2012). p. 58–70. doi:10.1016/b978-0-444-56356-9.00003-1
14. Paola C, Heller PL, Angevine CL. The Large-Scale Dynamics of Grain-Size Variation in Alluvial Basins, 1: Theory. Basin Res (1992) 4:73–90. doi:10.1111/j.1365-2117.1992.tb00145.x
15. Slatt RM, Jordan DW, D’Agostino AE, Gillespie RH. Outcrop Gamma-ray Logging to Improve Understanding of Subsurface Well Log Correlations. Geol Soc Lond Spec Publications (1992) 65:3–19. doi:10.1144/gsl.sp.1992.065.01.02
16. Krumbein WC, Pettijohn FJ. Manual of Sedimentary Petrography. New York: Appleton-Century-Croft (1938).
17. Saner S, Cagatay MN, Sanounah AMA. Relationships between Shale Content and Grain-Size Parameters in the Safaniya Sandstone Reservoir, NE Saudi Arabia. J Pet Geol (1996) 19:305–320. doi:10.1111/j.1747-5457.1996.tb00436.x
18. Rider MH. The Geological Interpretation of Well Logs. 2nd ed. Sutherland: Whittles Publishing (1996).
21. Atlas D. Well Longing and Interpretation Techniques: The Course for home Study. Dresser Atlas Publication, Lancaster(1982).
22. She FC, Wilson CJL, Worley BA. Tectonic Transition from the Songpan-Garze Fold Belt to the Sichuan Basin, South-Western China. Basin Res (2007) 7:235–253.
23. Wang E, Meng K, Su Z, Meng Q, Chu JJ, Chen Z, et al. Block Rotation: Tectonic Response of the Sichuan basin to the Southeastward Growth of the Tibetan Plateau along the Xianshuihe‐Xiaojiang Fault. Tectonics (2014) 33:686–718. doi:10.1002/2013tc003337
24. Zhang YN, Rong-Xi LI, Liu HQ, Zhu RJ, Zhu DM, Wang N, et al. Mesozoic-Cenozoic Tectonic Uplift History of Dabashan Foreland Structure in the Northern Rim of Sichuan Basin. J Earth Sci Environ (2014) 36:230–238.
25. Zhu M, Chen H, Yu L, Zhou J, Yang S. Provenance of the Early Triassic in the Southwestern Sichuan Basin, Upper Yangtze, and its Implications for Tectonic Evolution. Can J Earth Sci (2018) 55:70–83. doi:10.1139/cjes-2017-0092
26. Shi Z, Jin H, Guo C, Xie Z, ZHu Q. Member 2 Log Facies of Xujiahe Formation of Upper Triassic , Sichuan Basin. Nat gas Geosci (2008) 19:339–346.
27. Xu C, Gehenn J-M, Zhao D, Xie G, Teng M-K. The Fluvial and Lacustrine Sedimentary Systems and Stratigraphic Correlation in the Upper Triassic Xujiahe Formation in Sichuan Basin, China. Bulletin (2015) 99:2023–2041. doi:10.1306/07061514236
28. Li Y, Shao L, Eriksson KA, Tong X, Gao C, Chen Z. Linked Sequence Stratigraphy and Tectonics in the Sichuan continental Foreland basin, Upper Triassic Xujiahe Formation, Southwest China. J Asian Earth Sci (2014) 88:116–136. doi:10.1016/j.jseaes.2014.02.025
29. Cui B-L, Li X-Y. Runoff Processes in the Qinghai Lake Basin, Northeast Qinghai-Tibet Plateau, China: Insights from Stable Isotope and Hydrochemistry. Quat Int (2015) 380-381:123–132. doi:10.1016/j.quaint.2015.02.030
30. Duan L, Liu T, Wang X, Luo Y, Wu L. Development of a Regional Regression Model for Estimating Annual Runoff in the Hailar River Basin of China. Jwarp (2010) 2:934–943. doi:10.4236/jwarp.2010.211111
31. Surdam RC, Crossey LJ, Hagen ES, Heasler HP. Organic-inorganic and sandstone Diagenesis. AAPG Bull (1989) 73:1–23. doi:10.1306/703c9ad7-1707-11d7-8645000102c1865d
32. Heng Y. Reservior Evaluation and Favorable Regions Prediction of Xu'er Gas Reservior in Anyue Gas Field. Chengdu Univerisity of Technology, Chengdu, Sichuan, China(2013).
33. Li X. Research on Sedimentary Facies and Reservoir Characteristics of Xujihe Formation in Anyue-Jianyang Area. Chengdu Univerisity of Technology, Chengdu, Sichuan, China(2015).
34. Zhang Y. Reservior Evaluation of Xu'er Gas Reservoir in Hechuan-Anyue Gas Field. Chengdu Univerisity of Technology, Chengdu, Sichuan, China(2009).
Keywords: grain size, gamma ray log, Xujiahe Formation, Anyue, Sichuan Basin
Citation: Chen L, Ji H, Qiu N and Zhang L (2021) A Conversion for Average Grain Size Based on Gamma Ray Well Log: Application in the Second Member of Xujiahe Formation of Anyue Area, Sichuan Basin. Front. Phys. 9:807303. doi: 10.3389/fphy.2021.807303
Received: 02 November 2021; Accepted: 01 December 2021;
Published: 15 December 2021.
Edited by:
Chun Zhu, Hohai University, ChinaReviewed by:
Jianwei Feng, China University of Petroleum (East China), ChinaYebo Du, Research Institute of Petroleum Exploration and Development (RIPED), China
Copyright © 2021 Chen, Ji, Qiu and Zhang. This is an open-access article distributed under the terms of the Creative Commons Attribution License (CC BY). The use, distribution or reproduction in other forums is permitted, provided the original author(s) and the copyright owner(s) are credited and that the original publication in this journal is cited, in accordance with accepted academic practice. No use, distribution or reproduction is permitted which does not comply with these terms.
*Correspondence: Liang Chen, georabbit1987@hotmail.com