Multilayer-Aggregation Functional Network for Identifying Brain Fatigue and Diseases
 Wen-Kuo Cui
 Xin-Rui Qi
 Yu Sun
 Gang Yan
- 1School of Physics Science and Engineering, Tongji University, Shanghai, China
- 2Frontiers Science Center for Intelligent Autonomous Systems, Tongji University, Shanghai, China
- 3Center for Translational Neurodegeneration and Regenerative Therapy, Shanghai Tenth People’s Hospital, Tongji University School of Medicine, Shanghai, China
- 4The Key Laboratory for Biomedical Engineering of Ministry of Education of China, Department of Biomedical Engineering, Zhejiang University, and with the Zhejiang Lab, Hangzhou, China
- 5Center for Excellence in Brain Science and Intelligence Technology, Chinese Academy of Sciences, Shanghai, China
Recent years have witnessed increasing interest of applying network science methodologies to analyze brain activity data. Owing to the noninvasiveness, low cost and high sampling rate, electroencephalogram (EEG) recordings have been widely used as a proxy for probing the internal states of human brains. Previous correlation-based functional networks (CFN) mainly focused on the covariance or coherence between readings from electrodes attached to different regions, largely overlooking local temporal properties of these electrical activities. Here, we propose a method to construct multilayer-aggregation functional network (MAFN) which is able to capture both temporal and topological characteristics from EEG data. We extract features from these MAFNs and incorporate them into each of 12 classification algorithms, aiming to detect mental fatigue and two brain diseases, schizophrenia and epilepsy. The results demonstrate that MAFNs consistently outperform CFN and dynamic version of CFN. In comparison to functional networks based on weighted phase lag index (wPLI), MAFNs also achieve higher or comparable accuracy in most classifiers. Moreover, the nodal features of MAFNs allow us to identify the important positions of EEG electrodes for different brain states or diseases. These findings together offer not only a framework for classifying normal and abnormal brain activities but also a general method for constructing more informative functional networks from multiple time series data.
1 Introduction
Human brain is one of the most delicate and complex systems, responsible for maintaining the internal regulation of human body and perception, and responding to external stimuli. To understand the working mechanism of brain function and to detect brain states and diseases, such as mental fatigue [1], epilepsy [2], sleep disorders [3], schizophrenia [4], depression [5] and Alzheimer’s disease (AD) [6], several noninvasive technologies have been invented and widely used, such as functional magnetic resonance imaging (fMRI) [7], electroencephalogram (EEG) [8], computed tomography (CT) [9], and so on. Constructing functional networks from the brain activities recorded with these technologies has attracted more and more attentions [10–12]. In functional networks, nodes represent brain regions or voxels and edges are supposed to capture the functional interactions between different nodes. Increasing evidence showed that functional networks change with cognitive activities, emotion, and the development of brain diseases and so on [13, 14]. Hence, functional networks can be applied to reveal different brain states or to detect brain illnesses whose neuropathology are not yet clear. For example, previous studies have found that, among others, the modules of the brain’s functional network become more isolated, and the connections within the modules become stronger when people age [15]. Functional networks of patients with schizophrenia, compared with healthy people, and exhibit abnormalities in multiple global indicators (global clustering coefficient, small-world-ness, etc.) [16].
Among the technologies mentioned above, EEG has the advantages of high time resolution, and convenient data collection and low cost. Hence, extracting information from EEG recordings has been a very active field which aims to understand intentions and emotions [17, 18], to diagnose neuropsychiatric disorders (mental illness and brain diseases) [5, 19, 20], and to develop new brain-computer interface (BCI) technologies [21–23]. In these applications EEG based functional networks have also been widely used. For example Ref. 24, constructed functional networks of fatigued brains via source localization of cortical activities in 26 predefined regions of interest, and found that the characteristic path length increased, offering support for the presence of a reshaped global topology in cortical connectivity networks under fatigue state Ref. 25; explored the emotion associated functional networks among different subjects and extracted three topological properties from these networks as classification features. Their results showed that there are indeed common connectivity patterns associated with different emotions, and also demonstrated that topological features have considerable advantages over conventional power spectral density Ref. 26; constructed functional networks from EEG readings in resting state and memory task state, and found that healthy people under memory task state showed small-world characteristics in different frequency bands Ref. 27; studied cortical functional networks of subjects after sport-related mild traumatic brain injury (MTBI) and found that MTBI induces an increase in short-distance connectivity and a decrease in long-distance connectivity.
However, previously established EEG-based functional networks mainly focused on the correlation or coherence between different channels, i.e., building the connections between the electrical activity of different brain regions [28, 29]. Such constructions can enable network science methodologies to probe the interactions between regions, but largely overlook intrinsic local temporal properties of EEG signals. The fact prompts us to explore an important and interesting question: How to map the readings of multiple EEG channels into a functional network that can capture both topological and temporal characteristics of these signals? Here, to address this need, we propose an approach to construct MAFNs from multiple time series. We first build an undirected network from each time series by utilizing the idea originally from the network science field [30, 31]. Such networks can reveal the temporal regularities in each signal. We then aggregate these networks into a weighted one based on the topological similarity of different layers, which thus can also capture the connections between different channels. To demonstrate the effectiveness of our approach, we incorporate MAFNs with various supervised and unsupervised classifiers and apply them to identify three typical neuropsychiatric disorders including mental fatigue, schizophrenia and epilepsy.
To demonstrate the effectiveness of our approach, we incorporate MAFNs into 12 supervised and unsupervised classifiers and apply them in three typical tasks, identifying mental fatigue, diagnosing schizophrenia, and detecting epilepsy. The results show that in comparison to correlation-based functional networks (CFNs) and dynamic (sliding window) version of CFNs (DCFNs), MAFNs exhibit significantly higher accuracy. In addition, as the scalp-level network is affected by the volume conduction problem (each channel receives information from many brain sources), functional networks based on weighted phase lag index (wPLI) [32] are also constructed for comparison. MAFNs also achieve comparable performance, with higher accuracy in 9 out of 12 classifiers.
The main contributions of the present work can be summarized as follows.
(i)We establish a multilayer-aggregation approach for constructing functional networks from multiple time series, which is able to capture both temporal and topological characteristics of these signals;
(ii)We incorporate the constructed functional networks into 12 classifiers and apply them in three typical EEG applications, systematically demonstrating the effectiveness of our approach;
(iii)The higher accuracy of MAFN in extracting temporal and topological characteristics and identifying fatigue, schizophrenia, and epilepsy from EEG data allow it to be a potential method for understanding neural circuits associated with behaviors and diagnosing the neuropsychiatric disorders using EEG recordings.
The rest of the paper is structured as follows. Section 2 describes the construction approach of MAFN and the classification framework based on such networks. Section 3 shows the comparison results between traditional methods (CFN, DCFN, and wPLI) and MAFN in three EEG datasets (fatigue, schizophrenia, and epilepsy). Discussion and Conclusion are given in Section 4.
2 Methods
This section includes three parts: construction of multilayer-aggregation functional networks (MAFNs) feature extraction and selection from MAFNs and MAFN-based classification framework.
2.1 Construction of MAFNs
The effectiveness of functional networks in distinguishing brain states is heavily dependent on construction methods, i.e., the more informative the more applicable. However, how to reconstruct a scalp-level network or source connectivity network able to represent the intrinsic connections between regions from coarse-grained and usually noisy readings is a nontrivial problem. According to the time series recordings, researchers have proposed several functional connectivity indexes to construct functional networks. Correlation-based functional networks (CFNs) and dynamic (sliding-window) version of CFN (DCFNs), as well as weighted phase lag index (wPLI) succeeded in a wide range of applications, given the fact that human brain is indeed composed of a few billion of interconnected neurons. A weighted matrix is obtained according to different functional connectivity indexes, and then binarized to obtain an unweighted and undirected network that represents the relationship between different regions. At a coarse-grained level, the human cerebral cortex can be roughly divided into several different regions, which are actually dependent on each other, and function cooperatively [33]. The dependence between regions is so strong that it can be captured by nice correlations of the activities between regions. In addition, brain activities also show temporal patterns, which means that one region is activated following the other. Thus, it is expected that construction of functional networks with better informativeness should take into account not only topological but also temporal properties. To satisfy this need, we propose a two-phase approach to create the MAFNs from EEG readings. Furthermore, according to different calculation indexes of each stage, three kinds of are constructed, based on dynamic time warping [34] (MAFN-dtw), symbolic mutual information [35, 36] (MAFN-smi), and hub depressed index [37] (MAFN-HDI) respectively.
First, to reveal temporal regularities an idea from network science (see [30, 31]) is adopted for building a network from a single time series. As illustrated in Figure 1, we use a sliding window to split all EEG time series (Figure 1B) into m sub-sequences (Figure 1C), and then identify from these m sub-sequences the representative sub-sequences (RSs) through the idea similar to clustering: 1) Calculate the similarity (measured by dynamic time warping (DTW) [34] or symbolic mutual information (SMI) [35, 36]) between each pair of sub-sequences, and for each sub-sequence we select its k most similar (other) sub-sequences; 2) In the mk selected sub-sequences, some are repeated. Hence we pick the top k ones who occur most frequently. 3) In these k sub-sequences, we identified n sub-sequences that are most dissimilar to each other. Therefore, the cardinality of the final set of RSs equals n. In this work we set n = 40. Through the procedure, the RSs we identified are most dissimilar to each other, yet are most similar to other original sub-sequences. That is, the RSs can indeed considered as motifs occurring in EEG time series (Figure 1D). Finally, we convert each single time series into a symbol sequences by replacing each original sub-sequence with its most similar RS (Figure 1E), which can be further transformed to a network (Figure 1F). Each node represents a RS, and two nodes are connected by a link if the two RSs in the original time series are temporally proximal to each other. Therefore, through the above procedure each channel is represented by a network (or called layer hereafter).
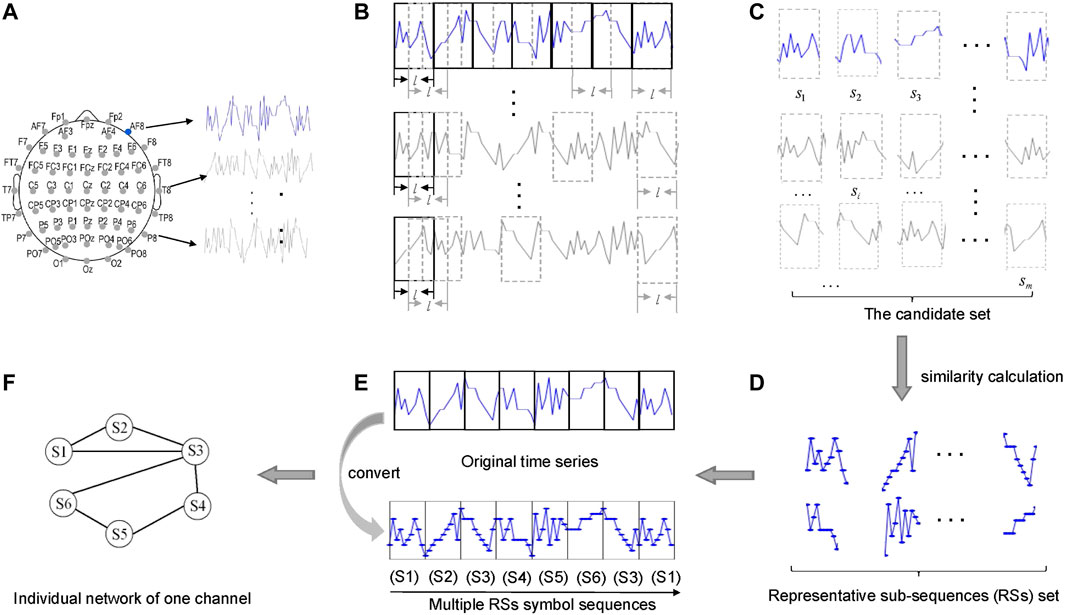
FIGURE 1. Construction of an individual network layer for each channel. (A) EEG channel locations and its recorded time series. (B) Segmentation process of time series. (C) Candidate set of sub-sequences. (D) The representative sub-sequences (RSs) set. (E) The process of replacement. (F) The individual network (layer) for one channel.
Second, as illustrated in Figure 2, the individual layers of all channels are merged into an MAFN by aggregation. Such an aggregation process captures the dependence between different channels (layers). Here we use Jaccard coefficient or Hub Depressed Index (HDI) [37]) to calculate the local structural similarity of node i between any pair of layers X and Y. For a node i, let ki(X) represents the degree of i in layer X and Γi(X) represents the neighbor node set of node i in layer X. Jaccard coefficient and HDI between two layers are defined as
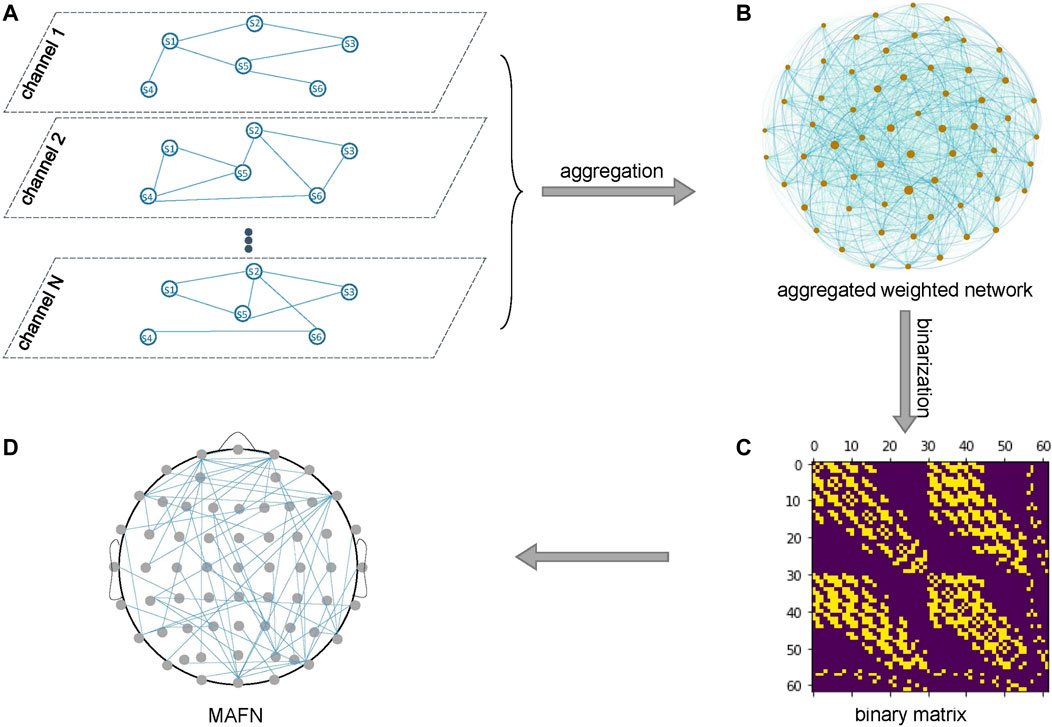
FIGURE 2. Aggregation of the layers of all channels. (A) The individual layers of N channels and (B) an aggregated weighted network of these layers. (C) The binary matrix for the MAFN in (D).
and
respectively. Then the global similarity between layer X and layer Y is quantified by
where n is the number of nodes (i.e., RSs).
So far, through the two steps above we obtain a weighted network of these layers (Figure 2B), where the weight of a link represents the similarity of two corresponding layers. We expect that the similarity indicates the strength of dependence between the two channels. Finally, we binarize the weighted network to a (0, 1)-matrix (Figure 2C) that corresponds to a MAFN shown in Figure 2D. Because the threshold of binarization affects the number of links and also the topological properties of the MAFN, as discussed in the next subsection we extract the features of networks with different levels of sparsity, from 12 to 34% with step size 2%, and input all these features into each classifier in our numerical experiments.
2.2 Feature Extraction From MAFNs
Network science offers several important metrics to mathematically characterize the topology of networks [38–42]. The changes of these metrics can be used as indicators to distinguish brain functional networks for different brain states from various perspectives [43, 44]. The metrics roughly fall into two categories—global and local. Global metrics capture the connection patterns among nodes as a whole. For example, the average path length reveals the dispersion of network structure hence is related to information transmission efficiency; Modularity quantifies the extent to which a network can be divided into several densely connected communities. Local metrics capture the surrounding connection patterns of a specific node or link. For example, nodal degree is simply the number of a node’s neighbors; Nodal clustering coefficient describes the connnectedness among a node’s neighbors; Nodal betweenness is useful for determining whether a specific link is a bottleneck for network diffusion. In order to reflect the diversity of functional network properties, here we employ 10 global and 5 local metrics, as listed in Table 1.
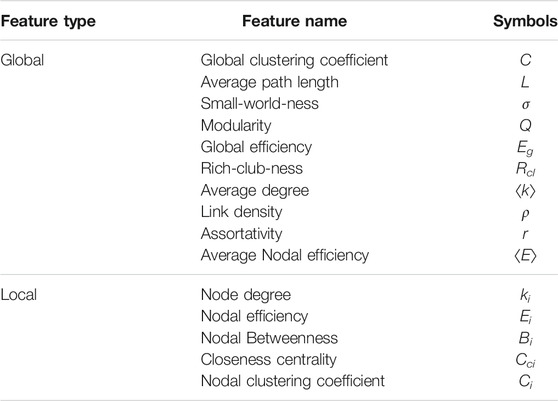
TABLE 1. Features of functional networks.
It is worth noting that the values of these metrics depend on the threshold used to binarize either the functional network has been proposed or aggregated (weighted) networks in the second phase of MAFN construction. Hence, we consider the metrics for a wide range of network sparsity that is defined as the fraction of existing links out of all possible links between nodes. Specifically, for each metric x we also calculate the area under the curve (AUC) [16, 45] that represents the metric value as a function of network sparsity, i.e.,
where
In classification algorithms described in the next subsection, we use all features for the metrics listed in Table 1. In fact, we constructed functional networks with sparsity levels from 12 to 34% and calculated the network attributes of all these networks, i.e., for each metric x all its features {x (S1 = 12%), x (S2 = 14%), …, x (Sn = 34%), xAUC} are inputted into the classifier. Hence, the number of total features is the sum of the local and the global feature numbers. For instance, in the task of mental fatigue identification where each subject has 62 EEG channels, the total number of features is (62 × 5 + 10) × 13 = 4160. Similarly, the total number of features for schizophrenia and epilepsy data are 4,095 and 1,690 respectively. In order to perform fair comparisons, the total number of features obtained from correlation-based functional networks is equal to those above respectively.
In addition, to increase the interpretability of the results and to screen out the sensitive indicators of the network, we conduct a difference analysis on the indicators of the functional network by using supervised algorithms. Samples are given labels, and one can obtain the statistically significant difference of each network metric and the most differentiated binarization threshold through inter-group statistics between healthy and abnormal samples. To do so, we first use the Z-score method to standardize the metrics and count the normalized mean value of each metric x under all sparsity of one network to obtain the statistically significant difference of each network metric. Then we perform t-tests of the metrics at different network sparsity levels and calculate the corresponding p-values, followed by choosing the sparsity which results in the most statistically significant metrics (significance level is set to p < 0.05) [46]. Such a way is able to point out the sensitive indicators, as shown in Section 3, for understanding the possible mechanisms underlying the brain illness. It is noteworthy that such calculations is only for interpreting the results, and in all comparison experiments we do not intentionally choose metrics or sparsity levels.
2.3 Classification Framework Based on MAFNs
After the MAFNs constructed from experimental EEG data and the features extracted from MAFNs, we put these features encoding both topological and temporal properties into classifiers. In order to extensively compare the capability of MAFNs to that of other methods, in the present study we employ 6 supervised classifiers, including support vector machine with radial basis kernel function (SVM-RBF), with sigmoid kernel function (SVM-SIG), and with polynomial kernel function (SVM-POL), multi-layer Perceptron (MLP), decision tree C4.5 and dense graph propagation (DGP) [47], as well as 6 unsupervised classifiers, including invariant information clustering (IIC) [48], one class support vector machine (OC-SVM) [49], support vector data description (SVDD) [50], k-means, hierarchical clustering divisive analysis (DIANA), density-based spatial clustering of applications with noise (DBSCAN). To assess the performance of MAFNs in these classifiers we use accuracy defined as (TP + TN)/(TP + TN + FN + FP) where TP, TN, FP, and FN represent true positive, true negative, false positive, and false negative, respectively.
In supervised classifiers, the data samples were divided into training, validation and test sets with proportions of 50, 20, and 30%, respectively. For each classifier, all features of the functional networks constructed from the training set are used to train the model, and then 5-fold cross-validation is used to validate the model, obtaining the best model parameters. Next, we test the model and got the classification accuracy in the test dataset (i.e., the remaining 30% of the original data). Finally, we repeat the above two steps 50 times by randomly splitting the samples into training, validation and test sets, and eventually obtain the arithmetic mean of these classification accuracies as ACC.
In contrast, unsupervised classifiers cluster the samples to different groups according to some criteria and do not have a training process. Take the k-means as an example. First, we construct networks with sparsity levels of from 12 to 34% and calculate the values of all the features of each network respectively. Then we input the features of each network sparsity into the k-means classifier. The k-means is repeated for several times, and the smallest sum of squared errors (SSE) is the final clustering result. A prediction label is assigned to each sample. Finally, we use classification accuracy to measure the clustering results (the comparison between the assigned labels and the real labels of each sample was concluded by clustering). Note that we calculate the classification results of functional networks with different levels of sparsity, whose mean value was set as ACC.
3 Applications
In this section, we incorporate MAFNs with classification algorithms and apply to three typical scenarios, demonstrating the advantages and effectiveness of MAFNs compared with the previous 3 methods. Moreover, we also show how to identify the important electrodes and their locations for detecting mental fatigue and schizophrenia.
3.1 Application in Mental Fatigue Identification
Mental fatigue can cause difficulty in concentration and negative emotions, which further reduce work efficiency, and even lead to various accidents. Hence, identifying mental fatigue has attracted considerable attention in the past decade. Here, we analyze a dataset from 26 subjects with mental fatigue [21, 24]. Each subject underwent a 20-min psychomotor vigilance test (PVT), a high-signal-load way based on reaction time for evaluating the ability to sustain attention and be alert to salient signals. To study the effect of increased mental fatigue with working hours, the first and last 5-min intervals were set as the least, and most fatigued states, respectively. High-density continuous EEG recordings were acquired from 62 Ag/AgCl scalp electrodes according to the International 10–20 system (ASA-Lab, ANT B.V., and Netherlands). The typical electrode positions are illustrated in Figure 1A. Signals containing artifacts due to eye movements or significant muscle activity during the recordings were removed offline via an independent component analysis approach. The final EEG signals were baseline adjusted and further digitally band pass filtered in the range 0.5–40 Hz (fifth order Butterworth). The artifact-free epochs of 500 ms duration EEG segments (from 0 to 500 ms post-stimulus) were selected and grouped for further analysis. Rhythmic patterns of activity in the (8–10 Hz) range could be an appropriate physiological signal for revealing the topological differences of cortical connectivity in fatigue state as low alpha waves have specifically been implicated with decreasing alertness. Here, we apply a graph theoretical approach to analyze such changes in the lower alpha (8–10 Hz) band of EEG data.
We construct three types of MAFNs (MAFNs-dtw, MAFNs-smi, and MAFNs-HDI), using the method described in Section 2.1, for the first and last 5-min intervals respectively for each subject. To perform comparisons, for each subject we also construct three other corresponding types of functional networks (CFNs, DCFNs, and wPLIs) simply by calculating the correlations between all pairs of EEG time series and then binarizing the correlation matrix into an undirected unweighted functional network. We examine different values of binarizing threshold (12–34%) to obtain functional networks with different levels of sparsity. To distinguish the least and most fatigued states, we extract the features from the metrics listed in Table 1 of all these sparse networks (i.e., each subject has 4160 features), and then input these features into the classifiers described in Section 2.3. As exhibited in Figure 3, the MAFNs are more effective than the corresponding CFN and DCFN in all 6 supervised and 6 unsupervised classifiers. Moreover, we observe that MAFN + SVM-SIG obtains the highest accuracy in supervised learning and wPLI + IIC outperforms other unsupervised algorithms. Meanwhile, while wPLIs are more effective than correlation-based functional networks, our MAFNs still achieve higher or comparable accuracy in 9 out of 12 classifiers.
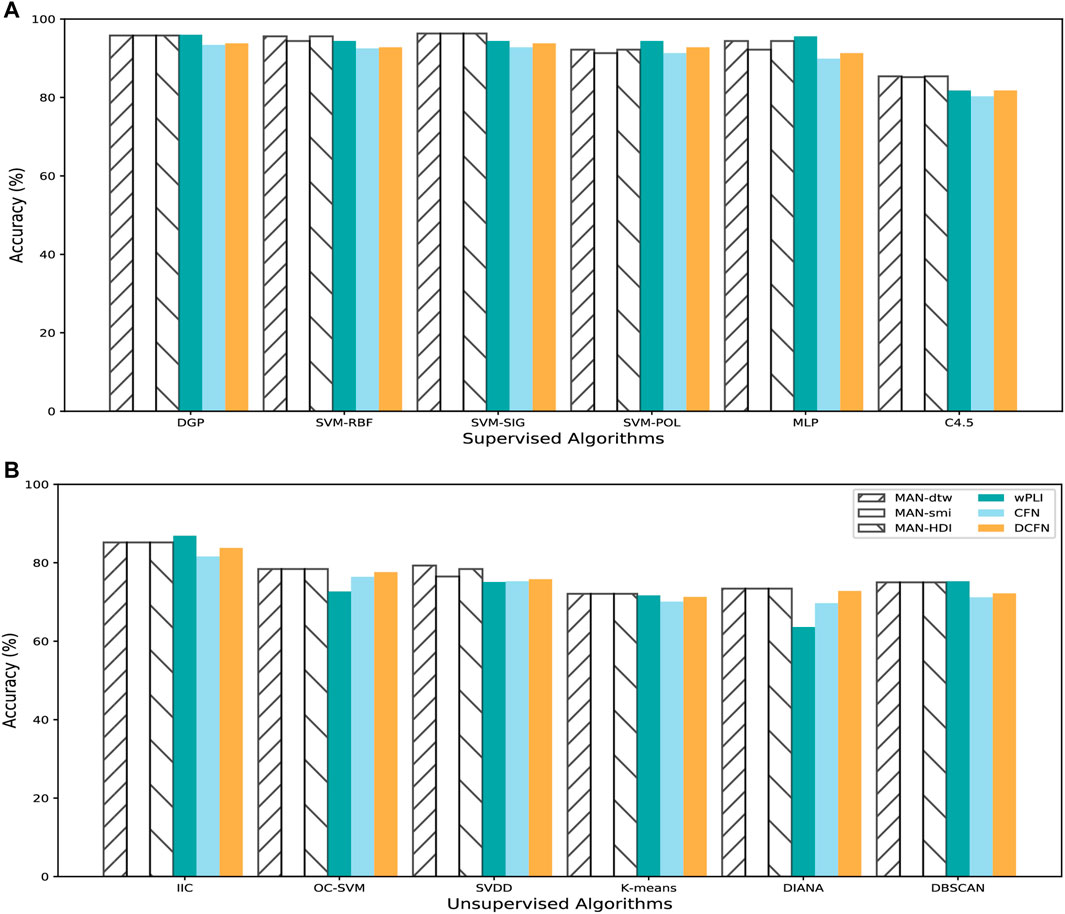
FIGURE 3. Comparison between different methods of brain functional network construction in detecting mental fatigue with 6 supervised classifiers and 6 unsupervised classifiers. Comparison in (A) supervised and (B) unsupervised classifiers.
To increase the interpretability of the results we also want to reveal the sensitive indicators of the network, i.e., to examine the topological properties in each layer network for the least and most fatigued brain states. As shown in Figure 4A, we take F3 for example which is attached to the frontal lobes of the cerebral cortex. This region plays vital roles in memory, attention, motivation, and also has the capacity to organize and plan daily tasks. For all subjects, we count the normalized mean value of each global metric Y under all sparsity of the F3 network. We find that there are indeed significant structural differences between the F3 network layer of least and most fatigued states. Specifically, compared with the least fatigued subjects, the values of C, ⟨k⟩, ρ, and ⟨E⟩ are decreased in most fatigued networks, while the values of the other 6 global metrics are increased. Such decreases and increases are all statistically significant (t-test, p-value
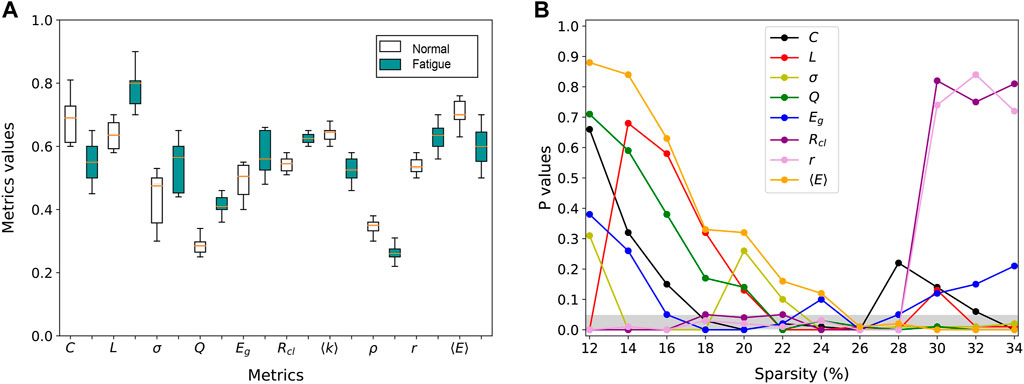
FIGURE 4. Statistically significant difference of metrics between fatigued and healthy groups. (A) Inter-group differences of global metrics in the individual layer of F3 channel. (B) Statistical significance of the inter-group difference of global metrics as a function of network sparsity.
Moreover, the features extracted from local metrics are important for recognizing the contribution of each node in MAFN, i.e., identifying the most relevant electrode positions for a specific task. To do so, we calculate the accuracy of the proposed classification framework by using the local metrics of only one node and descending sort the nodes according to these ACC values. And then put the ranking labels (1–62) as the x-axis. As shown in Figure 5A, we take the results of SVM-RBF algorithm as an example, and obtain the accuracy rate for each channel by using different network construction methods respectively. The green line is the results of MAFN-dtw + SVM-RBF, and the top1 node (electrode) is F3 which is attached to the frontal lobes of the cerebral cortex. Then we pick up the top 10 channels with the highest accuracies of the methods and the results are shown in Figure 5C. The process is repeated for other 5 types of network construction method. We pick up the top 10 channels with the highest accuracies of 6 methods respectively and find that the most important electrodes for fatigue detection are mainly located in the frontal and the central areas with the left electrodes more relevant than the right ones. So, it is shown that although there are differences between the results calculated from 6 network construction methods (i.e., there are differences between the top 10 highest classification accuracy channels of different methods), all 6 methods can clearly distinguish the importance of each node of the network.
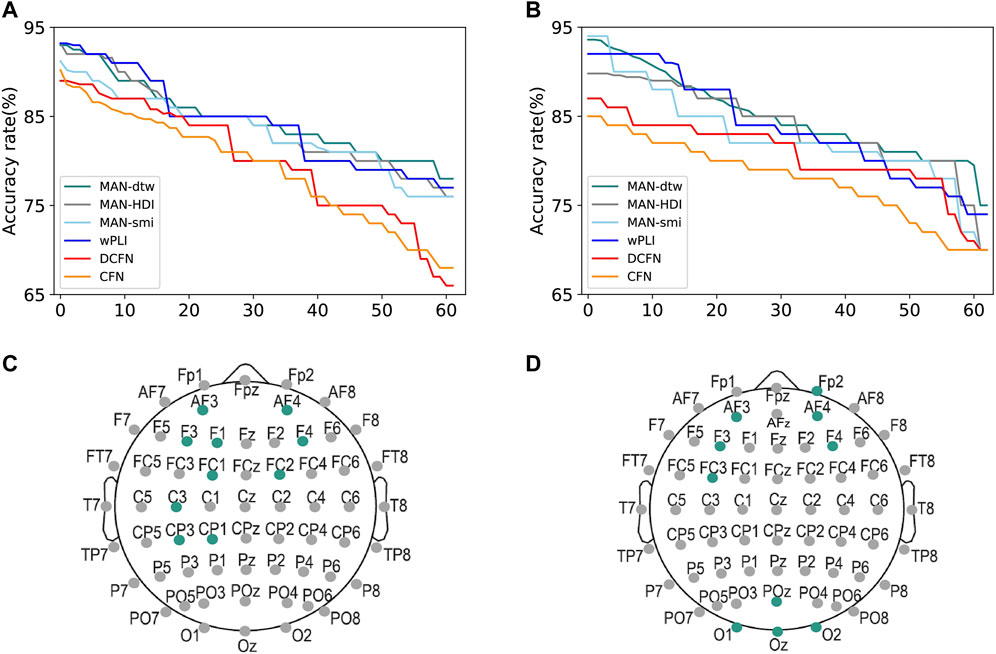
FIGURE 5. Important channels and their locations for detecting fatigue status (A,C) and schizophrenia (B,D). The colored points in (C,D) represent the corresponding positions.
3.2 Application in Schizophrenia Diagnosis
Schizophrenia is a serious and chronic mental disorder with typical positive symptoms such as delusions, hallucinations and negative symptoms such as depressed mood, which affects about 1% of people across the globe. One possible explanation for some of the symptoms of schizophrenia is that one or more problems with the corollary discharge process in the nervous system make it difficult for patients to distinguish between internally and externally generated stimuli. Schizophrenia has made a big burden for patients and their family which prompt us to find a quick and good way for diagnosis and even early warn of the emergence of schizophrenia. In the present study we use the dataset, which is already pre-processed, from patients with schizophrenia, and healthy controls in [51]. All subjects participate in a simple button-pressing task in which subjects either 1) pressed a button to immediately generated a tone, 2) passively listened to the same tone, or 3) pressed a button without generating a tone to study the corollary discharge in people with schizophrenia, and comparison controls. And 61 channel EEG data were collected from 32 healthy subjects and 49 patients with schizophrenia.
As described in Section 2, we construct 6 types of functional networks for each subject and incorporate them into the 12 classifiers. The results are shown in Table 2. It is obvious that the accuracy of classifiers involving MAFNs are consistently higher than those involving CFNs and DCFNs, demonstrating the advantage of MAFNs. The highest accuracy achieved by using MAFNs is 92.4% (MAFN-dtw + SVM-POL). Since the wPLI method can avoid the volume conductor effect, wPLIs are more effective than the corresponding 5 other methods in 2 supervised (SVM-SIG and MLP) classifiers, but MAFNs perform better in other 10 classifiers.
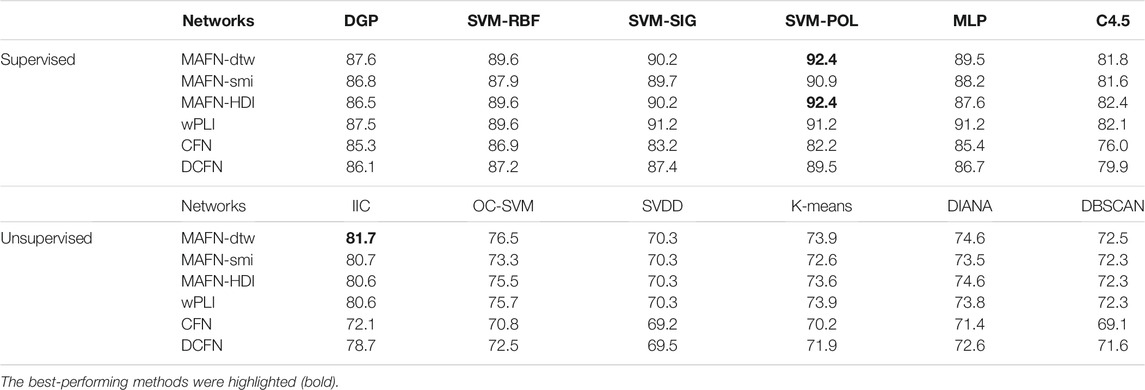
TABLE 2. Comparison results of MAFNs and other methods for schizophrenia diagnosis.
Furthermore, similar to the approach discussed in Section 3.1, we also reveal the optimal sparsity and the accuracy achieved by using the features of individual channels. The results show that when the sparsity is 30%, the global attribute of schizophrenia networks has the largest difference between groups. Finally, as exhibited in Figure 5D, we find that the most relevant electrodes for schizophrenia diagnosis are localized in the frontal and occipital regions.
3.3 Application in Epilepsy Detection
The third task we take to demonstrate the effectiveness of MAFNs is detecting epilepsy. The dataset contains intracranial EEG recordings obtained from patients with temporal lobe epilepsy undergoing evaluation for epilepsic surgery [52]. The 1-s EEG clips labeled “Ictal” for seizure data segments, or “Interictal” for non-seizure data segments. In the present work, 100 “Ictal” and 100 “Interictal” fragments of one subject were selected as experimental data. The 24 intracranial EEG recordings are from depth electrodes implanted along the anterior-posterior axis of the hippocampus, and from subdural electrode grids in various locations.
The results of classifiers involving MAFNs or other functional networks are displayed in Table 3. The highest accuracy achieved by using MAFNs is 95.4% (MAFN-dtw + SVM-SIG). Importantly, these results indicate again that, MAFNs systematically outperform CFNs and DCFNs. Except in SVM-POL and IIC classifiers, MAFNs perform better than or comparably to wPLIs. Furthermore, we also find the optimal sparsity and the accuracy by using the features of individual channels. The results show that when the sparsity is 32%, the global attribute of epilepsy networks has the largest difference between groups.
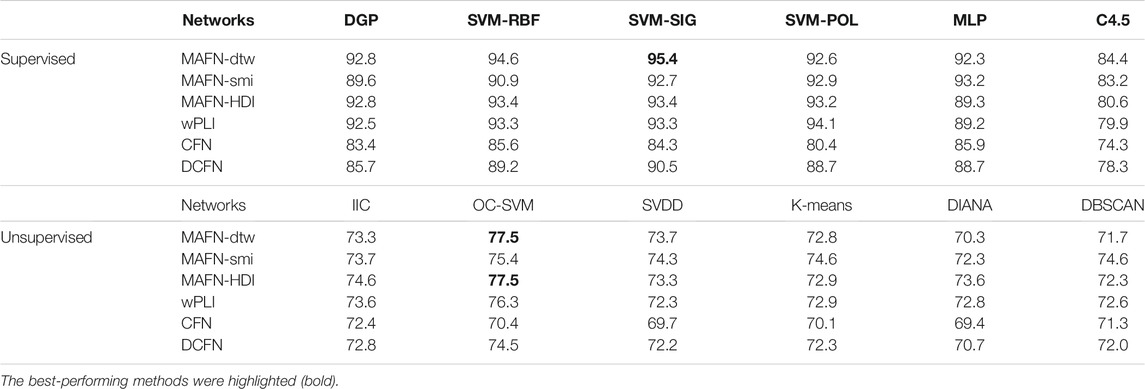
TABLE 3. Comparison results of MAFNs and other functional methods for epilepsy detection.
4 Discussion and Conclusion
4.1 Discussion
Generally speaking, there are two types of brain networks, structural, and functional [44, 53]. The former represents chemical or electrical synapses between neurons, or fibers connecting brain regions or voxels. In these networks the connections are physical, meaning that they do not significantly change in a short time interval. In contrast, the later describes the functional interactions between neurons or regions. Such interactions can be captured by correlation/coherence or causation of activities of brain region pairs. Due to the temporal nature of brain activity, functional connectivity usually changes over time and exhibits different structural properties in different brain states. Hence, construction approach showing temporal and topological characteristics of brain activity is not only crucial for distinguishing brain states but also helpful for unveiling the systematic mechanism underlying brain functions or dysfunctions.
In this work we demonstrate the advantages of MAFN in identifying three abnormal brain states, it can also be applied to understand our healthy or diseased brain, such as detecting driving-induced fatigue, Alzheimer’s disease, depression, and different emotions, etc. In addition, although we focus on MAFNs constructed from EEG recordings, our approach is also applicable to construct functional networks from other types of experimental data, and such as fMRI and fNIRS. Importantly, while scalp-level EEG data are used here, it would be interesting to extend the MAFN method to source-level connectivity [54]. Unfortunately, source reconstruction requires additional experiment data that all the three datasets in the present study lack. Moreover, directed networks (i.e., effective connectivity represents the direct or indirect causal influences of one region on another) can be more informative than undirected ones because link directionality might reveal information flow between different brain regions [55]. Therefore, exploring source-level and directed MAFNs is worth future pursuit.
5 Conclusion
In summary, we proposed a two-phase approach for constructing scalp-level functional networks from multiple time series by multilayer-aggregation, and incorporated such networks into a classification framework for identifying brain states and diseases based on EEG recordings. We tested the effectiveness and robustness of the approach in three data sets (fatigue, schizophrenia, and epilepsy) and the results showed that the approach is consistently more advantageous than correlation-based functional networks and also achieves comparable or higher accuracy than phase lag index based networks in most classifiers. With this approach we also revealed the important electrode positions for detecting mental fatigue and diagnosing schizophrenia.
Data Availability Statement
The original contributions presented in the study are included in the article/Supplementary Material, further inquiries can be directed to the corresponding author.
Author Contributions
GY designed the research. W-KC developed the methods. W-KC and X-RQ analyzed the data and results. W-KC and GY wrote the manuscript with inputs from YS and X-RQ.
Funding
W-KC and GY are supported by the National Natural Science Foundation of China (Grant Nos. 11875043 and 12161141016), Supported by the Shanghai Municipal Science and Technology Major Project (2021SHZDZX0100) and the Fundamental Research Funds for the Central Universities, Shanghai Municipal Commission of Science and Technology Project (Grant No. 19511132101), and the Fundamental Research Funds for the Central Universities (Grant No. 22120190251). YS is supported by the National Natural Science Foundation of China (Grant No. 81801785) and Zhejiang Lab (Grant No. 2019KE0AD01).
Conflict of Interest
The authors declare that the research was conducted in the absence of any commercial or financial relationships that could be construed as a potential conflict of interest.
Publisher’s Note
All claims expressed in this article are solely those of the authors and do not necessarily represent those of their affiliated organizations, or those of the publisher, the editors and the reviewers. Any product that may be evaluated in this article, or claim that may be made by its manufacturer, is not guaranteed or endorsed by the publisher.
Acknowledgments
The authors thank Dr. Xiaolei Ru for his helpful discussion.
References
1. Qi P, Ru H, Gao L, Zhang X, Zhou T, Tian Y, et al. Neural Mechanisms of Mental Fatigue Revisited: New Insights from the Brain Connectome. Engineering (2019) 5:276–86. doi:10.1016/j.eng.2018.11.025
2. Preti MG, Leonardi N, Karahanoglu FI, Grouiller F, Genetti M, Seeck M, et al. Epileptic Network Activity Revealed by Dynamic Functional Connectivity in Simultaneous EEG-fMRI. In: 2014 IEEE 11th International Symposium on Biomedical Imaging (ISBI) (2014). p. 9–12. doi:10.1109/ISBI.2014.6867796
3. Song X, Roy B, Kang DW, Aysola RS, Macey PM, Woo MA, et al. Altered Resting-State Hippocampal and Caudate Functional Networks in Patients with Obstructive Sleep Apnea. Brain Behav (2018) 8:e00994. doi:10.1002/brb3.994
4. Jafri MJ, Pearlson GD, Stevens M, Calhoun VD. A Method for Functional Network Connectivity Among Spatially Independent Resting-State Components in Schizophrenia. Neuroimage (2008) 39:1666–81. doi:10.1016/j.neuroimage.2007.11.001
5. Zhang B, Yan G, Yang Z, Su Y, Wang J, Lei T. Brain Functional Networks Based on Resting-State EEG Data for Major Depressive Disorder Analysis and Classification. IEEE Trans Neural Syst Rehabil Eng (2021) 29:215–29. doi:10.1109/TNSRE.2020.3043426
6. Vecchio F, Miraglia F, Iberite F, Lacidogna G, Guglielmi V, Marra C, et al. Sustainable method for Alzheimer dementia prediction in mild cognitive impairment: Electroencephalographic connectivity and graph theory combined with apolipoprotein e. Ann Neurol (2018) 84:302–14. doi:10.1002/ana.25289
7. Matthews PM, Jezzard P. Functional Magnetic Resonance Imaging. J Neurol Neurosurg Psychiatry (2004) 75:6–12.
8. Schomer DL, Da Silva FL. Niedermeyer’s Electroencephalography: Basic Principles, Clinical Applications, and Related fields. Lippincott Williams & Wilkins (2012).
9. Herman GT. Fundamentals of Computerized Tomography: Image Reconstruction from Projections. Springer Science & Business Media (2009).
10. Tóth B, Urbán G, Haden GP, Márk M, Török M, Stam CJ, et al. Large-scale Network Organization of EEG Functional Connectivity in Newborn Infants. Hum Brain Mapp (2017) 38:4019–33. doi:10.1002/hbm.23645
11. Hassan M, Wendling F. Electroencephalography Source Connectivity: Aiming for High Resolution of Brain Networks in Time and Space. IEEE Signal Process Mag (2018) 35:81–96. doi:10.1109/MSP.2017.2777518
12. Dimitrakopoulos GN, Kakkos I, Dai Z, Wang H, Sgarbas K, Thakor N, et al. Functional Connectivity Analysis of Mental Fatigue Reveals Different Network Topological Alterations between Driving and Vigilance Tasks. IEEE Trans Neural Syst Rehabil Eng (2018) 26:740–9. doi:10.1109/TNSRE.2018.2791936
13. Zhou C, Zemanová L, Zamora-López G, Hilgetag CC, Kurths J. Structure–function Relationship in Complex Brain Networks Expressed by Hierarchical Synchronization. New J Phys (2015) 9:178. doi:10.1088/1367-2630/9/6/178
14. Medaglia JD, Lynall M-E, Bassett DS. Cognitive Network Neuroscience. J Cogn Neurosci (2015) 27:1471–91. doi:10.1162/jocn_a_00810
15. Baum GL, Ciric R, Roalf DR, Betzel RF, Moore TM, Shinohara RT, et al. Modular Segregation of Structural Brain Networks Supports the Development of Executive Function in Youth. Curr Biol (2017) 27:1561–72. doi:10.1016/j.cub.2017.04.051
16. Liu Y, Liang M, Zhou Y, He Y, Hao Y, Song M, et al. Disrupted Small-World Networks in Schizophrenia. Brain (2008) 131:945–61. doi:10.1093/brain/awn018
17. Zhao ZW, Liu W, Lu BL. Multimodal Emotion Recognition Using a Modified Dense Co-Attention Symmetric Network. In: 2021 10th International IEEE/EMBS Conference on Neural Engineering (NER). (2021). p. 73–76. doi:10.1109/NER49283.2021.9441352
18. Song T, Zheng W, Song P, Cui Z. EEG Emotion Recognition Using Dynamical Graph Convolutional Neural Networks. IEEE Trans Affective Comput (2018) 11:1. doi:10.1109/TAFFC.2018.2817622
19. Jalili M, Knyazeva MG. EEG-based Functional Networks in Schizophrenia. Comput Biol Med (2011) 41:1178–86. doi:10.1016/j.compbiomed.2011.05.004
20. Tahaei MS, Jalili M, Knyazeva MG. Synchronizability of EEG-Based Functional Networks in Early Alzheimer's Disease. IEEE Trans Neural Syst Rehabil Eng (2012) 20:636–41. doi:10.1109/tnsre.2012.2202127
21. Sun Y, Lim J, Meng J, Kwok K, Thakor N, Bezerianos A. Discriminative Analysis of Brain Functional Connectivity Patterns for Mental Fatigue Classification. Ann Biomed Eng (2014) 42:2084–94. doi:10.1007/s10439-014-1059-8
22. Gao Z, Zhang K, Dang W, Yang Y, Wang Z, Duan H, et al. An Adaptive Optimal-Kernel Time-Frequency Representation-Based Complex Network Method for Characterizing Fatigued Behavior Using the SSVEP-Based BCI System. Knowledge-Based Syst (2018) 152:163–71. doi:10.1016/j.knosys.2018.04.013
23. Daly I, Nasuto SJ, Warwick K. Brain Computer Interface Control via Functional Connectivity Dynamics. Pattern Recognition (2012) 45:2123–36. doi:10.1016/j.patcog.2011.04.034
24. Sun Y, Lim J, Kwok K, Bezerianos A. Functional Cortical Connectivity Analysis of Mental Fatigue Unmasks Hemispheric Asymmetry and Changes in Small-World Networks. Brain Cogn (2014) 85:220–30. doi:10.1016/j.bandc.2013.12.011
25. Wu X, Zheng WL, Lu B. Identifying Functional Brain Connectivity Patterns for EEG-based Emotion Recognition. In: 2019 9th International IEEE/EMBS Conference on Neural Engineering (NER) (2019). IEEE (2019). p. 235–8. doi:10.1109/NER.2019.8717035
26. Micheloyannis S, Pachou E, Stam CJ, Breakspear M, Bitsios P, Vourkas M, et al. Small-world Networks and Disturbed Functional Connectivity in Schizophrenia. Schizophrenia Res (2006) 87:60–6. doi:10.1016/j.schres.2006.06.028
27. Cao C, Slobounov S. Alteration of Cortical Functional Connectivity as a Result of Traumatic Brain Injury Revealed by Graph Theory, ICA, and sLORETA Analyses of EEG Signals. IEEE Trans Neural Syst Rehabil Eng (2010) 18:11–9. doi:10.1109/TNSRE.2009.2027704
28. Gonuguntla V, Kim J-H. EEG-based Functional Connectivity Representation Using Phase Locking Value for Brain Network Based Applications. Annu Int Conf IEEE Eng Med Biol Soc (Embc) (20202020) 2853–6. doi:10.1109/EMBC44109.2020.9175397 42nd
29. Yang S, Ai N, Qiao Y, Wang L, Yu H, Xu G. Brain Functional Network Improved by Magnetic Stimulation at Acupoints during Mental Fatigue. JBiSE (2016) 09:65–70. doi:10.4236/jbise.2016.910b009
30. Zhang J, Small M. Complex Network from Pseudoperiodic Time Series: Topology versus Dynamics. Phys Rev Lett (2006) 96:238701. doi:10.1103/physrevlett.96.238701
31. Xu X, Zhang J, Small M. Superfamily Phenomena and Motifs of Networks Induced from Time Series. Proc Natl Acad Sci U S A (2008) 105:19601–519605. doi:10.1073/pnas.0806082105
32. Stam CJ, Nolte G, Daffertshofer A. Phase Lag index: Assessment of Functional Connectivity from Multi Channel EEG and MEG with Diminished Bias from Common Sources. Hum Brain Mapp (2010) 28:1178–93. doi:10.1002/hbm.20346
33. Arslan S, Ktena SI, Makropoulos A, Robinson EC, Rueckert D, Parisot S. Human Brain Mapping: A Systematic Comparison of Parcellation Methods for the Human Cerebral Cortex. Neuroimage (2018) 170:5–30. doi:10.1016/j.neuroimage.2017.04.014
34. Cheng Z, Yang Y, Wang W, Hu W, Zhuang Y, Song G. Time2graph: Revisiting Time Series Modeling with Dynamic Shapelets. Aaai (2020) 34:3617–24. doi:10.1609/aaai.v34i04.5769
35. King J-R, Sitt JD, Faugeras F, Rohaut B, El Karoui I, Cohen L, et al. Information Sharing in the Brain Indexes Consciousness in Noncommunicative Patients. Curr Biol (2013) 23:1914–9. doi:10.1016/j.cub.2013.07.075
36. Deng B, Cai L, Li S, Wang R, Yu H, Chen Y, et al. Multivariate Multi-Scale Weighted Permutation Entropy Analysis of EEG Complexity for Alzheimer's Disease. Cogn Neurodyn (2017) 11:217–31. doi:10.1007/s11571-016-9418-9
37. Zhou T, Lü L, Zhang Y-C. Predicting Missing Links via Local Information. Eur Phys J B (2009) 71:623–30. doi:10.1140/epjb/e2009-00335-8
39. Chen G, Wang X, Li X. Fundamentals of Complex Networks: Models, Structures and Dynamics. John Wiley & Sons (2014).
40. Tang D, Du W, Shekhtman L, Wang Y, Havlin S, Cao X, et al. Predictability of Real Temporal Networks. Natl Sci Rev (2020) 7:929–37. doi:10.1093/nsr/nwaa015
41. Chen Z, Wu J, Xia Y, Zhang X. Robustness of Interdependent Power Grids and Communication Networks: A Complex Network Perspective. IEEE Trans Circuits Syst (2018) 65:115–9. doi:10.1109/tcsii.2017.2705758
42. Zhou C, Zemanová L, Zamora G, Hilgetag CC, Kurths J. Hierarchical Organization Unveiled by Functional Connectivity in Complex Brain Networks. Phys Rev Lett (2006) 97:238103. doi:10.1103/physrevlett.97.238103
43. Bullmore E, Sporns O. Complex Brain Networks: Graph Theoretical Analysis of Structural and Functional Systems. Nat Rev Neurosci (2009) 10:186–98. doi:10.1038/nrn2575
45. Liang X, Wang J, Yan C, Shu N, Xu K, Gong G, et al. Effects of Different Correlation Metrics and Preprocessing Factors on Small-World Brain Functional Networks: A Resting-State Functional MRI Study. PLoS One (2012) 7:e32766. doi:10.1371/journal.pone.0032766
46. Cerqueira A, Fraiman D, Vargas CD, Leonardi F. A Test of Hypotheses for Random Graph Distributions Built from EEG Data. IEEE Trans Netw Sci Eng (2017) 4:75–82. doi:10.1109/TNSE.2017.2674026
47. Kampffmeyer M, Chen Y, Liang X, Wang H, Zhang Y, Xing EP. Rethinking Knowledge Graph Propagation for Zero-Shot Learning. Proc IEEE Conf Comp Vis Pattern Recognition (2019) 11487–96. doi:10.1109/cvpr.2019.01175
48. Ji X, Henriques JF, Vedaldi A. Invariant Information Clustering for Unsupervised Image Classification and Segmentation. Proc IEEE Int Conf Comp Vis (2019) 9865–74. doi:10.1109/iccv.2019.00996
49. Manevitz LM, Yousef M. One-class SVMs for Document Classification. J Machine Learn Res (2002) 2:139–54.
50. Tax DMJ, Duin RPW. Support Vector Data Description. Machine Learn (2004) 54:45–66. doi:10.1023/b:mach.0000008084.60811.49
51. Ford JM, Palzes VA, Roach BJ, Mathalon DH. Did I Do that? Abnormal Predictive Processes in Schizophrenia when Button Pressing to Deliver a Tone. Schizophrenia Bull (2014) 40:804–12. doi:10.1093/schbul/sbt072
52. Andriy T, Achintya S, Gordon L. Detection of Seizures in Intracranial EEG: Upenn and mayo Clinic’s Seizure Detection challenge. In: 2015 37th Annual International Conference of the IEEE Engineering in Medicine and Biology Society (EMBC). IEEE (2015). p. 6582–5.
53. Ponten SC, Daffertshofer A, Hillebrand A, Stam CJ. The Relationship between Structural and Functional Connectivity: Graph Theoretical Analysis of an EEG Neural Mass Model. Neuroimage (2010) 52:985–94. doi:10.1016/j.neuroimage.2009.10.049
54. Hassan M, Wendling F. Electroencephalography Source Connectivity: Aiming for High Resolution of Brain Networks in Time and Space. IEEE Signal Process Mag (2018) 35:81–96. doi:10.1109/msp.2017.2777518
Keywords: electroencephalogram, functional network, mental fatigue, schizophrenia, epilepsy
Citation: Cui W-K, Qi X-R, Sun Y and Yan G (2022) Multilayer-Aggregation Functional Network for Identifying Brain Fatigue and Diseases. Front. Phys. 9:822915. doi: 10.3389/fphy.2021.822915
Received: 26 November 2021; Accepted: 23 December 2021;
Published: 20 January 2022.
Edited by:
Gaogao Dong, Jiangsu University, ChinaReviewed by:
Xiaoke Xu, Dalian Nationalities University, ChinaZhihai ‘Rong, University of Electronic Science and Technology of China, China
Copyright © 2022 Cui, Qi, Sun and Yan. This is an open-access article distributed under the terms of the Creative Commons Attribution License (CC BY). The use, distribution or reproduction in other forums is permitted, provided the original author(s) and the copyright owner(s) are credited and that the original publication in this journal is cited, in accordance with accepted academic practice. No use, distribution or reproduction is permitted which does not comply with these terms.
*Correspondence: Gang Yan, gyan@tongji.edu.cn
†These authors have contributed equally to this work