Filling model of oil and polar liquid for electrowetting displays based on phase change
 Hongwei Jiang
 Rongzhen Qian
 Wenwen Chen
 Rui Zhou
 Guofu Zhou
- 1Guangdong Provincial Key Laboratory of Optical Information Materials and Technology & Institute of Electronic Paper Displays, South China Academy of Advanced Optoelectronics, South China Normal University, Guangzhou, China
- 2Academy of Shenzhen Guohua Optoelectronics, Shenzhen, China
Reflective displays have recently attracted more and more attention because of the advantages of low power consumption and eye protection. Among them, electrowetting display (EWD) is the most potential reflective display technology due to its full color and video speed advantages. However, filling models of oil and polar liquids in EWD fabrication were rarely reported. In this paper, a phase change filling model was proposed, and its related equipment was designed and manufactured. The efficiency of phase change filling model has a significant advantage compared to conventional filling models, which can finish the whole process of filling and coupling for 400*500 mm panel within 270 s while the efficiency of other filling models is over 10 min. Since the process of oil filled into the pixels was released into the air environment, the dosing method was significantly enriched, and dosing accuracy was more controllable. The experimental results showed that, a good response time and a high pixel aperture ratio of 31.78 ms and 68.2% can be obtained, respectively.
Introduction
E-paper displays have received widespread attention due to their advantages of lower power consumption and sunlight readability [1–4]. On this basis, the electrowetting display (EWD) has the characteristics of full color and video speed response, which make it become the most potential reflective display technology in the future [5–10]. In 2003, Robert A. Hayes first proposed the typical structure of EWD and published it in Nature [11]. Subsequently, the research activities of EWD won rapid development, more and more universities and research institutes worldwide joined this field.
A typical EWD device mainly includes top and bottom electrodes, a hydrophobic layer, pixel walls mounted on a bottom electrode, mutually incompatible colored oil and transparent polar liquids. The transparent polar liquid plays a role in changing wettability on solid surfaces and pushing oil to spread or shrink, corresponding to a single pixel “on” or “off”. The colored oil plays dual roles of the grayscale switching and color demonstration, which make it the core material in EWDs [12–15]. Therefore, the precise filling of colored oil and polar liquid in EWDs determines its optical performance. Chasing the efficient and uniform filling of colored oil, various filling models have been studied in the EWDs fabrication. The University of Cincinnati started research in EWDs filed since 2005 [16] and proposed an oil filling model based on the interface self-assembly in 2007 [17], which used the advantage of wettability difference between oil and polar liquid on the surface of pixel wall. The speed of this filling model was restricted by the oil spreading rate, which was typically 1 mm/s. So the efficiency of this model was over 10 min for a 400*500 mm panel. Filling results were susceptible to oil-polar liquid interface disturbance and substrate immersion speed. Based on Cincinnati’s work, Liquivista proposed a self-assembly filling concept of dosing oil at the three-phase contact line when the polar liquid level rose and intersected with the substrate [18], which reduced oil residue and consumption. However, it failed to overcome the bottleneck of efficiency and accuracy problems of the filling process. In addition, to avoid trapping bubbles in pixels, Liquivista also invented a method for filling oil with a unique bubble-liquid separation structure [19, 20]. The core of the method is to control the ratio of oil to air bubbles in the cavity to achieve the removal of air bubbles trapped in the pixel. This technology has very high requirements for the consistency of filling gap and the precise controllability of oil/bubbles, and the filling efficiency is extremely low. National Chiao Tung University in Chinese Taipei [21] and Advanced Display Technology Co., Ltd. (ADT) in Germany (ADT) [22] made a beneficial attempt to fill oil based on inkjet printing technology, which could achieve an excellent filling consequence for larger pixels. However, the design and manufacture of high-density inkjet printing nozzles and precise oil supply systems are still enormous challenges for the pico-level filling accuracy demand. Recently, Wen Chenyu et al. [23] of Nanjing University reported a capillary-based oil filling model which was similar to the vacuum filling of liquid crystals in the LCD fabrication process. However, it required that the distance between the top and bottom substrates was bigger than 300 μm, which was not conducive to the sealing and mechanical stability of the panel. Considering the risk of residual oil in corners and the gap of display devices, the actual filling effect was not as well as the simulation result.
In this paper, a novel filling model was proposed to achieve filling of oil and polar liquid in sequence, which utilized the differences in freezing points of oil and polar liquid. It creatively solved the limitation that oil always was filled in the polar liquid surroundings. The polar liquid was dosed with one big droplet on the frozen oil surface, then the top and bottom substrates were aligned and coupled. The proposed filling model improved the fabrication efficiency and had a good controllability of oil and polar liquid amount.
Principle
Basic principle of electrowetting
Electrowetting (EW) refers to manipulating the movement of a small amount of liquid on solid surfaces by adjusting the surface wettability using electric fields [24, 25]. For a liquid drop in the ambient vapor of a general liquid-vapor system, the angle between the liquid-vapor interface and the solid-liquid interface is known as the contact angle of the liquid. This angle is typically denoted as Young’s angle θy. The relationship between θy and the three interfacial (solid-liquid, solid-vapor, and liquid-vapor) tensions is described by the Young-Dupré Equation as shown in Eq. 1:
Where the droplet phase is marked by “l”, the ambient medium by “v”, and the electrode is a solid “s”. For convenience, “v” is used no matter whether the ambient medium is actually a vapor phase or another condensed immiscible dielectric, such as oil. And for EWOD (electrowetting-on-dielectric), “s” is represented the entire substrate. γsl, γsv, and γ are the solid-liquid, solid-vapor, and liquid-vapor interfacial tension, respectively. Details are shown in Figure 1.
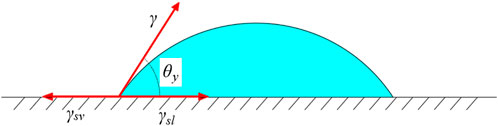
FIGURE 1. Force balance at the droplet contact line.
It is assumed that the electrolyte is completely uniform at zero voltage up to the interface. Then, upon applying a potential ϕd at the solid surface, the variation of the interfacial energy is given by Eq. 2. Where σ is the charge density in the diffuse layer.
For the diffuse layer charge, there will be Eq. 3
Where
Simply, the applied voltage U is equivalent to the potential difference ϕd across the diffuse layer. Eq. 4 can be rewritten as Eq. 5.
Eq. 5 is often known as Young-Lippmann (YL) equation. It is a critical equation that relates the electrostatic energy to the wettability. All above is the theory about EW without the dielectric. As for EWOD, the relevant energy is the electrostatic energy in the macroscopic capacitor rather than the free energy of the EDL. The macroscopic capacitor is formed among the liquid, the electrode and the dielectric layer.
Principle of electrowetting device
In the mid-1990s, Bruno Berge and his colleagues [26] promoted the idea of introducing hydrophobic polymer films as insulators between an electrode on the substrate and the fluid. In EW applications, a dielectric coating on the electrode is almost exclusively involved. The aim is to insulate the conductive fluid from the electrode and thereby prevent chemical reactions. This layer contributes to the robustness and reliability of EW. This general structure is shown in Figure 2 and it is often denoted as EWOD to emphasize the presence of the dielectric coating. Where d is the thickness of the dielectric coating layer and R is the drop size of the droplet.
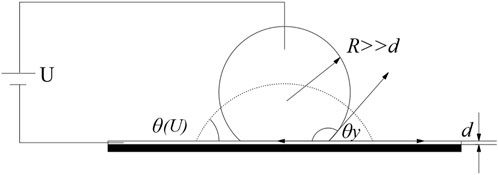
FIGURE 2. The basic model of an EWOD experiment.
The variation of the macroscopic contact angle in an EWOD before contact angle saturation is described by the Young-Lippmann equation, which is shown in Eq. 6.
Eq. 6 is similar to Eq. 5, except that d replaces the thickness of EDL. This leads to the differences between EW without dielectric and EWOD. For EWOD, the ratio in the right part of Eq.6 is typically four to six orders of magnitude smaller than that in Eq. 5, depending on the properties of the dielectric coating layer. Consequently, the voltage required to achieve a substantial contact angle decrease in EWOD is much higher, which is more suitable for actual applications.
Generally, an essential EWD device is composed of two parallel plates functioning as top/bottom electrodes, polar liquid and a second immiscible colored oil, as shown in Figure 3. The bottom substrate is layered with a conductive layer such as indium tin oxide (ITO), a dielectric layer, and a hydrophobic layer (like Teflon and Cytop). The hydrophobic layer enhances the change in contact angle with electrical actuation and prevents the droplet from sticking. When a certain voltage is applied to the system, the interfacial tension between the polar liquid and the surface of the bottom substrate will be changed.
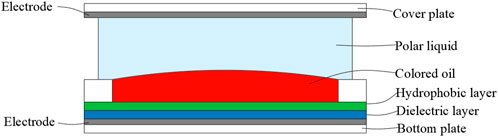
FIGURE 3. Pixel structure of an EWD panel.
Device fabrication
Preparation of top and bottom substrates
A patterned ITO panel and TFT-array panel could be selected as the bottom plate, and a non-patterned ITO panel was used for the top plate. The patterned ITO and non-patterned ITO glasses used in this experiment were ordered from Wuhu Token Technology, the thickness of the ITO layer was around 25 nm, and the square resistance was 70–90 Ω/cm2. The bottom substrate was composed of a dielectric layer, a hydrophobic layer, and a pixel wall structure. The top substrate had photo-spacers mounted on the ITO surface to control the gap between the top and bottom substrates. The detailed process is shown in Figure 4.
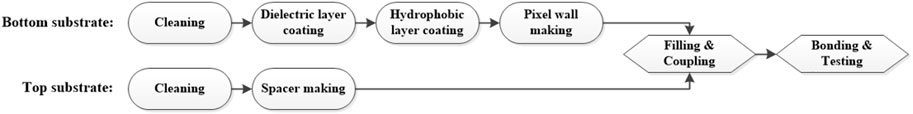
FIGURE 4. Fabrication process of an EWD device.
First, the top and bottom plates needed to be cleaned to remove particles and organic contaminants. The dielectric layer was a patterned layer mounted on electrodes and was realized by photolithography. A negative photoresist for dielectric layer was spin-coated (KW-4A, Institute of Microelectronics, Chinese Academy of Science, China) on the ITO glass surface at 1500 r/min for 1 min and pre-baked (EH20B Lab Tech, China) at 110°C for 1.5 min. Then through exposure ((URE-2000/35, Institute of Optics and Electronics, Chinese Academy of Science) with 30 mJ/cm2, post-exposure baking at 110°C for 90 s, development in 238D solution for 90 s, and post-curing at 230°C for 30 min to obtain a 1 μm dielectric layer structure. The hydrophobic layer was obtained by one-step screen printing (HD-3050, Dongguan, China). The selected material was DuPont AF1600 solution, the film thickness was 800 nm, and the film thickness uniformity deviation was less than ±5%. Due to the hydrophobicity of AF1600, a plasma treatment on hydrophobic layer was carried out to make the following photoresist coating possible. A negative photoresist for pixel wall was coated on the hydrophobic layer by the same spin coater and pre-baked at 110°C for 1.5 min. Then through exposure (80 mJ/cm2), post-exposure baking (110°C, 90 s), development (0.4% KOH, 90 s), and post-curing (185°C, 30 min) to obtain the pixel wall, whose height was 3 μm and line width was 11 μm. Above that, photoresist for dielectric layer and pixel wall were all purchased from Weifang Suntific Technology, and the models were HN-022N and HN-008N, respectively. Structures on the bottom substrate are shown in Figure 5.
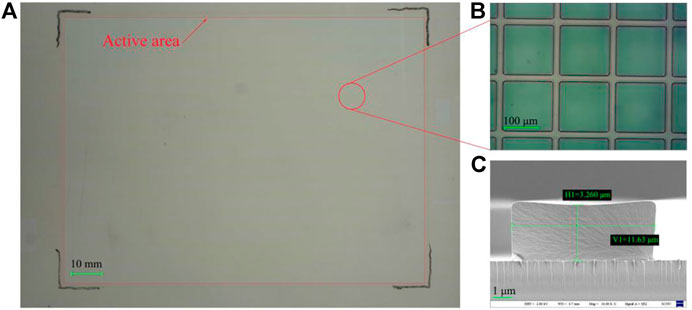
FIGURE 5. The as-prepared bottom substrate. (A) macro photo of bottom substrate was taken by a crammer, and (B) the pixel wall structure was taken under the microscope, the pixel size was 184*184 μm. (C) Morphology of the pixel wall under the SEM, Pixel wall width was 11.63 μm and height was 3.26 μm, with SEM parameters of EHT = 2.00 KV, WD = 4.7 mm, Mag = 10.00 K X (magnification was 10.00K times), Signal A = SE2.
Compared with bottom substrate, the structure on the top substrate was much simpler. There were only photo-spacers, which were realized by photolithography. A negative photoresist was spin-coated on the non-patterned ITO glass surface at 700 r/min for 90 s and pre-baked at 120°C for 8 min. Then through exposure (1500 mJ/cm2), post-exposure baking (120°C, 8 min), development (25°C, 2.38% TMAH, 5 min), and post-curing (185°C, 30 min) to obtain spacers, whose height was around 40 μm and diameter was about 30 μm. The photoresist for photo spacers was purchased from Weifang Suntific Technology, and the models was HN-1903. The spacer shape is shown in Figure 6.
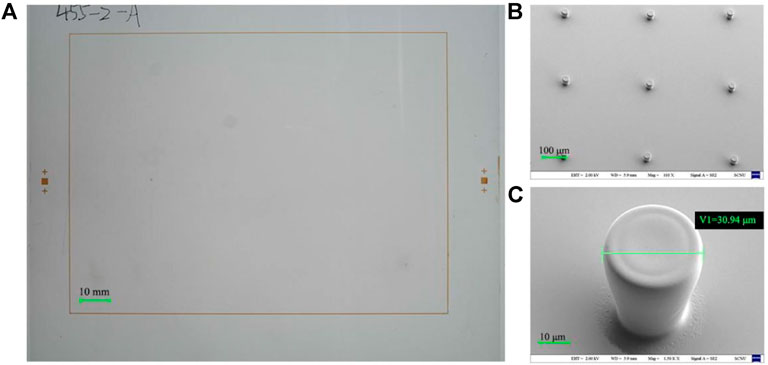
FIGURE 6. The as-prepared top substrate. (A) macro photo of top substrate was taken by a crammer, and (B) the spacer was taken under SEM with the parameters of EHT = 2.00 KV, WD = 5.9 mm, Mag = 110 X, Signal A = SE2. (C) Morphology of a single spacer under the SEM, Pixel wall width was 11.63 μm and height was 3.26 μm, with SEM parameters of EHT = 2.00 KV, WD = 5.9 mm, Mag = 1.50 K X, Signal A = SE2.
Phase change filling and coupling
In an EWD device, both colored oil and polar liquid are critical to display performance, such as grayscale, contrast, brightness, aperture ratio, response time, etc. Therefore, precisely filling of oil and polar liquid can determine the performance of EWDs.
In this work, colored oil was printed into pixels by an inkjet printer (PiXDRO TPI IP410, Meyer Burger, Netherlands), and frozen on a cold plate which could reach −40°C. Dodecane was selected as the solvent for oil and the freezing point was about −9.6°C so that oil phase could be frozen very fast. The polar liquid was dripped via a dispenser, and its temperature was always controlled under −20°C to prevent melting of the frozen oil phase. The polar liquid was a 1:1 mixed solution of glycerol and ethylene glycol, and the freezing point was around −35°C to ensure that the liquid state could still be maintained in a low-temperature environment. For top substrate, the sealing material was prepared as a box pattern on glass surface by a dispenser, where the sealing material was UV-curable acrylic resin. Finally, the top and bottom substrates were aligned and bonded together, and the device fabrication was completed along with a UV curing process. The detailed procedure can be seen in Figure 7.
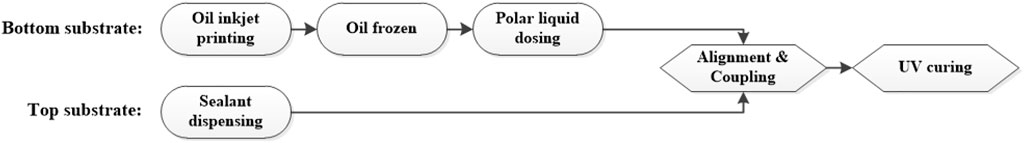
FIGURE 7. Flow chart of phase change filling and coupling.
Results and Discussion
Phase change of the colored oil
Since the freezing point of colored oil is −9.6°C, any cooling temperature below -10°C can make the oil phase solid. So various freezing temperatures and freezing times were selected for experimental, as shown in Figure 8. To facilitate the operation, oil was directly coated on the surface of bottom substrates by slit coating.
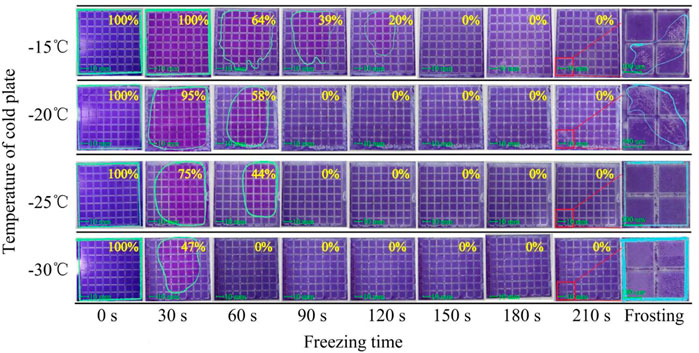
FIGURE 8. Proportions of unphase-changed oil at different temperatures and freezing times.
It can be seen in Figure 8 that there were four temperatures selected for the freezing experiment, which were −15°C, −20°C, −25°C, and −30°C, respectively. The freezing time was from 0 s to 210 s with a step increase of 30 s. When the freezing temperature was −15°C, the oil at the edge of panel began to solidify within 60 s, the color of the solidified oil became lighter. And 64% of unphase-changed oil remained at 60 s as shown in the blue circle. Finally, it took 150 s to complete the phase change of all the oil. When the freezing temperature was reduced to −20°C and −25°C, the oil began to solidify within 30 s and took 90 s to complete the phase change process. The phase change speed at −25°C was a little faster than −20°C, which means the unphase-changed oil at −25°C was less than −20°C within 60 s freezing time as shown in blue circle. When the freezing temperature further decreased to −30°C, it only took 60 s to solidify all the oil. As the freezing temperature decreased, the problem of condensed water would gradually appear. When the temperature was below −30°C, the frosting problem would be so serious that the whole segments were fully covered by frost (as shown in column of frosting defect in Figure 8). Thus, it was more appropriate to select the temperature above −20°C as the freezing temperature.
Unfrozen of the solid oil phase
Inkjet printing provides a reliable filling model which precisely controls the volume of oil filled in each pixel. In this work, 25 oil droplets of 10 pL were printed in single pixel. Since the interfacial energy of oil in air was not enough to wet the surface of the hydrophobic layer, the oil droplet formed a shape of a sizeable shrinking droplet in the middle of the pixel, as shown in Figure 9A, the diameter was about 46.92 μm. During the unfrozen process, oil droplets would spread in the pixels. This was also a good indication of when the oil unfrozen process was complete, as shown in Figure 9B, the unfrozen time was 40 s.
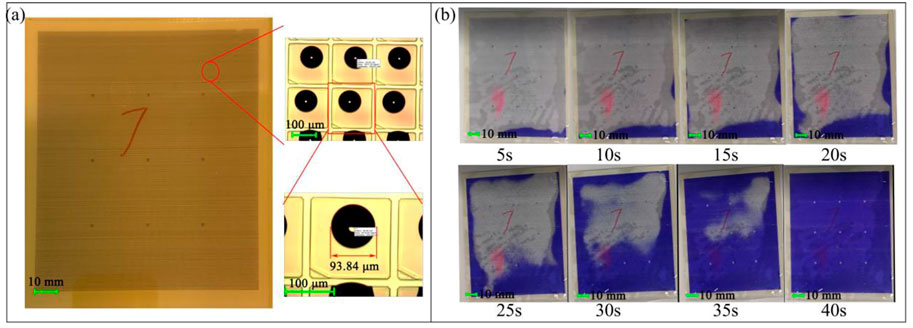
FIGURE 9. (A) Oil filled stage in bottom substrate. Each pixel contained 25 droplets of oil, and the diameter of oil was 93.84 μm. (B) Unfrozen process of solid oil at room temperature.
As the panel temperature gradually increased, the edge area began to melt at 5 s, and as time went on, the melted area and melting speed also steadily increased. When the unfrozen time exceeded 20 s, the melted area rose rapidly, and nearly 80% of the melted area was completed in the following 20 s.
Performance of EWDs
An entire EWD can be equivalent to a complex series shunt capacitors. Oil movement can cause a change of capacitance values under driving. The contact angle related to the capacitance has been reported in Verheijen and Prins’s work [27]. In the “off” state, the pixel capacitance was primarily determined by oil film thickness and it was typically small. In the “on” state, where the capacitance was primarily determined by the thickness of the fluoropolymer insulator (0.5–0.8 µm), the capacitance increased significantly. Capacitance changes depended on the size of the area from which the oil has been removed (the so-called “aperture ratio”). Because the brightness of EWDs was proportional to the pixel capacitance, the device’s performance could be measured through the capacitance value. The EWD was driven and measured by an impedance analyzer (WK6500B, United Kingdom). The Capacitance-Voltage (C-V) data was shown in Figure 10, the capacitance value did not change until the driving voltage reached 16 V. Then the capacitance increased significantly as the voltage increased. It could be known that 16 V was the device’s threshold voltage, at which oil film began to rupture and shrink. During the closing process, the capacitance decreased as the voltage decreased, and the “off” voltage was 4 V. The device closing C-V curve determined the performance of the grayscale. It could be seen from Figure 10 that all closing C-V curves were nearly linear and had an “off” voltage of 4 V, so it proved that the device had good grayscale controllability.
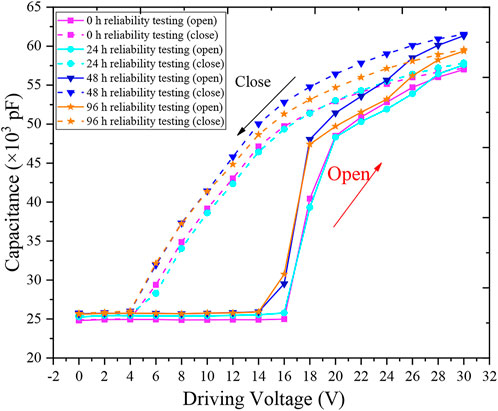
FIGURE 10. Capacitance-Voltage curves of the EWD after 0 h, 24 h, 48 h, and 96 h reliability tests.
Considering that the oil phase would change during phase transition. In order to confirm that there was no damage to the surface of hydrophobic layer, reliability tests of 24 h, 48 h, and 96 h were also carried out. Assuming that the surface of hydrophobic layer was damaged, the device would be broken down and the capacitance value would change. The repeatability of the C-V curve would be lost after the reliability test. It can be seen from Figure 10 that the threshold voltages were always 16 V and the “off” voltages were always 4 V. The C-V curve had good repeatability, so the phase change process did not damage the hydrophobic layer.
As a reflective display, the brightness of EWDs is critical. It depends on the aperture ratio of pixel, so the maximum aperture ratio of a single pixel will determine the display white state and contrast ratio. The pixel switch was visualized and captured by using a high-speed camera (Phantom MiRO M110, Vision Research) integrated with a microscope (CKX41, Olympus). The pixel remained “off” state until the driving voltage reached 16 V, which was consistent with the C-V curve shown in Figure 10. When the driving voltage was 18 V, the aperture ratio was 10.9%. Then the aperture ratio of pixels increased rapidly as the voltage increased and reached an aperture ratio of 68.2% at 40 V as shown in Figure 11.
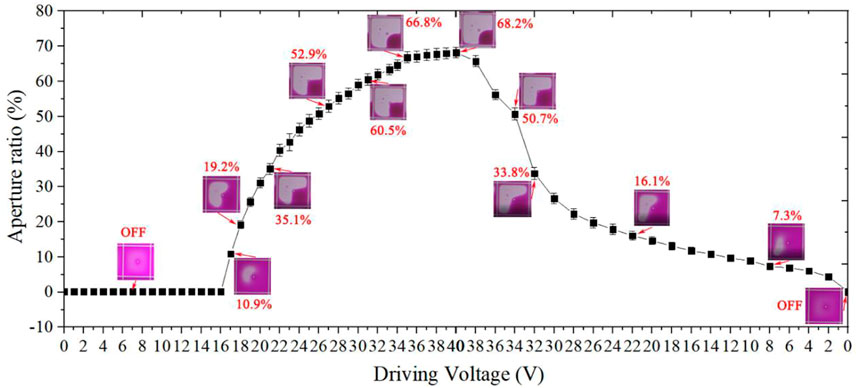
FIGURE 11. Pixel aperture ratio values with different driving voltages.
Response time is an essential indicator of the EWD. The brightness of the EWD is measured by a colorimeter (Admesy-arges45). The time required to reach 90% of the maximum brightness was calculated as the “on” time (ton). The time required to drop the “off” state was the turn-off time (toff). As shown in Figure 12, ton was 10.81 ms, toff was 20.97 ms while for the Liquavista filling method reference opening time and closing time were 12 ms and 13 ms, respectively [11]. The response time was 31.78 ms which could realize a 30 fps video play.
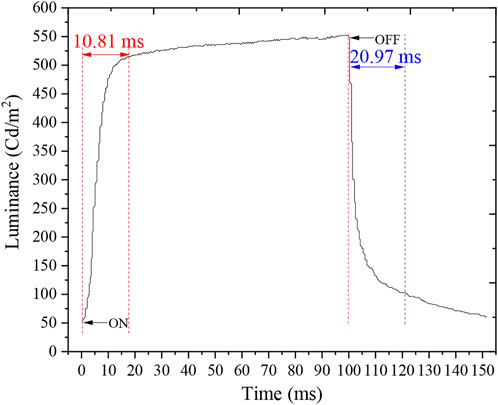
FIGURE 12. Response time at a driving voltage of 30 V.
Conclusion
In this paper, an EWD based on phase change filling model was proposed. The functional testing proved that the EWD device prepared by this method had good optical performance and video-speed response time. Oil was filled into pixels by inkjet printing to precisely control the amount. The oil’s low-temperature phase change and the separate drip of polar liquid significantly improve fabrication efficiency and controllability. The phase change filling model of oil had good regularity at different temperatures, which provided a theoretical basis for calculation of the filling efficiency. Therefore, this method brings a valuable tool for the industrialization of EWDs.
Data availability statement
The original contributions presented in the study are included in the article/Supplementary Material, further inquiries can be directed to the corresponding author.
Author contributions
HJ contributed to the conception of the study and manuscript preparation; RQ performed the experiment; WC contributed significantly to analysis; RZ made important amendments to the paper; GZ helped perform the analysis with constructive discussions, and approved the final paper to be published.
Funding
This work was supported by National Key R&D Program of China (2021YFB3600601), National Natural Science Foundation of China (No. 22008156), Guangdong Basic and Applied Basic Research Foundation (No. 2021A1515011768), Science and Technology Program of Guangzhou (No. 2019050001, No. 201904020007), Program for Guangdong Innovative and Entrepreneurial Teams (No. 2019BT02C241), Program for Chang Jiang Scholars and Innovative Research Teams in Universities (No. IRT_17R40), Guangdong Provincial Key Laboratory of Optical Information Materials and Technology (Grant No. 2017B030301007), Guangzhou Key Laboratory of Electronic Paper Displays Materials and Devices (201705030007), MOE International Laboratory for Optical Information Technologies and the 111 Project.
Conflict of interest
The authors declare that the research was conducted in the absence of any commercial or financial relationships that could be construed as a potential conflict of interest.
Publisher’s note
All claims expressed in this article are solely those of the authors and do not necessarily represent those of their affiliated organizations, or those of the publisher, the editors and the reviewers. Any product that may be evaluated in this article, or claim that may be made by its manufacturer, is not guaranteed or endorsed by the publisher.
Supplementary material
The Supplementary Material for this article can be found online at: https://www.frontiersin.org/articles/10.3389/fphy.2022.1024775/full#supplementary-material
References
1. Comiskey B, Albert JD, Yoshizawa H, Jacobson J. An electrophoretic ink for all-printed reflective electronic displays. Nature (1998) 394(6690):253–5. doi:10.1038/28349
2. Heikenfeld J, Smith N, Dhindsa M, Zhou K, Kilaru M, Hou L, et al. Recent progress in arrayed electrowetting Optics. Opt Photon News (2009) 20(1):20. doi:10.1364/OPN.20.1.000020
3. Heikenfeld J, Zhou K, Kreit E, Raj B, Yang S, Sun B, et al. Electrofluidic displays using Young–Laplace transposition of brilliant pigment dispersions. Nat Photon (2009) 3(5):292–6. doi:10.1038/nphoton.2009.68
4. Heikenfeld J, Steckl A. Demonstration of fluorescent RGB electrowetting devices for light wave coupling displays. J Display Tech (2004) 5, 302–5.
5. Yi Z, Zeng W, Ma S, Feng H, Shen S. Design of driving waveform based on a damping oscillation for optimizing red saturation in three-color electrophoretic displays. Micromachines (2022) 12(2):162. doi:10.3390/mi12020162
6. Kao WC, Tsai JC. Driving method of three-particle electrophoretic displays. IEEE Trans Electron Devices (2018) 3(65):1023–8. doi:10.1109/TED.2018.2791541
7. Wang L, Yi Z, Jin M, Shui L, Zhou G. Improvement of video playback performance of electrophoretic displays by optimized waveforms with shortened refresh time. Displays (2017) 49:95–100. doi:10.1016/j.displa.2017.07.007
8. He W, Yi Z, Shen S, Huang Z, Liu L, Zhang T, et al. Driving waveform design of electrophoretic display based on optimized particle activation for a rapid response speed. Micromachines (2020) 11(5):498. doi:10.3390/mi11050498
9. Yi Z, Bai P, Wang L, Zhang X, Zhou G. An electrophoretic display driving waveform based on improvement of activation pattern. J Cent South Univ (2014) 21(8):3133–7. doi:10.1007/s11771-014-2285-9
10. Shen S, Gong Y, Jin M, Yan Z, Xu C, Yi Z, et al. Improving electrophoretic particle motion control in electrophoretic displays by eliminating the fringing effect via driving waveform design. Micromachines (2018) 9(4):143. doi:10.3390/mi9040143
11. Hayes RA, Feenstra BJ. Video-speed electronic paper based on electrowetting. Nature (2003) 425(6956):383–5. doi:10.1038/nature01988
12. Chiang Y, Chao Y. Synthesis of dis-azo black dyes for electrowetting displays. Mater Sci Eng B (2012) 177(18):1672–7. doi:10.1016/j.mseb.2012.08.011
13. Chiang Y, Chao Y. Synthesis and application of oil-soluble red dyes derived from p-n-Alkyl aniline. Mater Sci Appl (2014) 5(8):485–90. doi:10.4236/msa.2014.58052
14. Lee P, Chiu C, Chang L, Chou P, Lee T, Chang T, et al. Tailoring pigment dispersants with polyisobutylene twin-tail structures for electrowetting display application. ACS Appl Mater Inter (2014) 6(16):14345–52. doi:10.1021/am503599k
15. Lee P, Chiu C, Lee T, Chang T, Wu M, Cheng W, et al. First fabrication of electrowetting display by using pigment-in-oil driving pixels. ACS Appl Mater Inter (2013) 5(13):5914–20. doi:10.1021/am401840b
16. Heikenfeld J, Steckl AJ. Intense switchable fluorescence in light wave coupled electrowetting devices. Appl Phys Lett (2004) 86(1):011105. doi:10.1063/1.1842853
17. Sun B, Zhou K, Lao Y, Heikenfeld J, Cheng W. Scalable fabrication of electrowetting displays with self-assembled oil dosing. Appl Phys Lett (2007) 91(1):011106. doi:10.1063/1.2753697
21. Huang YS, Kuo SW, Kuo YS, Chen CY, Lo KL, Cheng WY, et al. Single-layered multi-color electrowetting display by using ink-jet-printing technology and fluid-motion prediction with simulation. J Soc Inf Disp (2011) 19(7):488–95. doi:10.1889/JSID19.7.488
22. Andriy B, Frank B, Jürgen R, Karlheinz B. Production considerations for bistable droplet driven electrowetting displays. SID Int Symp Dig Tech Pap (2012) 43(2):846–9. doi:10.1002/j.2168-0159.2012.tb05918.x
23. Wen CY, Ren J, Xia J, Gu T. Self-assembly oil-water perfusion in electrowetting displays. J Display Technol (2013) 9(2):122–7. doi:10.1109/JDT.2012.2236641
24. Mugele F, Heikenfeld J. Electrowetting: Fundamental principles and practical applications[M]. Hoboken, New Jersey, United States: John Wiley & Sons (2018).
25. Mugele F, Baret JC. Electrowetting: From basics to applications. J Phys : Condens Matter (2005) 17(28):R705–74. doi:10.1088/0953-8984/17/28/R01
26. Berge B. Electrocapillarity and wetting of insulator films by water. Comptes Rendus de l Academie des Sci - Ser Math (1993) 317:157–63.
Keywords: electrowetting display, colored oil, polar liquid, phase change, filling
Citation: Jiang H, Qian R, Chen W, Zhou R and Zhou G (2022) Filling model of oil and polar liquid for electrowetting displays based on phase change. Front. Phys. 10:1024775. doi: 10.3389/fphy.2022.1024775
Received: 22 August 2022; Accepted: 27 September 2022;
Published: 11 October 2022.
Edited by:
Qiang Xu, Nanyang Technological University, SingaporeReviewed by:
Huilong Liu, Guangdong University of Technology, ChinaBin Liu, Sun Yat-sen University, China
Copyright © 2022 Jiang, Qian, Chen, Zhou and Zhou. This is an open-access article distributed under the terms of the Creative Commons Attribution License (CC BY). The use, distribution or reproduction in other forums is permitted, provided the original author(s) and the copyright owner(s) are credited and that the original publication in this journal is cited, in accordance with accepted academic practice. No use, distribution or reproduction is permitted which does not comply with these terms.
*Correspondence: Rui Zhou, zhourui@m.scnu.edu.cn