A representation and classification method for collective investor attention in the financial market
 Zhen-Hua Yang1,2†
  Zi-Yi Wang
- 1School of Economics and Management, Huzhou University, Huzhou, China
- 2Zhejiang Ecological Civilization Executive Leadership Academy, Huzhou, China
- 3China Unionpay Data, Shanghai, China
- 4School of Humanities and Social Science, Xi'an Jiaotong University, Xi'an, China
- 5Faculty of Business Information, Shanghai Business School, Shanghai, China
- 6Institute of Accounting and Finance, Shanghai University of Finance and Economics, Shanghai, China
- 7Research Group of Computational and AI Communication at Institute for Global Communications and Integrated Media, Fudan University, Shanghai, China
Introduction: It is increasingly becoming integral to analyze the collected information effectively.
Methods: We propose a representation and classification method for collective investor attention in the financial market, taking the Chinese stock market as an example. The method includes three key steps: 1) converting the hourly search volume of each stock per week to an image representation for describing the changes of collective investor attention; 2) extracting features of each image by utilizing a self-encoding algorithm in deep learning; and 3) clustering generated images by K-means to arrange stocks into different groups.
Results: The empirical results show that the portfolio considering the clustering information outperforms the HS300 index.
Discussion: The method may not only use deep learning features for stock similarity measurement, but also shed some light on profoundly understanding the mechanisms of the collective investor attention for the financial market.
1 Introduction
Collective attention given by the investors in the financial market is related closely to the investors’ potential interests and trading behaviors. The financial market is a typical complex system characterized by a highly intricate organization and the emergence of collective behavior [1,2]. Therefore, it is significant to understand how investors pay attention to different stocks propagating among a large population in the financial market. Attention becomes a scarce cognitive resource [3], especially in this society with information overload. Millions of investors remain active to generate information in the financial market to form a vast knowledge base [4–6]. Researchers have recently provided a theoretical framework in which investor-limited attention can affect asset pricing statics and dynamics [7–9]. However, it still has a research gap about the proper method to represent and classify the considerable knowledge base of collective investor attention, which could help us understand massive user-generated data in the financial market. This work offers an exploration for collective investor attention by proposing a representation and classification method from the viewpoint of user-generated data.
Because of the network technology development, the methods for measuring investors’ attention have gone through three main stages. The first stage is based on the endogenous data, mainly including extreme return [10], trading volume [11–13], and turnover [14,15]. The second stage is based on the primary exogenous data, mainly including news media coverage [16–18] and advertising expenses [19,20]. The third stage is based on the advanced exogenous data, mainly including search volume index (SVI) [21–25] and social network (including Twitter feeds, blogs, forum, and Wikipedia) [26–30]. Above all, the massive data sources resulting from human interaction with the Internet have offered a new perspective on the behavior of market participants besides investors in the stock market. For example, Da et al. [21] found that the increase in the SVI could successfully predict higher stock prices in a short term and an eventual price reversal. Based on Google Trends or Baidu index, the similar results have been found in French, Japanese, Chinese, and other stock markets [4,23,31–33]. Inspired by the previous research works, this work collects the search volumes through a specific web browser hourly to analyze the collective investor attention in the financial markets in this paper.
Moreover, convolutional deep learning approaches, such as Convolutional AutoEncoder (CAE, unsupervised) [34], Convolutional Neural Network (CNN, supervised) [35], and multilayer supervised network [36,37], have achieved very impressive performance for analyzing visual imagery. It has motivated researchers to convert raw input signals to other modalities of images to be processed by CNNs or CAEs. Some of the good results have been achieved for diverse applications. For example, [38] introduced a new approach to computer Go that used networks to evaluate board positions and policy networks to select moves; [39] described implementation of the standard i-vector-PLDA framework for the Kaldi speech recognition toolkit. In particular, [40] applied Convolutional AutoEncoder to learn a stock representation and proposed a novel portfolio construction strategy, which combined high returns with low risk. In this work, however, we introduce a representation and classification method for collective data by taking the Chinese stock market as an example. This method employs the image representation and self-encoding algorithm in deep learning. The aim of this work is to offer a method to identify a more profitable portfolio by clustering stock groups of collective investor attention in the financial market. The main analyzing steps are as follows: imaging search volume data for collective investor attention, extracting the imaged features of the collective investor attention trend, and clustering stocks based on the imaged feature.
2 Methodology
We propose a representation and classification method for collective investor attention in the financial market through empirical experiments in the Chinese stock market. This method comprises three key steps: 1) converting the hourly search volume of each stock to a candlestick chart per week for describing the changes in collective investor attention; 2) extracting features of each image by utilizing self-encoding algorithm in deep learning; and 3) clustering generated images by K-means to arrange stocks into different groups. Figure 1 gives the structure framework of this work.
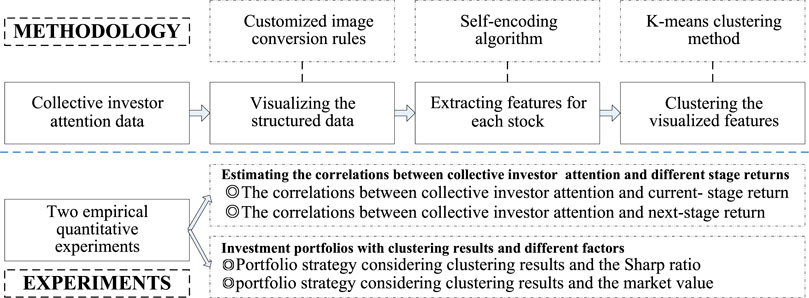
FIGURE 1. Structure framework of this work.
2.1 Visualizing the structured collective investor attention for each stock
A candlestick chart shows opening and closing values overlaid on the top of a total variance, which is often used to show stock value behavior. In this paper, we convert the hourly search volume of each stock per week to a candlestick chart inspired by the stock price candlestick chart based on three rules mentioned in the following paragraphs. Namely, we convert the raw data of collective investor attention into the image representation, and it would be formed as one chart for each stock based on its hourly search volume in each week. After following the steps, we have 139,298 charts for all the stocks in the Chinese A-share market.
1. Calculate four basic data: the highest collective investor attention per hour per day, the lowest collective investor attention per hour per day, the daily average collective investor attention, and the previous daily average collective investor attention for each stock.
2. Color the columns red in the candlestick chart if the daily average collective investor attention on that day is higher than that on the previous day; otherwise, color them green. Upper and lower hatchings represent the highest and lowest collective investor attention data of the day.
3. Chart the trend of each individual stock on a weekly basis.
Figure 2 shows an example of Vanke A (000002) where the structured data of an hourly search volume are visualized based on the aforementioned three rules. The candlestick chart demonstrates the collective investor attention which contains four numbers: the highest/lowest search volume of the day, the average search volume of the day, and the average search volume of the previous day. The candlestick chart based on collective investor attention for each stock could lead to a better understanding of the collective investor attention.
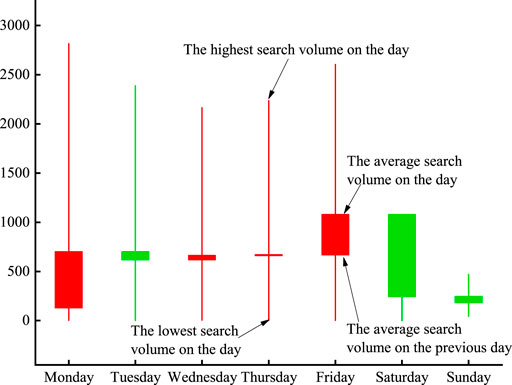
FIGURE 2. Illustration of Vanke A’s collective investor attention trend in one sample week. The horizontal axis is the date, and the vertical axis represents the search volume on the day.
2.2 Extracting visualized features of the collective investor attention for each stock
After visualizing the structured data of collective investor attention for each stock, we extract the features from each image in order to cluster groups by utilizing self-encoding algorithm in deep learning.
The self-encoding algorithm, as a self-supervised learning method, aims at reconstructing input information, constructing a neural network to learn the objective function, δW,b(x) ≈ x, and extracting features from unlabeled data (images) automatically. Construction of the self-encoder is mainly divided into three steps: constructing the coding layer f, establishing the decoding layer g, and setting the loss function. So the neural network includes the coding layer, the hidden layer, and the decoding layer.
Usually, f and g can be denoted as follows:
where x, x′, and h represent vectors of the input, decoding, and hidden layers, respectively. b and b′ represent the bias vectors of the input and output layers, respectively. W and W′ are weight matrices of the input and output layers, respectively. δ is a non-linear activation function.
Minimizing the loss function by optimizing {W, W′, b, b′}:
where n is the size of the input layer.
The core steps of imaged feature extraction in this paper are as follows:
1. Import the image processing module by Python to process the image data.
2. Create a four-dimensional array to store the color image data of each week; then, reduce the three-dimensional array data of each stock into one-dimensional arrays.
3. Build a coding layer model to compress data as three-dimensional features.
4. Construct a decoding layer model, and decompress the three-dimensional features into a one-dimensional array.
5. Train the dataset, and extract the three-dimensional data features from the middle layer.
2.3 Clustering the collective investor attention based on the visualized features
The visualized features extracted in the aforementioned steps are unlabeled, and the appropriate number of clusters is unknown as well, so it is reasonable to choose one clustering algorithm without specifying any cluster number. Taking into account the number of samples and the feasibility of portfolio construction, the K-means clustering method is employed finally in this work, and the initial cluster center number is set to 10.
Figure 3 shows the clustering results of the first week on collective investor attention by the K-means method. Three features are extracted by the self-encoding algorithm: X, Y, and Z axes. Ten various colors are the 10 labels which are set in the K-means clustering method initially.
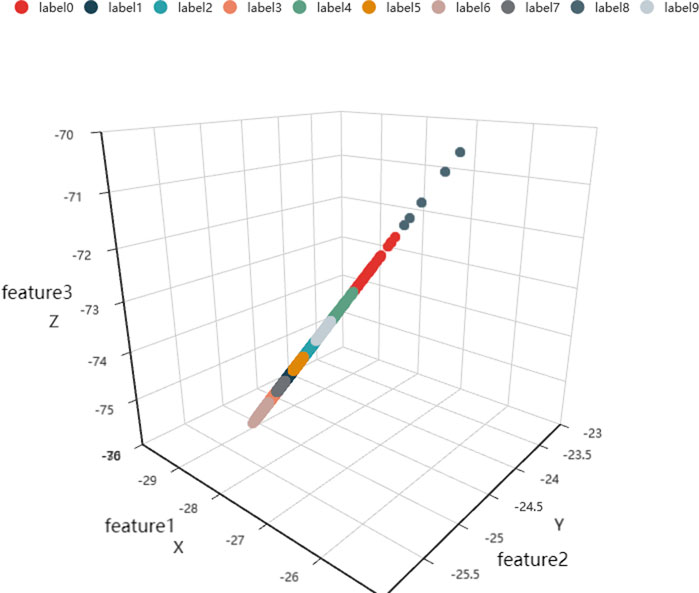
FIGURE 3. Clustering results of collective investor attention based on the visualized features of the sample week. X is feature 1, Y is feature 2, and Z is feature 3.
Figure 4 shows the partial results of image-based clustering results for the first week. For instance, 000761 (BENGANGBANCAI Stock), 000777 (ZHONGHEKEJI Stock), and 000785 (WUHANZHONGSHANG Stock) are in one cluster. The main feature of this cluster is that the average collective investor attention goes up in the week and a few changes happen in the search volume from the first working day to the last weekend day. Another cluster contains stocks 000782 (MEIDAGUFEN Stock), 000783 (CHANGJIANGZHENGQUAN Stock), 000789 (WANNIANQING Stock), and 000790 (HETAIJIANKANG Stock), and their common features are their first weekday search volume increasing significantly compared with the last weekend, and the average search volume is stable during the whole week.
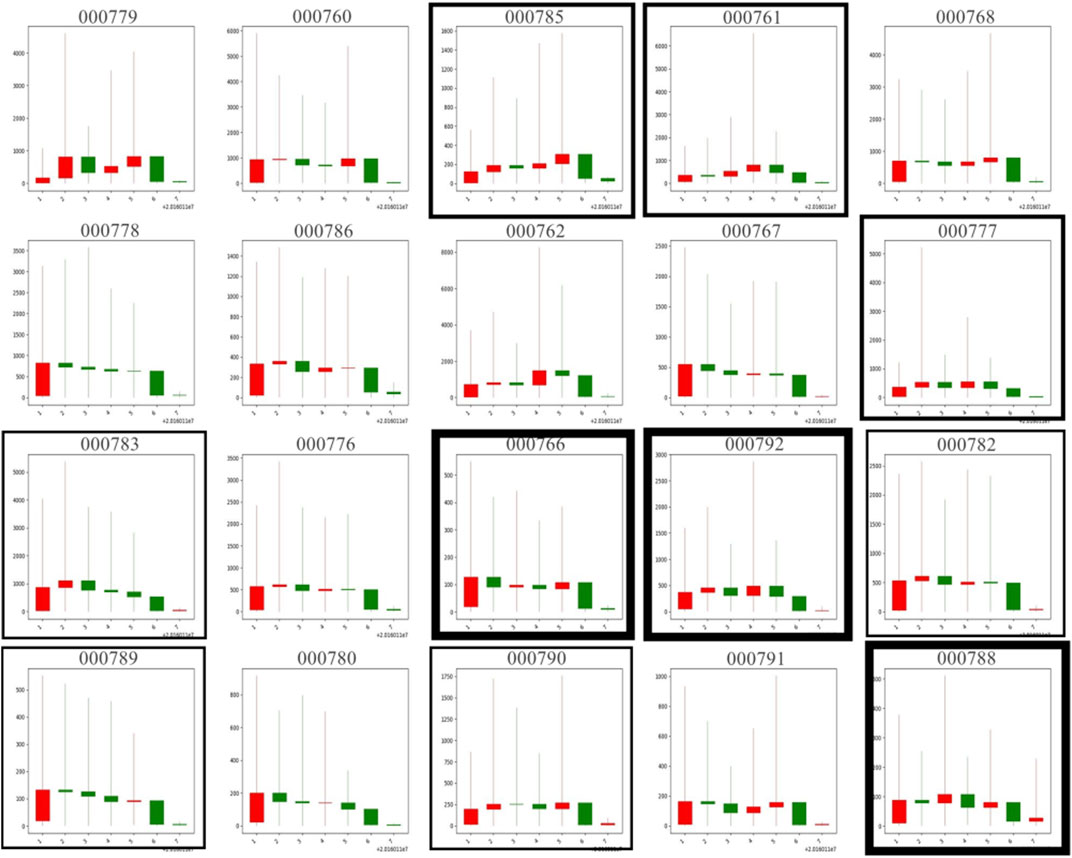
FIGURE 4. Partial clustering results of image-based clustering results on the sample week. Borders of the same thickness are grouped in the same cluster, in which 000761 (BENGANGBANCAI Stock), 000777 (ZHONGHEKEJI Stock), and 000785 (WUHANZHONGSHANG Stock) are in one cluster. The horizontal axis represents the date and the vertical axis represents the search volume on the day in each thumbnail.
3 Experiments
In this section, we introduce our dataset and experiment settings first. The experiments are divided into two parts, each of which includes two sections. The sections in the first part explain estimation of the correlations between collective investor attention and the current-stage returns and next-stage returns, respectively. The second part explains building portfolios based on collective investor attention and calculating the Sharpe ratio and market value factors to test the effectiveness of collective investor attention. Then, we discuss the experiment results of our portfolio strategy. It is verified that collective investor attention is positively related to the current-stage stock returns and negatively correlated with the next-stage stock returns. We also compare the investment strategy offered based on the method with other strategies.
3.1 Describing the dataset and settings
The data in this article are collected from the search records of all stocks in a specified web browser, whose names remain anonymous because of privacy. The search keywords include stock names or stock codes with time stamps, so the dataset contains the stock code, stock name, and hourly search volume. We use the hourly search volume of each stock as the collective investor attention in this research. For example, if one investor searches one stock code in the specified web browser, the search volume of this stock would be raised by one in this hour. It contains 23.4 million hourly records in the dataset for all stocks in the A-share market of China. The period of all records is from January 2016 to January 2017.
All back-testing experiments in this paper are quantified through the Uqer platform (https://uqer.io/), with Python scientific computing.
3.2 Estimating the correlations between collective investor attention and different stage returns
The current collective investor attention is positively correlated with the current-stage return but negatively correlated with the next-stage return, which is mentioned in previous research studies with a similar proxy of investor attention [21]. We use back-testing experiments to estimate correlations with the collected data in this paper. Two correlations of portfolios are as follows.
3.2.1 The correlation between collective investor attention and the current-stage return
To estimate the correlation between collective investor attention and the current return, we provide a portfolio strategy as follows:
1. Sort the daily collective investor attention for each stock.
2. Buy the top 20 stocks with the highest collective investor attention on the current day at the opening time of the stock market. It is equal to the rationality of the actual investment portfolio.
3. Hold the stocks in the new sorting list of updated top 20 stocks with the highest collective investor attention at the opening time on the next day of the stock market, and sell out the others. Meanwhile, buy new ones appearing in the next-day list.
4. Set the back-testing time of the strategy from January 2016 to January 2017. Other initial parameters are kept unchanged in the system, such as the initial capital which is 10 million yuan, and the benchmark is the HS300 index.
3.2.2 The correlation between collective investor attention and the next-stage return
The normal information coefficient (IC) refers to the cross-sectional correlation coefficient between forecasts of excess returns and actual returns, which can reflect the predictive ability on the factor to the return of the next rate [41,42]. First, calculate the normal IC values of the collective investor attention on the day and the next five-day returns:
where X represents the collective investor attention of individual stocks in t days. Y represents the returns of individual stocks in t + i days, and Y is calculated as follows:
where pt is the closing price of the target stock on the t day and pt+i is the closing price of the target stock on the t + i day.
To estimate the correlation between collective investor attention and the next-stage return, we provide a portfolio strategy as follows:
1. Sort the daily collective investor attention for each stock, and divide stocks into ten groups from low to high.
2. Conduct experiments in ten groups. In each experiment, buy the stocks in the same group but do not hold at the opening time of the stock market on the day. Sell out the stocks which had have been held but not in the same group after the updated grouping on the previous day. The aim of this step is to hold the stocks of the specified quantile array and then hold the equal positions.
3. The rest of the parameters are set as mentioned previously.
3.2.3 Experiment results of two different correlations
There is no doubt that the relationship between the collective investor attention and the stock return is in the same stage. Compared with the HS300 benchmark (black) in the same stage, the strategy of holding stocks with the high collective investor attention on the day (blue) showed super high excess returns, which illustrates that the current collective investor attention is positively related to the current stock return, as detailed in Figure 5. This strategy would be used as an experimental back-testing because of the use of future information. However, it offers the same conclusion as the current collective investor attention is positively correlated with the current-stage returns.
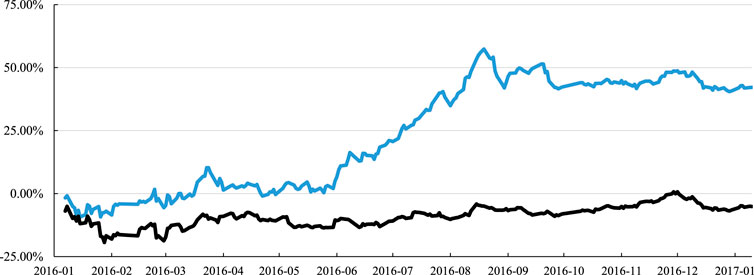
FIGURE 5. Back-testing of the strategy considering the current collective investor attention. The horizontal axis is the date, and the vertical axis represents the return of the strategy. The black line is the return of HS300 as a benchmark, and the blue line is the return of the strategy considering the current collective investor attention.
We divide all stocks into ten groups according to the collective investor attention from low to high and hold stocks corresponding to only one group in each experiment. The experiment results show that the Sharpe ratio, annual return, and alpha indicator are negatively correlated with the collective investor attention; return fluctuation and maximum retracement are positively correlated with the collective investor attention. It verifies that the current collective investor attention is negatively correlated with the next-period stock return, which is detailed in Figure 6. Specifically, the Sharpe ratio is calculated according to Eq. 6 in Section 3.3.1, the annual return refers to the annual return of each stock group, drawdown refers to the peak-to-valley loss as a percentage figure, the Alpha indicator refers to the excess return [43], and the return fluctuation refers to the standard deviation of all daily returns during the back-testing period. More detailed correlation results between the current collective investor attention and the future stock return can be seen in Table 1. Above all, we have verified the effect of collective investor attention, which shows that the collective investor attention is positively related to the current-stage stock return and is negatively correlated with the next-stage stock return and also occurs in the Chinese stock market.
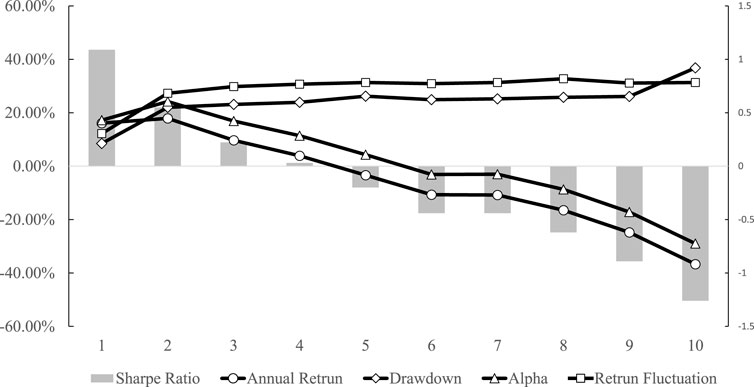
FIGURE 6. Performance of each indicator on back-testing. The horizontal axis represents the ten groups, the left vertical axis represents the percentage for annual return, drawdown, Alpha, and return fluctuation, and the right vertical axis represents the value of the Sharpe ratio. Five indicators are illustrated in Figure 6, including the Sharpe ratio as the histogram, annual return as a line with hollow circles, drawdown as a line with hollow diamonds, Alpha as a line with triangles, and return fluctuation as a line with squares. The return fluctuation and drawdown lines are positively correlated with the collective investor attention, while the other three lines are negatively correlated with the collective investor attention.
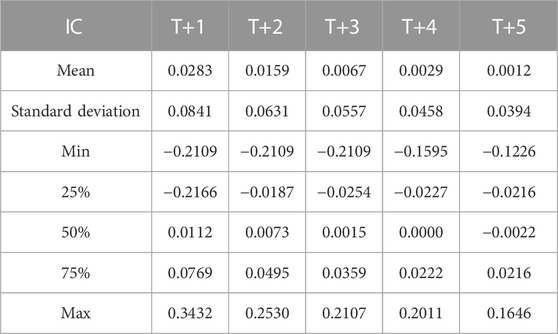
TABLE 1. Correlation results between the collective investor attention and the stock return. It shows the normal IC statistic distribution between the collective investor attention on day T and the return on days T+1, T+2, T+3, T+4, and T+5, including mean, standard deviation, minimum, 25% quantile, 50% quantile, 75% quantile, and maximum.
3.3 Building portfolio with clustering results and different factors
The clustering results are obtained according to the trend of collective investor attention images. Within Uqer, a professional platform for financial quantitative analysis, we claim two strategies taking into account two factors: one is the Sharpe ratio, and the other is the market value.
3.3.1 Investment portfolio strategy considering clustering results and the Sharpe ratio
The Sharpe ratio (SR) is a measure of a portfolio’s performance over an evaluation period. SR is expressed as the portfolio’s average excess return per unit of risk [43,44]. The Sharpe ratio is calculated by subtracting the risk-free rate from the return of the portfolio and dividing the results in the standard deviation of the portfolio’s excess return. It adjusts a portfolio’s past performance, or the expected future performance, for the excess risk that is taken by the investor. Compared to similar portfolios or funds with lower returns, the higher the Sharpe ratio is, the better the performance is [45]. We calculate the weekly Sharpe ratio based on the clustering results for each stock as follows:
where Rp is the weekly return of the portfolio, Rf is the weekly risk-free rate, and σp is the standard deviation of the portfolio which exceeds the return during the week.
The investment portfolio strategy considering clustering results and the Sharpe ratio is selected by three steps as follows:
1. Calculate the weekly Sharpe ratio for individual stocks in the A-share market of China.
2. Select the stock with the highest Sharpe ratio value from each clustering group in Section 2.3.
3. Form a portfolio with ten stocks selected from each clustering group in each week, and adjust the positions every week to test the return.
In order to verify the effectiveness of the collective investor attention factor, it is necessary to compare the aforementioned strategy with one simple strategy, as a baseline, which contains 10 stocks carrying the highest Sharpe ratios.
3.3.2 Investment portfolio strategy considering clustering results and the market value
The market value represents the economic size of an enterprise. Plenty of popular stock classification rules are based on the market values, such as the S&P Small 400 Index and the S&P Medium 600 Index in the American stock market and the SSE 50 and SSE 180 in the Chinese stock market. Therefore, we also establish a portfolio based on the market value and clustering results in this paper.
The investment portfolio strategy considering clustering results and the market value is selected by two steps as follows:
1. Calculate the total market value of stocks in the whole market.
2. Sort each clustering group according to the market value and select one stock with the smallest market value in each clustering group as described in Section 2.3. The portfolio is made up of ten stocks with the smallest market value in each group. The position is adjusted weekly, and the returns are tested.
The final strategy that we constructed is made up of a total of 30 stocks from 10 groups, with three stocks having the lowest market value in each group, and other conditions are kept the same to avoid the individual error of the strategy. Similarly, we also compare these strategies with baselines that contain 10 stocks (30 stocks) with the lowest market values selected from the whole A-share market of China. This is to verify the factor contributions in the strategy we offered in this work.
3.3.3 Portfolio performances
The performances of different portfolio strategies are illustrated in Figure 7, which contains six subfigures. The black line is the annual return of HS300 as a benchmark in each subfigure. The results show the following: first, the return of the portfolio strategy, considering that both clustering results and the Sharpe ratio are lower than the benchmark during the observation timespan, which is detailed in Figure 7A. Second, the return of the portfolio strategy, which is constructed only by the Sharpe ratio, is also lower than the benchmark, which is detailed in Figure 7B. The Sharpe ratio is applicable to active funds, including bond funds and stock funds, to measure the risk control ability of fund managers, which maybe the main reason for these results. Third, the portfolio strategies selected by considering both the clustering results and the small market value perform better than the benchmark. In Figure 7C, the strategy’s annual return is 52.6%, and its maximum drawdown is 9.8%, which has improved significantly in the income and risk. The strategy in Figure 7D is the return of the portfolio constructed by the small market value, whose annual return is 20.0% and the maximum drawdown is 9.8%. Comparing Figure 7C with Figure 7D, it is found that there are few changes in the maximum drawdown, but the annual return of the portfolio with clustering results performs better. Figure 7E shows that 30 stocks are chosen as a portfolio of clustering results with a small market value, and it shows the return of the portfolio. The portfolio’s annual return is 59.7%, and the maximum drawdown is 12.5%. Meanwhile, in Figure 7F, it is noticed that the return of the portfolio with 30 chosen stocks constructed only by the small market value is lower than the return shown in Figure 7E. Its annual return is 18.7%, and its maximum drawdown is 9.2%. From the results of the comparison of Figure 7E and Figure 7F, the return of the portfolio is selected by considering that the clustering is higher, which is just as same as the results from Figure 7C and Figure 7D. The stability of our method is considerable.
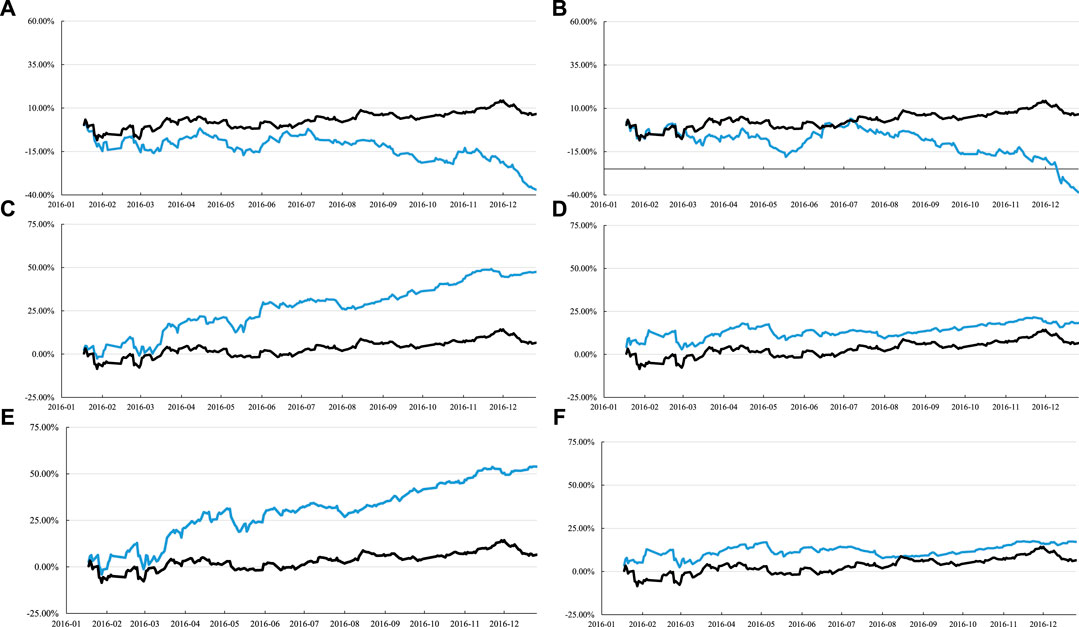
FIGURE 7. Six subfigures are shown. In each subfigure, the horizontal axis represents the data time from January 2016 to January, 2017, and the vertical axis represents the return of the portfolio. The black line represents the performance of HS300 as a benchmark in each subfigure. The blue lines show the performance of different portfolio strategies. (A) Constructing the return of the portfolio strategy by clustering results combined with the Sharpe ratio, −41%, which is extremely lower than the benchmark. (B) Portfolio strategy only constructed by the Sharpe ratio and the return is 39.4%, which is also lower than the benchmark. Other four portfolios perform better than the benchmark, clearly. It is noticed that the annual return percentages of the portfolio are 52.6%, 20%, 59.7%, and 18.7%. The strategy in (C) is the return of the portfolio with clustering results combined with the small market value. The strategy in (D) is the return of the portfolio constructed by the small market value. In (E), it takes an assumption that 30 chosen stocks as a portfolio of clustering results combine with a small market value and show the return of the portfolio. In (F), the return of the portfolio is constructed only by the small market value.
4 Conclusion and discussion
This paper introduces an image representation and classification method for collective investor attention in the financial market. First, we convert the hourly search volume of each stock per week to an image representation for describing the changes in collective investor attention. Second, we extract features of each image by utilizing a self-encoding algorithm in deep learning. Third, we cluster the generated images by the K-means method to divide all stocks into different groups. In addition, we construct portfolios to test the representation and classification method proposed in this work. From the portfolio experiments, two investment portfolio strategies, considering clustering results on the Sharpe ratio and the market value, outperform the annual return of HS300 as the baseline. Typically, small-size stocks are more affected by collective investor attention than large-size and medium-size stocks.
The representation and classification method for collective investor attention in this work is a novel application of candlestick in the financial market. It would not only mine the potential information of the collective investor attention using deep learning but also form a specific group for stock similarity measurement. In this work, we put forward a new path to effectively analyze the vast quantities of user-generated data to deeply understand the collected information’s mechanism. As it is only a preliminary exploration in this work, it could be used in other stock markets or 272 different periods in the financial field to testify its validity in the future works. The method is expected to be extended to other areas in the next step.
Data availability statement
The original contributions presented in the study are included in the article/Supplementary Material; further inquiries can be directed to the corresponding authors.
Author contributions
Z-HY and BS contributed equally to this work, provided this topic, finished the experiment, and wrote the manuscript. Z-YW, J-GL, and X-HZ guided, discussed, and modified the manuscript. All authors contributed to the manuscript and approved the submitted version.
Funding
This research was funded by the National Social Science Fund of China (Grant No. 20BJY180).
Conflict of interest
Author BS was employed by the company China Unionpay Data Services Co., Ltd.
The remaining authors declare that the research was conducted in the absence of any commercial or financial relationships that could be construed as a potential conflict of interest.
Publisher’s note
All claims expressed in this article are solely those of the authors and do not necessarily represent those of their affiliated organizations, or those of the publisher, the editors, and the reviewers. Any product that may be evaluated in this article, or claim that may be made by its manufacturer, is not guaranteed or endorsed by the publisher.
References
1. Peron TKD, Rodrigues FA. Collective behavior in financial markets. Europhysics Lett (2011) 96:48004. doi:10.1209/0295-5075/96/48004
2. Fernandes LH, Silva JW, de Araujo FH. Multifractal risk measures by macroeconophysics perspective: The case of brazilian inflation dynamics. Chaos, Solitons & Fractals (2022) 158:112052. doi:10.1016/j.chaos.2022.112052
4. Asim KD, Toufiqul G, Kumer P, Irina P. Impacts of Covid-19 local spread and Google search trend on the US stock market. Physica A: Stat Mech its Appl (2022) 589:126423. doi:10.1016/j.physa.2021.126423
5. Liu J, Liu L, Min M, Tan S, Zhao F. Can central bank communication effectively guide the monetary policy expectation of the public? China Econ Rev (2022) 75:101833. doi:10.1016/j.chieco.2022.101833
6. Dong G, Wang F, Shekhtman LM, Danziger MM, Havlin S, Du R, et al. Optimal resilience of modular interacting networks. Proc Natl Acad Sci U S A (2021) 118:e1922831118. doi:10.1073/pnas.1922831118
7. Hirshleifer D, Teoh SH. Limited attention, information disclosure, and financial reporting. J Account Econ (2003) 36:337–86. doi:10.1016/j.jacceco.2003.10.002
8. Peng L, Xiong W. Investor attention, overconfidence and category learning. J Financial Econ (2006) 80:563–602. doi:10.1016/j.jfineco.2005.05.003
9. Li NZ, Zeng L, Qin HH. Investor attention and stock markets during the Covid-19 crisis. In: Proceeding of the ICIBE 2021: The 2021 7th International Conference on Industrial and Business Engineering, China, September 27–29, 2021. ICM (2021). p. 193–7.
10. Barber BM, Odean T. All that glitters: The effect of attention and news on the buying behavior of individual and institutional investors. Rev Financ Stud (2007) 21:785–818. doi:10.1093/rfs/hhm079
11. Gervais S, Kaniel R, Mingelgrin DH. The high-volume return premium. J Finance (2001) 56:877–919. doi:10.1111/0022-1082.00349
12. Statman M, Thorley S, Vorkink K. Investor overconfidence and trading volume. Rev Financ Stud (2006) 19:1531–65. doi:10.1093/rfs/hhj032
13. Huang Z, Heian JB, Zhang T. Differences of opinion, overconfidence, and the high-volume premium. J Financial Res (2011) 34:1–25. doi:10.1111/j.1475-6803.2010.01283.x
14. Avramov D, Chordia T, Goyal A. Liquidity and autocorrelations in individual stock returns. J Finance (2006) 61:2365–94. doi:10.1111/j.1540-6261.2006.01060.x
15. Loh RK. Investor inattention and the underreaction to stock recommendations. Financial Manag (2010) 39:1223–52. doi:10.1111/j.1755-053x.2010.01110.x
16. Li Q, Wang T, Li P, Liu L, Gong Q, Chen Y. The effect of news and public mood on stock movements. Inf Sci (2014) 278:826–40. doi:10.1016/j.ins.2014.03.096
17. Azuma T, Okada K, Hamuro Y. Is no news good news? The streaming news effect on investor behavior surrounding analyst stock revision announcement. In: Behavioral interactions, markets, and economic dynamics. Springer (2016). p. 567–93.
18. Zhang JL, Härdle WK, Chen CY, Bommes E. Distillation of news flow into analysis of stock reactions. J Business Econ Stat (2016) 34:547–63. doi:10.1080/07350015.2015.1110525
19. Lou D. Attracting investor attention through advertising. Rev Financ Stud (2014) 27:1797–829. doi:10.1093/rfs/hhu019
20. Grullon G, Kanatas G, Weston JP. Advertising, breadth of ownership, and liquidity. Rev Financ Stud (2004) 17:439–61. doi:10.1093/rfs/hhg039
21. Da Z, Engelberg J, Gao P. In search of attention. J Finance (2011) 66:1461–99. doi:10.1111/j.1540-6261.2011.01679.x
22. Yu Q, Zhang B. Limited attention and stock performance: An empirical study using Baidu index as the proxy for investor attention. J Financial Res (2012) 8:152–65.
23. Aouadi A, Arouri M, Teulon F. Investor attention and stock market activity: Evidence from France. Econ Model (2013) 35:674–81. doi:10.1016/j.econmod.2013.08.034
24. Dimpfl T, Jank S. Can Internet search queries help to predict stock market volatility? Eur Financial Manag (2016) 22:171–92. doi:10.1111/eufm.12058
25. Urquhart A. What causes the attention of Bitcoin? Econ Lett (2018) 166:40–4. doi:10.1016/j.econlet.2018.02.017
26. Bollen J, Mao H, Zeng X. Twitter mood predicts the stock market. J Comput Sci (2011) 2:1–8. doi:10.1016/j.jocs.2010.12.007
27. Ackert LF, Jiang L, Lee HS, Liu J. Influential investors in online stock forums. Int Rev Financial Anal (2016) 45:39–46. doi:10.1016/j.irfa.2016.02.001
28. Daniel M, Neves RF, Horta N. Company event popularity for financial markets using Twitter and sentiment analysis. Expert Syst Appl (2017) 71:111–24. doi:10.1016/j.eswa.2016.11.022
29. Jiang L, Liu J, Yang B. Communication and comovement: Evidence from online stock forums. Financial Manag (2019) 48:805–47. doi:10.1111/fima.12245
30. Zhang H, Chen Y, Rong W, Wang J, Tan J. Effect of social media rumors on stock market volatility: A case of data mining in China. Front Phys (2022) 10:987799. doi:10.3389/fphy.2022.987799
31. Preis T, Moat HS, Stanley HE. Quantifying trading behavior in financial markets using Google Trends. Sci Rep (2013) 3:1684–6. doi:10.1038/srep01684
32. Chen H, Lo T. Online search activities and investor attention on financial markets. Asia Pac Manag Rev (2019) 24:21–6. doi:10.1016/j.apmrv.2018.11.001
33. Kim N, Lučivjanská K, Molnár P, Villa R. Google searches and stock market activity: Evidence from Norway. Finance Res Lett (2019) 28:208–20. doi:10.1016/j.frl.2018.05.003
34. Masci J, Meier U, Cireşan D, Schmidhuber J. Stacked convolutional auto-encoders for hierarchical feature extraction. In: Proceeding of the Artificial Neural Networks and Machine Learning – ICANN 2011, Espoo, Finland, June 14–17, 2011. (2011). p. 52–9.
35. Lecun Y, Bottou L, Bengio Y, Haffner P. Gradient-based learning applied to document recognition. Proc IEEE (1998) 86:2278–324. doi:10.1109/5.726791
36. Qiu L, Su R, Wang Z. Financial crisis prediction based on multilayer supervised network analysis. Front Phys (2022) 10:1048934. doi:10.3389/fphy.2022.1048934
37. Yang O, Qiang G, Jianguo L. Identifying spreading influence nodes for social networks. Front Eng Manag (2022) 8:1–8.
38. Silver D, Huang A, Maddison CJ, Guez A, Sifre L, Van Den Driessche G, et al. Mastering the game of Go with deep neural networks and tree search. Nature (2016) 529:484–9. doi:10.1038/nature16961
39. Srikanth M, Subhadeep D, Petr M, Marc F (2016). Implementation of the standard I-vector system for the Kaldi speech recognition toolkit, Martigny, Switzerland: Idiap, 1–7
40. Hu G, Yang K, Yu Z, Sung F, Zhang Z, Xie F, et al. Deep stock representation learning: From candlestick charts to investment decisions. In: Proceeding of the IEEE International Conference on Acoustics, Speech and Signal Processing (ICASSP), Calgary, AB, April 15–20, 2018. IEEE (2018). p. 2706–10.
42. Richard C. G. The fundamental law of active management. J Portfolio Manag (1989) 15:30–7. doi:10.3905/jpm.1989.409211
Keywords: collective investor attention, representation, classification, financial market, deep learning
Citation: Yang Z-H, Su B, Wang Z-Y, Zhu X-H and Liu J-G (2023) A representation and classification method for collective investor attention in the financial market. Front. Phys. 10:1076878. doi: 10.3389/fphy.2022.1076878
Received: 22 October 2022; Accepted: 29 November 2022;
Published: 04 January 2023.
Edited by:
Xiaoke Xu, Dalian Nationalities University, ChinaReviewed by:
Sergio Da Silva, Federal University of Santa Catarina, BrazilLeonardo H. S. Fernandes, Federal Rural University of Pernambuco, Brazil
Chuan Qin, Shanghai University of Finance and Economics, China
Yu Xiao, Shanghai University of International Business and Economics, China
Copyright © 2023 Yang, Su, Wang, Zhu and Liu. This is an open-access article distributed under the terms of the Creative Commons Attribution License (CC BY). The use, distribution or reproduction in other forums is permitted, provided the original author(s) and the copyright owner(s) are credited and that the original publication in this journal is cited, in accordance with accepted academic practice. No use, distribution or reproduction is permitted which does not comply with these terms.
*Correspondence: Zi-Yi Wang, wangzy@163.sufe.edu.cn; Jian-Guo Liu, liujg004@ustc.edu.cn; Xi-Hua Zhu, simexihuazhu@163.com
†These authors have contributed equally to this work and share first authorship