Rarefied Flow Simulation of Conical Intake and Plasma Thruster for Very Low Earth Orbit Spaceflight
 Eugenio Ferrato1,2*
  Vittorio Giannetti1,3
  Mansur Tisaev4
  Andrea Lucca Fabris4
  Francesco Califano2
  Tommaso Andreussi1,3
- 1SITAEL—Propulsion Division, Pisa, Italy
- 2Department of Physics, University of Pisa, Pisa, Italy
- 3Department of Civil and Industrial Engineering, University of Pisa, Pisa, Italy
- 4Surrey Space Centre, University of Surrey, Guildford, United Kingdom
Air-breathing electric propulsion has the potential to enable space missions at very low altitudes. This study introduces to a 0D hybrid formulation for describing the coupled intake and thruster physics of an air-breathing electric propulsion prototype. Model derivation is then used to formally derive main system’s key performance indicators and estimate the figure of merit for the design of rarefied flow air intakes. Achievable performance by conical intake shapes are defined and evaluated by Monte Carlo simulations. Influence of inlet flow variation is assessed by dedicated sensitivity analyses. The set of requirements and optimality conditions derived for the downstream plasma thruster suggest concept feasibility within an achievable performance range.
1 Introduction
In recent years, spaceflight at altitudes below 250 km is becoming an attractive option [1]. Even if several technical difficulties make it challenging to orbit at such low altitudes, making use of very low Earth orbits (VLEO) would reshape near-Earth space utilization by expanding the operational range and mission capabilities of satellite platforms [1, 2]. As VLEO is closer to the Earth’s surface, science and Earth observation missions would greatly benefit from improved reconnaissance conditions. It is well understood how Earth observation has fundamental applications and prospects in, for example, monitoring and assessing the status of, and changes in, the natural and man-made environment, agriculture, and food security, together with several applications in maritime and ground surveillance, crisis management, and many others [3]. Operating at lower altitudes also has the potential to reduce launching costs while offering a more effective space utilization as LEOs may become overcrowded, and mitigation measures to cope with increasing debris population may become necessary [4]. For small and medium class satellites, VLEO offers the advantage of an automatic re-entry and disposal as the orbit of an unpropelled spacecraft would decay within a few weeks due to atmospheric drag. However, as atmospheric drag also translates into more severe requirement of propellant mass needed to fulfill the targeted mission profile, satellites do not usually operate in VLEO. A few notable exceptions exist though, such as the GOCE [5] and SLATS [6] spacecrafts. During its 1 year and 9 months mission lifetime, SLATS used a combination of chemical propulsion and aerobraking maneuvers to lower its altitude from 630 km to VLEO, where a 10 mN ion engine was operated at several altitudes in the 270–170 km range. SLATS ran out of its 10 kg of onboard xenon propellant after 90 days and, to date, holds the record for the lowest operating altitude of 167 km. GOCE was instead released at an altitude of 283 km and operated for 2 years and 10 months at 260 km. It was then operated at lower altitudes until propellant depletion at 229 km [7]. The total mission duration was 4 years. GOCE stored 41 kg of xenon propellant and was equipped with two ion engines capable of providing thrust and specific impulse levels in the 1 ∼ 20 mN and 500 ∼ 3,500 s ranges. Below 250 km of altitude, both GOCE and SLATS experienced drag levels in the order of tens of milliNewtons and ran out of propellant after a few months, as opposed to typical lifetimes of LEO satellites in the 7–10 -year range. A comparable lifetime in VLEO would be prohibitive, as a propellant mass of at least
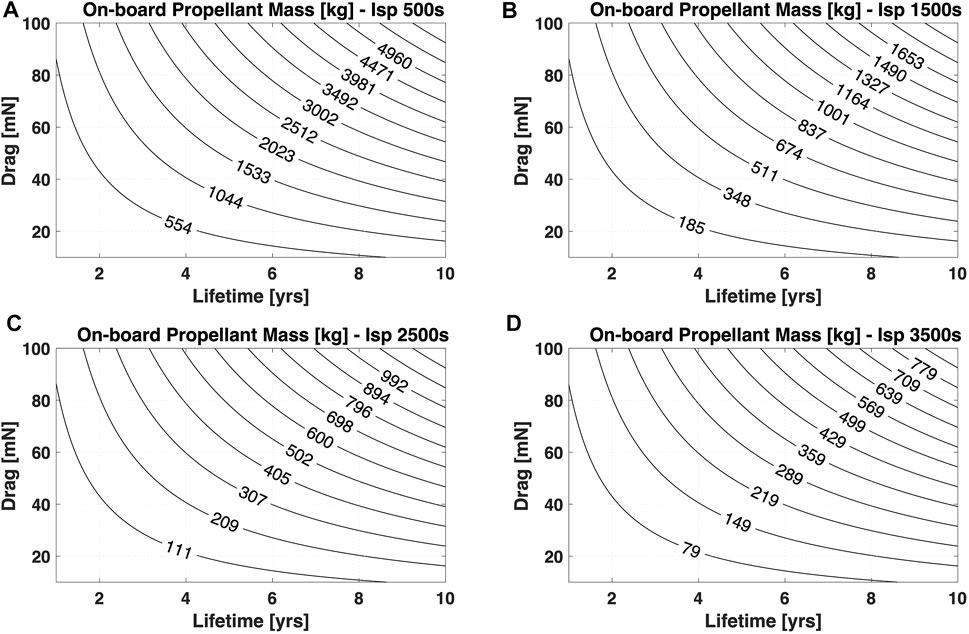
FIGURE 1. Onboard propellant mass required to compensate drag levels in the 10–100 mN range for 500 s (A), 1500 s (B), 2500 s (C), and 3500 s (D) specific impulse thruster. Mission duration is in the 1–10 -year range.
Considering a reference 40 mN drag for a 7 -year mission, about 1800 kg, 600 kg, 350 kg, and 250 kg of propellant mass would be required for specific impulses of 500 s, 1,500 s, 2,500 s, and 3,500 s, respectively. For electric engines, a higher specific impulse implies a demand of more power to produce the same thrust level, which in turn can increase the drag due to a larger solar array area requirement. More propellant also implies larger tanks, which may lead to a larger spacecraft frontal area, and thus more drag and even more propellant mass to compensate for a larger total impulse. In order to overcome such a challenging requirement on propellant mass, air-breathing electric propulsion is emerging as a viable concept. Air-breathing electric propulsion systems, often referred to as ABEP or Ram-EP, offer the potential to extend satellite lifetime in VLEO by providing effective drag compensation while reducing or eliminating the need to store propellant onboard [8]. As illustrated in Figure 2, the idea is to connect an air intake to an electric thruster operating with air-propellant in air-breathing mode.
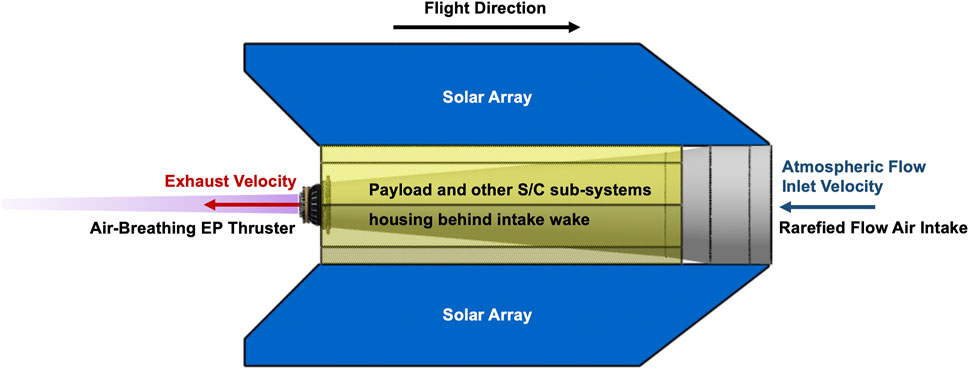
FIGURE 2. Air-breathing electric propulsion concept.
To completely compensate the drag experienced by the satellite, the choice of electric propulsion is forced by the need of producing exhaust velocities comparable to orbital velocity u∞, in the order of 8 km/s for circular orbits. In principle, an air-breathing system can be used both as primary or secondary propulsion, allowing to extend the mission at low altitudes prior to disposal. Recent air-breathing concept proposals include air-breathing ion engines [9], double stage Hall thrusters [10], and inductive plasma thrusters [11]. A recent review of all proposed technology concepts is provided in the study mentioned in reference [12]. Among them, the double stage Hall thruster concept was tested in conditions representative of VLEO air-breathing operation, but for a short time and with a Xe-fed hollow cathode. The thrust produced accounted for almost 25% of the drag experienced by the system [10]. The air-breathing EP technology comes with several criticalities mainly associated with system performance, lifetime, and integration into the satellite platform. First, the VLEO atmosphere is characterized by a highly variable composition depending on solar activity and orbital parameters, N2 and O being the major constituents (
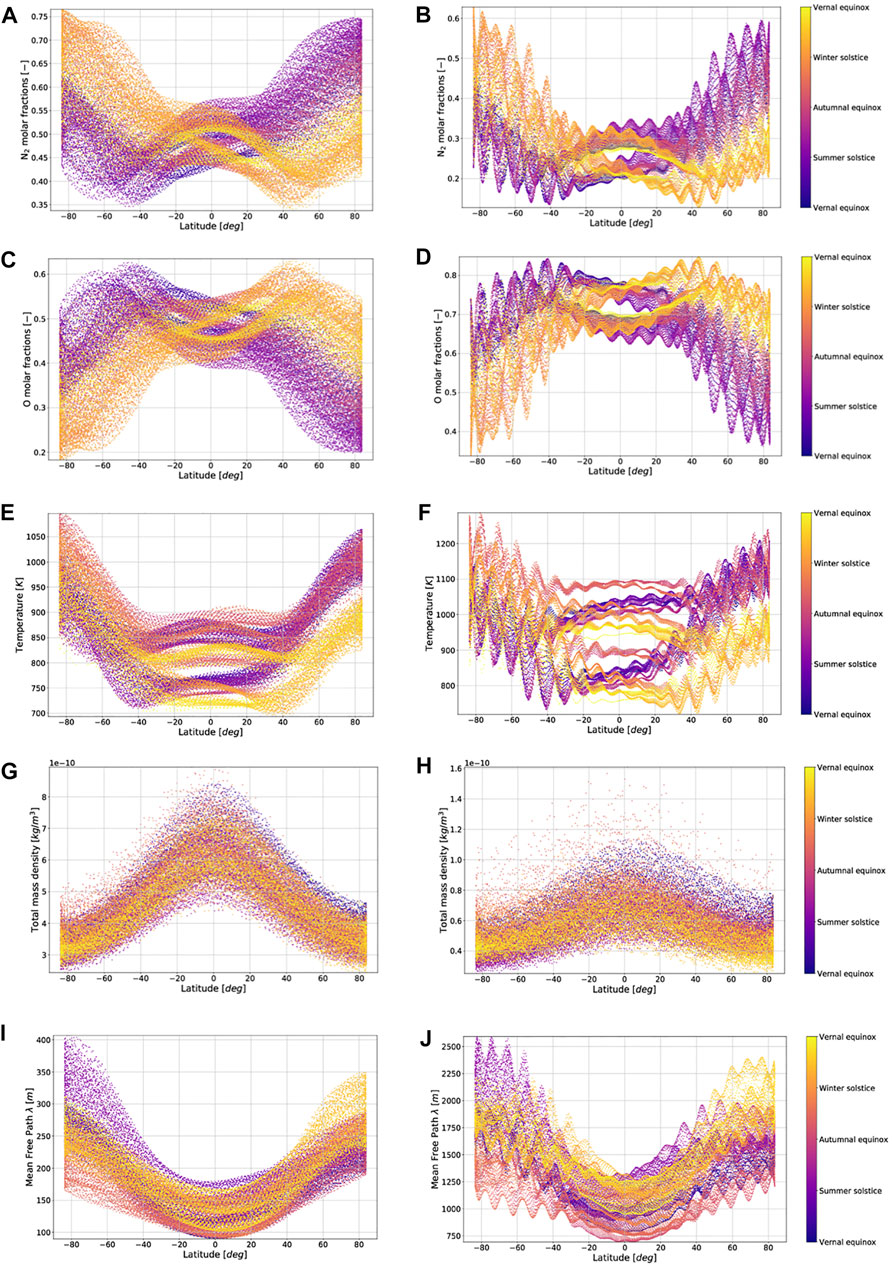
FIGURE 3. Yearly N2 molar fraction variation for a 180 km (A) and 250 km (B) SSO dawn-dusk orbit; yearly O molar fraction variation for a 180 km (C) and 250 km (D) SSO dawn-dusk orbit; yearly atmospheric temperature variation for a 180 km (E) and 250 km (F) SSO dawn–dusk orbit; yearly atmospheric mass density variation for a 180 km (G) and 250 km (H) SSO dawn-dusk orbit; yearly collision mean free path variation for a 180 km (I) and 250 km (J) SSO dawn-dusk orbit. Period: March 2003 to March 2004.
Due to chemical aggressiveness of ATOX, material degradation is a major concern. Electrodes directly exposed to the atmospheric plasma discharge may be quickly oxidized and become electrically insulating, leading to a premature thruster failure. This is particularly true for hollow cathodes and neutralizers, which are commonly used in both conventional ion and Hall thrusters. Therefore, the main technological risk is a non-competitive system lifetime for the foreseen practical applications. A further complexity, intrinsic to the operation of air-breathing EP systems, arises from the variables on which the thrust and power may depend. For traditional electrostatic EP technologies, thrust T and power P are a function of thruster geometry gthr, magnetic field B intensity, topology, operating mass flow rate, and applied electrode voltages Φ. Air-breathing EP performance could also be expressed as a function of several environmental variables, such as the following:
where β and γ are the pitch and yaw angles between the intake axis and the flow velocity direction; Tw is the intake/thruster temperature map; gitk is the intake design geometry; and n∞, u∞, and T∞ are the atmosphere number density of the composing species, velocity, and temperature, respectively. As illustrated in Figure 3, high variability characterizes the VLEO atmosphere. This poses a challenge on platform power and thrust management. Since variations of the inlet flow density of ±50% are present over a single orbit (Figures 3G,H), significant variations of the power consumption of the system (for a fixed operating voltage) are to be expected. The development of any air-breathing EP technology should thus cope with the need of devising specific power management and thrust strategies to safely operate all the platform subsystems and maintain the targeted mission profile. As a starting point, a review of GOCE’s drag and attitude control strategy is provided in the study mentioned in reference [19].
In this study, we present a 0D-hybrid model for describing the coupled air-breathing EP intake and thruster physics, deriving an approach to investigate the dependence represented by Eq. (1). In Section 2, we define the main Ram-EP performance indicators and derive a set of requirements for the thruster operation. By means of the neutral Monte Carlo algorithm defined in Section 3, we performed rarefied flow simulations of conical intake geometries coupled with representative thruster geometry. Our reference device is a novel double-staged electrostatic thruster, under development in the framework of the AETHER Horizon 2020 program, designed to be connected to an air intake and to operate in the air-breathing mode in the VLEO environment. For the specific thruster geometry, we evaluated the achievable performance by conical intakes, investigating a broad design space and selecting a reference design test case. All simulations are performed on a thruster in OFF condition and are limited to intake performance and flow properties available to thruster for discharge initialization. Nonetheless, they allow to quantify the requirement on thruster operation for providing full drag compensation, suggesting technological feasibility within a reasonable performance range. Sensitivity of the selected intake geometry on flow properties, wall temperature, and spacecraft attitude are investigated in Section 4, where we quantified the impact of variation in each parameter on intake and system performance.
2 Electrostatic Air-Breathing Propulsion Performance
2.1 Hybrid Zero-Dimensional Formulation
Modeling air-breathing electric propulsion is complex since it involves a vast amount of physical processes, mainly relevant to the fields of rarefied gas dynamics, chemistry, and plasma physics. The modeling approach and results in terms of requirement on thruster performance and intake sensitivity we presented hereafter are applicable to air-breathing, double-staged electrostatic devices. In this propulsion concept, some of the atmospheric particles impinging on the spacecraft at orbital velocity are collected by the intake and thermalized at wall temperature. By colliding with the intake and thruster walls, the particle kinetic energy is passively converted into internal energy. The thruster’s first stage is an ionization stage offering a relatively large open inlet area and volume to collect and ionize the incoming flow. It uses electrical power available from solar arrays to ionize the compressed flow by impact with electrons emitted from a pipe-fed cathode mounted internally in the thruster assembly. Inside the ionization stage, a set of electromagnets generate a magnetic field able to significantly reduce electron mobility. A proper magnetic field topology and intensity enhance ionization and confine the ions from the chamber walls. By the combined effect of the magnetic field and voltage applied to the electrodes, the ionization stage increases flow compression by pumping and channeling the ionized particles into the second stage (the acceleration stage), providing atmospheric propellant conditions suitable for the specific accelerator technology. The proposed physical description consists of a system of 0D ODE equations. Each equation represents particle continuity of the s neutral species or s + singly ionized species in the ionization stage or acceleration stage control volumes, which are, respectively, labeled with the subscript i and a. Each equation solves for the s or s + species number density n in the ionization or acceleration stages. In the two thruster control volumes, particle continuity is coupled with electron energy conservation to compute the time-dependent electron temperatures Te,i and Te,a.
We make use of 3D Monte Carlo methods to describe neutral and ion dynamics and compute the set of parameters defined in Table 1, including particle transmission (also known as Clausing factors) and mean residence time in the two thruster control volumes together with mean axial velocity of the particles leaving the propulsion system domain. The neutral Monte Carlo, discussed in Section 3, is based on the Cercignani–Lord–Lampis wall collision model. The ion Monte Carlo, not relevant to the results provided in this study, consists of a 3D Boris pusher in static 2D EM fields computed by solving ampere and electron drift-diffusion PDEs in a FreeFemm++ [13] environment. More details are given as follows:
• for a given axisymmetric thruster design, we at first computed the applied magnetic field B = ∇ × A from the magnetic vector potential A = Aθ (r, z):
where we neglected the plasma current density jp, that it is up to two orders of magnitude less than the coil current density jc. In Eq. (2), μr and μ0 are the relative and vacuum magnetic permeability, respectively, and A = 0 is set as BC in the far field boundaries.
• The plasma electric potential ϕ is then computed from the applied magnetic field solution by combining electron momentum conservation and charge continuity, resulting into the 2D elliptical PDE
where ∇ ⋅Γi is the ion flux divergence, and the electron mobility r-z tensor
where me is the electron mass and νc is the electron collision frequency. We assumed anomalous diffusion to be the dominant electron transport mechanism, where αB is the Bohm’s anomalous diffusion coefficient. We neglected the effect of electron pressure gradients and solved the following weak form:
with Dirichlet BCs on the thruster electrodes δΣ and Neumann BC on the insulating wall surfaces δΩ given as follows:
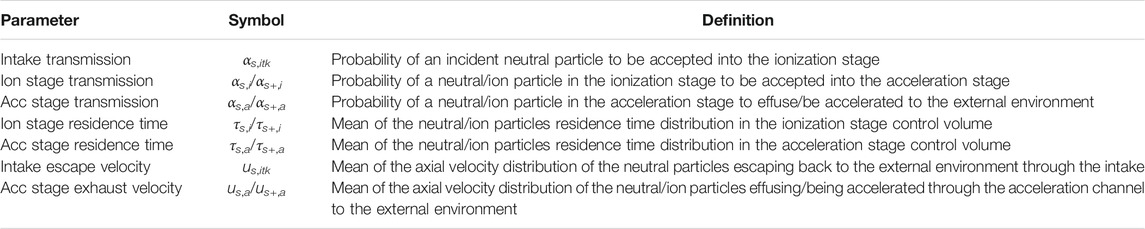
TABLE 1. Neutral and ion flow parameters computed by Monte Carlo methods.
In line with the 0D approach, we approximated ∇ ⋅Γi/n ∼ κ, where κ = κ (t), a time-varying function to be matched consistently with the 0D ODE system solution in each thruster control volume. The 2D potential solution seems unimpacted by the value of κ, and a single iteration is usually sufficient to ensure consistency.
• As thruster’s magnetic and electric fields are computed, we proceeded to extract all the parameters listed in Table 1 by running the 3D Monte Carlo algorithm for each neutral and ion species. Both ion and neutral motion is approximated as collisionless, which limits the applicability of the model to an altitude range in which the flow regime is highly rarefied. As opposed to the neutral Monte Carlo discussed in Section 3, the initial ion position is sampled from a uniform distribution in the ionization stage control volume, and its initial velocity is sampled from a Maxwellian distribution set at thruster wall temperature. Each ion particle trajectory is followed by using a 3D Boris pusher in the computed 2D EM fields until it crosses a domain boundary, may it be an insulating wall, an electrode, or the far plume region. All the parameters defined in Table 1 are then computed for all species and inserted into the 0D neutral and ion particles continuity equations discussed below.
Now, consider the case in which the thruster is in the OFF state. In the ionization and acceleration stage control volumes, we express neutral s-particle continuity as follows:
where Γs,∞ = ns,∞us,∞Aitk is the particle flux incident to the intake inlet area Aitk, and Vi/Va is the ionization to acceleration stage volume ratio. The steady state particle fluxes through the propulsion system control volumes are visualized in Figure 4A. For a propulsion system in the OFF condition, thruster transmission αs,thr is equal to the product of the ionization stage and acceleration stage transmissions, αs,i and αs,a, respectively.
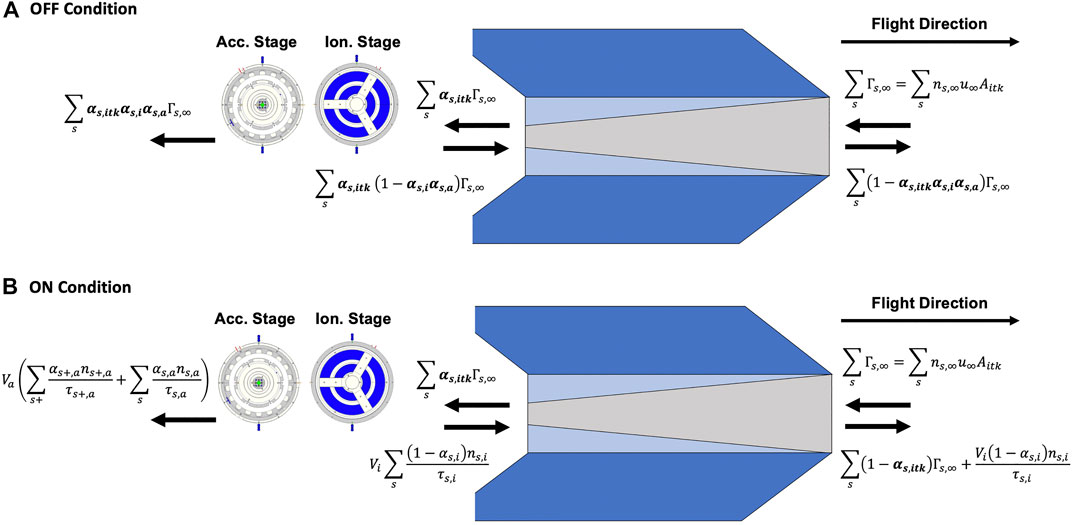
FIGURE 4. (A) Particle continuity in intake and thruster control volumes in OFF condition and (B) particle continuity in intake and thruster control volumes in the ON condition.
At steady-state, the number density in the ionization stage is increased by the compression ratio r, as follows:
Now, consider the case in which the thruster is switched ON, Figure 4B. In the ionization and acceleration stage control volumes, we express ion and neutral particle continuity as follows:
where the four terms in the right-hand side of Eq. (12) represent the particle flux collected from the intake, flow convection, ion flow neutralized at walls (we assume all unchanneled ions to be neutralized at ionization stage walls), and a source/sink term
where kj (Te,i) is the electron temperature-dependent reaction rate of the jth reaction; the neutral or ionized species number density nj, i and electron number density
Similarly to neutral particles, the thruster ion transmissions αs+,i and αs+,a and mean ion residence time τs+,i and τs+,a describe the ionized particle dynamics, and they are all figures of merit for the thruster operation. In particular, the ion transmission αs+,i quantify the capability of the ionization stage to channel the ions toward the acceleration stage while avoiding their neutralization at walls. Particle confinement in the ionization stage, described by the mean residence time τs+,i, quantifies the capability of the thruster to increase plasma density and ionize more effectively.
Now, considering momentum conservation over the entire propulsion system control volume, the thrust T and the net thrust TN are defined as follows:
where the four terms in the right-hand side of Eq. (18), visualized in Figure 5, respectively, represents the momentum of the accelerated ions, the momentum of the neutrals effusing from the acceleration channel, the momentum of the particles not transmitted through the thruster and effusing back through the intake, and the inlet particle momentum. Consistent with Figure 5, it is now convenient to define three propulsion system performance indicators: 1) the collection efficiency ηc, as follows:
2) the effective exhaust velocity ue, as follows:
and 3) the effective inlet velocity u∞,e or, equivalently, the drag coefficient
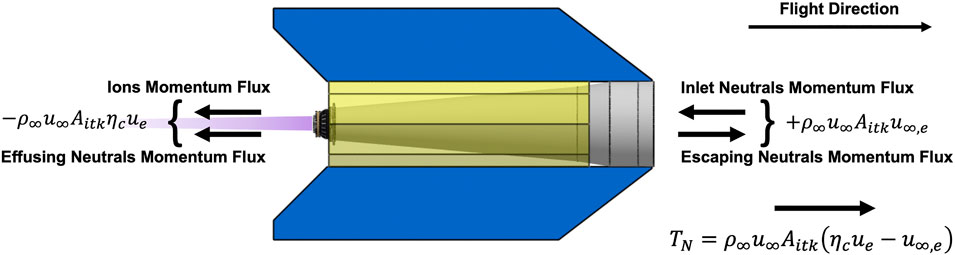
FIGURE 5. Momentum conservation in propulsion system control volume.
The thrust and net thrust expressions simplify as follows:
As ηc defines the probability of an incident particle leaving the propulsion system though the acceleration channel, ηc is proportional to the probability αitk of an incident particle being originally accepted into the ionization stage. Thruster transmission αthr = ηc/αitk and effective exhaust velocity ue (or, equivalently, specific impulse Isp = ue/g0) are key indicators for the thruster performance, and the primary function of the ionization stage is to significantly increase αthr as the thruster is switched ON.
At the satellite level, solar array and platform structure external surface produces a drag, as follows:
where Af is the platform frontal area, and
2.2 Requirement on Thruster Performance
In Eq. (23), we see that the condition to provide a positive net thrust TN > 0 is as follows:
Depending on the achievable αitk and αthr, exhaust velocities on the order of 10 km/s to 100 km/s are required, Figure 6A. This range of exhaust velocity is commonly achieved by electrostatic devices, which are now a mature technology, counting on hundreds of successful flight applications. For electrostatic accelerators, the effective exhaust velocity is usually expressed as follows:
where ϕ is the applied acceleration voltage and ηT is the thrust efficiency. ηT accounts for several thrust detrimental effects, such as incomplete propellant ionization, ineffective ion acceleration, unstable thruster–cathode coupling, and plume divergence [29]. Figure 6B shows the achievable exhaust velocity vs. acceleration voltage and thrust efficiency for a reference atmospheric propellant mass of 21 amu, representative of a 50/50 N2/O composition. For thrust efficiencies higher than 50%, which is a typical value for state-of-the-art electrostatic devices, the criterion ue/Ue > 1 can easily be met. Figure 6C shows the behavior of ue/Ue vs. acceleration voltage and overall system performance αitkαthrηT. For 25% intake transmission (representative of the intake test case selected in Section 4.1) and considering 0.25, 0.5, and 0.75 as reference values for αthrηT, only acceleration voltages higher than 2000, 450, and 250 V can provide a positive net thrust, Figure 6D. Even if achieving sufficiently high thruster performance with atmospheric propellant is not obvious, acceleration voltage levels in the 300–3000 V range are commonly used by electric engines operating with xenon.
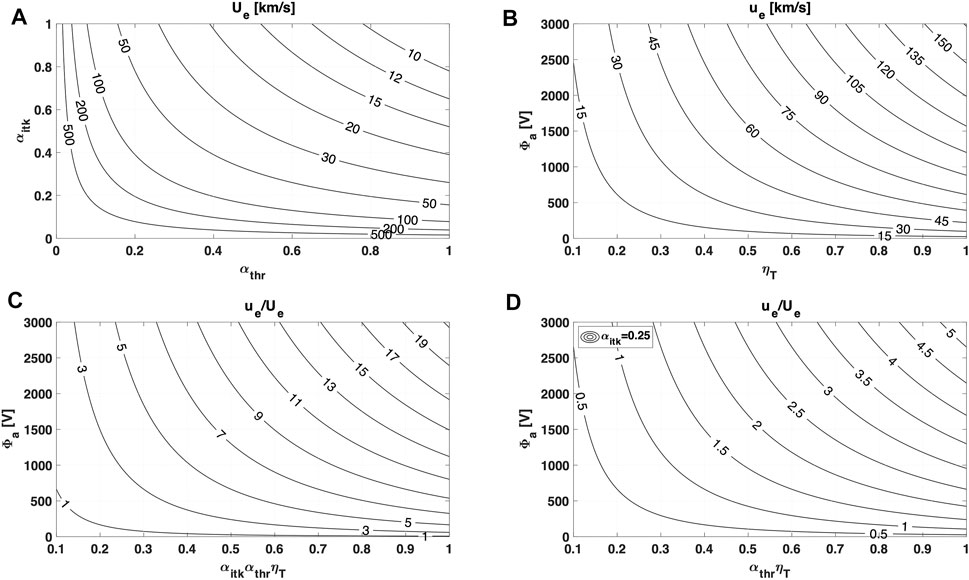
FIGURE 6. (A) Minimum exhaust velocity Ue required to provide a positive net thrust vs. intake and thruster transmission; (B) achievable exhaust velocity ue vs. acceleration voltage and thrust efficiency, for a reference 21 amu propellant mass; (C) ue/Ue vs. acceleration voltage and overall propulsion system performance; (D) ue/Ue vs. acceleration voltage and thruster performance, for a reference 25% intake transmission.
Now, considering any target air-breathing EP application scenario, a mission requirement can be formulated as follows:
where ION and IOFF are the total number of thruster ON/OFF cycles and ti,0, ti,1, tj,0, and tj,1 are the start and end time of the ith/jth ON/OFF cycle. It is reasonable to assume that Ram-EP propulsion is constrained to operate when solar power is available. In this regard, SSO dawn–dusk orbits are a preferred choice as they offer minimum eclipse duration and an almost constant solar flux direction, which allows for reduced drag by orbiting with solar arrays aligned with the incoming flow. By considering time-averaged quantities, Eq. (28) can be simplified as follows:
where tOFF and tON are the total OFF and ON time accumulated throughout the mission. Based on Eqs (19) and (21), we can see that the intake drag coefficient is related to the collection efficiency ηc and mean of the axial velocity distribution of the reflected particles uz,itk as follows:
Platform drag can be reduced by relaxing solar array area requirement, for example, by reducing the thruster power consumption or by increasing solar cells and power distribution efficiencies. In general, platform performance may be quantified as available power Pav per unit platform drag area
2.3 Intake Fitness
We here define as “optimal” the intake designs that minimize the minimum required exhaust velocity, given the constraint on intake wake volume (Figure 2) for low-drag integration of main platform subsystems. The requirement on minimum exhaust velocity expressed in Eq. (30) can be relaxed by decreasing the ratio tOFF/tON, which is driven by mission/platform requirements and is not influenced by the intake design, and by increasing the collection efficiency ηc and the intake to frontal area ratio Aitk/Af. A proper intake and platform aerodynamic design reducing both intake and platform drag coefficients is also beneficial. In free-molecular flows, the drag coefficient CD is affected by several variables, such as flow properties, wall material, temperature, and geometry [30], and can not be estimated without a detailed assessment of flow properties and platform geometry/thermal behavior. However, the impact on drag caused by the dependence of CD on lateral surface shape and wall/flow temperature is usually of secondary importance when compared to the impact of the frontal area Af. In addition, in the absence of detailed information on platform design, the impact of intake geometry on Af can only be estimated by simple proportionality relations, implying that the intake design must be optimized iteratively throughout the whole platform design process. As such, we here consider as “weakly optimal” the intake designs maximizing the achievable ηcAitk/Af (which is the ratio of the propellant collecting area and the platform frontal area), given the platform constraint on intake wake volume. The resulting weakly optimal intake designs, discussed in Section 4, can then be used as an initial guess for further optimization during the advancement of air-breathing platform design and consolidation. In this study, we limit our analysis to a simplified intake geometry consisting of a truncated conical shape having an inlet radius R1, an outlet radius R2, and a length L1. This is the simplest shape to consider for connecting the intake to the thruster, allowing payload and other spacecraft systems housing in the free volume behind the intake wake. We described any conical intake geometry by means of two dimensionless parameters, defined as the intake aspect ratio d1 = L1/R1 and the intake to ionization stage inlet area ratio
which is simply the ratio of intake wake volume and cubed thruster inlet radius
Considering now quasi-continous thruster operation tOFF/tON ∼ 0 and a platform frontal area comparable to the intake inlet area Af ∼ Aitk, we have ue ∝ u∞/ηc, and Eq. (32) can be reformulated as follows:
Assuming a minimum value of neutral density for which the thruster can efficiently operate, a higher intake compression allows the spacecraft to orbit at lower atmospheric densities ρ∞∝ 1/r, where r is the intake compression ratio as defined in Eq. (11). Moreover, the transmission αthr is not influenced by the intake design as it is driven by thruster performance only. We thus estimated the influence of the intake design on solar array area requirement as follows:
Considering solar arrays of length LS/A and thickness hS/A to be aligned with the atmospheric flow, as it would be in a SSO dawn-dusk mission scenario, we have the following:
As hS/A is not influenced by the intake design, and assuming the solar array length LS/A to be comparable to intake length
and compute the to-be-maximized intake collecting area to platform frontal area as follows:
where we used ηc ∝ αitk, since the thruster transmission αthr is not impacted by the intake design. In the following section, we presented a simple Monte Carlo algorithm aimed at computing the performance of conical intake geometries. Weakly optimal intake geometries, here defined as the ones maximizing
3 Neutral Monte Carlo
In the last decade, a number of intake concepts for air-breathing EP application were investigated by several research groups [10, 20–24]. Most of these concepts proposed compact intake geometries featuring an inlet composed of several elongated ducts having a circular, rectangular, or hexagonal section and act as a molecular trap for the collected flow, ideally increasing the collected particles residence time inside the propulsion system, hence the achievable intake compression. In the study mentioned in reference [24], the impact of wall accommodation on intake performance is investigated, showing how, in the hypothesis of pure specular reflection, an impressive 94% particle transmission can be achieved by a parabolic intake shape connected to the thruster inlet. Since most materials used in practical applications are highly diffusive, the authors highlight the importance of researching on novel aerodynamic materials promoting nearly specular reflection. Fundamental physical phenomena involved in rarefied flow air intakes were thoroughly investigated by Parodi et al. [25], who derived a lumped intake performance model and performed direct Monte Carlo simulations on a specific intake configuration, but it lacked an accurate geometrical description of the downstream thruster. In this study, the geometry of the AETHER thruster prototype is modeled and connected to the intake outlet radius, which coincides with the thruster ionization stage inlet radius R2 = 0.17 m. The same Monte Carlo algorithm may be applied for any geometry downstream of the intake. As an example, Figure 7 provides a sketch of a conical intake and plasma thruster integrated in a GOCE-like spacecraft.
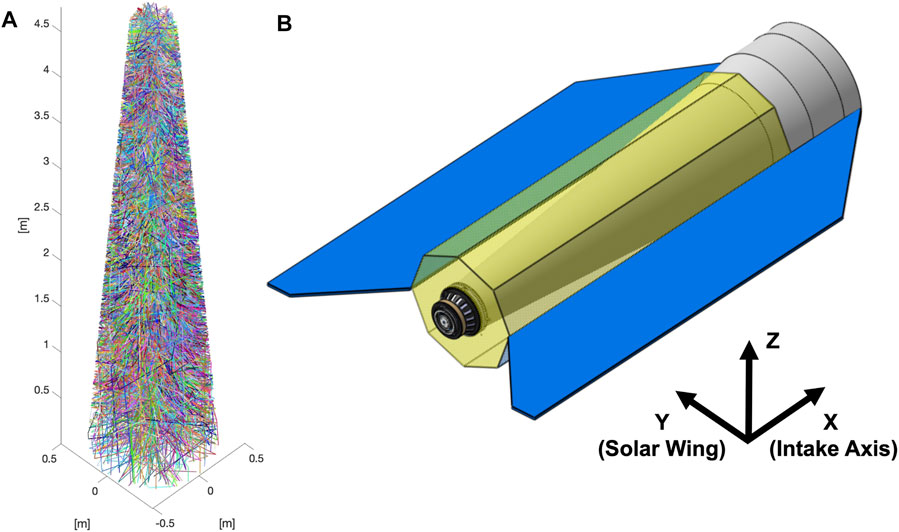
FIGURE 7. (A) Example of conical intake, including 100 simulated particle trajectories. (B) Impression of intake integration in a GOCE-like platform and definition of a body-fixed reference frame.
Consistent with the hypothesis of a uniform inlet flow density, the initial particle position is sampled from a uniform distribution over the intake inlet area. According to the reference frame defined in Figure 7, a drifted Maxwellian velocity distribution is assumed for the inlet atmospheric particles, as follows:
where u∞ is the spacecraft orbital velocity and
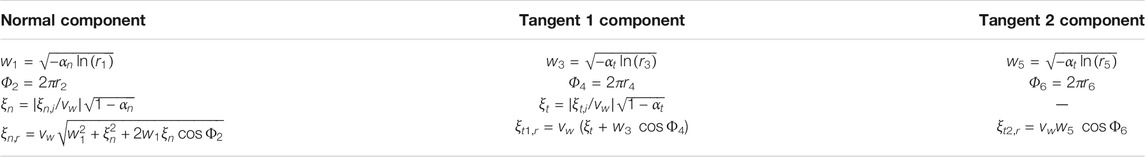
TABLE 2. CLL algorithm for gas–surface reflection of rarefied hypersonic flows, reproduced from the study mentioned in reference [28].
The impact of wall temperature on intake performance is investigated in Section 4.4. αn and αt are the normal energy and tangential momentum accommodation coefficients, here, respectively, set to 1 and 0.9 as suggested in the study mentioned in [28]. Intake performance sensitivity on αn and αt is evaluated in Section 4.4. ξn,i is the incident velocity component along the surface normal and ξt,i is the incident tangential velocity component. ξn,r is the reflected velocity component along the surface normal, ξt1,r is directed along the incident velocity tangential component, and ξt2,r is the third reflected velocity component. Accordingly, we defined the local normal reference frame as [ex’, ey’, ez′], where ez’ is directed along the local surface normal
and the reflected velocity is sampled in the normal frame according to the CLL algorithm, as follows:
and transformed back into the body fixed reference frame, as follows:
The sampled velocity is then applied to the particle from its updated starting position at the collision location. The same algorithm is applied for all subsequent wall collisions until the particle is scattered back to the external environment through the intake inlet or through the thruster exit plane. As reported in Section 2 of Supplementary Material, kernel implementation was validated against results available in literature [31]. As an example, Figure 8 shows the main distributions describing 1e5 N2 particles dynamics of a d1 = 9 and d2 = 7.5 intake, from which the parameters listed in Table 1 can be extracted. Together with the computed values of αs,itk, αs,i, and αs,a, information on mean particle residence times τs,a and τs,i and escape velocities us,itk and us,a can be used to describe the flow evolution in the two thruster control volumes according to the formulation presented in Section 2.1.
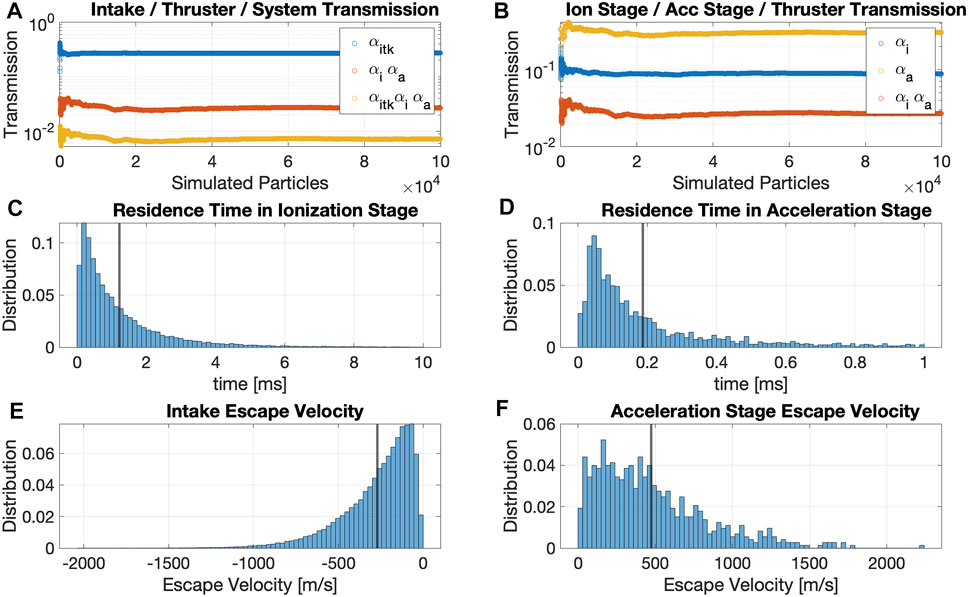
FIGURE 8. Neutral Monte Carlo output for a reference intake test case and 1e5 simulated N2 particles. The Ram-EP thruster is in the OFF state. (A) Intake, thruster, and system transmissions; (B) ionization stage, acceleration stage, and thruster transmissions; (C) residence time distribution in the ionization stage control volume; (D) residence time distribution in the acceleration stage control volume; (E) intake escape velocity distribution; (F) acceleration stage escape velocity distribution.
4 Results and Discussion
4.1 Intake Performance Evaluation
Without loss of generality, we computed intake performance for a pure N2 flow. Performance sensitivity on flow composition is then assessed in Section 4.2. Figures 9A–C, respectively, show the impact of intake geometry on N2 transmission αitk, compression r, and volume utilization ν for the intake aspect ratio d1 and the area ratio d2 ranging between 2 and 20. As the intake transmission decreases monotonically with d2, the flow rate ∝ αitkd2 accepted into the thruster increases less than linearly with the intake inlet area. For area ratios d2 < 3, the high degree of inlet flow collimation allows achieving a flow transmission greater than 50% also for large aspect ratios d1 > 10. Higher values of d1 increase the mean particle residence time, being more and more difficult for a thermalized particle in the ionization volume to be scattered back to the external environment. As discussed in Section 2.3, a weakly optimal intake design maximizes the achievable collection area to the frontal area ratio
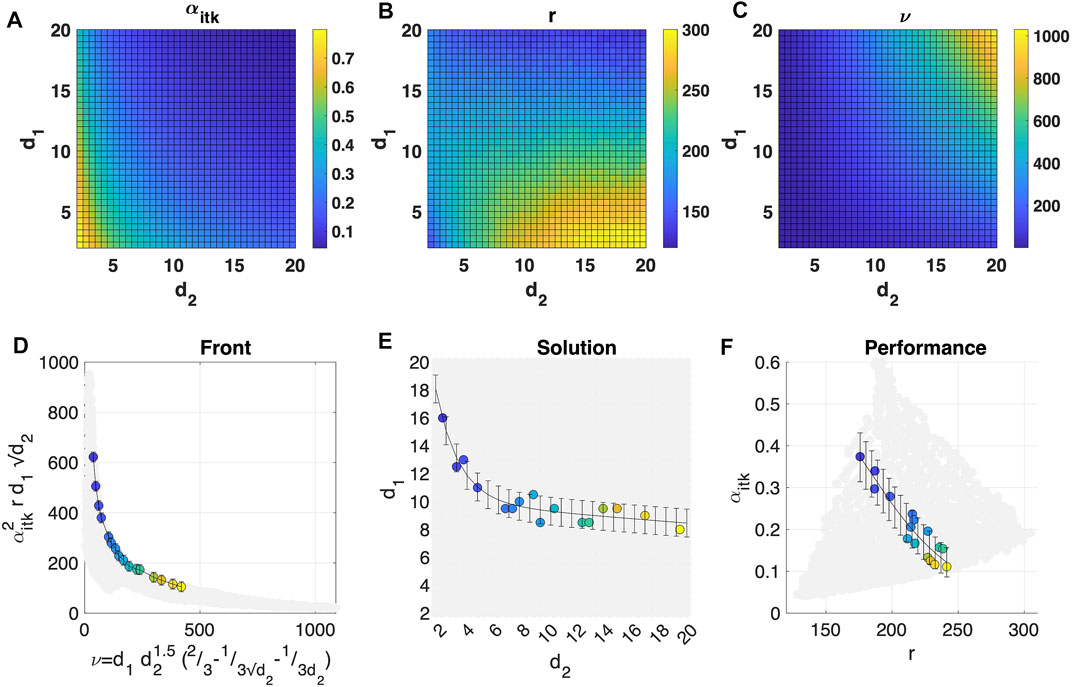
FIGURE 9. (A) Intake transmission αitk, (B) compression r, and (C) volume utilization ν vs. intake aspect ratio d1 and area ratio d2 ranging between 2 and 20. Simulated species: N2. Figure resolution: 37 × 37 simulations. Simulated particles for each simulation: 1e5. (D) Front, (E) solution, and (F) performance maximizing
4.2 Flow Composition
The effect of flow composition on intake performance is evaluated in Figure 10 for several N2/O/O2 mixtures, including pure N2, pure O, and pure O2 flows. Both transmission and compression increase by increasing the average propellant molecular mass, since a smaller molecular mass implies higher thermal velocities as well as a reduction of flow collimation and residence time. Comparing pure O with respect to pure O2 flow, transmission decreases from about 24 to 19%, while the achievable compression decreases from about 240 down to 140. Even if O2 is a minor constituent in VLEO, it is a species of interest for simulating very low orbits during on-ground testing of air-breathing systems, as storing oxygen in atomic form is not feasible and achieving a complete O2 dissociation in any kind of VLEO flow simulator is complex. In the following sensitivity analysis, we used a 50/50 N2/O composition as a reference, representative of a 200 km of altitude flight scenario during medium solar activity.
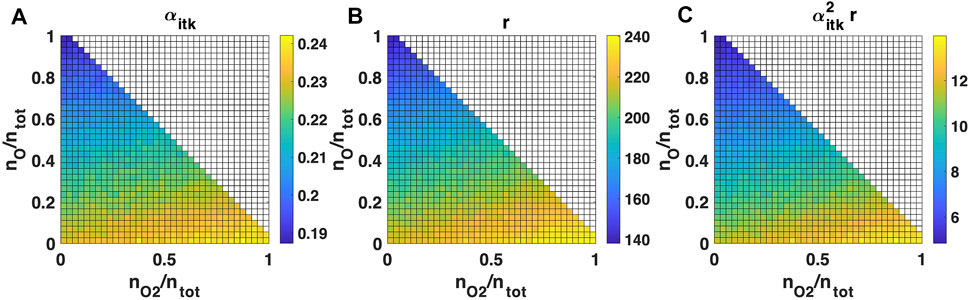
FIGURE 10. Impact of inlet flow N2/O/O2 composition on the reference intake test case (A) transmission, (B) compression, and (C) intake fitness. The graph origin corresponds to a pure N2 flow. Figure resolution: 37 × 37 simulations. Simulated particles for each simulation: 1e5.
4.3 Inlet Flow Temperature and Velocity
Not only flow composition but also its temperature largely varies depending on orbital parameters, time and solar activity. Figures 3E,F show a yearly flow temperature evolution at 180 and 250 km SSO dawn dusk orbits, where typical temperature values are between 700 and 1000 K. In principle, a higher inlet flow temperature has a detrimental impact on intake performance, as the increased flow thermal velocity decreases the inlet flow collimation. However, as illustrated in Figure 11, the actual impact on performance turns out to be minor and on the order of a few percentage points between the two considered temperature extremes. Admitting the possibility of a Ram-EP S/C to target not only circular but also elliptical orbits, and in general to be capable of performing different maneuvers, the impact of inlet flow velocity (in the 5 km/s to 15 km/s magnitude range) is also assessed in Figure 11. A higher inlet flow velocity increases significantly both intake transmission and compression, but, of course, it implies a higher drag and a more demanding requirement on the thruster discharge power consumption needed to provide a positive net thrust.
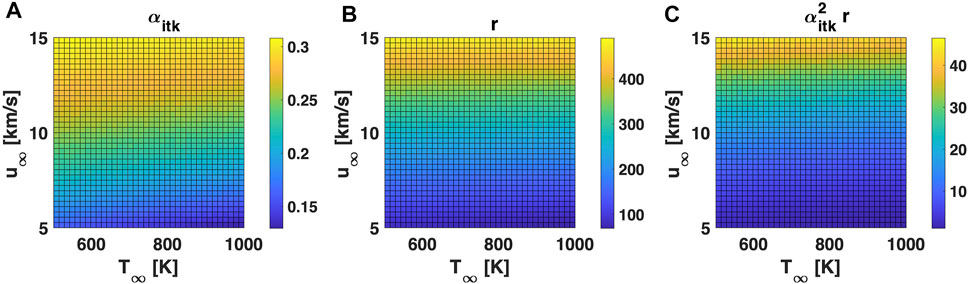
FIGURE 11. Impact of inlet flow velocity and temperature on the reference intake test case (A) transmission, (B) compression, and (C) intake fitness for a 50/50 N2/O composition. Figure resolution: 37 × 37 simulations. Simulated particles for each simulation: 1e5.
4.4 Wall Temperature and Accommodation
As discussed in Section 3, in our propulsion system the flow dynamics are dominated by particle-wall collisions, and, as indicated in Table 2, the reflected velocity distribution is affected by wall temperature. In general, intake and thruster wall temperatures may vary during the mission, depending on thruster discharge power (which, in turn, depends on the inlet flow density and exhaust velocity) and other S/C internal heat sources, together with direct Sun radiation, Earth’s albedo, IR radiation, and free-molecular heating from the atmospheric flow. Figures 12A–C show the performance sensitivity on intake and thruster wall temperature ranging between 300 and 800 K for a reference 50/50 N2/O composition. A higher intake temperature slightly decreases the flow transmission, from about 22 to 18% at the two temperature extremes considered. Higher intake and thruster wall temperatures both reduce the mean particle residence time in the ionization stage. As a consequence, the resulting compression ratio is reduced from a maximum of 220 to a minimum of 120 among the considered wall and thruster temperature extremes. Thus, cooler walls improve intake performance.
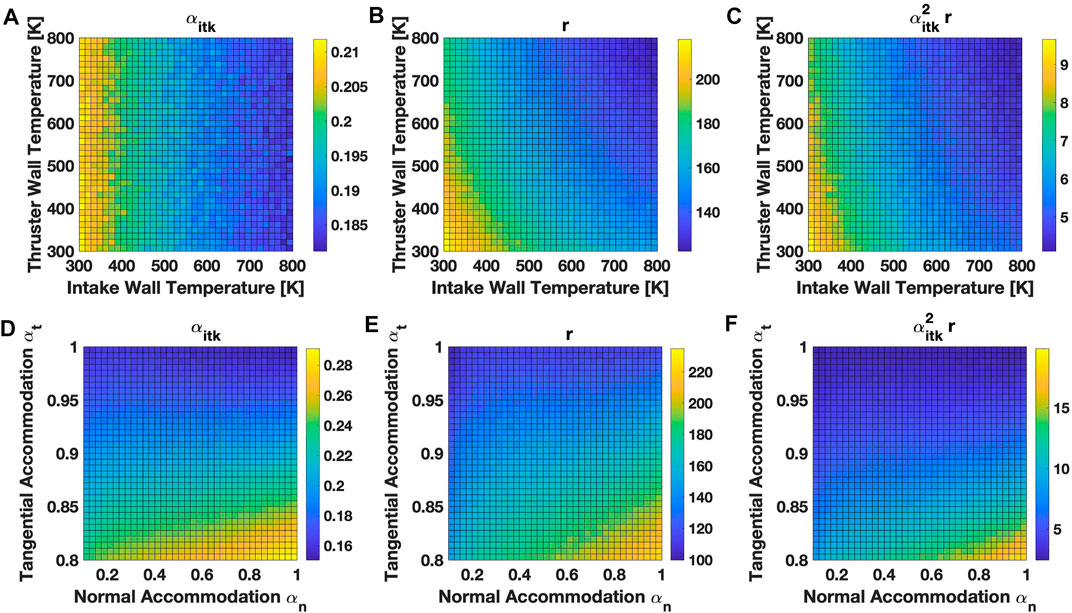
FIGURE 12. Impact of S/C intake and thruster wall temperature on the reference intake test case (A) transmission, (B) compression, and (C) intake fitness, and impact of normal and tangential wall accommodation coefficients on intake (D) transmission, (E) compression, and (F) intake fitness for a 50/50 N2/O composition. Figure resolution: 37 × 37 simulations. Simulated particles for each simulation: 1e5.
Intake performance sensitivity on normal energy and tangential momentum accommodation coefficients αn and αt is visualized in Figures 12D–F. Consistently with most materials used in practical applications [31], we let αn and αt range from 0.1 to 1 and 0.8 to 1, respectively. A larger normal and a lower tangential accommodation improve intake performance. Intake transmission increases from about 15 to 29% as αt is reduced from 1 to 0.8 and αn is increased from 0.1 to 1. This behavior is consistent with the calculations for conical holes reported in [31]. The impact of wall accommodation add uncertainty in predicting the in-orbit performance of air-breathing systems, as αn and αt are difficult to assess with good precision and may change during the mission lifetime due to atmospheric oxygen contamination.
4.5 Spacecraft Attitude
In previous analyses, we always assumed the intake axis to be perfectly aligned with the relative spacecraft-flow velocity vector. In general, this condition is not always met throughout the mission duration, depending on orbital dynamics, spacecraft attitude and external disturbances. Considering that any intake—flow velocity misalignment affects the output particle transmissions and distributions, a dedicated sensitivity study was performed to address this issue. Spacecraft’s rotations can directly be related to orbital velocity drifts along the S/C body-fixed reference frame. Consistently with Figure 7, we identify the roll x-axis as parallel to the S/C longitudinal direction and directed toward the intake inlet area, the S/C pitch y-axis as directed toward the zenith pointing S/C solar wing and the yaw z-axis to form a right-handed orthonormal frame. The inlet particle velocity distribution is approximated as
where β and γ are the S/C pitch and yaw angles with respect to the incoming flow direction or, equivalently, orbital velocity.
Impact of S/C attitude on intake performance is shown in Figure 13 for yaw and pitch angles ranging between −10 and 10°. Both transmission and compression are greatly affected by intake axis—flow direction misalignment. At 10° of yaw or pitch, there is an up to 90% performance reduction, coming down to a 20% reduction at 5° yaw/pitch. Intake sensitivity to S/C attitude can however be reduced by shortening the overall intake length, at the expanse of a reduced volume available behind the intake wake. As a comparison, at drag levels below 50 mN the GOCE S/C was capable of guaranteeing ±6° yaw/pitch by using magnetorquers only [7].
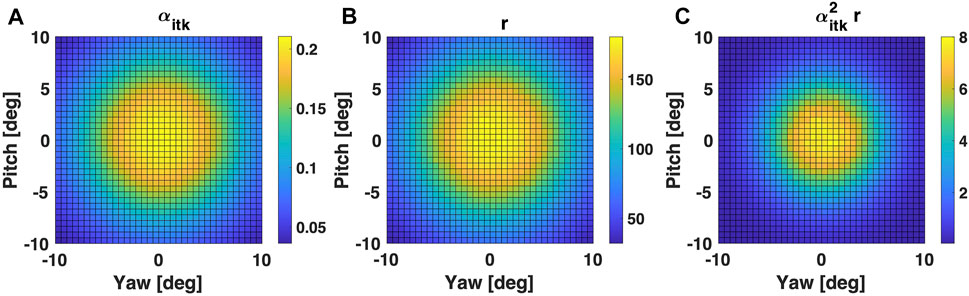
FIGURE 13. Impact of S/C yaw and pitch angles on the reference intake test case (A) transmission, (B) compression, and (C) intake fitness for a 50/50 N2/O composition. Figure resolution: 37 × 37 simulations. Simulated particles for each simulation: 1e5.
5 Conclusion
VLEO spaceflights are gaining increasing interest among the space community and end-users. Nevertheless, the need to counteract the atmospheric drag with a propulsion system ties the satellite lifetime to the amount of propellant stored onboard. Air-breathing electric propulsion could eliminate the need for storing propellant onboard while providing effective drag compensation, and it has the potential to become an enabling technology for VLEO missions. In this study, we reviewed—to the best of authors’ knowledge—the most recent studies in air-breathing EP technology while deriving a first set of performance indicators for the intake geometry and requirements on thruster performance. To describe neutral particle dynamics in the intake and thruster control volumes, we developed a rarefied flow Monte Carlo routine, which neglects inter-particles collisions and uses the CLL reflection model to describe gas–surface interactions. We investigated conical intake geometries for a given downstream thruster geometry, representative of an air-breathing thruster prototype. Accordingly, we evaluated the achievable performance by a conical intake, investigating a broad design space and defining as “optimal” the intake designs minimizing the exhaust velocity required for full drag compensation given the constraint on intake wake volume. Sensitivity of a selected intake test case on flow composition, velocity, and temperature, together with wall temperature and spacecraft attitude was investigated, quantifying the impact of the variation of each parameter on intake performance. Due to the high variability of VLEO flow properties and challenges in reproducing VLEO environment on-ground, further research shall focus in modeling air-breathing EP devices while devising optimum platform power management and thrust strategies. In this regard, a simplified hybrid 0D description of air-breathing thruster ionization and acceleration stages plasma was introduced. Even if we always tried to decouple propulsion from platform performance, it is apparent how air-breathing EP systems are profoundly intertwined with platform design and mission case. Therefore, the reference intake test case employed in this study is not to be considered as the exact geometry to be adopted in a realistic scenario. Indeed, other considerations at higher level, such as mission feasibility and payload requirements may significantly deviate from the definition of optimum intake design we have provided in this study. Nonetheless, in Section 2 we derived a set of requirements and optimality conditions for electrostatic air-breathing EP operation, suggesting technological feasibility for acceleration voltages in the 300V–3000 V range.
Data Availability Statement
The raw data supporting the conclusion of this article will be made available by the authors, without undue reservation.
Author Contributions
Conceptualization: EF, FC, VG, and TA. Methodology: EF, VG, and TA. Data visualization: EF. Writing: EF, FC, VG, and TA. Review and editing: MT and AL. Supervision: TA, FC, and AL. All authors approved the submitted version.
Funding
This work has been performed within the AETHER project, funded by the European Union’s Horizon 2020 research and innovation program under grant agreement No. 870 436.
Author Disclaimer
This work only reflects the author’s view and the European Commission is not responsible for any use that may be made of the information it contains.
Conflict of Interest
The authors declare that the research was conducted in the absence of any commercial or financial relationships that could be construed as a potential conflict of interest.
Publisher’s Note
All claims expressed in this article are solely those of the authors and do not necessarily represent those of their affiliated organizations, or those of the publisher, the editors, and the reviewers. Any product that may be evaluated in this article, or claim that may be made by its manufacturer, is not guaranteed or endorsed by the publisher.
Acknowledgments
The authors wish to express their gratitude to The von Karman Institute for Fluid Dynamics for providing the data of Figure 3. Fruitful discussions with Pietro Parodi, Pedro Jorge, Damien Le Quang, Zuheyr Alsalihi, Thierry Magin, and Mariano Andrenucci are gratefully acknowledged.
Supplementary Material
The Supplementary Material for this article can be found online at: https://www.frontiersin.org/articles/10.3389/fphy.2022.823098/full#supplementary-material
References
1. Crisp NH, Roberts PCE, Romano F, Smith KL, Oiko VTA, Sulliotti-Linner V, et al. System Modelling of Very Low Earth Orbit Satellites for Earth Observation. Acta Astronautica (2021) 187:475–91. doi:10.1016/j.actaastro.2021.07.004
2. Crisp NH, Roberts PCE, Livadiotti S, Oiko VTA, Edmondson S, Haigh SJ, et al. The Benefits of Very Low Earth Orbit for Earth Observation Missions. Prog Aerospace Sci (2020) 117:100619. doi:10.1016/j.paerosci.2020.100619
3. Kansakar P, Hossain F. A Review of Applications of Satellite Earth Observation Data for Global Societal Benefit and Stewardship of Planet Earth. Space Policy (2016) 36:46–54. doi:10.1016/j.spacepol.2016.05.005
4.H Klinkrad, J Pelton, S Madry, and S Camacho-Lara, editors. ”Orbital Debris and Sustainability of Space Operations”, Handbook of Satellite Applications. New York, NY: Springer (2013). p. 1145–74. doi:10.1007/978-1-4419-7671-0_77
5. Drinkwater MR, Floberghagen R, Haagmans R, Muzi D, Popescu A. GOCE: ESA's First Earth Explorer Core Mission. In: G Beutler, MR Drinkwater, R Rummel, and R Von Steiger, editors. Earth Gravity Field from Space — from Sensors to Earth Sciences, Vol. 17. Dordrecht: Springer (2003). p. 419–32. Space Sciences Series of ISSI. doi:10.1007/978-94-017-1333-7_36
6. Fujita K, Noda A. Rarefied Aerodynamics of a Super Low Altitude Test Satellite. In: 41st AIAA Thermophysics Conference; 22 - 25 June 2009; San Antonio, Texas (2009). doi:10.2514/6.2009-3606
7. Steiger C, Romanazzo M, Emanuelli PP, Floberghagen R, Fehringer M. The Deorbiting of ESA's Gravity Mission GOCE - Spacecraft Operations in Extreme Drag Conditions. In: AIAA 2014-1934 Session: OCMSA - End of Life Operations (2014). doi:10.2514/6.2014-1934
8. Schonherr T, Komurasaki K, Romano F, Massuti-Ballester B, Herdrich G. Analysis of Atmosphere-Breathing Electric Propulsion. IEEE Trans Plasma Sci (2015) 43(Issue1):287–94. doi:10.1109/TPS.2014.2364053
9. Erofeev AI, Nikiforov AP, Popov GA, Suvorov MO, Syrin SA, Khartov SA. Air-Breathing Ramjet Electric Propulsion for Controlling Low-Orbit Spacecraft Motion to Compensate for Aerodynamic Drag. Sol Syst Res (2017) 51(7):639–45. doi:10.1134/S0038094617070048
10. Andreussi T, Ferrato E, Giannetti V, Piragino A, Paissoni CA, Cifali G, et al. Development Status and Way Forward of SITAEL's Air-Breathing Electric Propulsion Engine”, AIAA Propulsion and Energy Forum Exposition, 2019, Indianapolis (US): American Institute of Aeronautics and Astronautics, Inc., doi:10.2514/6.2019-3995
11. Romano F, Chan Y-A, Herdrich G, Traub C, Fasoulas S, Roberts PCE, et al. RF Helicon-Based Inductive Plasma Thruster (IPT) Design for an Atmosphere-Breathing Electric Propulsion System (ABEP). Acta Astronautica (2020) 176:476–83. doi:10.1016/j.actaastro.2020.07.008
12. Zheng P, Wu J, Zhang Y, Wu B. A Comprehensive Review of Atmosphere-Breathing Electric Propulsion Systems. Int J Aerospace Eng (2020) 2020:1–21. Article ID 8811847. doi:10.1155/2020/8811847
13. Hecht F. New Development in Freefem++. F\\enleadertwodots ”New Dev freefem++” J Numer Maths (2012) 20(3-4):251–66. doi:10.1515/jnum-2012-0013
14. Hwang W, Kim YK, Rudd ME. New Model for Electron‐impact Ionization Cross Sections of Molecules. J Chem Phys (1996) 104:2956–66. doi:10.1063/1.471116
15. Kim Y-K, Desclaux J-P. Ionization of Carbon, Nitrogen, and Oxygen by Electron Impact. Phys Rev A (2002) 66:012708. doi:10.1103/PhysRevA.66.012708
16. Cosby PC. Electron‐impact Dissociation of Nitrogen. J Chem Phys (1993) 98:9544–53. doi:10.1063/1.464385
17. Rapp D, Englander‐Golden P, Briglia DD. Cross Sections for Dissociative Ionization of Molecules by Electron Impact. J Chem Phys (1965) 42:4081–5. doi:10.1063/1.1695897
18. Picone JM, Hedin AE, Drob DP, Aikin AC. NRLMSISE-00 Empirical Model of the Atmosphere: Statistical Comparisons and Scientific Issues. J Geophys Res (2002) 1071468(No. A12):15–1. doi:10.1029/2002JA009430
19. Canuto E, Massotti L. All-propulsion Design of the Drag-free and Attitude Control of the European Satellite GOCE. Acta Astronautica (2009) 64:325–44. doi:10.1016/j.actaastro.2008.07.017
20. Fujita K. Air Intake Performance of Air Breathing Ion Engines. J Jpn Soc Aeronaut Space Sci (2004) 52(610):514–21. doi:10.2322/jjsass.52.514
21. Hohman K. Atmospheric Breathing Electric Propulsion for Planetary Exploration, 11. Natick, MA: Busek. Co. Inc. (2012). p. 01760–1023.
22. Binder T, Boldini PC, Romano F, Herdrich G, Fasoulas S. Transmission Probabilities of Rarefied Flows in the Application of Atmosphere-Breathing Electric Propulsion. AIP Conf Proc (2016) 1786(1):190011. doi:10.1063/1.4967689
23. Erofeev AI. Air Intake in the Transient Regime of Rarefied Gas Flow. Tsagi Sci J (2018) 49:137–48. doi:10.1615/TsAGISciJ.2018026789
24. Romano F, Espinosa-Orozco J, Pfeiffer M, Herdrich G, Crisp NH, Roberts PCE, et al. Intake Design for an Atmosphere-Breathing Electric Propulsion System (ABEP). Acta Astronautica (2021) 187:225–35. doi:10.1016/j.actaastro.2021.06.033
25. Parodi P, d’Agostino L, Magin T, ”Analysis and Simulation of an Intake for Air-Breathing Electric Propulsion Systems”, Thesis M.Sc Aerospace Eng (2019). 37–71. , doi:10.13140/RG.2.2.12966.34889
26. Cercignani C. Scattering Kernels for Gas-Surface Interactions. Transport Theor Stat Phys (1972) 2(1):27–53. doi:10.1080/00411457208231462
27. Crisp SNH, Roberts PCE, Worrall SD, Oiko VTA, Edmondson S, Haigh SJ, et al. A Review of Gas-Surface Interaction Models for Orbital Aerodynamics Applications. Prog Aerospace Sci (2020) 119:100675. doi:10.1016/j.paerosci.2020.100675
28. Padilla JF, Boyd ID. Assessment of Gas–Surface Interaction Models for Computation of Rarefied Hypersonic Flow. In: Journal of Thermophysics and Heat Transfer. Ann Arbor: University of Michigan (2009). Michigan 48109 January–March 2009 10.2514/1.36375.
29. Goebel DM, Katz I. Fundamentals of Electric Propulsion: Ion and Hall Thrusters. JPL CalTech (2008). doi:10.1002/9780470436448
30. Schaaf PASA, Chambre PL. Flow of Rarefied Gases. Princeton University Press (1961). doi:10.1515/9781400885800
Keywords: air-breathing electric propulsion, VLEO spaceflight, rarefied gas dynamics, Monte Carlo simulation, plasma modeling
Citation: Ferrato E, Giannetti V, Tisaev M, Lucca Fabris A, Califano F and Andreussi T (2022) Rarefied Flow Simulation of Conical Intake and Plasma Thruster for Very Low Earth Orbit Spaceflight. Front. Phys. 10:823098. doi: 10.3389/fphy.2022.823098
Received: 26 November 2021; Accepted: 27 January 2022;
Published: 04 March 2022.
Edited by:
Laurent Garrigues, UMR5213 Laboratoire Plasma et Conversion d’Energie (LAPLACE), FranceReviewed by:
Dmitry Levko, Esgee Technologies, United StatesNickolay Ivchenko, Royal Institute of Technology, Sweden
Copyright © 2022 Ferrato, Giannetti, Tisaev, Lucca Fabris, Califano and Andreussi. This is an open-access article distributed under the terms of the Creative Commons Attribution License (CC BY). The use, distribution or reproduction in other forums is permitted, provided the original author(s) and the copyright owner(s) are credited and that the original publication in this journal is cited, in accordance with accepted academic practice. No use, distribution or reproduction is permitted which does not comply with these terms.
*Correspondence: Eugenio Ferrato, eugenio.ferrato@sitael.com