Large-Scale Cortex-Core Structure Formation in Brain Organoids
 Ahmad Borzou1*
  J. M. Schwarz1,2*
- 1Department of Physics and BioInspired Institute, Syracuse University, Syracuse, NY, United States
- 2Indian Creek Farm, Ithaca, NY, United States
Brain organoids recapitulate a number of brain properties, including neuronal diversity. However, do they recapitulate brain structure? Using a hydrodynamic description for cell nuclei as particles interacting initially via an effective, attractive force as mediated by the respective, surrounding cytoskeletons, we quantify structure development in brain organoids to determine what physical mechanism regulates the number of cortex-core structures. Regions of cell nuclei overdensity in the linear regime drive the initial seeding for cortex-core structures, which ultimately develop in the non-linear regime, as inferred by the emergent form of an effective interaction between cell nuclei and with the extracellular environment. Individual cortex-core structures then provide a basis upon which we build an extended version of the buckling without bending morphogenesis (BWBM) model, with its proliferating cortex and constraining core, to predict foliations/folds of the cortex in the presence of a nonlinearity due to cortical cells actively regulating strain. In doing so, we obtain asymmetric foliations/folds with respect to the trough (sulci) and the crest (gyri). In addition to laying new groundwork for the design of more familiar and less familiar brain structures, the hydrodynamic description for cell nuclei during the initial stages of brain organoid development provides an intriguing quantitative connection with large-scale structure formation in the universe.
1 Introduction
What physical mechanisms are at play in determining brain structure? In humans, the beginning of brain structure begins about 2 weeks after fertilization with the formation of a neural plate [1]. The neural plate then folds inward on itself to form a neural tube. From this neural tube, different brain regions, such as the forebrain and the hindbrain emerge. In the forebrain, the proliferating progenitor cells in the innermost part of the tube form the ventricular zone, with extended, radial glial cells linking the cells in the ventricular zone to the outer edge of the neural tube. It is these extended radial glial cells that the inner progenitor cells crawl along to reach the outer part of the forebrain. As they do so, they differentiate to become neurons and form a cortex, consisting of six layers of cells, around 20 weeks later. In the hindbrain, the proliferation of progenitor cells occurs in the outer region with their migration towards the center of the structure. In humans, both the cerebral cortex (emerging from the forebrain) and the cerebellar cortex (emerging from the hindbrain) undergo shape changes in the form of folds or foliations.
Until recently, many of the biophysical models for brain structure have focused on the later stages of brain shape development, namely the development of folds of the cerebrum and the cerebellum [2–12]. These models essentially divide into two camps. The first camp consists of nonlinear elastic models with differential swelling mimicking cell growth and generating compressive forces that drive the initiation of folds [2, 4, 6, 8–10]. They argue that the size and shape of the folds arise via the mechanical stability kown as buckling that occurs, for example, when a rod is axially compressed beyond some threshold force. And yet, such purely elastic models predict a particular pattern of cortical thickness variations that is not observed in the developing mouse cerebellum, or the little brain [12]. The second camp focuses on tension-based, multi-phase models in the presence of cell growth and generating tensile forces that drive the initiation of folds [3, 5, 11, 12]. One such model, known as “buckling without bending”, is able to provide a mechanism for the patterning of cortical thickness variations observed in the developing mouse cerebellum [11, 12]. And while such models focus on tensile forces as initiating the folds, compressive forces may indeed also play a role as cell growth continues such that the tissue becomes more crowded. We must also point out that some argue that experiments on ferret brains, whose folds develop ex utero, rule out the initial version of the tension-based models by observing the displacement of brain tissue in response to cuts in particular directions [13]. However, there exists a revised version of the initial tension-based model with a different direction of the tension that has yet to be tested experimentally and so we indeed should not leave tension-based models behind [5].
While many biophysical studies of brain structure focus on the folds of the cerebrum or the cerebellum, the emergence of the base structure of a cortex-core at earlier stages of development is also very important. It is this emergence that we will focus on for the first part of the manuscript using a minimal model. Interestingly, a new in vitro brain system, namely brain organoids [14], provides a testing ground for understanding the emergence of brain structure [15, 16], as well as recapitulates such phenomena as neuronal diversity [17] and neuronal firing patterns [18]. One such study focuses on quasi-two-dimensional brain organoids that start as a relatively isotropic clump of cells, which is then inserted between two “plates” separated by approximately 150 μm [16]. Within several days, the clump morphs into several sub-structures each with a core with globular, polyhedral-shaped cells and radially-stretched cells surrounding each core to form a cortex, or, there is only one cortex-core structure. See Figure 1 in which latter result is labelled pathway “2D A” and the former, “2D B”. After this initial shape change in the “2D A” pathway and the cortex-core structure continues to grow, a foliation amongst the radially-stretched cells, or cortex, emerges [16].
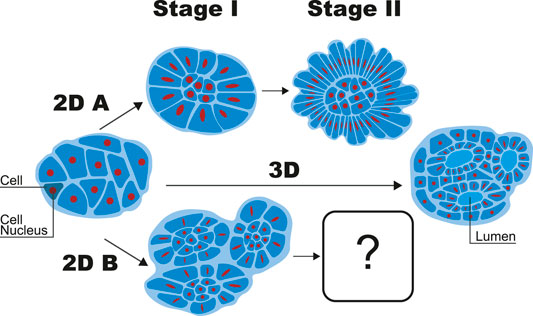
FIGURE 1. A simplified version of different possible organoid shapes in quasi-2D confinement (2DA and 2DB) and not in quasi-2D confinement (3D). The cortex-core structure consists of globular-shaped cells surrounded by cells extended radially outward. One such structure emerges in the 2D A pathway during Stage I. Credit: Savana Swoger.
Here, we will first take a step back from cortex foliation and address how is it that at times multiple cortex-core structures emerge, while in other cases, just one cortex-core structure emerges. Answering this question will give us insight into cortex-core formation. Then, we will characterize the foliation of the cortex with the “buckling without bending” morphogenesis (BWBM) model since it is already able to quantitatively capture cortical foliation in blebbistatin-treated brain organoids [11]. One, therefore, wonders whether or not such an approach is applicable in the untreated case.
To explore how brain organoids acquire their cortex-core structure, which we dub Stage I, and subsequent cortex foliation, or Stage II (see Figure 1), we build continuum models for each respective stage. We do so since once the cortex-core structure forms, that structure provides the basis for coarse-graining at a different scale to arrive at an extension of the BWBM model. As for Stage I, many cellular aggregates often demonstrate fluid-like behavior [19, 20], though viscoelasticity is also observed [21]. Given the cellular fluid-like behavior, an appropriate model falls under the hydrodynamics domain. At this point, it is tempting to go to a more detailed cellular-based model. However, we will take a less-detailed approach since it is not entirely clear if we can address the one versus many cortex-core structures within a detailed computational model at the outset, given the limitation of finite size.
Therefore, we seek a more minimal approach in which cell nuclei are particles. The cell nuclei interact with other cell nuclei indirectly via the surrounding active cytoplasm of, say, 2 cells, interacting with each other via their cortical tension, which ultimately drives the cell-cell interaction. Cell nuclei also interact indirectly with their extracellular surroundings. In other words, there is an effective, active force on cell nuclei due to cell-cell interactions an effective, active force on cell nuclei due to the extracellular environment. Specifically, since cell nuclei are observed to move toward each other during what is called the linear regime, we will assume that there is an initial, effective, short-range attraction between cell nuclei. As the organoid evolves, given the dynamic and mechanosensitive nature of the active, cytoskeleton generating forces, we use several observations from experiments to determine the emergent form of the effective, active force on cell nuclei due to cell-cell and cell-environment interactions during the non-linear regime. From the emergent form of the effective, active force we will infer cortex-core structures. We will use hydrodynamic equations to describe both regimes, which will correspond to a linear regime and a non-linear regime.
Once cortex-core structures emerge, such individual structures provide the basis for the BWBM model in which cellular growth plays a key role. The BWBM model consists of an incompressible core with a growing cortex and several other mechanical aspects of the brain organoid structure, namely, the mechanics of the surrounding Matrigel and cortical cells under tension. An initial, linear version of the BWBM model provided a physical basis for the unusual cortical thickness variations in blebbistatin-treated brain organoids—variations that cannot be readily explained by a purely elastic model. In addition, the foliations were less scalloped in the blebbistatin-treated case as compared to the untreated case, and so a linear BWBM model, with its symmetric foliations was reasonable. Indeed, blebbistatin inhibits myosin-II, and so the intra-cellular tension in cells making up both the cortex and the core decreases [16]. At higher tensions, nonlinearities in tension are more likely to become relevant, which is what we explore here. For context, recent work has been done to take into account nonlinearity in tension in radial glial cells in the developing cerebellum [22], which are not present in the confined brain organoids at the relevant time scales. We will explore a different form of nonlinearity here.
This paper is organized as follows. In Section 2, we uncover a physical mechanism for cortex-core structure formation (Stage I). In Section 3, we quantify how foliations/folds in the cortex emerge. We conclude with implications of our findings in Section 4.
2 Stage I: Cortex-Core Formation
Assuming that the brain organoid begins as an aggregate of fluid-like cells, let us begin with the dynamical equation for the one-body distribution function for cell nuclei given by
where C incorporates dissipation, cell division, and fluctuations [23]. We treat the interaction between cell nuclei as mediated by the surrounding cytoskeletons associated with two attached cells, for instance, as an effective force on a cell nucleus. A surrounding cytoskeleton interacting with the extracellular environment also leads to an effective force on cell nuclei. In other words, even though nuclei do not interact directly, they interact indirectly via their respective, surrounding cytoskeletons.
As for how the effective force between cell nuclei is generated, a significant player is the contractile nature of the actomyosin cortex with cells fusing when in a fluid phase [24, 25]. This phenomenon points to an effective, attractive interaction between cell nuclei that is short range in the sense that the interaction involves cells in contact. There are also effective interactions between the cell nuclei and their passive environment as mediated by the cell cytoskeleton [26]. Therefore, we approximate both cell-cell and cell-environment interactions as an effective force such that
We split Stage I into linear and non-linear eras. Since cell nuclei density fluctuation are low initially, Eq. 1 is linear. We will show that the magnitude and the form of the effective force do not change the resulting structures’ shape. As soon as cell nuclei density fluctuations increase, the equation becomes non-linear and the exact form of the effective force becomes relevant. We will assume that the form of the effective force can change with time as it is generated by a dynamic cytoskeleton. Given certain observations from experiments in the non-linear era, we will extract the effective force from Eq. 1. The spatial patterning of cell nuclei then emerges from the combination of 1) a robust evolution equation and 2) observation, and is rooted in the effective force that we derive. Specifically, we show that at the beginning of the non-linear era, the effective force between cell nuclei is attractive. However, toward the end of Stage I, the effective force changes in nature and becomes almost neutral at the center and repulsive beyond some characteristic radius of the spherical structures.
Let us now work towards a solution for Eq. 1. Since cell nuclei are roughly round shape in Stage I of brain organoid formation, we neglect their inherent structure and assumed that phase-space consists of positions and velocities only. Solving Eq. 1 analytically can be challenging. The more conventional approach is to solve its first two moments of velocities leading to two differential equations coupling the number density ρ ≡∫dv f, the bulk velocity
where C0 ≡∫dv C accounts for cell division and the noise, and Cj ≡∫dv C vj accounts for dissipation and noise. Since the number density experiences minimal growth in the first 3 days of the experiment until the cortex-core structures are first observed [16], we assume C0 only accounts for the noise. We also assume that the noise terms obey
with
where θ and γ determine the strength of each type of noise. For effects of dissipation, see Supplementary Appendix SA.
Given the coupled, non-linear equations above, we will divide the brain organoid evolution into linear and non-linear regimes by solving the linearized form to find the initial conditions for the non-linear evolution. However, in the non-linear regime, instead of deriving density growth in terms of the forces, we use the exact form of the differential equations, and the observations, to derive the evolution of the effective forces on the cell nuclei as they may change over time.
The linear era is valid for any magnitude of nuclear density. It is the smallness of the density fluctuations with respect to the mean background density that merits the linear stage. In this case, we can write ρ(x) = ρ0 (1 + δρ(x)/ρ0) with δρ(x) ≪ ρ0. Hence, we can expand Eq. 2 around ρ0 and neglect the higher orders of δρ(x)/ρ0. Therefore, the linear version of Eq. 2 sufficiently describes the evolution of the system until δρ(x) becomes comparable in value with ρ0, which will be the beginning of the non-linear era.
It is possible to experimentally determine whether the era is linear or non-linear. Practically, one can measure the cell nuclear density, ρ(x). For this, we use the data-driven method developed in Ref. [23], for example. The mean of the measured densities is the background density by definition,
2.1 Stage I Linear Regime
We assume that the number density is initially homogeneous with some small fluctuations, or ρ ≡ ρ0 + δρ, with δρ ≪ ρ0. Inserting this ansatz into Eq. 2, neglecting higher order terms, and Fourier transforming, we find
with
where the Fourier transform of gj is assumed to have the following general form
To model the very initial overdensities, we assume that at t = 0 there exist N point-like random fluctuations in the density such that
where
Inserting all terms back into Eq. 5, the final solution for the time-evolved number density in the linear regime reads
While we do not know the exact form of the initial, effective force between cell nuclei, from observation, it is effectively short-range and contractile. So we write
where
Since we are interested in δρ/ρ0 rather than the absolute value of the densities, we choose ρ0 = 1 in the rest of the paper so that all of the reported densities are in units of ρ0. Also, we set σ2 = 0.1, l1 = 1, and b1 = 0.1 to carry out the calculations. The l1 parameter can be absorbed in the rest of parameters and its value is not relevant here. The value for σ2, the cell nuclear pressure, has been inferred from data, as stated earlier. Finally, b1 determines the range of the force and, therefore, sets the size of the formed structure. As
The density evolution for different time points is plotted in Figure 2. Small over-density and under-density regions grow under the contractile forces of the cells and create cortex-core seeds for the non-linear regime. Therefore, we predict that the difference between pathways “2D A” and “2D B” in Figure 1 is set by the initial cell nuclear density distributions, namely, its fluctuations. We also have repeated the calculations for
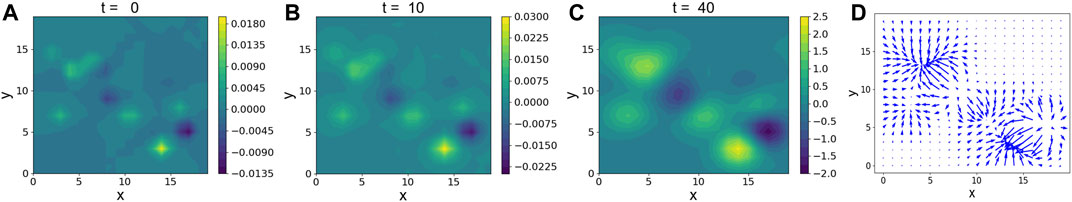
FIGURE 2. (A–C): The time evolution of δρ for
2.2 Stage I Non-Linear Regime
At the end of the linear era, the cell nuclei around each existing over-dense region start to migrate toward a center. However, unlike in the linear regime, results may indeed depend on the details of the net, effective force on cell nuclei. Given the dynamic nature of the cytoskeleton mediating the effective force, combined with the existence of experimental data, we adjust our approach and use a data-driven approach to derive the effective force on nuclei using our knowledge of density evolution from observations. Our prediction for the emergent, effective force can be tested with additional experiments.
We now focus on one of the over-dense centers and assume a spherical symmetric structure with ρ ≃ ρ0, ∂tρ ≃ 0,
where we have used the isotropic assumption to infer that in the spherical coordinate system
We use the first equation to solve for the bulk velocity in terms of the number density and then make the following assumptions for the final state of what becomes the cortex-core structure: ρ → F(r), where F(r) is the form of the number density observed around Day 3 of the experiment (see Supplementary Figure SA3), and
With these assumptions, the time evolution for
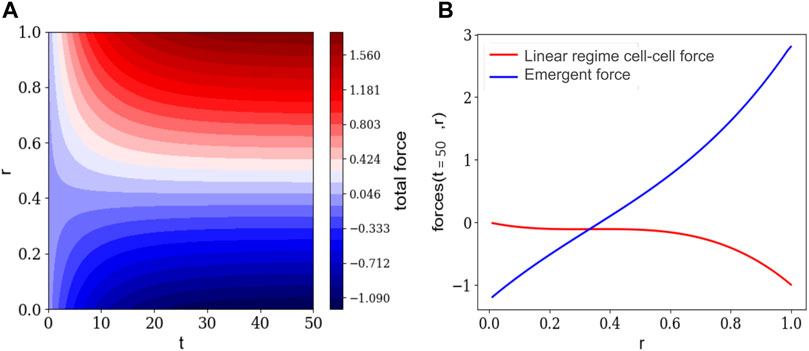
FIGURE 3. (A) The time evolution of the net force on the cell nuclei as a function of the radius of one cortex-core structure. (B) The emergent net force on cell nuclei at the final time and the initial net, attractive force between 2 cell nuclei used in the linear regime, both as functions of the radius of one cortex-core structure.
Subtracting from the net force the assumed short-range, attractive interaction between cell-nuclei invoked in the linear regime, we find a new effective force that emerges during the non-linear regime. See Figure 3. This emergent force is attractive close to the center and repulsive around the edge. Since it is attractive near the center, the density of cell nuclei is higher than near the edge. The location in r at which the emergent net force". on cell nuclei goes from attractive to repulsive is where we anticipate the boundary of the cortex-core to be. If one were to invoke a Voronoi tessellation of the cell nuclei to obtain cell shapes [28, 29], then the cell shapes across this boundary would be elongated radially. We interpret the elongation of the cells in this region as an indirect indication of this effective repulsive force. We anticipate that some forms of subcellular structures have been created by the cytoskeleton of the cells as they interact with the extracellular environment via focal adhesions. These emergent structures may provide a mechanism for altering the active force mediating the interaction between cell nuclei. Our work explores the interplay between cell-cell and cell-extracellular environment interactions in the continuum limit.
Given our continuum analysis, we cannot determine whether or not the cortex is 1 cell layer thick or many cell layers thick. Should the cortex be many cell layers thick, then the cells farther away from the boundary will not necessarily be elongated. In any event, it turns out that the cortex is 1 cell layer thick, approximately. The mechanism for this phenomenon must be explored with a more detailed, cellular-based model. With a Voronoi tessellation, the positions of the cell nuclei are the positions of the center of mass of a deformable cell nuclei. If cells are elongated just beyond the zero-net force boundary, then cell nuclei are as well since cell nuclei shape reflect cell shape [30]. We, thus, infer the formation of a cortex-core structure, though, again, the overall thickness of the cortex has yet to be determined. We use the term “large-scale” to denote that it is a multi-cellular structure. In the case of multiple cortex-core structures, supracellular actomyosin cabling [31] may act as an “external” environment such that multiple cortex-core structure can form simultaneously. Finally, for both the linear and non-linear regimes, the cell nuclei densities were not large enough to consider overlaps between cell nuclei, or even shorter-range repulsive interactions.
2.3 Connections With Cosmology
Intriguingly, Stage I vantage point draws parallels with cosmological models of large-scale structure formation in our Universe at the quantitative level. Both systems have the same dynamical equation for the single-particle distribution function. Moreover, the initial states of both systems are very similar; both systems start from an initially uniform number density of particles and end in spherical shape structures. This is despite the differences such as different types of interactions, as well as the presence of growth, dissipation, and noise, for example, for living matter.
For a point of reference, here is a brief overview from the cosmology side. In the early Universe, quantum fluctuations induce negligible mass overdensities that grow over time, by attracting nearby mass, to ultimately form galaxies [32–34]. Otherwise, despite the attractive nature of gravity, an exactly uniform Universe will stay uniform forever. Moreover, in cosmology, to study large-scale structure formation, one constructs a dynamical equation for the time evolution of matter as encoded by the one-body distribution function, f, in the six-dimensional phase space of positions and velocities. See, for example, the Boltzmann equation [35] and the Jeans equation (36). In the Jeans equation in cosmology,
Despite the similarities, there are fundamental differences between the evolution in the Universe and the evolution of the cells in brain organoids. In the Universe, it is the gravitational force that drives the dynamics. In brain organoids, we do not yet have a thorough quantification of the underlying forces at play. As our study suggests, the nature of the forces vary over time. The lack of detail as to the underlying forces proves irrelevant in the linear era. Therefore, we follow the same approach as in the linear era in the evolution model of the Universe. However, in the non-linear era, the evolution depends on the exact form of the force. Hence, unlike in cosmology, we change the question in the non-linear era of brain organoid evolution and ask given the observation of the evolution in cell nuclear density, what is the form of the collective, effective force as a function of the distance from the center of the cortex-core structure?
3 Stage II: Foliation Formation
Now that cortex-core structures form, we proceed to the subsequent foliation of the cortex observed in the “2D A” pathway. To do so, we turn to the BWBM model, which is a coarse-grained, continuum model at a larger scale to accommodate the predominance of cell growth at this stage. The initial version of the BWBM model assumes a cortex-core structure and has demonstrated qualitative agreement with the foliation found in the quasi-two-dimensional brain organoids in pathway “2D A” with the addition of blebbistatin [11]. A new nonlinearity, as we will show, extends the applicability of the model to the untreated case.
More precisely, we model the growing cortex-core structure as a two-dimensional annulus-like region having outer radius r and thickness τ, which are scalar functions of an angular coordinate θ such that τ is measured in the radial direction (see Figure 4). We also assume that r and τ are single-valued, i.e., no overhangs. We then introduce the quasi-static, coarse-grained energy functional
to be minimized subject to a constraint on the area of the core, i.e.,
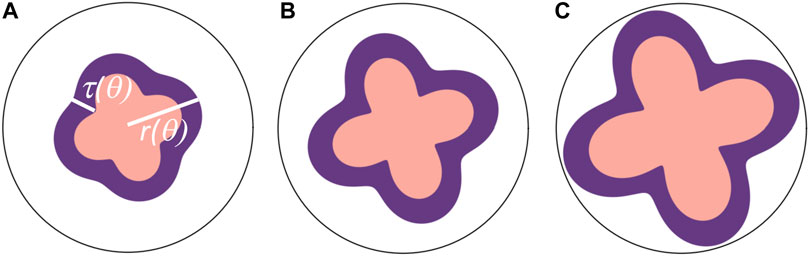
FIGURE 4. BWBM model for the foliation of wild-type brain organoids pathway 2D A as time increases to the right. Parameters used are kτ/β = 15.6, τ0/r0 = 0.7, λ r0 = 25 for (A–C) and for (A) μ/kr = 0.72, kr/kτ = 0.043, for (B) μ/kr = 0.855, kr/kτ = 0.036, for (C) μ/kr = 0.9, kr/kτ = 0.034.
Shape change as a function of time, here, is encoded in changes in the constants at hand. Addressing Eq. 12, kr, kτ, and β are all positive constants. The first term encodes a preferred radius r0, which we assume to be constant. This preferred shape represents the energy cost in deforming the Matrigel, or the extracellular environment, so kr represents a modulus. The second term favors thickening of the cortex with respect to a reference thickness τ0, which we also assume to be constant, given its negative contribution, and kτ can be regarded as a “growth potential” in the form of an anti-harmonic term. With this construction, the validity domain of this analysis is only limited to those cases in which the thicknesses are small as compared to the size of the structure, i.e., the energy functional remains bounded. Finally, the third term penalizes spatial variations in thickness in θ with both linear (β) and nonlinear contributions (λ) representing the active, adaptive contractile nature of the cells. More specifically, as cortex cells are elongated, they build cytoskeletal structures to adapt to the extension with the development of stress fibers, for example, to regulate their strain and, therefore, resist the extension [37]. We note that the λ = 0 case has been studied previously [11] as was discussed in the context of blebbistatin-treated brain organoids. This treatment presumably inhibits the nonlinear response of the cells to larger deformations in terms of the functionality of stress fibers [37]. We note that another form of nonlinearity has been studied in the context of nonlinear elasticity of the radial glial cells spanning the cerebellum [22]. Here, there are no such radial glial cells, at least during these early stages.
The three terms in the coarse-grained energy functional above compete with one another due to the incompressibility of the core, thereby driving the system away from its preferred shape. We assume the initial cortex-core preferred shape to be a circle with radius r0. To quantify the resulting shape as a result of the interplay, the Euler-Lagrange equations result in an unconventionally driven, nonlinear oscillator equation. Specifically, the Euler-Lagrange equation for τ(θ) is of the form
with
As with Stage I, we work with dimensionless parameters by dividing the coarse-grained energy functional by kr to reduce the now five (with λ) parameters to four. In the λ = 0 case, two of the three dimensionless parameters are constrained by the shape of the developing cortex-core structure. The dimensionless parameter ϵμ/kr is constrained by the ratio of the amplitude of the radial oscillations to the amplitude of the cortical thickness oscillations as both r and τ are solutions to driven oscillators [11]. Moreover, the number of observed invaginations constrains kτ/β, which is a product of (kτ/kr) (kr/β). This leaves us with one free parameter. When this model was applied to the developing cerebellum, several predictions were made, namely, that ϵ is not constant as the structure develops, that the cortical thickness variations have a specific relationship to the radial (outer) variations, and that the number of folds/foliations does not depend on the overall size nor initial cortical thicknesses but on the material properties, which is something observed in cerebella across many mammalian species of different sizes and initial cortical thicknesses [11]. Here, we have one more parameter, namely λ to ultimately constrain. Even though we have not constrained all of the parameters independently with data for this system, we can still make some predictions, which we focus on now.
The results for the subsequent brain organoid evolution are plotted in Figure 4A–C for different krs, which decreases with time as the Matrigel softens due to compression [38]. We see that the model predicts the emergence of folds/foliations using similar parameters to those used previously for the blebbistatin-treated brain organoids [11]. We also observe that the cortex is thicker near the troughs as compared to the crests at the onset of the foliation. See Figure 4A. This prediction can be explored in experiments as has been done for the developing cerebellum. In contrast to the linear version, we observe for the nonlinear case an asymmetry developing between the crest (the gyri) and the trough (the sulci) to approach a more scalloped form prominent in the untreated brain organoids. To more clearly demonstrate the differences between the linear BWBM model and this nonlinear version, we present shapes for both cases in Figure 5. On the other hand, the scallops are not as packed tightly together as observed in the experiments. Interestingly, a recent nonlinear extension of the BWBM model also demonstrated more scalloped foliation with a nonlinearity introduced in kr to account for the nonlinear elasticity of the radial glial cells [22]. Another interesting feature of the BWBM model is that once the first generation of foliations/folds appear, we anticipate the potential for subsequent generations to occur as the boundaries of the first generation foliation create a sub-system within the overall structure such that foliation process can occur within the sub-system, given the number of foliations is essentially scale-invariant [11, 22, 39]. In fact, this type of higher-order branching process is observed in brain organoid experiments [16] and in the developing, approximately cylindrical cerebellum [40].
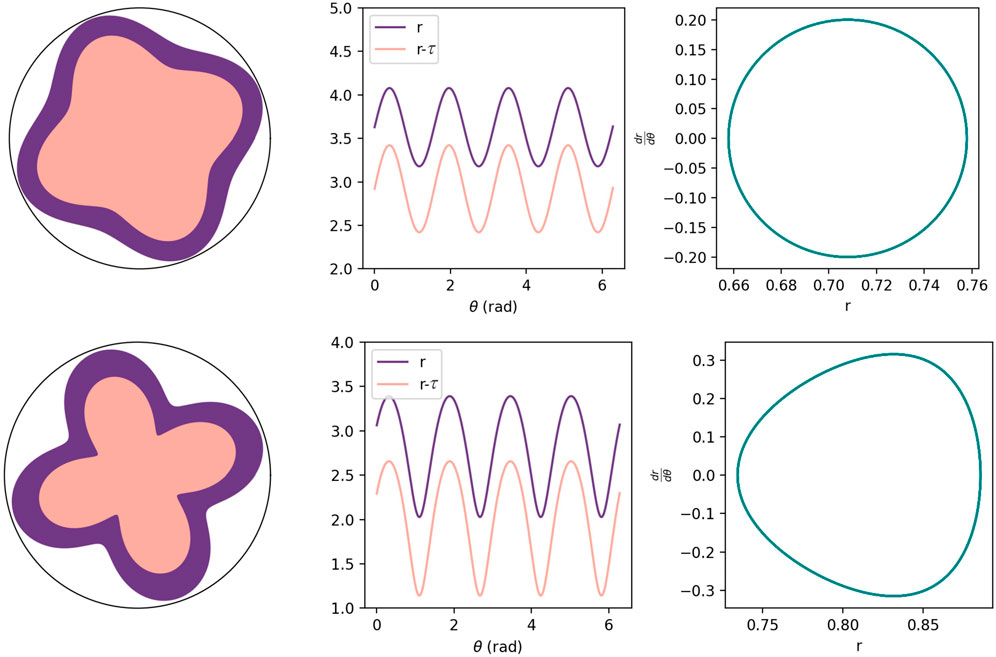
FIGURE 5. Top row: Results for the linear version of the BWBM model, or λ r0 = 0, with other parameters the same as in Figure 4C. Bottom row: Results for the nonlinear version of the BWBM model with λ r0 = 25 for the first term in the perturbation expansion for the τ-dependent mass term and with other parameters the same as in Figure 4C.
Finally, there are limitations to the buckling without bending model. In particular, the model is coarse-grained such that we lose information at the cellular scale. We are currently working towards a cellular-based model that will link the two scales—the cell scale and the tissue scale—to test the buckling without bending model using computer-generated data at the cell scale. Moreover, cell-to-cell variations may lead to a disordered version of the buckling without bending model in which the parameters now represent averages.
4 Discussion
We have established a two-part framework to quantify the shape of brain organoids as they develop. Both parts are rooted in the assumption that the material is not purely elastic. Indeed, tissue fluidity has emerged as a driver of shape change in animal development more generally [41, 42]. The first part of the framework models the interactions between cell nuclei due to activity to examine how multiple, large-scale core-cortex structures emerge in the confined case. If we know the initial density map of cell nuclei, we can predict the number and size of the cortex-core structures. With this nonlinear form of the buckling without bending model, we have a shape-change mechanism that predicts the anti-symmetric shape of the foliation of an individual cortex-core structure as well as how the cortical thickness varies along the edge of the system. These predictions can also be tested.
While Stage II of the “2D B” pathway was reported in the literature [16], it is not clear if such multi-core-cortex structures exhibit Stage II behavior. Considering just two-core-cortex structures with a very small interface in between initially, then each cortex-core structure evolves independently of each other until the interface increases due to the growth. Earlier work has shown that the linear BWBM model in the presence of a confining wall flattens the scallops [22]. Treating each structure as a confining presence of the other, will thus, flatten the scallops and so one may observe some foliation with different shapes along the interface between the two structures as compared to the interface with Matrigel. However, should the interface between the two structures not be small to begin with, then one must also treat the two core-cortex structures as a coupled system with the spherical symmetry now broken. We are currently extending the BWBM model to describe multiple-cortex-core structures with interfaces in between, suggesting that the extent of the foliation will depend on such details as the difference in growth potentials between the two structures, etc.
While we have focused here on the structure of quasi-two-dimensional brain organoids, three-dimensional brain organoid shapes typically consist of multiple large-scale structures [14]. These large-scale, or multi-cellular structures are cortex-lumen/hole structures embedded within non-cortical/non-extended cells. Our framework for Stage I applies under these conditions as well. Variations in cell nuclear density, as well as variations in contractility of the cells, determine where the large-scale structures emerge. Regions, where the cellular contractility is less than the average, translate to cellular material effectively acting as a passive, or extracellular, environment. The regions of underdensity, as before, translate to an effective repulsive force to push cells apart. The more the cells move apart, the more likely ruptures will occur at the cell-cell interface to create a lumen or hole. The shape of such holes depends on the shape of the regions of less active cells to which the more active cells are pulled towards. Predicting the detailed shape of these large-scale structures, therefore, requires some modeling at the cell-cell interface level to pinpoint the rupture locations, which we do not address here. Recent work interpolating between confluent and non-confluent tissue, thereby identifying points of rupture, may help [43]. In the confined case, perhaps stronger interaction with the passive environment prevents such rupture. However, our work suggests that an essentially homogenous organoid with an underdensity region in the center of a spherical organoid leads to one cortex-lumen structure embedded in a sea of cells with a purely repulsive emergent force. See Figure 6.
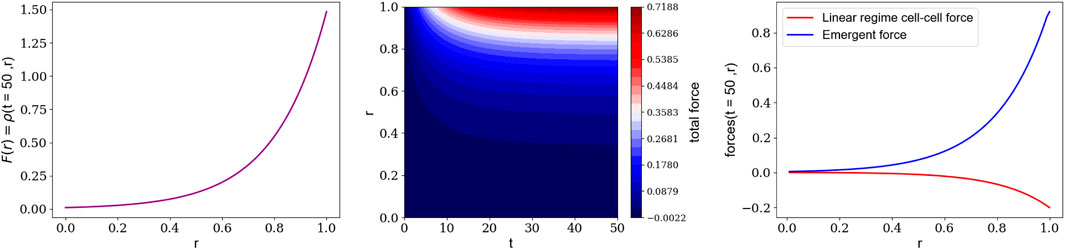
FIGURE 6. In three dimensions, brain organoids have a hole, or lumen, at the center of large-scale/multi-cellular structure and the cell nuclei are all in the outer cortex region (Left): The number density of cell nuclei at the end of the nonlinear era, assuming a hole in the center of the cortex-lumen structure (Middle): The time evolution of the net force on cell nuclei for a cortex-lumen structure (Right): The initial, net attractive force on cell nuclei (red) due to cell-cell interactions and the emergent, net force (blue) as the cytoskeleton restructures itself, using the assumed cell nuclei number density.
If we are to understand how the brain attains its shape, brain organoids serve as an excellent in vitro platform. While brain organoids do not currently mimic brain shape, one can now design conditions in which higher-order foliations/folds are more likely to occur in the confined case to more closely resemble the cerebellum. Moreover, a three-dimensional brain organoid with one cortex-lumen structure can potentially be engineered in which the cortex is layered by the addition of cells at the cell-cell rupture site in such a way that they also become extended. Therefore, one can create more similar shapes to the mammalian brain or even less similar to study how brain shape affects brain function. For instance, the honeybee brain has a rather different structure than a mammalian brain [44]. Moreover, at the heart of subsequent brain development is the existence of elongated cells that serve as a backbone for the initiation of neurons, cells unique to the central nervous system, which, therefore, requires more modeling attention.
Data Availability Statement
The original contributions presented in the study are included in the article/Supplementary Material, further inquiries can be directed to the corresponding authors.
Author Contributions
All authors listed have made a substantial, direct, and intellectual contribution to the work and approved it for publication.
Conflict of Interest
The authors declare that the research was conducted in the absence of any commercial or financial relationships that could be construed as a potential conflict of interest.
Publisher’s Note
All claims expressed in this article are solely those of the authors and do not necessarily represent those of their affiliated organizations, or those of the publisher, the editors and the reviewers. Any product that may be evaluated in this article, or claim that may be made by its manufacturer, is not guaranteed or endorsed by the publisher.
Acknowledgments
JS acknowledges Mahesh Gandikota and Orly Reiner for discussions and finanical support from grant NSF-DMR-1832002 and an Isaac Newton Award from the DoD.
Supplementary Material
The Supplementary Material for this article can be found online at: https://www.frontiersin.org/articles/10.3389/fphy.2022.837600/full#supplementary-material
References
2. Richman DP, Stewart RM, Hutchinson J, Caviness VS. Mechanical Model of Brain Convolutional Development. Science (1975) 189:18–21. doi:10.1126/science.1135626
3. Essen DCV. A Tension-Based Theory of Morphogenesis and Compact Wiring in the central Nervous System. Nature (1997) 385:313–8. doi:10.1038/385313a0
4. Bayly PV, Okamoto RJ, Xu G, Shi Y, Taber LA. A Cortical Folding Model Incorporating Stress-dependent Growth Explains Gyral Wavelengths and Stress Patterns in the Developing Brain. Phys Biol (2013) 10:016005. doi:10.1088/1478-3975/10/1/016005
5. Manyuhina OV, Mayett D, Schwarz JM. Elastic Instabilities in a Layered Cerebral Cortex: a Revised Axonal Tension Model for Cortex Folding. New J Phys (2014) 16:123058. doi:10.1088/1367-2630/16/12/123058
6. Budday S, Steinmann P, Kuhl E. Physical Biology of Human Brain Development. Front Cel Neurosci. (2015) 9:257. doi:10.3389/fncel.2015.00257
7. Mota B, Herculano-Houzel S. Cortical Folding Scales Universally with Surface Area and Thickness, Not Number of Neurons. Science (2015) 349:74–7. doi:10.1126/science.aaa9101
8. Tallinen T, Chung JY, Rousseau F, Girard N, Lefèvre J, Mahadevan L. On the Growth and Form of Cortical Convolutions. Nat Phys (2016) 12:588–93. doi:10.1038/nphys3632
9. Lejeune E, Javili A, Weickenmeier J, Kuhl E, Linder C. Tri-layer Wrinkling as a Mechanism for Anchoring center Initiation in the Developing Cerebellum. Soft Matter (2016) 12:5613–20. doi:10.1039/c6sm00526h
10. Lejeune E, Dortdivanlioglu B, Kuhl E, Linder C. Understanding the Mechanical Link between Oriented Cell Division and Cerebellar Morphogenesis. Soft Matter (2019) 15:2204–15. doi:10.1039/c8sm02231c
11. Engstrom TA, Zhang T, Lawton AK, Joyner AL, Schwarz JM. Buckling without Bending: a New Paradigm in Morphogenesis. Phys Rev X (2018) 8:041053. doi:10.1103/PhysRevX.8.041053
12. Lawton AK, Engstrom T, Rohrbach D, Omura M, Turnbull DH, Mamou J, et al. Cerebellar Folding Is Initiated by Mechanical Constraints on a Fluid-like Layer without a Cellular Pre-pattern. Elife (2019) 8:e45019. doi:10.7554/eLife.45019
13. Xu G, Knutsen AK, Dikranian K, Kroenke CD, Bayly PV, Taber LA. Axons Pull on the Brain, but Tension Does Not Drive Cortical Folding. J Biomech Eng (2010) 132:071013. doi:10.1115/1.4001683
14. Lancaster MA, Renner M, Martin C-A, Wenzel D, Bicknell LS, Hurles ME, et al. Cerebral Organoids Model Human Brain Development and Microcephaly. Nature (2013) 501:373–9. doi:10.1038/nature12517
15. Benito-Kwiecinski S, Giandomenico SL, Sutcliffe M, Riis ES, Freire-Pritchett P, Kelava I, et al. An Early Cell Shape Transition Drives Evolutionary Expansion of the Human Forebrain. Cell (2021) 184:2084–102. doi:10.1016/j.cell.2021.02.050
16. Karzbrun E, Kshirsagar A, Cohen SR, Hanna JH, Reiner O. Human Brain Organoids on a Chip Reveal the Physics of Folding. Nat Phys (2018) 14:515–22. doi:10.1038/s41567-018-0046-7
17. Velasco S, Kedaigle AJ, Simmons SK, Nash A, Rocha M, Quadrato G, et al. Individual Brain Organoids Reproducibly Form Cell Diversity of the Human Cerebral Cortex. Nature (2019) 570:523–7. doi:10.1038/s41586-019-1289-x
18. Trujillo CA, Gao R, Negraes PD, Gu J, Buchanan J, Preissl S, et al. Complex Oscillatory Waves Emerging from Cortical Organoids Model Early Human Brain Network Development. Cell Stem Cell (2019) 25:558–69. doi:10.1016/j.stem.2019.08.002
19. Beaune G, Stirbat TV, Khalifat N, Cochet-Escartin O, Garcia S, Gurchenkov VV, et al. How Cells Flow in the Spreading of Cellular Aggregates. Proc Natl Acad Sci (2014) 111:8055–60. https://www.pnas.org/content/111/22/8055.full.pdf. doi:10.1073/pnas.1323788111
20. Stirbat TV, Mgharbel A, Bodennec S, Ferri K, Mertani HC, Rieu J-P, et al. Fine Tuning of Tissues' Viscosity and Surface Tension through Contractility Suggests a New Role for α-Catenin. PloS one (2013) 8:e52554. doi:10.1371/journal.pone.0052554
21. Guevorkian K, Colbert M-J, Durth M, Dufour S, Brochard-Wyart F. Aspiration of Biological Viscoelastic Drops. Phys Rev Lett (2010) 104:218101. doi:10.1103/physrevlett.104.218101
22. Gandikota MC, Schwarz JM. Buckling without Bending Morphogenesis: Nonlinearities, Spatial Confinement, and Branching Hierarchies. New J Phys (2021) 23:063060. doi:10.1088/1367-2630/ac03ce
23. Borzou A, Patteson AE, Schwarz JM. A Data-Driven Statistical Description for the Hydrodynamics of Active Matter (2021). arXiv e-prints, arXiv:2103.03461. arXiv:2103.03461 [cond-mat.soft].
24. Martin GR, Evans MJ. Differentiation of Clonal Lines of Teratocarcinoma Cells: Formation of Embryoid Bodies In Vitro. Proc Natl Acad Sci (1975) 72:1441–5. doi:10.1073/pnas.72.4.1441
25. Murrell M, Oakes PW, Lenz M, Gardel ML. Forcing Cells into Shape: the Mechanics of Actomyosin Contractility. Nat Rev Mol Cel Biol. (2015) 16:486–98. doi:10.1038/nrm4012
26. Humphrey JD, Dufresne ER, Schwartz MA. Mechanotransduction and Extracellular Matrix Homeostasis. Nat Rev Mol Cel Biol. (2014) 15:802–12. doi:10.1038/nrm3896
27. Kramers HA. Brownian motion in a field of force and the diffusion model of chemical reactions. Physica (1940) 7(4):284–304. doi:10.1016/S0031-8914(40)90098-2
28. Honda H. Description of Cellular Patterns by Dirichlet Domains: the Two-Dimensional Case. J Theor Biol (1978) 72:523–43. doi:10.1016/0022-5193(78)90315-6
29. Kaliman S, Jayachandran C, Rehfeldt F, Smith A-S. Limits of Applicability of the Voronoi Tessellation Determined by Centers of Cell Nuclei to Epithelium Morphology. Front Physiol (2016) 7:551. doi:10.3389/fphys.2016.00551
30. Versaevel M, Grevesse T, Gabriele S. Spatial Coordination between Cell and Nuclear Shape within Micropatterned Endothelial Cells. Nat Commun (2012) 3:671. doi:10.1038/ncomms1668
31. Yevick HG, Miller PW, Dunkel J, Martin AC. Structural Redundancy in Supracellular Actomyosin Networks Enables Robust Tissue Folding. Develop Cel (2019) 50:586–98. doi:10.1016/j.devcel.2019.06.015
32. Guth AH, Pi S-Y. Fluctuations in the New Inflationary Universe. Phys Rev Lett (1982) 49:1110–3. doi:10.1103/physrevlett.49.1110
33. Starobinsky AA. Dynamics of Phase Transition in the New Inflationary Universe Scenario and Generation of Perturbations. Phys Lett B (1982) 117:175–8. doi:10.1016/0370-2693(82)90541-x
34. Hawking SW. The Development of Irregularities in a Single Bubble Inflationary Universe. Phys Lett B (1982) 115:295–7. doi:10.1016/0370-2693(82)90373-2
35. Steinhardt P, Mukhanov V, Mukhanov V, Linde A, Press CU, Viatcheslav M. Physical Foundations of Cosmology, Physical Foundations of Cosmology. Cambridge, United Kingdom: Cambridge University Press (2005).
36. Binney J, Tremaine S. Galactic Dynamics. 2nd ed.. Princeton: Princeton University Press (2008). Princeton Series in Astrophysics.
37. Greiner AM, Chen H, Spatz JP, Kemkemer R. Cyclic Tensile Strain Controls Cell Shape and Directs Actin Stress Fiber Formation and Focal Adhesion Alignment in Spreading Cells. PLoS ONE (2013) 8:e77328. doi:10.1371/journal.pone.0077328
38. Van Oosten ASG, Vahabi M, Licup AJ, Sharma A, Galie PA, MacKintosh FC, et al. Uncoupling Shear and Uniaxial Elastic Moduli of Semiflexible Biopolymer Networks: Compression-Softening and Stretch-Stiffening. Sci Rep (2016) 6:19270. doi:10.1038/srep19270
39. Larsell O. The Comparative Anatomy and Histology of the Cerebellum. Minneapolis: University of Minnesota Press (1967).
40. Sudarov A, Joyner AL. Cerebellum Morphogenesis: the Foliation Pattern Is Orchestrated by Multi-Cellular Anchoring Centers. Neural Dev (2007) 2:26. doi:10.1186/1749-8104-2-26
41. Mongera A, Rowghanian P, Gustafson HJ, Shelton E, Kealhofer DA, Carn EK, et al. A Fluid-To-Solid Jamming Transition Underlies Vertebrate Body axis Elongation. Nature (2018) 561:401–5. doi:10.1038/s41586-018-0479-2
42. Jain A, Ulman V, Mukherjee A, Prakash M, Cuenca MB, Pimpale LG, et al. Regionalized Tissue Fluidization Is Required for Epithelial gap Closure during Insect Gastrulation. Nat Commun (2020) 11:5604. doi:10.1038/s41467-020-19356-x
43. Kim S, Pochitaloff M, Stooke-Vaughan GA, Campàs O. Embryonic Tissues as Active Foams. Nat Phys (2021) 17:859–66. doi:10.1038/s41567-021-01215-1
Keywords: brain shape, brain organoid, hydrodynamics, buckling without bending, evolution of the universe
Citation: Borzou A and Schwarz JM (2022) Large-Scale Cortex-Core Structure Formation in Brain Organoids. Front. Phys. 10:837600. doi: 10.3389/fphy.2022.837600
Received: 16 December 2021; Accepted: 28 February 2022;
Published: 07 April 2022.
Edited by:
Jae-Hyung Jeon, Pohang University of Science and Technology, South KoreaReviewed by:
Dapeng Bi, Northeastern University, United StatesMatan Mussel, University of Haifa, Israel
Copyright © 2022 Borzou and Schwarz. This is an open-access article distributed under the terms of the Creative Commons Attribution License (CC BY). The use, distribution or reproduction in other forums is permitted, provided the original author(s) and the copyright owner(s) are credited and that the original publication in this journal is cited, in accordance with accepted academic practice. No use, distribution or reproduction is permitted which does not comply with these terms.
*Correspondence: Ahmad Borzou, aborzou@syr.edu; J. M. Schwarz, jmschw02@syr.edu