Using Curved Fluid Boundaries to Confine Active Nematic Flows
 Dimitrius A. Khaladj
  Linda S. Hirst*
- Department of Physics, University of California, Merced, Merced, CA, United States
Actively driven, bundled microtubule networks, powered by molecular motors have become a useful framework in which to study the dynamics of energy-driven defects, but achieving control of defect motions is still a challenging problem. In this paper, we present a method to confine active nematic fluid using wetting to curve a layer of oil over circular pillars. This geometry, in which submersed pillars impinge on an oil-water interface, creates a two-tier continuous active layer in which the material is confined above, and surrounds the pillars. Active flows above the pillars are influenced by the circular geometry and exhibit dynamics similar to those observed for active material confined by hard boundaries, e.g., inside circular wells. The thin oil layer beneath the active material is even thinner in the region above the pillars than outside their boundary, consequently producing an area of higher effective friction. Within the pillar region, active length scales and velocities are decreased, while defect densities increase relative to outside the pillar boundary. This new way to confine active flows opens further opportunities to control and organize topological defects and study their behavior in active systems.
Introduction
Active materials are typically composed of energy driven particles or elements that draw fuel from their local environment to produce mechanical forces that result in motion. These active elements can act collectively to produce emergent dynamics and out-of-equilibrium phase behavior. Micron-scale active materials range broadly from dilute colloidal solutions [1, 2], to more concentrated lyotropic systems with local organizational flows. Notable examples from the recent literature include bacterial suspensions [3–8] and systems assembled from cellular filaments [9–11]. The active nematic state formed from bundled microtubules with kinesin is a particularly interesting example of an active phase. This material exhibits active turbulence, a state in which the nematic fluid produces self-driven chaotic mixing characterized by the motion of positive and negative topological defects [12–15].
In an open system with no defined boundary conditions, topological defect motions in active nematic are intrinsically aperiodic [16]. However, if these self-driven active flows can be tamed to produce more predictable dynamics, a variety of applications in microfluidics may emerge. Confining active nematic flows to microfluidic devices may provide an appealing strategy to organize the material as different patterned geometries can be designed to produce specific flow dynamics and defect motions.
Patterned surfaces have been previously reported to organize material in passive liquid crystal systems. They provide a highly effective method to align and influence material in liquid crystal phase without the application of external fields or mechanical forces. The benefits of this technique are wide-ranging as simple geometries can enhance anisotropic effects within the material, or produce arrays of topological defects. For example, Honglawan et al [17] used patterned surfaces to produce arrays of smectic focal conic defects. Like passive liquid crystals, active materials based on rod-like subunits tend to align parallel to confining boundaries and surfaces. This phenomenon, known as planar alignment, can also be seen in range of biopolymer experiments, and is necessary for mathematical models that consider a physical boundary [15]. New developments in active nematics have focused on similar control of mobile topological defects, including recent work by our group [18]. In two striking examples, Hardoüin et al. [19] confined bundled microtubules to rectangular wells and Opathalage et al. [20] studied active flow dynamics in cylindrical wells. The active material confined within these geometries, aligns parallel to the hard boundaries, generating more ordered flows, spatially organizing the defects. If the active nematic is spatially confined, the geometry occupied (circular, rectangular, etc.) can alter the active dynamics significantly, producing distinct defect circulations and braids [18–21]. A variety of interesting effects have been identified where active particles or phases interact with boundaries and structures of different shapes [22]. More complex confinement geometries such as obstacle arrays [23], narrow channels [24] and obstacles [25] have also recently been explored computationally for self-driven particles.
Recently, our group demonstrated that discontinuities in the depth of the underlying fluid substrate (oil layer) can also produce confinement effects, using a submersed surface structure which is not in direct contact with the active fluid [26]. We showed that the viscosity of the underlying oil substrate plays a decisive role in nematic alignment and flow kinematics. The implication is, if the momentum of a material is not conserved between spatial regions, friction will promote planar anchoring between the interfaces of high and low friction. As reported in [26], friction generated from a submerged pattern creates activity gradients on the surface resulting in alignment at the boundary by varying the oil thickness [27–30]. This fascinating result demonstrates that the control of active flows is not limited to microfluidic systems using physical boundaries, but that control may also be achieved using a soft boundary created by effective frictional discontinuity induced by the oil sublayer.
The work presented in this paper continues the theme of soft confinement effects, by presenting proof of concept experiments that show how curvature in the active layer can induce localized confinement effects and thus control active flows. The examples we present use a circular pillar to create a ring of local curvature that controls active nematic dynamics in a similar fashion to cylindrical wells. We demonstrate a variety of phenomena induced by the confinement effect consistent with other confinement methods and quantify flow velocities and defect densities as a function of underlying oil thickness. Controlling active nematic flows with curvature is advantageous over hard-well based methods as continuity of the active layer is maintained and device-filling is trivial. This new technique adds a novel tool to the emerging suite of methods for control of active nematic flows.
Experiment
Our experiments make use of the now widely known active nematic system composed of microtubules and kinesin motors [12]. We form an active nematic at the interface of an oil layer and an aqueous layer but achieve curvature-based confinement using pillars designed to impinge on the underlying active interface (Figure 1). In this geometry the active material is continuous (i.e., not confined to a well) and it is free to move on top of the pillar from the surrounding open regions (Supplementary Video S1). To achieve this set-up, hydrophobic pillars are partially submerged in the oil layer. Oil wets the sides of the pillar and coats the top. Cohesive forces keep the surface of the oil layer intact across the top of the pillar maintaining a relatively flat shape. Once covered with the aqueous active layer, the presence of the pillar gently presses the oil layer upwards into the water interface enough to allow interfacial deformation to take place (Figure 1E). This geometry produces an elevated circular region around the pillar, similar in shape to a mountain butte.
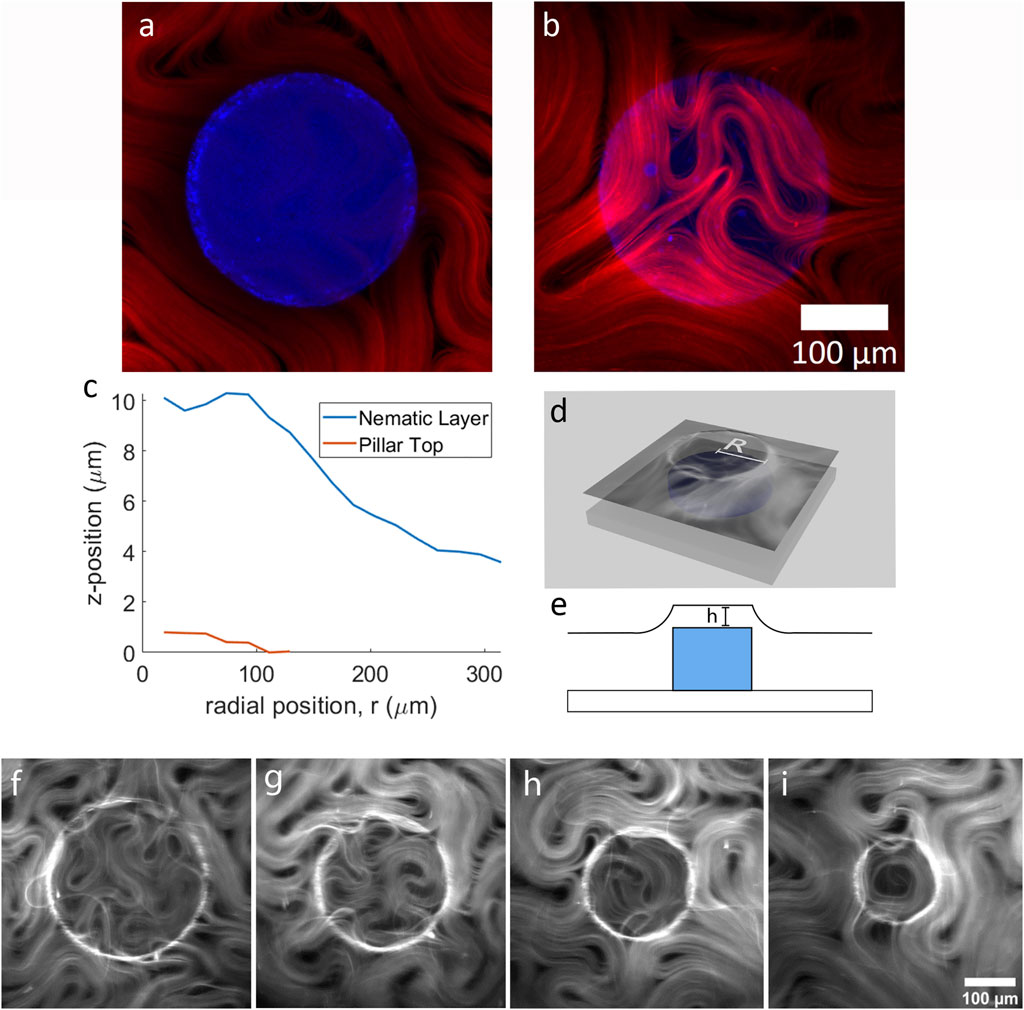
FIGURE 1. The two-tier active nematic system. (A) Two channel laser scanning confocal microscopy images showing a pillar (blue) overlayed with the active nematic layer (red) a z = 0 µm (the top of the pillar) and (B) z = 7.45 µm (above the pillar), (C) Graph demonstrating the curvature of the active layer by plotting the z-position of the active layer and the pillar top. (D) 3D illustration of the experimental setup and (E) illustration depicting the pillar and the curvature of the active fluid (F–I) show fluorescence microscopy images of active nematics with increasing confinement above pillars of varying diameter, (F) 300 µm (G) 250 μm, (H) 200 μm, and (I) 150 µm.
The oil/water interfacial curvature at the pillar boundary originates from the wetting effect that takes place at the oil-pillar interface if the pillars are tall enough to impinge onto the oil/water interface. If active material is to occupy the region above the pillar, there must be an intact oil layer covering the top of the pillar, thick enough to allow material to flow within the diameter, D of the circular boundary. If the oil is too thin or depleted, active material is unable to flow or form well defined defects.
To quantify the curvature of the active layer, we used confocal microscopy to obtain 3D reconstructions at the boundary of, and across the top of the submerged pillar. In Figures 1A,B, active material surrounding and above a pillar are shown overlaid with the pillar at two different focal planes. The active material follows the surface of the oil layer. Figure 1C plots the position of the active layer and pillar top relative to each other for the example shown in Figures 1A,B. Figures 1D,E show diagrams of the experimental set-up. To obtain the plot in Figure 1C, the fluorescence intensity of the active layer versus z-position is plotted from confocal z-stacks. Briefly, a series of concentric rings in the x-y plane is constructed of width dr = D/14. The total fluorescence intensity in each concentric ring is then plotted as a function of z. From this graph we can see the shape of the active layer as it covers the pillar (for detailed method see Supplementary Material). A ring of maximum curvature in the active layer is positioned approximately above the pillar circumference as depicted in Figure 1D. The active nematic devices were filled with active material as previously reported [18, 26] and during this process fluorescence imaging shows that the active nematic layer takes time to occupy the region on top of the pillar (Supplementary Video S2). After the area above the pillar top reaches confluence, we observe that a circular confinement effect impacts the nematic flow.
Figures 1F–I shows four different examples of active nematic layers confined on top of pillars of different sizes. In these images (and Supplementary Video S3), we can observe topological defects in the active layer moving as though trapped within the circular pillar top region. The confined material exhibits a reduction in bundle velocity and shorter active length-scales, consistent with results previously reported for activity above a thin oil layer [26]. The examples in the figure highlight the characteristic motions of material trapped in a circular well [20]. In Figure 1G a transient -1 topological defect (quatrefoil) can be observed. Figure 1H shows three +1/2 defects rotating about one −1/2 defect for a net defect charge of +1. In Figures 1A,I transient +1 defect with active material aligned along the inner boundary is shown.
It is important to emphasize that using this confinement method, we found that the material above the pillar is not 100% confined. Defects and bundles move between the pillar top and the surrounding regions occasionally, aided by the continuous connection between these two regions. Such soft confinement is similar in nature to the results reported by [26] where confinement is achieved using a submersed channel and also exhibits a finite defect escape rate.
Organization of the active material is enhanced with increasing confinement. For material on top of larger pillars (Figure 1F), circular flows do not tend to persist around the circumference, but as the pillar radius decreases, longer radial flows along the inner boundary can be observed. As the active material rotates about the inner boundary, defects tend to position themselves at the center of circular region, consistent with results reported by of Opathage et al. [20]. Figure 2 shows a time series of images highlighting this characteristic behavior. In Figure 2A a boundary nucleated defect can be observed forming and moving towards the center of the pillar. Active material collects at the boundary of the confining region and the +1/2 defects begin to spiral Figure 2B. In Figure 2C the two +1/2 defects spiral in unison allowing them to merge while slowing being pushed towards the center, ultimately forming a +1 defect as represented in Figure 2D. The +1 defect performs a transient circular flow and eventually pinches off a small +1/2 defect, escaping the boundary (see Supplementary Video S4). Such boundary nucleated defects are also observed with hard confinements (i.e., wells [20]), even when the confining radius is small enough to produce transitory +1 defects.
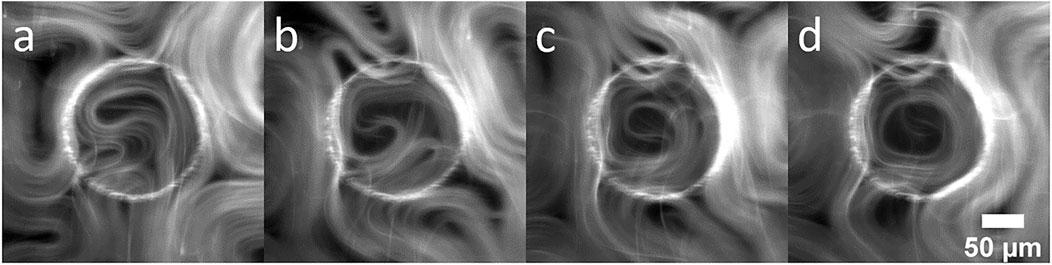
FIGURE 2. Fluorescence image sequence showing the motion of active nematic confined above a pillar. The sequence demonstrates nucleation of a defects exhibiting circular flow influenced by the circular geometry. (A) t = 230 s, (B) t = 275 s, (C) t = 300 s and (D) t = 320 s.
Despite the curvature barrier around the pillars, some defects can still penetrate the boundary wall, entering and leaving the circular region even after the system has reached steady state. As defects move onto the top of the pillar, they move more slowly, tend to circulate around the circumference and become trapped in the circular geometry. Defects with straighter trajectories are more likely to escape if they approach the boundary at close to 90°. We also observed that with thicker oil layers above the pillar it is more likely that defects can escape and that they are less likely to become confined. Defect kinematics in tandem with the curvature barrier at the pillar boundary act to generate the soft confinement effect between the two regions: the pillar top, and everywhere else outside the circular boundary.
Varying the oil thickness above a solid substrate (in this case the pillar tops) can result in changes in the size of the +1/2 defect core radius, the active length scale and defect kinematics [26]. Figure 3A shows a plot of microtubule Vrms for the active layer as a function of oil thickness above the pillar in the range of ∼7–12 µm. For each data point, the oil thickness above a different pillar was measured using confocal microscopy for a range of different pillar radii (See Supplementary Material for detailed method). Vrms was calculated using PIVLab. A linear fit added to the plot is a guide to the eye and demonstrates the trend that microtubule velocity increases as the oil thickness increases, albeit with relatively large error bars, consistent with previous reports. Pillars with oil layers < 7 µm were not measured due to material depletion. Figure 3B shows defect density as a function of oil thickness. In our recent paper [26], defect density above a series of submerged steps decreased with increasing oil thickness. Here we observe a similar trend, but for much thinner oil layers (8–12 µm). We also observed that within the confining region, the average density of +1/2 defects was higher than that for −1/2 defects. This result is expected as the time averaged total topological charge inside a circular confining region should be equal to +1. A difference in defect densities between positive and negative defects should be most noticeable for confining regions with the smallest radius, in which very few defects are present. The effect becomes less noticeable as the pillar radius increases and total defect numbers also increase.
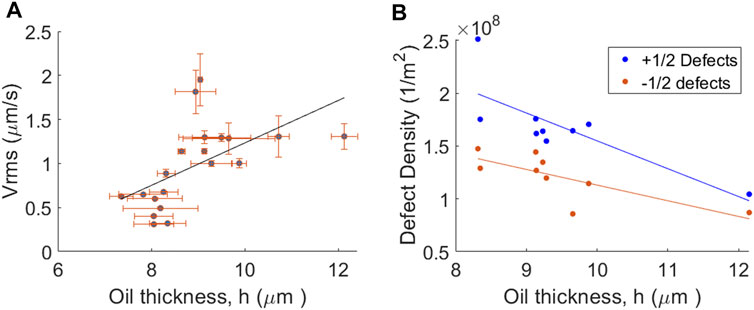
FIGURE 3. Effect of oil substrate thickness above the pillars on nematic flow dynamics. Graphs show (A) Vrms for the nematic flow field and (B) defect density, both plotted as a function of oil thickness as measured between the top of the pillar and the nematic layer using confocal microscopy.
As demonstrated in Figure 3, thinning the oil layer produces changes in Vrms and defect density and for the range of oil thicknesses in that Figure (∼7–12 µm) voids within the active layer are minimal and primarily located at the defect cores. However, this is not the case, if the oil layer becomes very thin.
Very thin oil layers produce depletion of active material, as reported in [26]. High effective friction due to a closely underlying surface disrupts the continuous nematic layer and we see similar effects within the region above the pillar when the oil thickness is very thin and large voids begin to appear. The effect is demonstrated in Figure 4 for three similar pillar tops with different oil thicknesses. Figure 4A shows a continuous layer of active material above a pillar top with an underlying oil thickness of 11.6 µm. Material away from the defect cores is nematic-like and relatively uniform. At an oil thickness of 9.3 µm (Figure 4B) the microtubule density is reduced, but topological defects are still well defined. Figure 4C shows material above a 7.8 µm layer of oil. Now the active layer is much less dense and topological defects are poorly defined when compared with the examples in Figures 4A,B. Instead of a continuous layer, the material in Figure 4C is composed of separated strands of bundles, with poor nematic alignment. The material continuously folds and turns but does not exhibit typical active nematic flows (Supplementary Video S5). Very thin oil layers result in a gradual depletion of the active material until no material is present over the pillar top. Because our method to measure the oil thickness depends on observation of the fluorescent active material above the pillar, we were unable to get an oil thickness measurement for the completely depleted pillars.
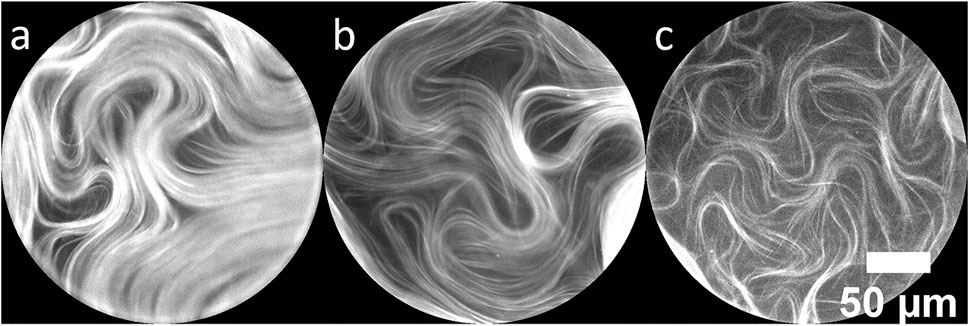
FIGURE 4. Fluorescence microscope images of active nematic on top of 250 µm diameter pillars. The images are cropped to show only the pillar tops. Depletion within the pillar boundary is observed with decreasing oil thicknesses of (A) 11.6 µm, (B) 9.3 µm and (C) 7.8 µm.
Two effects combine to deplete material from the pillar tops when the oil layer is very thin (below ∼8 µm). First, because the difference in effective friction between the deep and shallow regions is significant, bundles slow and are repelled when they encounter the pillar top as previously described [26]. In addition, the curvature barrier induced by the pillar makes it difficult for defects to enter the area above the pillar. We observe that in the steady state, if +1/2 defects enter the pillar top region (Figure 4C), they become depleted of material and the space is filled with lower density than the surrounding regions; the active nematic state is not well defined, and defects have less distinct cores (Supplementary Video S6).
Conclusion
In this paper we have demonstrated that surface-induced curvature in an active nematic layer can be a useful method to confine topological defects. To achieve the curvature confinement effect, we used circular pillars, slightly impinging on the active layer from below to produce a ring of interfacial curvature sufficient to confine mobile topological defects to the pillar tops. This method maintains a thin oil layer above the pillars, on which the continuous active layer is suspended. Defect motions consistent with other confinement methods are observed including the slower kinematics and higher defect densities seen for thin underlying oil layers. The introduction of local curvature via our pillar method provides a new tool to direct defect flows and investigate defect dynamics on curved landscapes. This technique can be used to design defect arrays and examine defect-defect interactions in environments with obstacles. It will also be interesting to use asymmetric pillar designs to add another level of complexity to the system. This proof-of-concept method adds to the emerging suite of tools available for the control of active nematics and may open up more possibilities for fundamental studies.
Methods
Photolithography
Pillars were fabricated using SU-8 (MicroChem Corp.) photoresist. Glass substrates are thoroughly cleaned in soap and water followed by 30-min sonication in acetone, methanol, and ethanol. The glass substrates are rinsed in nanopure water then dried using nitrogen gas. To improve adhesion, the glass substrates are plasma treated with oxygen for 2 min. The glass substrate is placed on a hotplate for 5 min at 150°C then is cooled down to room temperature for 5 min in a humidity-controlled area. A quarter-sized drop of SU-8 2010 is deposited on the glass substrate for spin coating. The SU-8 is spun at 1,000 rpm for 45 s. The substrate is then soft baked at 65° for 10 min then at 95° for 30 min on a hotplate to evaporate the solvent in the film. The film was exposed to 365 nm UV light (150 mJ/cm2) then underwent a post exposure bake for 5 min at 65° then for 10 min at 95° on a hot plate to allow the films epoxy groups to crosslink, forming the plastic. The hot plate is turned off with the substrate still on and allowed to cool to room temperature. Once cooled, the substrate is developed in SU-8 developer for 30 min with gentle agitations. Once developed, residual SU-8 developer is rinsed away with isopropanol and de-ionized water then dried with nitrogen gas. The thickness of the microstructures was verified using profilometry.
Preparation of the Active Nematic Layer
An active nematic microtubule network is generated following the protocol previously reported by [12]. Active nematic premixtures were prepared by combining 12 μl 6% (w/v) 20kD polyethylene glycol (PEG) in M2b buffer (80 mM PIPES pH 6.8, 2 mM MgCl2, and 1 mM EGTA), 8 μl phosphoenol pyruvate (PEP), 6 μl Trolox, 4 μl KSA, 2.9 μl MIX, 1.7 μl pyruvate kinase lactate dehydrogenase (PKLDH), 1.33 μl A01 and 1.33 μl A02.200mM PEP (6.9 pH) was prepared in M2B buffer with 0.5 M DTT and 0.352 mg/ml streptavidin for ATP regeneration. For anti-bleaching during fluorescent imaging, 20 mM of Trolox (pH 7.48) was prepared with 300 mg/ml Glucose with 70 mM KCl (pH 7.2), 70 mg/ml Glucose Oxidase (pH 7.5), and 3.5 mg/ml Catalase with 100 mM KCl (pH 7.4). For kinesin assembly, KSA was composed of a combination of 0.7 mg/ml K401, 0.325 mg/ml streptavidin, 1:100 ratio of DTT. MIX was comprised of 1 mM MgCl2 in M2B buffer. A01 and A02 was prepared with 0.5 M DTT, 300 mg/ml catalase and 3.5 mg/ml Catalase, Glucose Oxidase, respectively. The combined premixture was prepared in 3.73 μl aliquots, flash frozen in liquid nitrogen and stored in a -80°C freezer.
To form the bundled-microtubule network, ATP is added to the 3.73 μl premixture for a final concentration of 1 nM. 2 μl of 6 mg/ml. Alexa Fluor 647 labeled Guanosine-5’-[(α, β)-methyleno] triphosphate (GMPCPP) microtubules are added to the premixture for a final microtubule concentration of 1 mg/ml (3 mol% labeled). This system forms a 3D, unconfined, active microtubule network. Streptavidin can bind up to four biotin-labeled kinesin molecules and when microtubules of opposing polarities align parallel to each other, the kinesin molecules oriented at 180° walk in opposite directions along neighboring microtubules. As the kinesins walk, the filaments produce an extensile motion driven by ATP hydrolysis. We used an ATP concentration at saturation to maximize local microtubule extension speed.
To confine the active nematic at the oil/water interface (Figures 1D,E), we follow a previously published procedure [12, 15]. We first create a flow cell made from a glass substrate with patterned structures, double-sided tape and a coverslip treated with a (N, N’-methylenediacrylamide) polyacrylamide brush. The polyacrylamide brush prevents excess protein binding to the coverslip. We flow an oil/surfactant mixture [3 M HFE7500 with 1.8% PFPE-PEG-PFPE (perfluoropolyether, polyethylene glycol) surfactant] into the channel. Then, this mixture is exchanged with the active microtubule network suspension. The ends of the flow cell are sealed using a UV-curable glue (RapidFix). The flow cell is then centrifuged in a swinging bucket rotor for 10 min at 1,000 rpm to sediment the active nematic layer at the oil/water interface.
Image Analysis
To investigate how defect dynamics in the active layer are influenced by submerged structures, labeled microtubule bundles were imaged using fluorescence microscopy. 400 frame videos were collected at 1 frame per second and processed using Fiji/ImageJ version 1.53c software. To acquire defect distributions, active nematic microtubule defects were identified and counted manually every 10 frames for each video. 2-D x-y cartesian components were acquired for both +1/2 and −1/2 defects using the “Click-Coordinates-Tool” plugin for Fiji/ImageJ. The videos were processed by cropping a 400 µm × 400 µm window and subtracting everything outside the pillar boundary; each pillar was analyzed individually. From the raw data, counted the number of +1/2 and −1/2 defects in each frame, obtained the average number of defects, then divided the averaged value by the surface area of the circular boundary. We then plotted the relationship between defect density and oil thickness for both +1/2 and −1/2 defects.
To determine root-mean-square velocity (Vrms) as a function of oil thickness, two regions of similar area were selected to measure from the same field of view: within the pillar boundary and outside the pillar boundary. Within the selected area, velocity fields were generated for each frame using the MATLAB app PIV lab v2.53. Vrms was subsequently averaged over all frames and the average normalized by the maximum value.
Data Availability Statement
The original contributions presented in the study are included in the article/Supplementary Material, further inquiries can be directed to the corresponding author.
Author Contributions
DK and LH designed the study, DK performed the experiments and data analysis, DK and LH wrote the paper.
Funding
The authors would like to acknowledge National Science Foundation (NSF) award DMR-1808926 for generous funding. The project was also supported by the NSF through the Center of Research Excellence in Science and Technology: Center for Cellular and Biomolecular Machines at University of California Merced (HRD-1547848) and the Brandeis Biomaterials Facility Materials Research Science and Engineering Center DMR-2011486. Confocal microscopy was performed on an instrument funded by an NSF MRI Award (DMR-1625733).
Conflict of Interest
The authors declare that the research was conducted in the absence of any commercial or financial relationships that could be construed as a potential conflict of interest.
Publisher’s Note
All claims expressed in this article are solely those of the authors and do not necessarily represent those of their affiliated organizations, or those of the publisher, the editors and the reviewers. Any product that may be evaluated in this article, or claim that may be made by its manufacturer, is not guaranteed or endorsed by the publisher.
Acknowledgments
We would like to thank Prof. Anand Subramaniam at the University of California, Merced for his assistance using the confocal microscope.
Supplementary Material
The Supplementary Material for this article can be found online at: https://www.frontiersin.org/articles/10.3389/fphy.2022.880941/full#supplementary-material
References
1. Szakasits ME, Saud KT, Mao X, Solomon MJ. Rheological Implications of Embedded Active Matter in Colloidal Gels. Soft Matter (2019) 15:8012–21. doi:10.1039/c9sm01496a
2. Vutukuri HR, Lisicki M, Lauga E, Vermant J. Light-switchable Propulsion of Active Particles with Reversible Interactions. Nat Commun (2020) 11:2628. doi:10.1038/s41467-020-15764-1
3. Lushi E, Wioland H, Goldstein RE. Fluid Flows Created by Swimming Bacteria Drive Self-Organization in Confined Suspensions. Proc Natl Acad Sci U.S.A (2014) 111(27):9733–8. doi:10.1073/pnas.1405698111
4. Dell’Arciprete D, Blow ML, Brown AT, Farrell FDC, Juho SL, Mcvey AF, et al. A Growing Bacterial colony in Two Dimensions as an Active Nematic. Nat Commun (2018) 9:4190.
5. Wioland H, Woodhouse FG, Dunkel J, Kessler JO, Goldstein RE. Confinement Stabilizes a Bacterial Suspension into a Spiral Vortex. Phys Rev Lett (2013) 110:268102. doi:10.1103/physrevlett.110.268102
6. You Z, Pearce DJG, Sengupta A, Giomi L. Geometry and Mechanics of Microdomains in Growing Bacterial Colonies. Phys Rev X (2018) 8:031065. doi:10.1103/physrevx.8.031065
7. Li H, Shi X-q., Huang M, Chen X, Xiao M, Liu C, et al. Data-driven Quantitative Modeling of Bacterial Active Nematics. Proc Natl Acad Sci U.S.A (2019) 116:777–85. doi:10.1073/pnas.1812570116
8. van Holthe tot Echten D, Nordemann G, Wehrens M, Tans S, Idema T. Defect Dynamics in Growing Bacterial Colonies (2020). arXiv [Preprint]Available at: https://arxiv.org/abs/2003.10509 (Accessed August 31, 2021).
9. Huber L, Suzuki R, Krüger T, Frey E, Bausch AR. Emergence of Coexisting Ordered States in Active Matter Systems. Science (2018) 361:255–8. doi:10.1126/science.aao5434
10. Kumar N, Zhang R, de Pablo JJ, Gardel ML. Tunable Structure and Dynamics of Active Liquid Crystals. Sci Adv (2018) 4:eaat7779. doi:10.1126/sciadv.aat7779
11. Zhang R, Kumar N, Ross JL, Gardel ML, de Pablo JJ. Interplay of Structure, Elasticity, and Dynamics in Actin-Based Nematic Materials. Proc Natl Acad Sci U S A (2018) 115:E124–E133. doi:10.1073/pnas.1713832115
12. Sanchez T, Chen DTN, DeCamp SJ, Heymann M, Dogic Z. Spontaneous Motion in Hierarchically Assembled Active Matter. Nature (2012) 491:431–4. doi:10.1038/nature11591
13. Henkin G, DeCamp SJ, Chen DTN, Sanchez T, Dogic Z. Tunable Dynamics of Microtubule-Based Active Isotropic Gels. Phil Trans R Soc A (2014) 372:20140142. doi:10.1098/rsta.2014.0142
14. DeCamp SJ, Redner GS, Baskaran A, Hagan MF, Dogic Z. Orientational Order of Motile Defects in Active Nematics. Nat Mater (2015) 14:1110–5. doi:10.1038/nmat4387
15. Doostmohammadi A, Ignés-Mullol J, Yeomans JM, Sagués F. Active Nematics. Nat Commun (2018) 9:3246. doi:10.1038/s41467-018-05666-8
16. Tan AJ, Roberts E, Smith SA, Olvera UA, Arteaga J, Fortini S, et al. Topological Chaos in Active Nematics. Nat Phys (2019) 15:1033–9. doi:10.1038/s41567-019-0600-y
17. Honglawan A, Beller DA, Cavallaro M, Kamien RD, Stebe KJ, Yang S. Topographically Induced Hierarchical Assembly and Geometrical Transformation of Focal Conic Domain Arrays in Smectic Liquid Crystals. Proc Natl Acad Sci U.S.A (2013) 110(1):34–9. doi:10.1073/pnas.1214708109
18. Khaladj DA, Tan AJ, Hirst LS. Using Epoxy-Based Lithography to Probe Confinement Effects on Active Nematics. Proc SPIE (2019) XXIII:110920F. Liquid Crystals.
19. Hardoüin J, Hughes R, Doostmohammadi A, Laurent J, Lopez-Leon T, Yeomans JM, et al. Reconfigurable Flows and Defect Landscape of Confined Active Nematics. Comm Phys (2019) 2:121.
20. Opathalage A, Norton MM, Juniper MPN, Langeslay B, Aghvami SA, Fraden S, et al. Self-organized Dynamics and the Transition to Turbulence of Confined Active Nematics. Proc Natl Acad Sci U.S.A (2019) 116:4788–97. doi:10.1073/pnas.1816733116
21. Shendruk TN, Doostmohammadi A, Thijssen K, Yeomans JM. Dancing Disclinations in Confined Active Nematics. Soft Matter (2017) 13:3853–62. doi:10.1039/c6sm02310j
22. Bechinger C, Di Leonardo R, Löwen H, Reichhardt C, Volpe G, Volpe G. Active Particles in Complex and Crowded Environments. Rev Mod Phys (2016) 88:045006. doi:10.1103/revmodphys.88.045006
23. Reichhardt C, Reichhardt CJO. Active Matter Commensuration and Frustration Effects on Periodic Substrates. Phys Rev E (2021) 103:022602. doi:10.1103/physreve.103.022602
24. Ray D, Reichhardt C, Reichhardt CJ. Casimir Effect in Active Matter Systems. Phys Rev E Stat Nonlin Soft Matter Phys (2014) 90:013019. doi:10.1103/PhysRevE.90.013019
25. Zarif M, Naji A. Confinement-induced Alternating Interactions between Inclusions in an Active Fluid. Phys Rev E (2020) 102:032613. doi:10.1103/PhysRevE.102.032613
26. Thijssen K, Khaladj DA, Aghvami SA, Gharbi MA, Fraden S, Yeomans JM, et al. Submersed Micropatterned Structures Control Active Nematic Flow, Topology, and Concentration. PNAS (2021) 118:38. doi:10.1073/pnas.2106038118
27. Tang X, Selinger JV. Alignment of a Topological Defect by an Activity Gradient. Phys Rev E (2021) 103:022703. doi:10.1103/physreve.103.022703
28. Zhang R, Redford SA, Ruijgrok PV, Kumar N, Mozaffari A, Zemsky S, et al. Spatiotemporal Control of Liquid crystal Structure and Dynamics through Activity Patterning. Nat Mater (2021) 20:875–82. doi:10.1038/s41563-020-00901-4
29. Shankar S, Marchetti MC. Hydrodynamics of Active Defects: From Order to Chaos to Defect Ordering. Phys Rev X (2019) 9:041047. doi:10.1103/physrevx.9.041047
Keywords: active nematic, biopolymer, liquid crystal, fluorescence microscopy, topological defects
Citation: Khaladj DA and Hirst LS (2022) Using Curved Fluid Boundaries to Confine Active Nematic Flows. Front. Phys. 10:880941. doi: 10.3389/fphy.2022.880941
Received: 22 February 2022; Accepted: 30 March 2022;
Published: 27 April 2022.
Edited by:
Alberto Fernandez-Nieves, Catalan Institution for Research and Advanced Studies (ICREA), SpainReviewed by:
Francesca Serra, Johns Hopkins University, United StatesCharles Reichhardt, Los Alamos National Laboratory (DOE), United States
Copyright © 2022 Khaladj and Hirst. This is an open-access article distributed under the terms of the Creative Commons Attribution License (CC BY). The use, distribution or reproduction in other forums is permitted, provided the original author(s) and the copyright owner(s) are credited and that the original publication in this journal is cited, in accordance with accepted academic practice. No use, distribution or reproduction is permitted which does not comply with these terms.
*Correspondence: Linda S. Hirst, lhirst@ucmerced.edu