Abstract
The correlation between BZ reaction and mixing state has been studied for decades, and the researchers are trying to apply it to chemical engineering. We observed a chemical wave pattern in the Belouzov-Zhabotinsky (BZ) reaction based on the inhomogeneity after mixing BZ and ferroin solutions with a mixing method named the rotation-and-stop method. A one-dimensional chemical wave appeared for large inhomogeneity in mixing. The frequency and wavenumber decreased with decreasing degree of inhomogeneity. In an almost perfectly mixed state, the wavenumber significantly reduced and approached the global oscillation. The degree of mixing could be efficiently determined by this reported method. Perfect mixing has never been realized in natural and biological systems. The results of this study can be applied to estimate the degree of mixing in a solution that is not being stirred after the mixing process.
1 Introduction
The correlation between the Belouzov-Zhabotinsky (BZ) reaction and the mixing state has been studied extensively for decades [1–4]. The quality of products in industrial processes depends on the mixing state; therefore, an easy method to quantify the mixing state is essential. The BZ reaction is a nonlinear chemical reaction that shows period oscillations in the concentration of the reaction intermediates. A significant characteristic of the BZ reaction is the amplification of a small initial concentration fluctuation in the excitable system. The oscillation period depends on the stirring rate in the batch reactor; with increasing stirring rate, the period increases and the oscillation suddenly disappears [5–7]. At a low stirring rate, the redox potential in a macroscopic area (average over a larger area) shows a noisy oscillation pattern compared to that of a smaller area [8]. This suggests that the oscillation pattern in a batch reactor is affected by the spatial inhomogeneity of the solution. The oscillation pattern of the BZ reaction in a continuous stirred tank reactor (CSTR) depends on both the stirring speed and reactant supply rate, which causes period-doubling bifurcation and chaotic behavior [9,10]. Using gallic acid as an organic redox agent, the redox potential showed a hysteresis against the stirring speed [11]. These results observed in the CSTR arise from the inhomogeneous distribution of reactant concentrations due to incomplete mixing.
The BZ reaction exhibits a chemical wave without stirring [1]. In the studies related to chemical waves, researchers considered perfectly mixed solutions or gels [3]. The role of the convection due to imperfect mixing and chemically-driven inhomogeneity in the BZ reaction is studied with the batch conditions in detail [12,13]. However, the generation of a chemical wave requires concentration fluctuations (inhomogeneity). If the solution in the oscillatory regime is completely homogeneous, the oscillation exhibits a global oscillation. To the best of our knowledge, the effect of inhomogeneity after mixing (hereinafter referred to as “the inhomogeneity”) on chemical waves has not been studied. If inhomogeneity affects the characteristics of the chemical wave, the degree of mixing can be estimated from the chemical wave pattern.
Furthermore, the BZ reaction has been studied as a model for cyclic chemical reactions in living systems, such as the tricarboxylic acid cycle [14], rhythmic motion [15–18], synchronization [19–21], and self-organization [22–24]. A living system cannot be stirred mechanically; as a result, perfect mixing has never been realized. Thus, their self-organizations are probably affected by the effect of the imperfect mixing. Therefore, the study of the mixing effect based on the chemical wave pattern is essential for analyzing living systems.
Herein, we demonstrate the effect of inhomogeneity on the chemical wave pattern produced by the BZ reaction. This study leads to a new quantitative method to estimate the degree of mixing and a deeper understanding of pattern formation in living systems.
2 Materials and Methods
2.1 Chemicals and Preparation of the BZ and Ferroin Solutions
All the chemicals used in this study were purchased from FUJIFILM Wako Pure Chemical Corporation. We prepared a catalyst-free BZ solution and ferroin solution (catalyst) using the purchased chemicals. Ferroin is oxidized to ferriin by the BZ reaction, which is accompanied by a color change from red to blue. As shown in Table 1, constituents of the BZ solution were sodium bromate (Wako Special Grade, 99.5%), sodium bromide (guaranteed reagent grade, 99.5%), malonic acid (Wako Special Grade, 99.5%), and sulfuric acid (64%). Ferroin solution was prepared using iron (II) sulfate heptahydrate (∼99.0–102.0%) and 1,10-Phenanthroline monohydrate (guaranteed reagent grade, 99.0%). First, we prepared the BZ solution by mixing the constituents in the following order: 5 ml of 1 M sodium bromate, 0.25 ml of 1 M sodium bromide, 2.5 ml of 1 M malonic acid, 13.75 ml of ultrapure water (PURELAB flex 3, ELGA LabWater), and 3.5 ml of 5 M sulfuric acid. After the addition of sulfuric acid, the color of the mixture changed to brown immediately, and it was mixed for 20 s until the mixture became colorless. In addition, 1.2 ml of 20 mM ferroin solution was diluted in a measuring flask to a volume of 25 ml. Before use in the experiments, the two solutions were bubbled with nitrogen gas for 1 minute, and the capped bottles containing the solutions were placed in a water bath at 20°C for 30 min, which is for avoiding the effects of the oxygen and temperature. The compositions of the BZ and ferroin solutions are shown in Table 1. These solutions were prepared before every experiment.
TABLE 1
| Solution | NaBrO3 (M) | NaBr (M) | CH2(COOH)2 (M) | H2SO4 (M) | Ferroin (mM) | Density (g/cm3) |
|---|---|---|---|---|---|---|
| BZ | 0.2 | 0.01 | 0.1 | 0.7 | 1.06 | |
| ferroin | 0.96 | 0.986 |
Concentrations of constituents of the BZ and ferroin solutions.
2.2 Preparation of the Two-Layer Solution
The chemical oscillation started after the BZ and ferroin solutions were mixed, and the mixing was carried out in a test tube using the method explained in section 2.3. In this study, the initial separation of these two solutions in the test tube was important. As shown in Figure 1A, 1 ml of both the BZ and ferroin solutions were poured into a test tube. The inner diameter and length of the test tube were 0.72 and 30 cm, respectively. First, the BZ solution, which has a higher density, was poured into the test tube, followed by the ferroin solution. The ferroin solution was poured carefully onto the BZ solution in the test tube using a silicone tube with an inner diameter of 1 mm, such that the boundary of the two solutions was not violated.
FIGURE 1
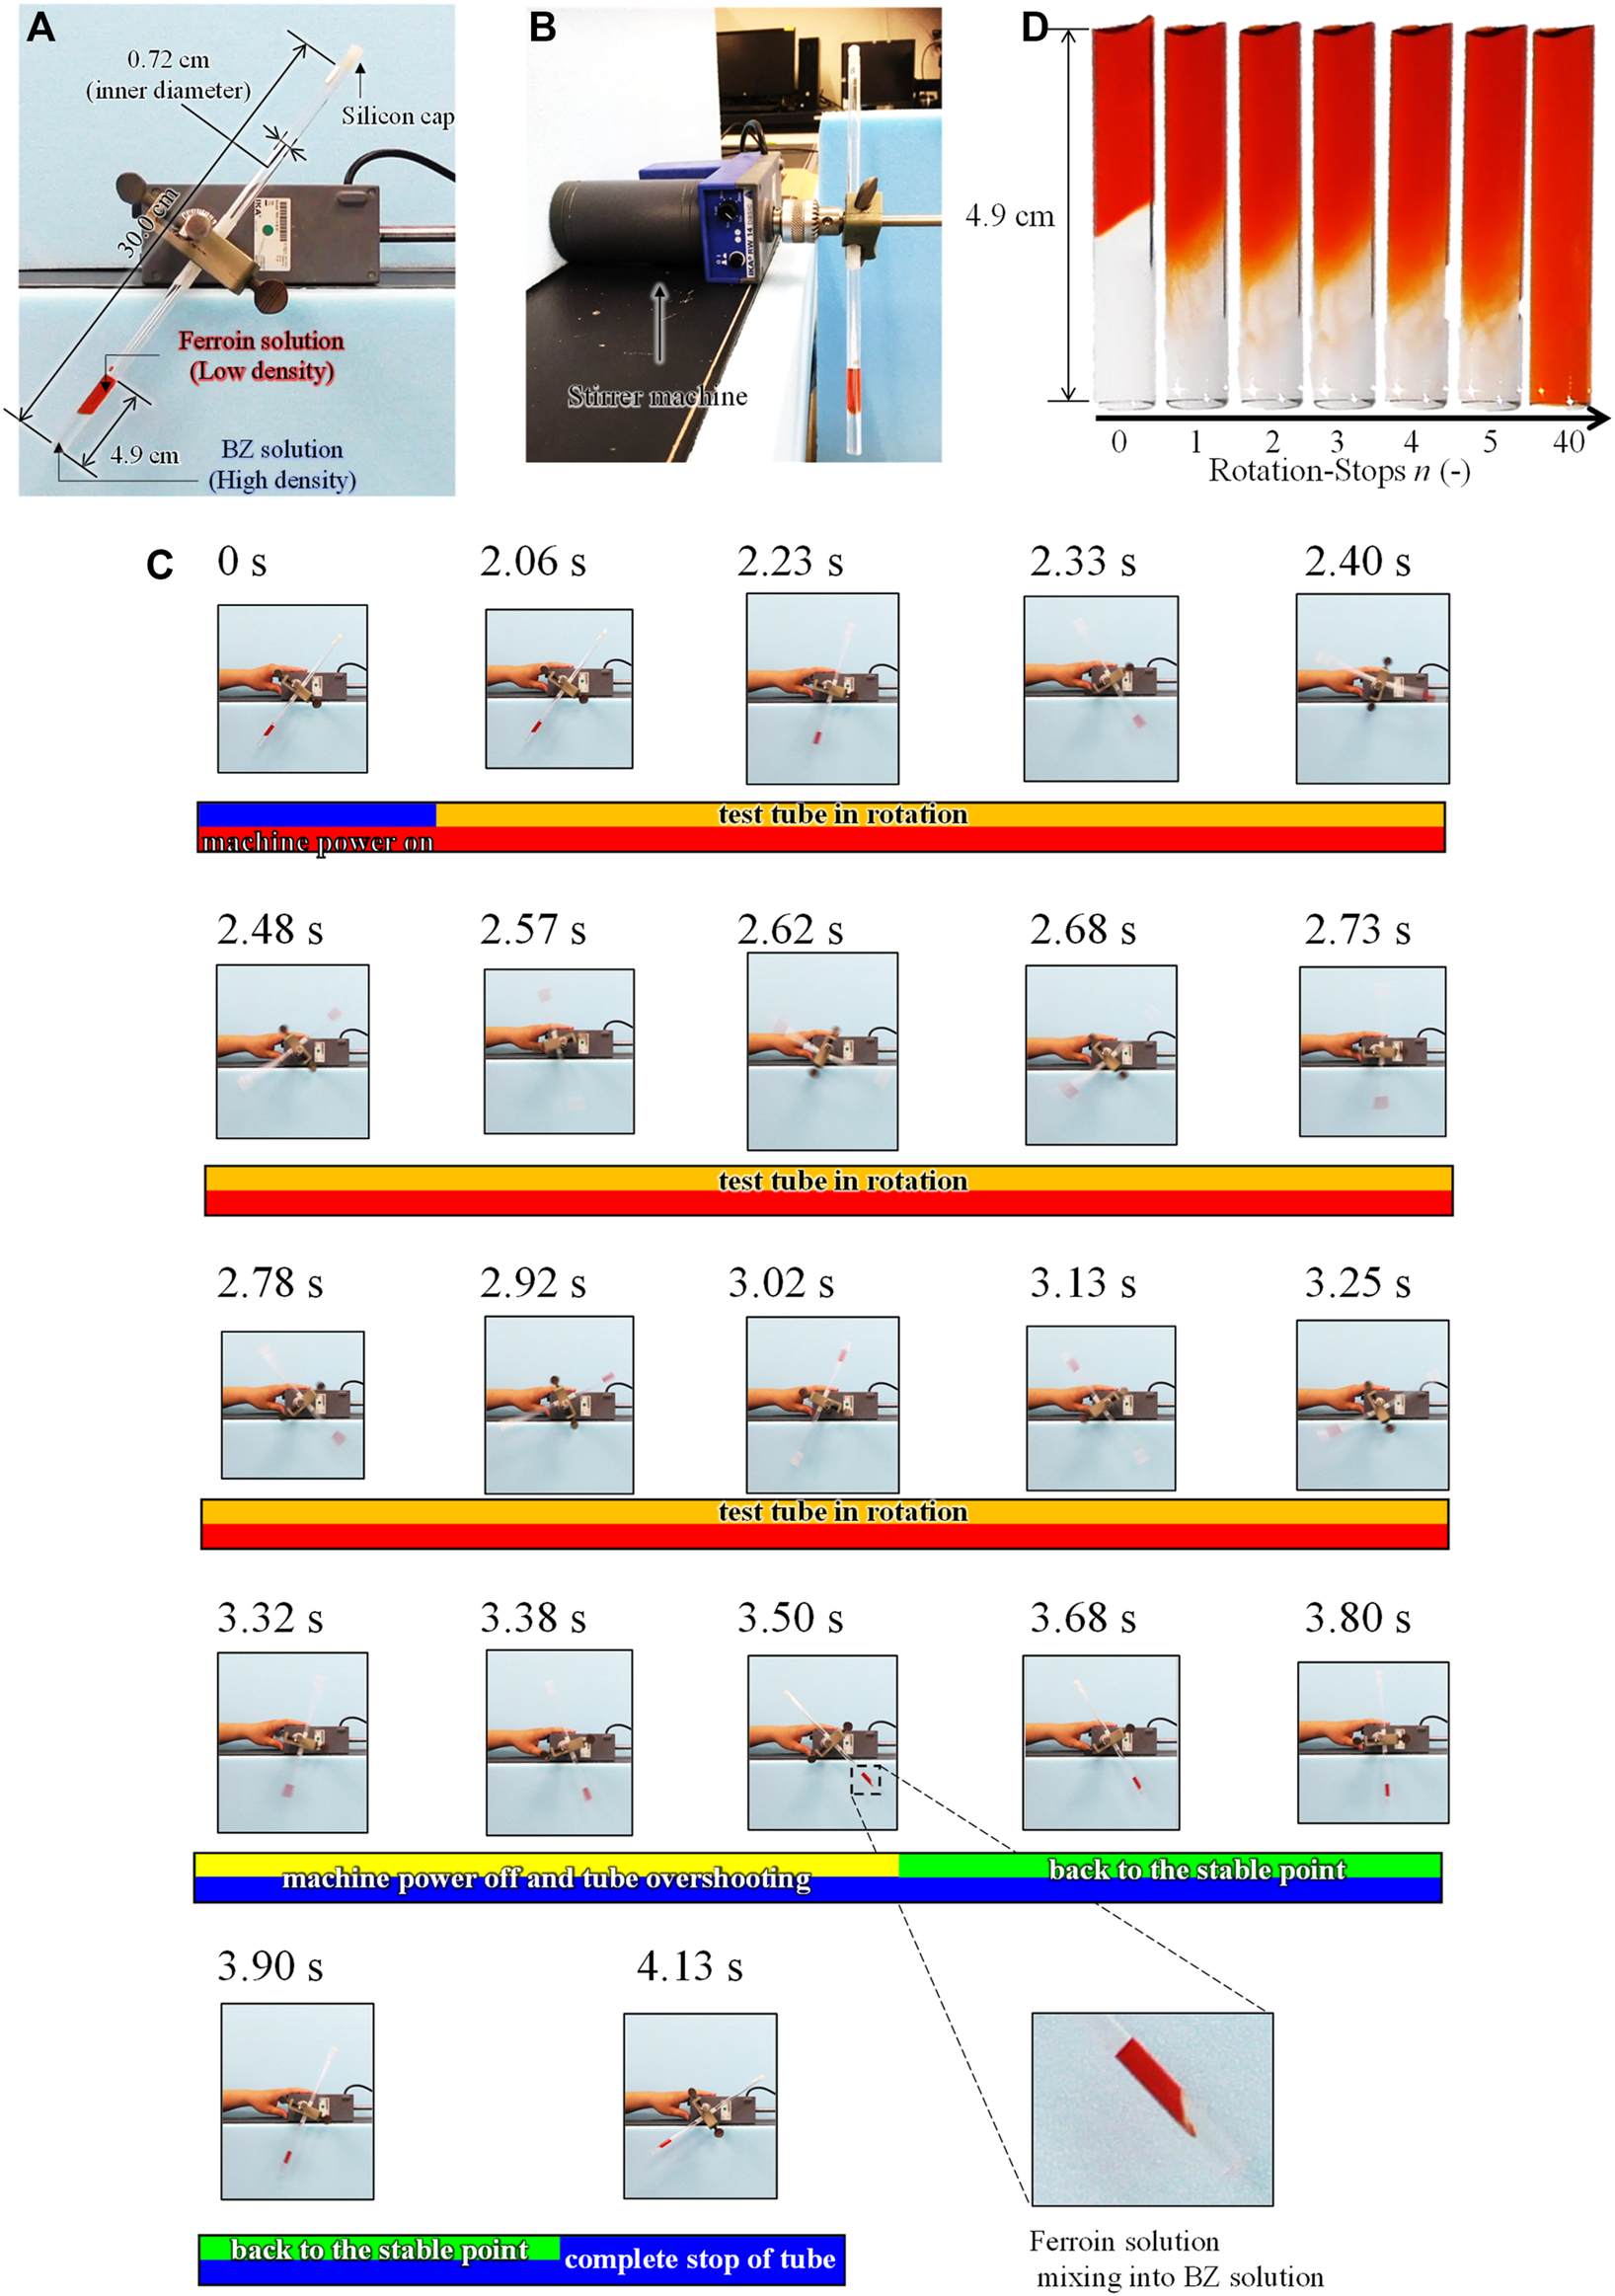
Rotation-and-stop method; (A) Front view and (B) side view of the experimental setup. (C) The behavior of the solutions in a tube during a single rotation-stop cycle. (D) The mixing process of between Na2SO4 and ferroin solutions in a test tube by rotation-and-stop method. The residual image in the (C) is caused by the fast rotation (∼90 cm/s) and the slow frame rate (30 frame/s).
2.3 Mixing Method to Evaluate the Inhomogeneity After Mixing
Figure 1 shows the mixing method of the BZ and ferroin solutions (mentioned in 2.1) in a test tube, which is referred to as the rotation-and-stop method. As shown in Figures 1A,B, the test tube was capped and attached to a stirrer machine (IKA, RW 14 basic). The tube slanted to the right side, as shown in Figure 1A, because of the mechanical structure of the apparatus (this is the initial state before the rotation). Using this setup, the tube was rotated (center of the test tube was the center of rotation) counterclockwise twice at a rate of approximately one rotation/s, following a sudden stop. The mixing occurs primarily because of this sudden stop, where the two solutions mix near the interface owing to weak convection caused by the inertia. The tube was rotated again approximately 3 s after the rotation was completely stopped. This series was repeated several times and the number of repetitions (also the number of stops) was denoted as n (n = 20–200). The two solutions were mixed slightly at each stop process. After completion of this rotation process, 2 ml of decane was poured onto the surface of the mixed solution to avoid the dissolution of oxygen from the air. The tube was then placed vertically in a water bath at 20°C. More than three experiments were performed under identical conditions. The solution in the test tube was recorded by a video camera for 30 min after the completion of the rotation-and-stop process, and the movie slices were analyzed using the image analysis software ImageJ.
3 Results and Discussion
3.1 Mixing of Solutions by Rotation-and-Stop Method
Figure 1C shows a series of snapshots recorded in a single rotation-stop process. In this experiment, the ferroin solution and Na2SO4 aqueous solution (0.77 M) were mixed to investigate only mixing process without the BZ reaction. The density of the Na2SO4 aqueous solution is approximately the same as that of the BZ solution, however, the BZ reaction did not occur. As shown in Figure 1C, the stirrer power was turned on at 0 s, but the rotation started after 2 s. Subsequently, the tube started to rotate counterclockwise. The stirrer was turned off at 3.32 s when two rotations were completed. However, the tube overshot until 3.50 s. After the overshoot, the tube returned to a stable state and stopped completely at 4.13 s. The solutions were mixed only around the boundary region after the two rotations. The mixing occurred at the stop-and-overshoot stages because of the density difference between the two solutions and the small diameter of the test tube which caused the complete separation of the solutions during rotation owing to the centrifugal force. Similarly, the BZ and ferroin solutions mix only at the stop-and-overshoot stages. Thus, the stepwise mixing can be achieved by the stop-and-overshoot stages n.
Figure 1D shows the interface between the two aqueous solutions after n stops. The interface diffused with increasing n. The mixing achieved by a single rotation stop was very weak and the degree of mixing monotonically increased with an increase in n. This result indicates that fine control of the mixing state is possible by controlling the value of n. Solutions with n ≥ 40 appeared to be homogeneous. Even though inhomogeneity could be present, it is difficult to detect with the naked eye.
3.2 Behavior of Chemical Wave at Different Stop Times (n)
After the completion of the mixing between BZ and ferroin solutions with the rotation-and-stop method, three modes were observed for different values of n. The first was an upward chemical wave, as shown in Figure 2A. This type of pattern is likely to appear at relatively smaller n values. This upward chemical wave was generated at the bottom of the solution, then traveled upward and spread in the entire solution. The second pattern was referred to as the complicated pattern as shown in Figure 2B. In this pattern, a chemical wave was generated at the top or middle of the solution together with an upward chemical wave or oscillation at the local place. For example, oscillation of color appeared in the lower half of the solution at n = 90 (Figure 2B). This complicated pattern, observed 30 min after the rotation-and-stop process, was transient, and one of the local chemical waves or chemical oscillations became dominant over time (see Supplementary Video S1). The last pattern was a global-oscillation-like pattern over the entire solution, as shown in Figure 2C. In this phenomenon, the color of the entire solution oscillated for at least 30 min after the completion of the rotation-and-stop process. This oscillation is gradually transformed into a one-dimensional chemical wave (primarily into an upward wave) over time. In addition, the bubble growth caused by CO2 generation was rarely observed in any modes, and so the additional mixing due to this effect can be ignored.
FIGURE 2
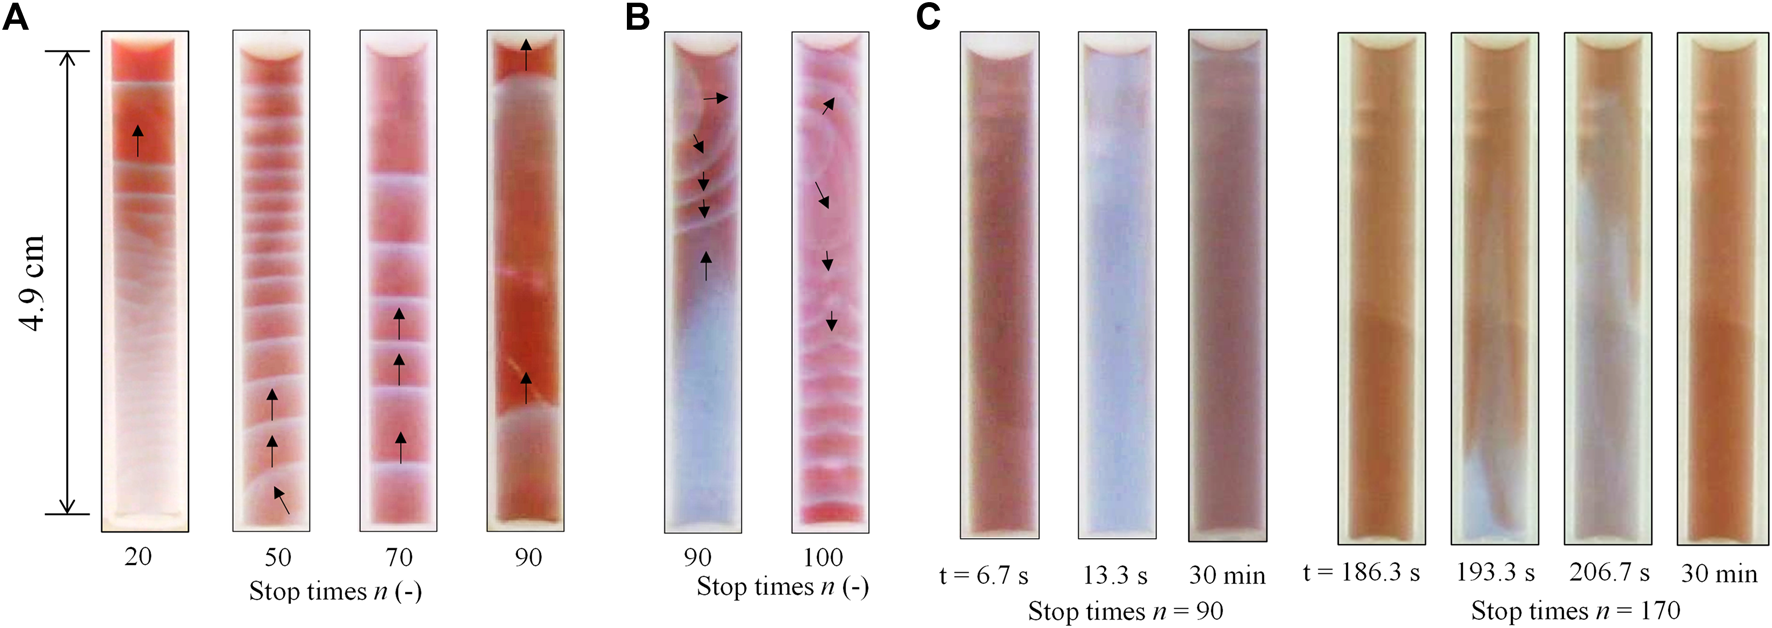
Three different modes of the chemical wave were observed in the tube 30 min after the rotation-and-stop process; (A) upward wave, (B) complicated pattern, and (C) global-oscillation-like pattern. The black arrows (Figures 2A,B) indicate the direction of the wave movement.
In general, if chemical oscillations with different frequencies exist, the maximum frequency dominates the entire solution [25]. Furthermore, the different profile of the chemical species may cause the different local excitability and thus different patterns [26,27]. Therefore, the oscillation frequencies f at three different points in the test tube as shown in Figure 3A, were measured. The results shown in Figure 2 are presented in Table 2. The maximum in the three types of f (fmax) was determined (the measurement was performed 30 min after the completion of the rotation-and-stop process with different n values). The patterns were classified by identifying the position where fmax was observed; when the position of fmax was found at the bottom, the mode was identified as an upward chemical wave. When fmax appeared at the middle or top of the tube, the pattern was classified as complicated. A global-oscillation-like pattern appeared when the frequencies of the three points were the same. The classification made by this method was in good agreement with that of visual observation, as shown in Figure 2. In this study, the classification of wave patterns was achieved by measuring the fmax to avoid human subjectivity. Figure 3B shows the ratio of the three modes obtained for each value of n. The upward chemical wave was found to be dominant for n ≤ 60. Complicated and global-oscillation-like patterns appeared at a higher n value. Figure 3C shows the fmax, as a function of n. It was observed that fmax decreased with increasing n.
FIGURE 3
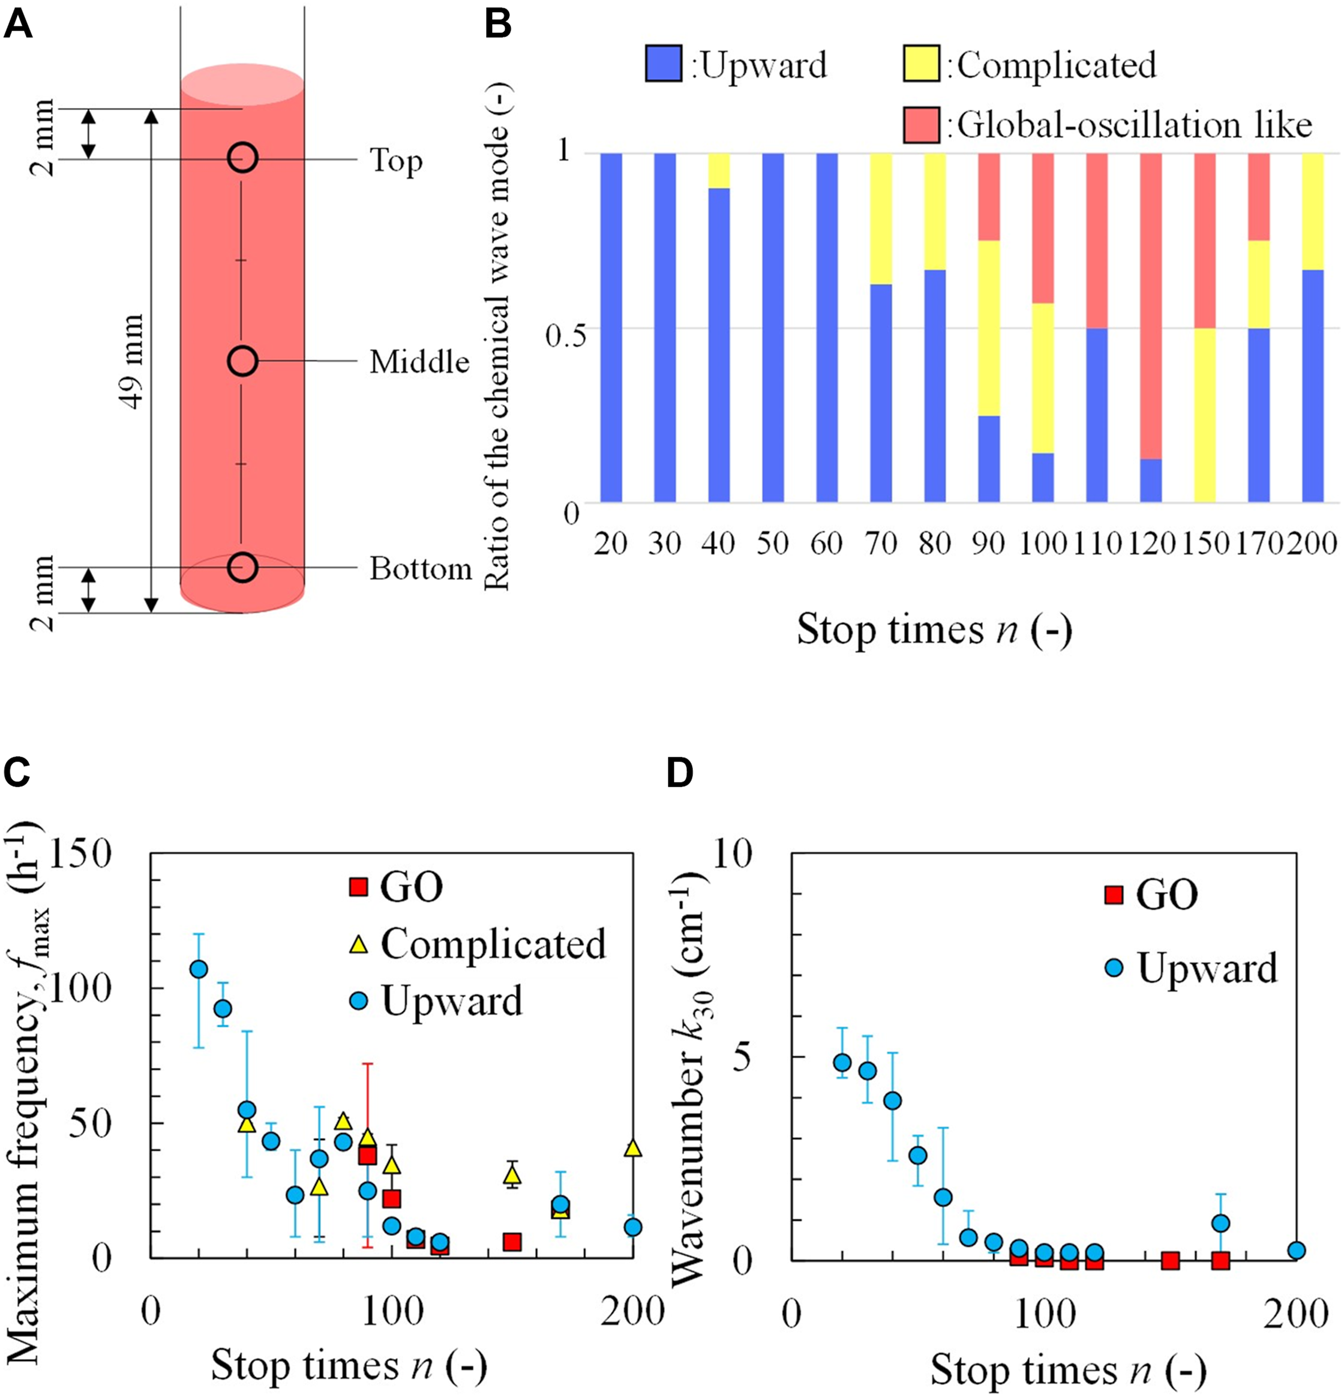
Classification of the wave patterns by measuring the maximum frequency; (A) three measuring positions of the test tube, (B) ratio of three modes at different values of n. (C) Maximum frequency and (D) wavenumber as a function of n. GO indicates a global-oscillation-like pattern. The error bar represents the range covering the results of three times experiments.
TABLE 2
| n (−) | Top (h−1) | Middle (h−1) | Bottom (h−1) | Mode |
|---|---|---|---|---|
| 20 | 4 | 42 | 114 | Upward |
| 50 | 12 | 30 | 40 | Upward |
| 70 | 40 | 44 | 52 | Upward |
| 90 | 4 | 6 | 8 | Upward |
| 90 | 46 | 42 | 42 | Complicated |
| 90 | 72 | 72 | 72 | Global-oscillation like |
| 100 | 38 | 38 | 24 | Complicated |
| 170 | 18 | 18 | 18 | Global-oscillation like |
Frequencies of chemical oscillations, f at three different positions of the tube for n values of 20–170 (Figure 2).
These experimental results show that the upward chemical waves with higher fmax appeared for lower values of n. The upward chemical wave indicates that the lower part of the test tube is the source of the chemical oscillation. Therefore, at n ≤ 60 (where the upward wave dominated), the highest frequency oscillator is generated at the lower part of the test tube because the oscillator with the highest frequency dominates the entire solution. At the lower part of the test tube, the ratio of BZ solution to the local solution of the BZ to the ferroin solutions was estimated to be larger owing to the mixing process using the rotation-and-stop method, as shown in Figure 1D. The worse the mixing (the smaller the n values), the larger the ratio of BZ solution.
To understand the effect of the ratio of BZ solution on the frequency of waves, another experiment was performed, where the oscillation frequency of the x: (1-x) volumetric mixture of BZ and ferroin solutions was measured in a batch reactor with a magnetic stirrer. Figure 4A shows that the global oscillation was observed in the range of x ≥ 0.5, and Figure 4B indicates that the frequency is higher at a larger x value (i.e., BZ-rich solution). The BZ-rich portion in the lower part of the test tube generated a chemical wave with a higher frequency to dominate the entire solution. This led to the upward chemical wave in the test tube. The solution approached a uniform mixture with an increase in n, and the frequencies at different locations approached each other. BZ reactions with the same frequency in the entire solution form a global oscillation. This phenomenon agrees with our experimental result where a global-oscillation-like pattern appeared at extremely large n values. However, in an actual experiment, an imperfection in mixing may exist even at larger n values. Owing to this imperfection, the local frequencies may differ slightly and the close frequencies form a complicated pattern. Therefore, complicated and global-oscillation-like patterns appear at a larger n value, where fmax is small because of better mixing. The x-values of the oscillators decreased and approached x = 0.5 for larger n values. This agrees with the results shown in Figure 3B. As shown in Figure 4A, the oscillation periods during 1 h batch experiment are almost the same. Furthermore, the time required for 200 times of rotation and stop (the maximum value of in the experiment) is less than 20 min. Therefore, the reactants remain sufficiently after the rotation and stop procedure, and the consumption of the reactants does not affect the result.
FIGURE 4
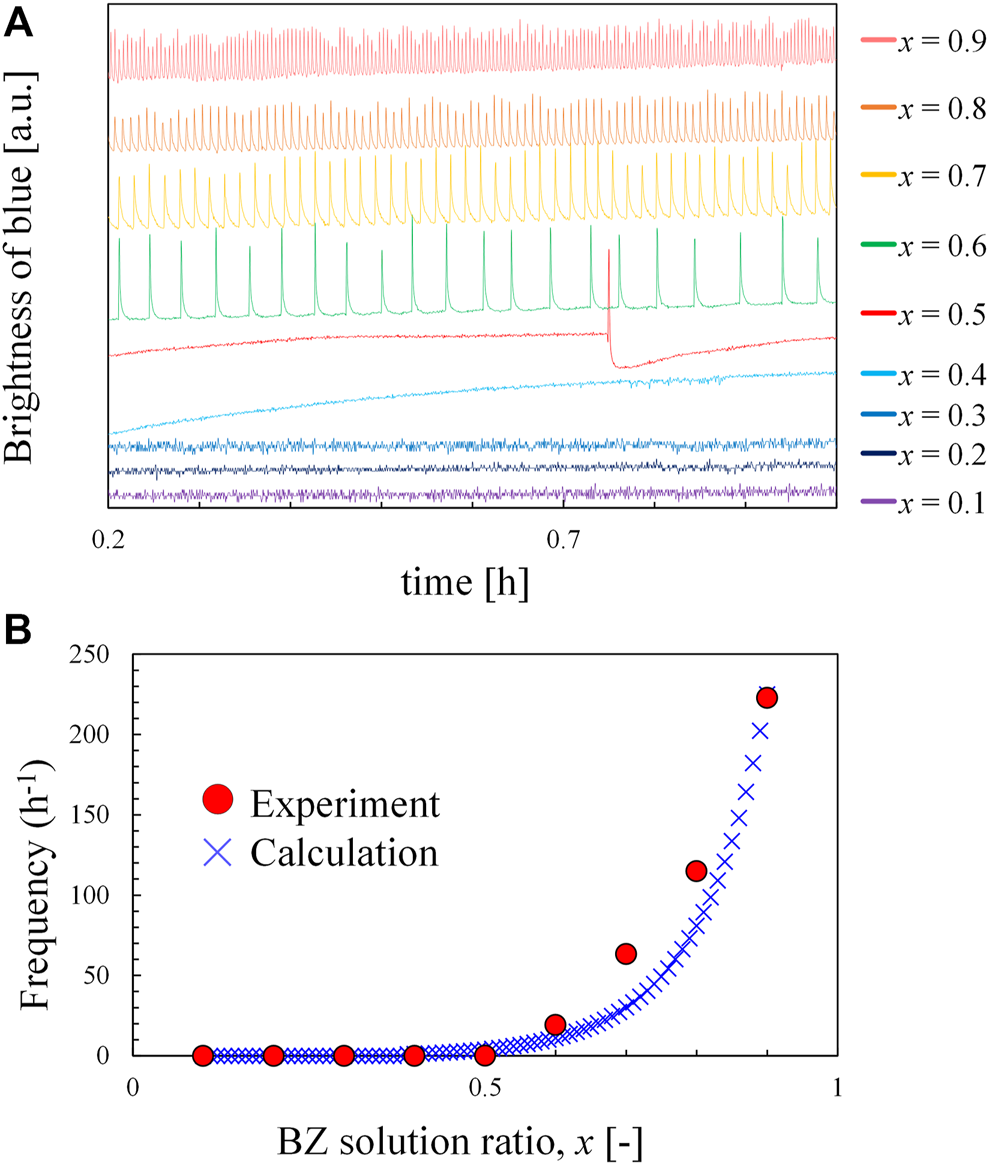
Behavior of the mixture of BZ solution and ferroin solution in a batch reactor; (A) time developments of the blue brightness of the mixture with BZ solution ratio, x and (B) oscillation frequency of mixture as a function of x.
Apart from frequency, the wavenumber was also counted (k30) 30 min after the rotation-stop procedure. For the upward wave, the wavenumber was calculated from the number of blue lines at Figure 2A divided by the solution height (4.9 cm). For the global-oscillation-like pattern, the number of wave crests was one or zero in the snapshot of 30 min; hence, k30 was calculated to be 0.20 or 0 cm−1. For complicated patterns, the wavenumber was not counted because of its complexity. Figure 3D shows that k30 decreased to an extremely small value with an increase in n. Both the frequency and wavenumber exhibited a similar trend. This result suggests that the inhomogeneity in mixing (incompleteness of mixing) can be estimated by the frequency and/or wavenumber of the chemical wave.
4 Numerical Calculation Using the Rovinsky-Zhabotinsky Model
The numerical calculation was performed employing the RZ model [2] to study the BZ reaction kinetics. This model has been developed for the ferroin-catalyzed BZ reaction. The solution is not one-dimensional strictly, because the three-dimensional pattern is observed (Figure 2B or Supplementary Video S1B). However, both the upward wave and the global-oscillation-like pattern may be expressed by the one-dimensional coordinate. Here, therefore, one-dimensional reaction-diffusion equations are used and solved numerically. The original RZ model is proposed in a dimensionless form, where the dimensionless time τ is scaled by the initial concentration of the reactant and reaction rate constants. In the present calculation, each position in a test tube had a different initial concentration of reactants; hence, we used equations with actual dimensions:where U and V correspond to the concentrations of HBrO2 and ferriin, respectively. t and x denote time and position, respectively. DU and DV are the diffusion constants for U and V, respectively [3]. k1, k4, k5, k7, k12, and K8 are reaction rate constants. The NaBr concentration was maintained at a steady state [2]. A0, B0, F0, and H0 correspond to the initial concentrations of NaBrO3, malonic acid, ferroin, and protons, respectively, which all were approximated as constants owing to their excess amount in solution throughout the reaction. Actually, A0, B0, F0, and H0 diffuse obeying their concentration gradient, but the diffusion length within 30 min is approximately 1 mm . On the other hand, the small changes in U and V by diffusion dramatically affect the reaction kinetics, because they are directly related to the autocatalytic processes; their diffusion terms are required for the chemical wave generation. Therefore, the diffusion terms only for U and V are taken into account in Eqs 3, 4. A0, B0, F0, and H0 depend on the height (position) of the test tube. In the present experiment, stock solutions of BZ and ferroin (compositions shown in Table 1) were poured into a test tube and mixed gradually. The concentrations of each constituent in the stock solution are defined as notations with subscript S. Therefore, AS, BS, and HS correspond to the concentrations of NaBrO3, malonic acid, and protons in the BZ solution, respectively. FS corresponds to the ferroin concentration in the ferroin solution. In a batch reactor experiment, the BZ and ferroin solutions were mixed in the volumetric ratio x:(1–x). Then, the initial concentrations A0, B0, H0, and F0 were calculated by x AS, x BS, x HS, and (1–x) FS, respectively. The blue curve in Figure 4B is the frequency calculated using Eqs 1–4 using these initial concentrations and ignoring diffusion terms (perfect mixing is assumed). The calculated results were in good agreement with the experimental results. The tuned constant values shown in Table 3 are in the same order as those reported in the literature [2,3] except k1, and fine-tuning is provided to obtain a better agreement in Figure 4B.
TABLE 3
| k1 (M−2・s−1) | k4 (M−2・s−1) | k5 (M−2・s−1) | k7 (M−2・s−1) | K8 (M・s−1) | k12 (s−1) | q (−) | DU (cm2・s−1) | DV (cm2・s−1) |
|---|---|---|---|---|---|---|---|---|
| 9.5 | 8×10⁴ | 1.5×10⁷ | 5 | 0.4 × 10⁻⁵ | 1.5 × 10⁻⁶ | 0.5 | 1.5 × 10⁻⁵ | 0.9 × 10⁻⁵ |
Tuned values of reaction and diffusion constants.
During the rotation-and-stop method, A0, B0, H0 and F0 in a test tube were calculated by y AS, y BS, y HS, (1- y) FS, where y is the ratio of BZ solution of the two solutions at a particular height (position) of the test tube for a certain value of n. Thus, to estimate y, the height and n are required.
In the rotation-and-stop method, only the regions close to the interface of the two solutions are mixed by a single rotation-stop cycle. This elementary step was repeated several times. Therefore, the mixing achieved by this procedure can be estimated by integrating the local mixing states. The mixing process in this study can be modelled as shown in Figure 5A. The mixing by the single rotation and stop process is restricted within a small region where the collision between the solution element and the tube wall induces the local mixing. Here, the small region is evaluated as approximately one-tenth of the solution height. The volumetric ratio of BZ solution is expressed as yn,j, where n and j represent the stop times and positions, respectively. In the initial state is expressed by (to express perfect separation): y0,j = 0 at j ≥ jmax/2 and y0,j = 1 at j < jmax/2 (the smaller yn,j is colored red in Figure 5A). The ratio of BZ solution at position j after a single rotation stop is calculated as
FIGURE 5
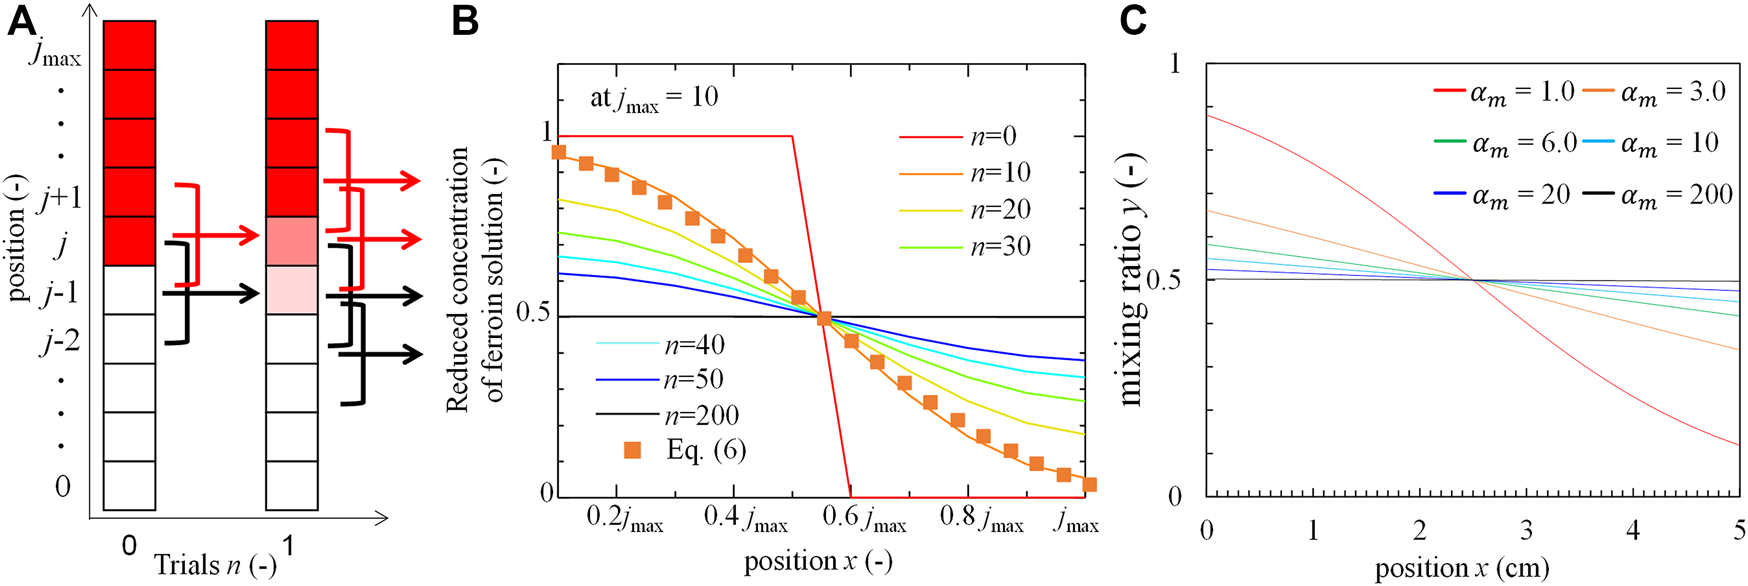
Mixing model and distributions. (A) Schematic of the model (the arrows indicate that three portions mix into one region), (B) Distribution of ferroin concentration at each trial obtained from the model. (C) The ratio of BZ solution to the local solution with s in calculation fit by hyperbolic tangent function.
Figure 5B shows yn,j after n rotations-stop cycles. yn,j approached a uniform distribution as n increased. A transient distribution (the dotted curve), which was approximately well correlated to the line of n = 10 at Figure 5B, is calculated using the hyperbolic tangent function:where x and h (instead of jmax) denote the position and length of the system, respectively. The mixing index, expresses the degree of mixing and is correlated with the stop time n in the experiment, where an increase in corresponds to an increase in n. Figure 5C shows the concentration distributions of the BZ solution ingredients at each . For example, ≅ 0 and ∞, indicate that the two solutions are completely separated and mixed, respectively.
In the experiment, a blue color appeared in the ferriin-rich part formed by the oxidation of ferroin. Therefore, in the calculation, the region with the highest V (highest concentration of ferriin) is colored blue. Figure 6A shows the pseudo-colored image created by this method at each value 30 min after mixing. The upward chemical wave was reproduced as shown in Figure 6A (waves traveling to larger x-values, see Supplementary Video S2). Figures 6B,C show the calculated fmax and k30 values, respectively. The calculation was performed using the same method as that applied for the experimental results. The results indicated that fmax and k30 decreased with an increase in . Because is positively correlated with n, this trend is qualitatively identical to those shown in Figures 3C,D. At > 100, k30 reached zero, and fmax took a small non-zero value. This represents the global-oscillation-like pattern. The global-oscillation-like pattern is observed only at a sufficiently large n value in the experiment, which is reproduced by this calculation.
FIGURE 6
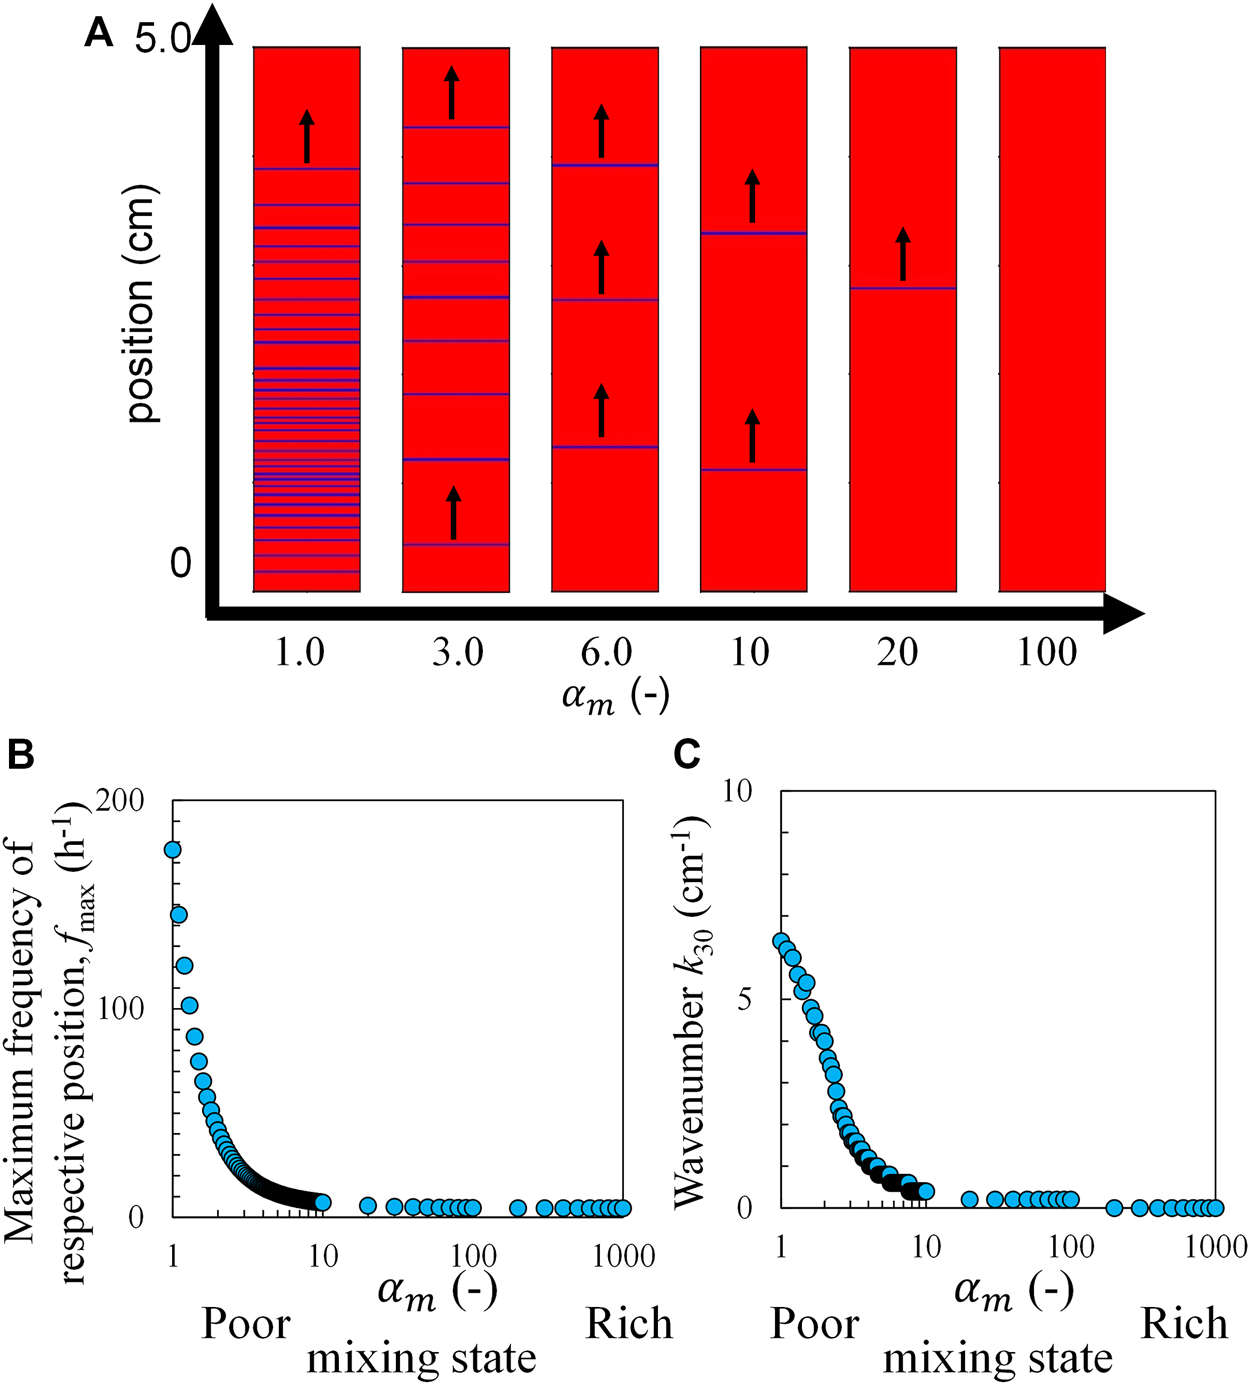
Calculation results based on the RZ model and the concentration distribution with Eq. 6, (A) the pseudo-colored image of the chemical wave, (B) maximum frequency, and (C) wavenumber as a function of s 30 min after mixing. The black arrows indicate the travel direction.
5 Conclusion
The stepwise mixing of two solutions in a test tube was achieved using the rotation-and-stop method. The BZ reaction exhibited three modes: upward chemical waves, complex patterns, and global-oscillation-like patterns in this mixing process. These patterns were visible to the naked eye and distinguished by determining the position of the highest oscillation frequency in the test tube. A transition from an upward chemical wave to complicated and global-oscillation-like patterns (which signifies the degree of mixing) was observed with an increase in the number of stops. An improved mixing state was achieved with a relatively low frequency and wavenumber. The results were explained by a numerical calculation using the RZ model and an appropriate concentration distribution. The relationship between the degree of mixing and the pattern produced in the BZ reaction will help quantify the degree of mixing using the spatiotemporal pattern. It is looking forward that the investigation of the accuracy of measurement with a comparison with the other method and that the developed quantification by the measurement of the chemical wave propagating speed.
Statements
Data availability statement
The original contributions presented in the study are included in the article/Supplementary Material, further inquiries can be directed to the corresponding author.
Author contributions
YO performed all experiments and calculations. YO, EO, DY, and AS conceived the study. YO, DY, and AS used a physicochemical model. YO, EO, DY, SN, and AS have discussed this research.
Acknowledgments
We thank Mr. Kun Lin for giving an opportunity of this study. YO acknowledges financial support from JSPS KAKENHI Grant Numbers 20K22335.
Conflict of interest
The authors declare that the research was conducted in the absence of any commercial or financial relationships that could be construed as a potential conflict of interest.
Publisher’s note
All claims expressed in this article are solely those of the authors and do not necessarily represent those of their affiliated organizations, or those of the publisher, the editors and the reviewers. Any product that may be evaluated in this article, or claim that may be made by its manufacturer, is not guaranteed or endorsed by the publisher.
Supplementary material
The Supplementary Material for this article can be found online at: https://www.frontiersin.org/articles/10.3389/fphy.2022.895824/full#supplementary-material
Supplementary Video S1Experimental results: (A) upward chemical wave, (B) complicated pattern, and (C) global-oscillation-like pattern. The speed was 200 times faster than the real speed.
Supplementary Video S2Calculated pseudo-color image of the chemical wave. The speed was 150 times faster than the real speed.
References
1.
ZaikinANZhabotinskyAM. Concentration Wave Propagation in Two-Dimensional Liquid-phase Self-Oscillating System. Nature (1970) 225:535–7. 10.1038/225535b0
2.
ZhabotinskyAMRovinskyAB. Mechanism and Nonlinear Dynamics of an Oscillating Chemical Reaction. J Stat Phys (1987) 48:959–75. 10.1007/bf01009526
3.
MiikeHMoriYYamaguchiT. Hiheikoukeinokagaku Ⅲ. Tokyo: Kodansha (1997).
4.
YoshikawaK. Hisenkeikagaku. Tokyo: Japan Scientific Societies Press. (1992).
5.
VanagVKMelikhovDP. J Phys Chem (1995) 99:4817372. 10.1021/j100048a011
6.
HashimotoSChikamochiYInoueY. Visualization of Partially Mixed Region by Use of Periodical Reaction. Chem Eng Sci (2012) 80:30–8. 10.1016/j.ces.2012.05.053
7.
RuoffP. Excitations Induced by Fluctuations: an Explanation of Stirring Effects and Chaos in Closed Anaerobic Classical Belousov-Zhabotinskii Systems. J Phys Chem (1993) 97(24):6405–11. 10.1021/j100126a014
8.
MenzingerMJankowskiP. Heterogeneities and Stirring Effects in the Belusov-Zhabotinskii Reaction. J Phys Chem (1986) 90(7):1217–9. 10.1021/j100398a001
9.
ZongCGaoQWangYFengJMaoSZhangL. Period-doubling and Chaotic Oscillations in the Ferroin-Catalyzed Belousov-Zhabotinsky Reaction in a CSTR. Sci China Ser B (2007) 50(2):205–11. 10.1007/s11426-007-0026-8
10.
RachwalskaMKawczyńskiAL. Period-Adding Bifurcations in Mixed-Mode Oscillations in the Belousov−Zhabotinsky Reaction at Various Residence Times in a CSTR. J Phys Chem A (2001) 105:7885–8. 10.1021/jp0108059
11.
DuttAKMuellerSC. Effect of Stirring and Temperature on the Belousov-Zhabotinskii Reaction in a CSTR. J Phys Chem (1993) 97(39):10059–63. 10.1021/j100141a027
12.
BudroniMAMasiaMRusticiMMarchettiniNVolpertV. Bifurcations in Spiral Tip Dynamics Induced by Natural Convection in the Belousov-Zhabotinsky Reaction. J Chem Phys (2009) 130(2):024902. 10.1063/1.3050356
13.
BudroniMACalabreseIMieleYRusticiMMarchettiniNRossiF. Control of Chemical Chaos through Medium Viscosity in a Batch Ferroin-Catalysed Belousov-Zhabotinsky Reaction. Phys Chem Chem Phys (2017) 19(48):32235–41. 10.1039/c7cp06601e
14.
BergJMTymoczkoJLStryerL. Biochemistry. 5th ed.New York, NY: W. H. Freeman (2002).
15.
YoshidaR. Design of Self-Oscillating Gels and Application to Biomimetic Actuators. Sensors (2010) 10:1810–22. 10.3390/s100301810
16.
AiharaRYoshikawaK. Size-Dependent Switching of the Spatiotemporal Structure between a Traveling Wave and Global Rhythm. J Phys Chem A (2001) 105:8445–8. 10.1021/jp010908r
17.
SuematsuNJMoriYAmemiyaTNakataS. Oscillation of Speed of a Self-Propelled Belousov-Zhabotinsky Droplet. J Phys Chem Lett (2016) 7:3424–8. 10.1021/acs.jpclett.6b01539
18.
SuminoYKitahataHYoshikawaK. Mode Selection in the Spontaneous Motion of an Alcohol Droplet. Phys Rev E (2005) 72:4. 10.1103/physreve.72.041603
19.
KuzeMHiranishiYOkamotoYShioiANakataS. Construction of Nitrogen-containing Polycyclic Aromatic Compounds by Intramolecular Oxidative C-H/C-H Coupling of Bis(9H-carbazol-9-yl)benzenes and Their Properties. Chem Lett (2019) 48:9. 10.1246/cl.190292
20.
YoshimotoMYoshikawaKMoriY. Coupling among three chemical oscillators: Synchronization, phase death, and frustration. Phys Rev E (1993) 47:2. 10.1103/physreve.47.864
21.
YashinVVBalazsAC. Chemomechanical synchronization in heterogeneous self-oscillating gels. Phys Rev E (2008) 77:046210. 10.1103/physreve.77.046210
22.
CherkashinAAVanagVK. Self-Organization Induced by Self-Assembly in Microheterogeneous Reaction-Diffusion System. J Phys Chem B (2017) 121:2127–31. 10.1021/acs.jpcb.6b12089
23.
SuzukiDSakaiTYoshidaR. Self-Flocculating/Self-Dispersing Oscillation of Microgels. Angew Chem (2008) 120:931–4. 10.1002/ange.200703953
24.
LagziIKowalczykBWangDGrzybowskiBA. Nanoparticle Oscillations and Fronts. Angew Chem Int Edition (2010) 49:8616–9. 10.1002/anie.201004231
25.
MatsushitaMNakataSKitahataH. Characteristic Features in the Collision of Chemical Waves Depending on the Aspect Ratio of a Rectangular Field. J Phys Chem A (2007) 111(26):5833–8. 10.1021/jp068207n
26.
BudroniMALemaigreLEscalaDMMuñuzuriAPDe WitA. Spatially Localized Chemical Patterns Around an A + B → Oscillator Front. J Phys Chem A (2016) 120(6):851–60. 10.1021/acs.jpca.5b10802
27.
BudronMA. Phys Rev E2016, 93(6):062207.
Summary
Keywords
Belousov-Zhabotinsky reaction, mixing, chemical oscillation, chemical wave, visualization, nonlinear dynamics, inhomogeneity
Citation
Okamoto Y, Okita E, Yamamoto D, Nakata S and Shioi A (2022) Detection of Inhomogeneity After Mixing Solutions by Analyzing the Chemical Wave Pattern in the Belousov-Zhabotinsky Reaction. Front. Phys. 10:895824. doi: 10.3389/fphy.2022.895824
Received
14 March 2022
Accepted
07 April 2022
Published
04 May 2022
Volume
10 - 2022
Edited by
Federico Rossi, University of Siena, Italy
Reviewed by
Marcelllo Budroni, University of Sassari, Italy
Marek Orlik, University of Warsaw, Poland
Updates
Copyright
© 2022 Okamoto, Okita, Yamamoto, Nakata and Shioi.
This is an open-access article distributed under the terms of the Creative Commons Attribution License (CC BY). The use, distribution or reproduction in other forums is permitted, provided the original author(s) and the copyright owner(s) are credited and that the original publication in this journal is cited, in accordance with accepted academic practice. No use, distribution or reproduction is permitted which does not comply with these terms.
*Correspondence: Akihisa Shioi, ashioi@mail.doshisha.ac.jp
This article was submitted to Physical Chemistry and Chemical Physics, a section of the journal Frontiers in Physics
Disclaimer
All claims expressed in this article are solely those of the authors and do not necessarily represent those of their affiliated organizations, or those of the publisher, the editors and the reviewers. Any product that may be evaluated in this article or claim that may be made by its manufacturer is not guaranteed or endorsed by the publisher.