Transport of Pseudomonas aeruginosa in Polymer Solutions
 Giovanni Savorana1
  Steffen Geisel2
  Tianyu Cen1 Yuya Ling1 Roman Stocker1
  Roberto Rusconi3,4
  Eleonora Secchi1*
- 1Institute of Environmental Engineering, Department of Civil, Environmental and Geomatic Engineering, ETH Zurich, Zurich, Switzerland
- 2Laboratory for Soft Materials, Department of Materials, ETH Zurich, Zurich, Switzerland
- 3Department of Biomedical Sciences, Humanitas University, Pieve Emanuele, Italy
- 4IRCCS Humanitas Research Hospital, Rozzano, Italy
Bacteria often live surrounded by polymer solutions, such as in animal respiratory, gastrointestinal, and reproductive tracts. In these systems, polymer solutions are often exposed to fluid flow, and their complex rheology can affect the transport of chemical compounds and microorganisms. Recent studies have focused on the effect of polymer solutions on the motility of bacteria in the absence of fluid flow. However, flow can be a game-changer on bacterial transport, as demonstrated by the depletion of motile bacteria from the low-shear regions and trapping in the high-shear regions in simple fluids, even for flows as simple as the Poiseuille one. Despite the relevance of polymer solutions in many bacterial habitats, the effect of their complex rheology on shear-induced trapping and bacterial transport in flow has remained unexplored. Using microfluidic experiments and numerical modeling, we studied how the shear rate and the rheological behavior of Newtonian and non-Newtonian polymer solutions affect the transport of motile, wild-type Pseudomonas aeruginosa in a Poiseuille flow. Our results show that, in Newtonian solutions, an increase in viscosity reduces bacterial depletion in the low-shear regions at the microchannel center, due to a reduction in the bacterial swimming velocity. Conversely, in the non-Newtonian solution, we observed a depletion comparable to the buffer case, despite its zero-shear viscosity being two orders of magnitude higher. In both cases, bacterial swimming and polymer fluid rheology control the magnitude of bacterial depletion and its shear-rate dependence. Our observations underscore the importance of the rheological behavior of the carrier fluid in controlling bacterial transport, in particular, close to surfaces giving rise to velocity gradients, with potential consequences on surface colonization and biofilm formation in many naturally relevant microbial habitats.
Introduction
Polymer fluids are found in the natural habitat of bacteria, as in organs covered in mucus [1], or in technological settings, like groundwater remediation and enhanced oil recovery [2]. In these systems, polymer fluids are often in flow, and their polymeric nature determines their complex rheology, which in turn affects the transport of chemicals, particles and microorganisms. Complex rheological behaviors include viscoelasticity, shear-thinning, and shear-thickening, where viscosity gradients can arise in the presence of shear rate gradients [3].
In no-flow conditions, polymer solutions affect bacterial swimming because of their complex rheology. Pioneering work of the 70’ reported that a moderate increase in the viscosity of the suspending medium causes an increase in the swimming velocity of several species of flagellated bacteria, whereas a further increase in viscosity reduces it [4–7]. This observation was first explained in terms of gain in propulsive efficiency of the flagellum at moderate viscosities [4, 8]. Lately, the characteristics of the polymer network were also evaluated: experimental observation and a mathematical model have shown that the hydrodynamic forces exerted by the polymer network on the swimming cell body are responsible for the change in the bacterial swimming [5, 9]. This explained the observed dependence of the swimming velocity not only on the viscosity, but also on the type of polymer. Recent research studies further described how the local shear-thinning [10, 11], the elastic properties of the polymer solution [11–14] and the hydrodynamic interaction between individual bacteria and the colloidal component of complex fluids [15] are responsible for the change in swimming pattern and velocity of bacteria. Additionally, the influence of the details of the bacterial swimming behavior is currently under investigation [16–19]. The complexity of polymer rheology, the diversity of the bacterial propulsion strategies, and their interplay hindered the development of a unified description of swimming in polymer solutions. However, the key ingredients at play when the fluid is at rest have been identified.
Conversely, bacterial transport by flowing polymer solutions remains understudied. Water flow has been shown to affect bacterial transport and distribution, as described in several studies [20–22]. In a straight microfluidic channel, motile bacteria become trapped close to flat surfaces, causing their accumulation in the proximity of the channel walls and depletion from the central region of the channel [23]. This trapping is a hydrodynamic phenomenon determined by the action of fluid shear on motile, elongated bacteria [23–26], driving bacterial accumulation behind obstacles [27–29] and in the wake of sinking spheres [30]. These results were obtained in water, while, to date, the effect of flow of the polymer solutions has not been explored yet. In a polymer solution in flow, two elements could affect bacterial transport: the complex rheology of the fluid, potentially leading to the creation of viscosity gradients, and its effect on bacterial motility. The interplay between these two effects could completely change the observations compared to the case of water, with practical implications for the medical and industrial sectors.
In this work, we show that polymer fluids affect the transport of bacteria in a Poiseuille flow in a different way compared to the water case. By using both a Newtonian—polyvinylpyrrolidone (PVP)—and a non-Newtonian—xanthan gum—polymer solution as suspending fluids, we studied the transport of motile Pseudomonas aeruginosa PA14 wild-type cells in a serpentine microfluidic channel. First, we characterize the motility of the bacterial cells in the two polymer solutions at different concentrations in the absence of flow. Then, by coupling experiments and a mathematical model, in the Newtonian case, we show that increasing the polymer concentration both delays and reduces bacterial depletion from the channel center, as a result of the reduction of the bacterial swimming velocity. In the non-Newtonian case, we show that bacterial depletion is not significantly reduced compared to the buffer case as the high zero-shear viscosity in the Newtonian case would suggest. This result is due to the high values of the swimming velocity V in the xanthan gum solution and to the non-Newtonian shear rate profile across the channel width. Taken together, these results suggest that the complex rheology of polymer solutions has a crucial impact on bacterial transport.
Materials and Methods
Polymer solutions. Polyvinylpyrrolidone (PVP) 360 (Sigma Aldrich) powder was suspended in phosphate-buffered saline (PBS) to a concentration of 15 w/v% and stirred overnight on a magnetic stirrer at ambient temperature. The polymer solution was then diluted to the final concentrations of 2.5 w/v%, 5 w/v%, and 10 w/v% by adding PBS and a fixed volume of bacterial suspensions. Xanthan gum powder from Xanthomonas campestris (Sigma Aldrich) was suspended in 85 mM NaCl solution to a concentration of 0.2 w/v% and stirred for 48 h on a heated magnetic stirrer at 65°C. The xanthan gum solution was then diluted with the bacterial suspension to a final concentration of 0.1 w/v%.
Rheological characterization of the polymer solutions. The viscosity of the polymer solutions was measured using a modular compact rheometer (MCR-302, Anton Paar). We used both cone plate (CP50-2) and double gap (DG26.7) geometries to obtain the flow curve of the polymer solution at each concentration. For each measurement, the shear rate was increased from 0.1 s−1 to 500 s−1 and then decreased from 500 s−1 to 0.1 s−1 while 5 logarithmically spaced measurement points per decade were recorded for 15 s each point.
Bacterial cultures. Experiments were performed using P. aeruginosa strain PA14 wild type. P. aeruginosa suspensions were prepared by inoculating 3 ml of Tryptone Broth (TB, 10 g L-1 tryptone) with cells from a frozen stock and incubating overnight at 37°C while shaking at 200 rpm. Approximately 30 μl of solution were then resuspended in 3 ml of the same medium and incubated under the same conditions for 5 h (OD600 = 1). To ensure a high percentage of motile bacteria in the experiments, non-motile and dead cells were gently removed from bacterial suspensions using sterile cell culture inserts incorporating a 3-μm-pore-size membrane, following the procedure described in [23, 29]. The filtered bacterial suspension was then mixed with the polymer solutions to the final desired polymer concentration and immediately used in the experiments. For the polymer-free control, the filtered bacterial suspension was resuspended in phosphate-buffered saline (PBS). Growth curves were acquired by measuring the OD600 of the bacterial suspensions in PVP 360 (2.5 w/v %, 5 w/v %, and 10 w/v %) and in xanthan gum (0.1 w/v %) solutions while incubated for 5 h at 37°C and shaking at 200 rpm. The growth curves did not show any differences from the PBS buffer case, suggesting that the bacteria did not metabolize the chosen polymers.
Microfluidic assays. We fabricated a poly-dimethyl-siloxane (PDMS) [31] microfluidic device with a single 50 cm-long serpentine channel (Figure 1A). The serpentine channel is composed of 13 parallel straight sections, connected by curves with an inner radius R = 500 µm. Each straight section is 4 cm long. To ensure that the dominant velocity gradients occurred on the observation plane, we designed the microchannel with aspect ratio H/W = 2.25 (height H = 810 μm; width W = 360 µm). Flow was driven by a syringe pump (neMESYS 290N, CETONI, Germany), at constant flow rates in the range Q = 4.5–180 μl min−1. At such flow rates, the mean of the absolute value of the shear rate
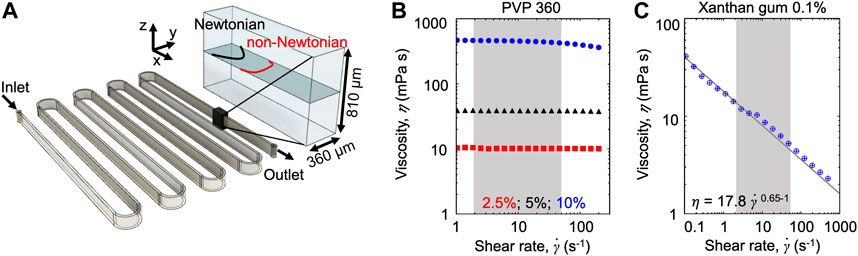
FIGURE 1. (A) Schematic of the serpentine microchannel used for the experiments (left) and perspective view (right) showing the imaging plane (gray), the parabolic Newtonian flow profile (black), and a representative non-Newtonian profile (red). (B,C) Viscosity as a function of the shear rate for the Newtonian PVP 360 solutions at 2.5 w/v% (red), 5 w/v% (black), and 10 w/v% (blue) (B) and for the 0.1 w/v% xanthan gum solution (C). The shaded areas highlight the shear rate
Cell imaging and tracking. All imaging was performed on an inverted microscope (Ti-Eclipse, Nikon, Japan) using a digital camera (ORCA-Flash4.0 V3 Digital CMOS camera, Hamamatsu Photonics, Japan). Bacterial trajectories for motility characterization (Figure 2A) were extracted from time-lapse dark-field acquisitions (15× magnification; 87 frames per second (fps) in buffer, 20 fps in PVP 360 2.5 w/v% solution, 10 fps in PVP 360 5 w/v% solution, 5 fps in PVP 360 10 w/v% solution); 1,300 images were acquired in each polymer solution. To quantify bacterial transport in polymer solutions, images were acquired with phase-contrast microscopy (30× magnification, 25 fps); 3,000 images were acquired in every experimental condition. We experimentally measured the bacterial concentration B by counting bacterial cells in the laminar flow at a distance of 50 cm from the channel inlet. The concentration B was normalized by the initial homogeneous concentration and averaged over the imaging region, as in [23]. All image analysis was performed in Matlab (The Mathworks) using in-house cell tracking algorithms. The experiments were repeated three times with consistent results, but the data shown are from a single realization.
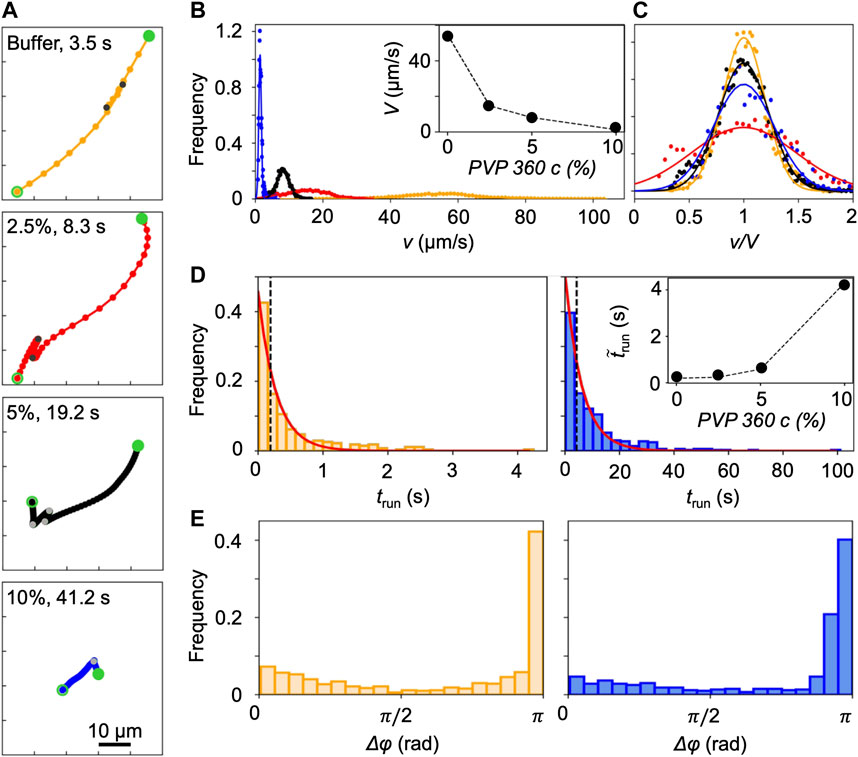
FIGURE 2. (A) Typical trajectories of P. aeruginosa cells swimming in buffer (yellow) and in PVP 360 solutions at 2.5 w/v% (red), 5 w/v% (black), and 10 w/v% (blue) without flow. The trajectories begin at open green circles and end at filled green circles. Grey filled points mark the end of a run. The time interval between dots is equal to 0.2 s. (B) Distribution of swimming velocities, v, measured by tracking individual cells in a population of P. aeruginosa swimming in buffer (yellow), PVP 360 solutions at 2.5 w/v% (red), 5 w/v% (black), and 10 w/v% (blue) in no-flow conditions. The continuous curves are Gaussian fits with the mean velocities V reported in the inset. (C) Distribution of swimming velocities reported in panel (B) as a function of the normalized velocity v/V. (D) Distribution of the transit times trun measured by tracking individual cells in a population of P. aeruginosa swimming in buffer (left panel) and in PVP 360 10 w/v% (right panel). The red curves are the exponential fits of the distributions. In the inset, the median values of trun as a function of PVP 360 w/v concentration are reported. (E) Distribution of the angular changes Δφ associated with reverse and pause events, measured by tracking individual cells in a population of P. aeruginosa swimming in buffer (left panel) and in PVP 360 10 w/v% (right panel).
Numerical simulations. The mathematical model, adapted from [23], describes the transport of individual swimming bacteria by the two-dimensional (2D) velocity field inside the microchannel, for the same velocity and flow conditions used in the experiments. The equations of motion of an ellipsoidal swimmer in a 2D flow directed along the x axis are:
where V is the bacterial swimming velocity, directed along the cell major axis, u(y) is the flow speed inside the channel,
In the case of Newtonian fluids flowing in a straight channel, we considered a parabolic velocity profile u(y) = U[1-4(y/W)2], where U is the maximum flow speed, and a shear rate profile
In the non-Newtonian case, we first characterized the 3D flow of the 0.1 w/v% xanthan gum solution inside the microchannel with CFD simulations. We then used the resulting 2D velocity and shear rate profiles on the midplane to integrate the equations of motion in Eq. 1. To simulate the rheological behavior of the xanthan gum solution, we set the fluid consistency index to m = 17.8 mPa s and the flow behavior index to n = 0.65, according to our rheological measurements (Figure 1C). We set the lower shear rate limit to
Given that ambient viscosity is not homogeneous across the channel width, we investigated a possible dependence of bacterial swimming velocity on position. To do so, in the equations of motion for the non-Newtonian case, we considered that the swimming velocity V = V(y) can vary across the channel width W, due to local changes in
where a = -4.7 10−9 (m/s) (L/mg), d = 33.9 10−6 m/s and c is expressed in ppm units (Figure 6A). According to [32], we established the following relation between c and the zero-shear viscosity
where
where
where
According to [23], we quantified the shear-induced depletion of both the experimental and numerical concentration profiles B with the depletion index ID, defined as the fraction of bacteria depleted from the central half-width of the channel:
Where
Results
Coupling Microfluidics and a Mathematical Model to Investigate P. aeruginosa Transport in Polymer Solutions
The effect of the polymeric nature of the fluid on bacterial transport was explored by combining microfluidic experiments with a mathematical model. During the experiments, we used optical microscopy to image the bacterial cells transported by the flow generated in a serpentine microfluidic channel (Figure 1A). The similarity of the geometry with the one presented in [23] allowed to easily compare the results. The aspect ratio of the channel H/W > 1 (height H = 810 μm; width W = 360 µm) ensures that the dominant velocity gradient occurred in the horizontal observation plane at the channel mid-depth. In this plane, for a Newtonian fluid—as culture media and the PVP 360 solutions—the flow profile is parabolic (Figures 1A,B), while for a non-Newtonian shear-thinning fluid—as the xanthan gum solution—the flow profile is flatter in the middle and decays faster towards the walls (Figures 1A,C). Motile P. aeruginosa cells were transported by the flow and imaged using video microscopy in phase-contrast mode to quantify their distribution across the width of the channel at 50 cm from the channel inlet (i.e., the entire length of the channel). Due to the low image quality close to the lateral channel walls, the cell distribution B, was quantified in a 220 µm-wide region centered at the centerline of the channel (
We investigated the role of fluid rheology by comparing the results obtained with three different carrier fluids: PBS buffer, PVP 360 at different concentrations, and a 0.1 w/v% xanthan gum solution. PBS buffer had the same viscosity as water and was used as a reference fluid, as in [23]. PVP 360 solutions at different polymer concentrations were used as the prototype of the polymeric Newtonian fluid and allowed exploring the effect of a homogeneous increasing viscosity on bacterial transport (Figure 1B). The xanthan gum solution is a non-Newtonian fluid with a zero-shear viscosity
We observed that the polymeric nature of the carrier fluid modifies the shape of the cell distribution B and the magnitude of the depletion from the center of the channel and the accumulation towards the channel walls with respect to the buffer case. To interpret these observations, we adapted the mathematical model of cell motility in flow presented in [23, 29]. P. aeruginosa cells were modeled as prolate ellipsoids with aspect ratio q = 9.4 and swimming velocity V directed along their major axes [29]. In the Newtonian cases (buffer and PVP 360), we described the flow with a parabolic profile. In the non-Newtonian case, we characterized the flow field on the midplane of the channel with CFD simulations. The corresponding velocity and shear rate profiles were then used to compute single-cell trajectories. In both cases, the bacterial swimming direction was determined by a torque balance that accounts for the flow shear and the fluctuations in the bacterial orientation. Since the model accounts for the bacterial swimming strategy, which has been reported to change in polymeric fluids [10, 12], we characterized P. aeruginosa motility by tracking individual cells in the absence of flow and inserted the parameters into the model, as described in the following sub-section.
Newtonian PVP 360 Affects P. aeruginosa Motility in Quiescent Conditions
P. aeruginosa swims in a 3-step pattern of run-reverse-pause in buffer and PVP 360 polymer solutions at all the tested concentrations. Swimming in buffer has been described in [33, 34], in agreement with our observations. We imaged free-swimming cells on the midplane of a 100-µm high microfluidic channel, where cell motion was not affected by hydrodynamic interactions with the top and bottom walls. P. aeruginosa propels forward when its single polar flagellum rotates clockwise and backward when it rotates counterclockwise. Forward and backward runs are nearly straight [35] and are interrupted by pauses, sudden decreases in swimming velocity associated with small angular changes Δφ in the swimming direction, or reverses, associated with angular changes Δφ of about π [33] (yellow trajectory in Figure 2A). The same swimming pattern was observed in PVP 360 polymer solutions: the trajectories displayed straight runs, pauses and reverses at all the concentrations, as shown by the representative trajectories reported in Figure 2A. This observation indicated that the addition of PVP360 did not affect the swimming pattern of P. aeruginosa.
Conversely, the concentration of PVP 360 affected the distribution of swimming velocities v, measured by tracking individual P. aeruginosa cells. An increase in the polymer concentration led to a shift of the distribution towards lower values of v (Figure 2B). The distributions were fitted with Gaussian curves to estimate the mean swimming velocities V (Figure 2B, inset). Furthermore, the distributions of v normalized by the corresponding values of V, showed that the addition of PVP 360 caused a slight widening of the distributions, but did not affect their Gaussian shape. The widening was more pronounced at the lowest polymer concentration (2.5 w/v%) (Figure 2C).
The concentration of PVP 360 also affected the distribution of transit times trun (Figure 2D), defined as the time elapsed between two consecutive changes in direction (marked by grey points in Figure 2A). As in [33], trun followed exponential distributions both in the buffer and in the PVP 360 solutions (red curves in Figure 2D). However, the median value of trun increased with increasing polymer concentration (Figure 2D, inset). Conversely, the distribution of angular changes Δφ associated with pauses and reverses was not affected by PVP 360, and showed a peak at π at all the concentrations that we investigated (Figure 2E).
Newtonian PVP 360 Affects P. aeruginosa Transport in Flow
The bacterial population flowing in the channel was depleted from the center, where the shear rate
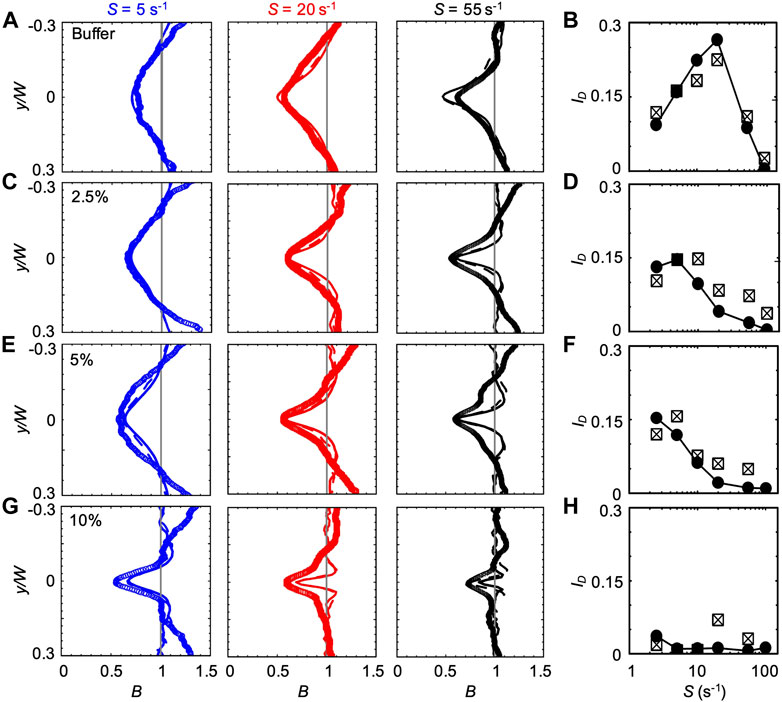
FIGURE 3. (A,C,E,G) Bacterial concentration profiles B of P. aeruginosa obtained from the experiments (symbols) and from the mathematical model (lines) for mean shear rates S = 5 s−1 (blue), S = 20 s−1 (red), and S = 55 s−1 (black) in buffer (A) and in PVP 360 solutions at 2.5 w/v % (C), 5 w/v % (E) and 10 w/v % (G). All the profiles were measured or computed at a distance D = 50 cm from the inlet and normalized by the mean bacterial concentration in the no-flow case. The numerical concentration profiles were obtained by modelling bacterial transport in a straight 50 cm-long channel (continuous line) and in a 50 cm-long serpentine channel (dashed line). (B,D,F,H) The depletion index ID as a function of the mean shear rate S in buffer (B) and in PVP 360 solutions at 2.5 w/v% (D), 5 w/v% (F) and 10 w/v% (H). The reported values were calculated for both the experimental (squares) and numerical (filled circles) bacterial concentration profiles. The numerical values were calculated from the profiles simulated in the straight 50 cm-long channel configuration.
The bacterial concentration profiles B obtained from the experiments (Figure 3A, symbols) were in good agreement with the ones simulated according to the mathematical model (lines) at all the tested values of S, especially when the curves in the serpentine geometry were taken into account (dashed lines). According to our simulations, the overall impact of the curves connecting the straight sections is to slightly widen the depleted region with respect to the straight channel case (dashed lines in Figure 3). The minimum of
We quantified the shear-induced depletion with the depletion index ID Eq. 6. The values of ID confirm the agreement between experiments and simulations (Figure 3B). In the PVP 360 polymer solutions at 2.5 w/v% and 5 w/v%, the good agreement between numerical and experimental B profiles was remarkable at low S (lower than S ≈ 20 s−1) and becomes less precise for higher values of S (Figures 3C,E), as confirmed by ID (Figures 3D,F). Interestingly, the maximum of ID shifted to a lower shear rate for increasing polymer concentrations (S ≈ 10 s−1 and S ≈ 2.5 s−1 at PVP 360 2.5 w/v% and 5 w/v%, respectively) (Figures 3D,F). The peak value of ID was comparable at these two concentrations (ID ≈ 0.146 and ID ≈ 0.153 at PVP 360 2.5 w/v% and 5 w/v%, respectively), and was about 20% lower than the peak value of ID in the buffer (ID ≈ 0.19). At the highest polymer concentration that we tested (PVP 360 10 w/v%), the agreement between the numerical and the experimental B profiles was good only for S ≤ 5 s−1 (blue curves in Figure 3G), while for higher values of S the depletion from the center of the channel was larger in the experiments than in the model (red and black curves in Figure 3G). Additionally, ID showed a drop in the depletion at PVP 360 10 w/v% compared to the lower polymer concentrations and the buffer case (0.006 < ID < 0.012) (Figure 3H). Despite its low value, ID decreased with increasing S, confirming the shift of the peak value of ID to lower S values observed in PVP 360 2.5 w/v% and 5 w/v%. The transport experiments performed with dead cells (fixed by adding formaldehyde to a final concentration of 0.2%) did not show depletion at any of the PVP 360 concentrations and values of S we tested. Overall, we observed that PVP 360 caused a decrease of the shear-induced bacterial depletion compared to the buffer case and that the decrease was higher at larger PVP 360 concentrations.
B and ID reach steady-state values once the cells have had time to swim towards high shear regions while being transported by the flow. Thus, the time required to reach the steady state increases when the swimming velocity V decreases. Accordingly, when V decreases, the steady state distribution will be observed at larger distances from the channel inlet. Consequently, increasing the concentration of PVP 360 increased the distance required to reach the steady-state, as shown by using the mathematical model to calculate ID as a function of the distance D from the inlet for the different solutions at S ≈ 10 s−1 (Figure 4). In buffer, P. aeruginosa cells swam at V = 54.7 μm/s and reached the steady-state distributions in less than 50 cm; thus, a longer traveling distance did not change B and ID (Figures 4A,B). In PVP 360 solutions, B computed at a distance D = 50 cm (blue curves in Figure 4A) had not reached the steady state yet, and the minima decreased when simulated at larger distances (pink and grey curves in Figure 4A). B reached the steady-state after 200 cm at all the tested concentrations (green curves in Figure 4A). The increase in the depletion with the traveling distance D was also visible from the trend of ID (Figure 4B). To ease the comparison between different concentrations, we normalized ID by its value at 200 cm, ID/ID 200. The normalized curves for ID/ID 200 showed that at higher PVP 360 concentrations the traveling distance required to reach the steady state is larger (Figure 4C). Consequently, we point out that in Figure 3 we were not comparing the steady-state values for all the conditions, but the depletion reached by the bacterial suspension after flowing for 50 cm in the same channel.
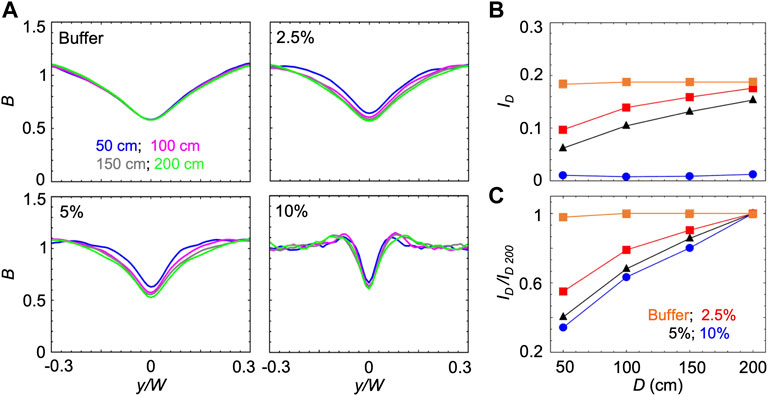
FIGURE 4. (A) Bacterial concentration profiles B numerically calculated according to the mathematical model for mean shear rate S = 10 s−1 in buffer (upper left) and in PVP 360 solutions at 2.5 w/v% (upper right), 5 w/v% (lower left) and 10 w/v% (lower right). For each fluid, the profiles were computed at a distance D of 50 cm (blue), 100 cm (pink), 150 cm (grey) and 200 cm (green) from the inlet. (B) The depletion index ID as a function of the distance from the inlet D in buffer (orange) and in PVP 360 solutions at 2.5 w/v% (red), 5 w/v % (blue) and 10 w/v% (black) measured from the numerical bacterial concentration profiles shown in (A). (C) Depletion index normalized by the depletion index at D = 200 cm, ID/ID 200, as a function of the distance from the inlet D, calculated from the curves shown in (B)
The changes in the concentration profiles B and in the magnitude of the depletion observed in the PVP 360 solutions are attributable to changes in average swimming velocity V and median values of the transit time trun, as shown by the good agreement between experimental and numerical results. Interestingly, if ttun remained constant with increasing polymer concentration, we would not observe any depletion in the 10 w/v% solution at D = 50 cm. These observations suggest that an accurate description of the bacterial swimming is fundamental to accurately predict the shear-induced depletion. Consequently, in the results presented so far, we modeled the P. aeruginosa run-reverse-pause swimming pattern (Materials and Methods). When compared to the run-tumble pattern used to describe the motility of B. subtilis in [23], the run-reverse-pause motility in buffer had the same peak values, but different shapes of the depletion profile B at high shear rates (Figure 5A). In PVP 360 5 w/v% flowing at low S, also the peak values were different (Figure 5C). In the case of the buffer, a greater similarity between the B profiles simulated with run-reverse-pause and run-tumble motility was found at the lower S, while in the case of PVP 360 5 w/v% a greater similarity was found at higher values of S. Conversely, 10% variations in the swimming velocity would not affect the depletion at any shear rate, both in the buffer and in PVP 360 (Figures 5B,D).
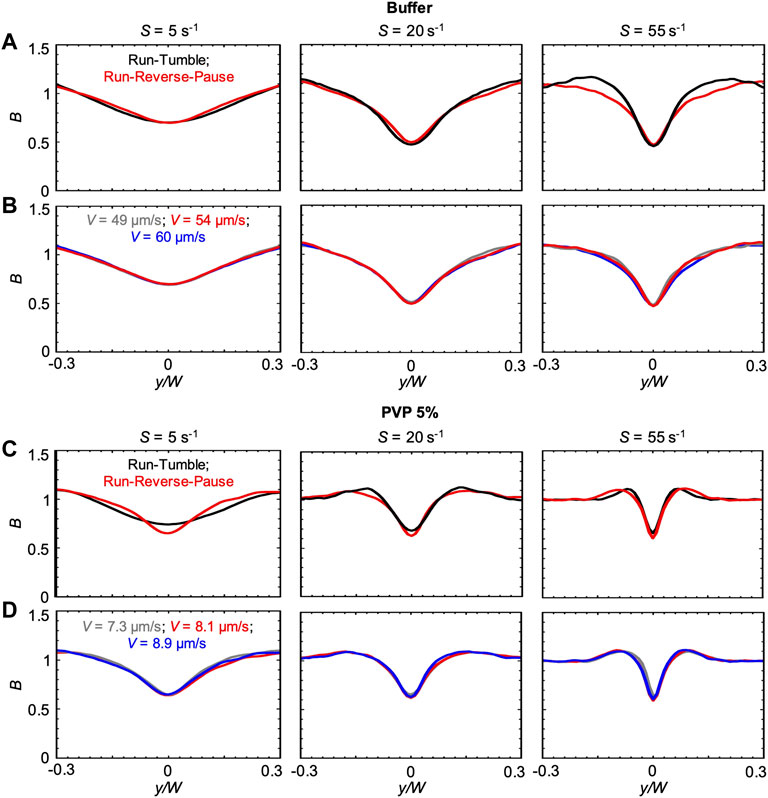
FIGURE 5. (A) Bacterial concentration profiles B numerically calculated according to the mathematical model for mean shear rates S = 5 s−1 (left), S = 20 s−1 (center) and S = 55 s−1 (right) in buffer, at a distance D = 50 cm for swimmers with run-tumble (black) and run-reverse-pause (red) patterns. For the run-tumble swimmers we used q = 9.4, V = 54.17, μms−1, and DR = 1.4 rad2 s−1 as in [29], while the run-reverse-pause swimmers were simulated as described in the Materials and Methods. (B) Bacterial concentration profiles B calculated according to the mathematical model for mean shear rates S = 5 s−1 (left), S = 20 s−1 (center) and S = 55 s−1 (right) in buffer for run-reverse-pause swimmers with a swimming velocity of V = 49 μms−1(grey), 54.17 μms−1 (red) and 60 μms−1 (blue). (C) Bacterial concentration profiles B numerically calculated according to the mathematical model for mean shear rates S = 5 s−1 (left), S = 20 s−1 (center) and S = 55 s−1 (right) in PVP 360 5 w/v %, at a distance D = 50 cm from the inlet for swimmers with run-tumble (black) and run-reverse-pause (red) patterns. For the run-tumble swimmers we used q = 9.4, V = 8.1, μms−1, and DR = 1.4 rad2 s−1 as in [29], while the run-reverse-pause swimmers were simulated as described in the Materials and Methods. (D) Bacterial concentration profiles B calculated according to the mathematical model for mean shear rates S = 5 s−1 (left), S = 20 s−1 (center) and S = 55 s−1 (right) in PVP 360 5 w/v% for run-reverse-pause swimmers with a swimming velocity of V = 7.3 μms−1(grey), 8.1 μms−1 (red) and 8.9 μms−1 (blue).
Non-Newtonian Xanthan Gum Solution Affects P. aeruginosa Motility and Transport
In the non-Newtonian case, the complexity of the bacterial transport is increased by the complex rheological behavior of the carrier fluid. First, due to the shear-thinning behavior of xanthan gum, the shear rate
We characterized the bacterial swimming in xanthan gum solutions at different concentrations, in no-flow conditions. By imaging free-swimming P. aeruginosa cells on the midplane of a 100 µm-high microfluidic channel, we observed that the non-Newtonian nature of the chosen polymer fluid did not affect the run-reverse-pause swimming pattern. As in the case of PVP 360, the average swimming velocity V decreases at increasing polymer concentration (Figure 6A), while the distributions of the swimming velocities v maintain a Gaussian shape (Figure 6B). In the case of xanthan gum, we found a linear relation between V and the polymer concentration c (Materials and Methods). The transit time distribution at 0.1 w/v% xanthan gum concentration followed an exponential curve as in the case of PVP 360, with a median transit time trun = 0.6 s. The distribution of angular changes Δφ showed a peak at π (Figure 6D), as in the case of PVP 360.
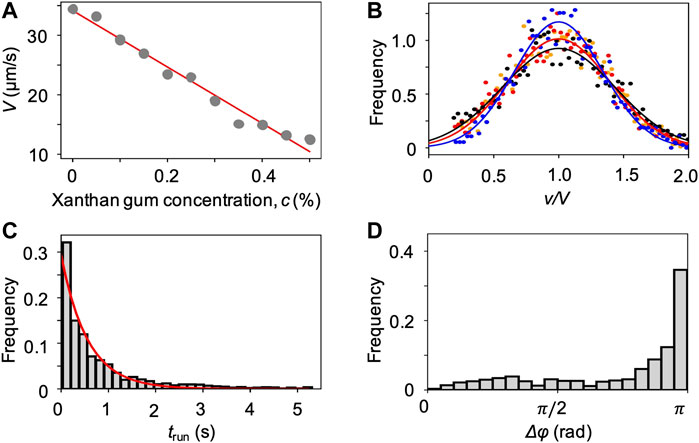
FIGURE 6. (A) Mean swimming velocities V measured by tracking individual cells in a population of P. aeruginosa swimming in xanthan gum solutions at different concentrations in no-flow conditions. The red curve is the linear fit of the experimental data (Eq. 2). (B) Distribution of swimming velocities as a function of the normalized velocity v/V, in buffer (yellow), and in xanthan gum solutions at 0.05 w/v% (red), 0.1 w/v% (black), and 0.2 w/v% (blue) in no-flow conditions. The continuous curves are Gaussian fits with the mean velocities V reported in (A). (C) Distribution of the transit times trun measured by tracking individual cells in a population of P. aeruginosa swimming in the 0.1 w/v% xanthan gum solution. The red curve is the exponential fit of the distribution. (D) Distribution of the angular changes Δφ associated with reverse and pause events, measured by tracking individual cells in a population of P. aeruginosa swimming in the 0.1 w/v% xanthan gum solution.
The characterization of the bacterial swimming in no-flow conditions was aimed at establishing a link between the bacterial swimming parameters for the numerical model and the ambient viscosity in the channel. Ideally, it would have been advisable to characterize the swimming in a polymer solution in flow. However, this would not be possible in the presented experimental configuration. For this reason, we compared the numerical results obtained with three possible models of the bacterial swimming in the non-Newtonian fluid in flow. In the first case, we considered a constant swimming velocity V=V0.1% equal to the one measured in xanthan gum 0.1 w/v% in no-flow conditions; in the second case, we considered a dependence of the swimming velocity on the local ambient viscosity V=V(y); in the third case, we considered a swimming velocity dependent on the average ambient viscosity, V= V(ηS). Our model did not explicitly account for the flagella-induced shear thinning (Materials and methods). However, by simulating the bacterial swimming with the parameters determined from the motility assays in xanthan gum solutions, the shear-thinning enhancement of motility in no-flow conditions is implicitly accounted for.
For the first model, we assumed that the bacterial swimming is not affected by the changes in the ambient viscosity of the carrier fluid. We thus used the bacterial swimming parameters measured in xanthan gum 0.1 w/v% at rest to simulate swimming bacteria in the channel flow (Figure 6). In this case, the effect of the non-Newtonian behavior of xanthan gum in flow was accounted for by the shear rate profile
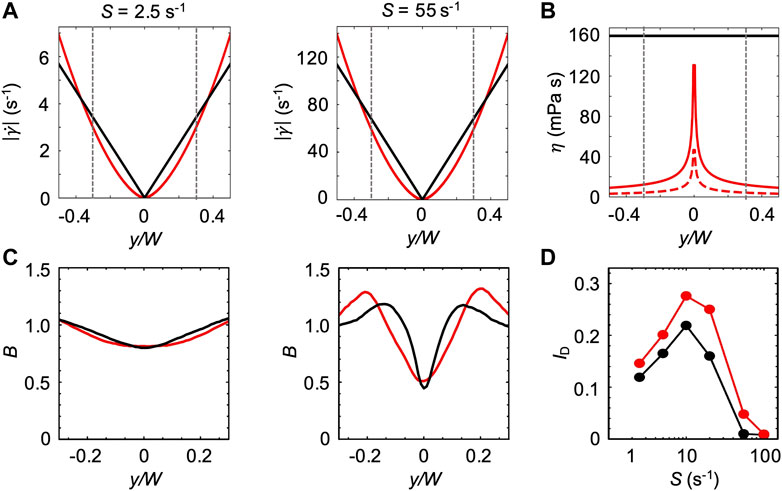
FIGURE 7. (A) Absolute values of the shear rate
Since η(y) is dependent on the position across the channel width and affects bacterial swimming (Figures 2, 6), in the second model, we investigated the effect of η(y) on bacterial swimming by including a dependence of V on position. To do so, we assumed that the dependence of V(y) on η(y) is the same as the one between V and η0 of xanthan gum solutions at different concentrations in no-flow conditions (Materials and Methods). Based on this assumption, we used the relation between V and concentration c as determined in no-flow conditions (Figure 6; Eq. 2), and combined it with the relation between c and η0 (Eq. 3). This allowed us to express V as a function of η0 (Eq. 4). According to our assumption, by assuming that V(η0) and V(η) have the same functional form, we combined Eq. 4 with the power law describing η as a function of
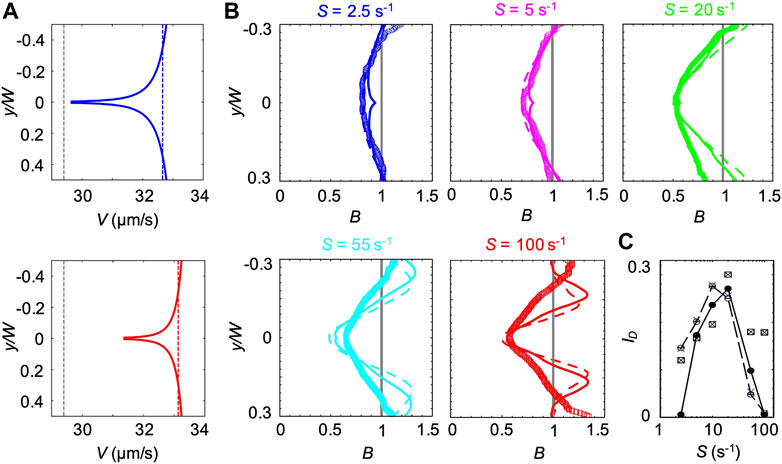
FIGURE 8. (A) Bacterial swimming velocities V(y) (blue and red curve), V(ηS) (blue and red dashed lines) and V0.1% measured in a xanthan gum solution at 0.1 w/v% (grey dashed lines). The velocities are reported for mean shear rates S = 2.5 s−1 (upper panel) and S = 55 s−1 (lower panel). (B) Concentration profiles B of P. aeruginosa from experiments (symbols) and from the mathematical model (V(y) solid lines and V0.1% dashed lines) for mean shear rates S = 2.5 (blue), 5 s−1 (pink), S = 20 s−1 (green), S = 55 s−1 (light blue) and 100 s−1 (red) in a xanthan gum solution at 0.1 w/v%. All the profiles were measured or computed at a distance D = 50 cm from the inlet and normalized by the mean bacterial concentration in the no-flow case. The numerical concentration profiles were obtained by modeling bacterial transport in a straight 50 cm-long channel using two different descriptions for the bacterial swimming velocity (V(y) and V0.1%). (C) The depletion index ID as a function of the mean shear rate S, measured from the experimental (squares) and numerical (V(y), filled circles; V(ηS), crosses; V0.1% empty circles) bacterial concentration profiles reported in (B)
The third model is intermediate between the previous ones. In this case, we used the results from CFD simulations to calculate ηS, defined as the average value of η(y) across the channel at the average shear rate S. Next, we used Eq. 4 to compute the corresponding bacterial swimming velocity V(ηS). V(ηS) is constant across the channel but varies with S (blue and red dashed lines in Figure 8A). We then simulated the bacterial swimming using V(ηS), and the median value of trun and the distribution of
The position-dependent swimming velocity V(y) displayed a minimum at the channel centerline (red and blue solid lines in Figure 8A), where
The experimental B did not display the slight increase in B at the centerline of the channel generated by the spatial dependence of V(y) and showed a better agreement with the profiles obtained at constant swimming velocity (Figure 8B). However, the overall agreement between the experimental and numerical results was satisfactory at shear rates S < 55 s−1, as shown by B and ID (Figures 8B,C). In this case, ID showed a maximum at S ≈ 20 s−1, resembling the buffer case both in the trend and the magnitude (Figure 3B).
We also compared the run-reverse-pause and run-tumble swimming patterns for the case V(y). In agreement with the Newtonian case, we observed that, for run-reverse-pause swimmers, B had the same peak values but different shapes at high values of S (Figure 9A). As already suggested by the negligible differences observed in the numerical results obtained with V0.1% and V(ηS), a 10% difference in the bacterial swimming velocity did not affect B (Figure 9B). This observation is consistent with the Newtonian cases reported in Figure 6B.
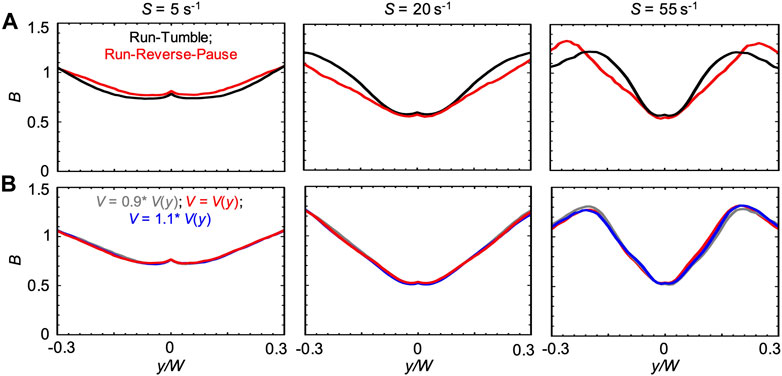
FIGURE 9. (A) Bacterial concentration profiles B numerically calculated according to the mathematical model for mean shear rates S = 5 s−1 (left), S = 20 s−1 (center) and S = 55 s−1 (right) in xanthan gum 0.1 w/v %, at a distance D = 50 cm for swimmers with run-tumble (black) and run-reverse-pause (red) patterns. For the run-tumble swimmers we used q = 9.4, V = 29.4, μms−1, and DR = 1.4 rad2 s−1 as in [29], while the run-reverse-pause swimmers were simulated with swimming velocity V(y), as described in the Materials and Methods. (B) Bacterial concentration profiles B calculated according to the mathematical model for mean shear rates S = 5 s−1 (left), S = 20 s−1 (center) and S = 55 s−1 (right) in xanthan gum at 0.1 w/v %, for run-reverse-pause swimmers with swimming velocities of V(y), calculated according to Eq. 5 (red), V = 0.9 V(y) (grey) and V = 1.1V(y) (blue).
Discussion
How complex fluids may affect the motility of microorganisms has been the subject of several experimental [4, 10–12] and numerical [8, 11, 19] studies. On the other hand, the effect of fluid flow on bacterial transport has been investigated only in simple fluids, where a mechanistic explanation of the interplay between cell motility and hydrodynamic shear resulting in the shear-trapping of bacteria has been given [23–26, 29]. However, the influence of a polymer fluid flow on bacterial transport remained an understudied topic. Here, we focused on bacterial transport in Newtonian and non-Newtonian polymer solutions and showed three major differences from the case of transport in water. First, the reduction of the bacterial swimming velocity V in Newtonian polymer solutions reduces bacterial depletion from the center of the channel. Second, it increases the distance D required to reach the steady-state distribution across the channel. Third, in the case of a non-Newtonian polymer solution in flow, bacterial depletion from the center of the channel is not reduced, even if the zero-shear viscosity of the fluid is much higher than the one of water. In this case, our mathematical model only captured the overall behavior of the bacterial transport. However, due to the approximations made in the model, the proposed investigation did not intend to be exhaustive. Instead, it aims at proposing a possible simplified procedure to macroscopically describe this complex problem.
The polymeric nature of the fluid plays a fundamental role in determining the motility of bacteria in no-flow conditions. In the case of P. aeruginosa swimming in Newtonian PVP 360 and non-Newtonian xanthan gum solutions, the swimming pattern did not change and could be described as run-reverse-pause in all the tested fluids. Similarly, the shape of the distribution of swimming velocities v and transit times trun remained the same. In contrast, the mean swimming velocities V and the median of trun showed significant changes, the extent of which depended on the type of polymer and its concentration in solution. In our case, the investigation in no-flow conditions was instrumental to determine the parameters describing bacterial motility to be used in the mathematical model of bacterial transport in flow.
In our study, V decreased at increasing polymer concentration, both in the Newtonian and non-Newtonian cases. Our results are consistent with recent work on Vibrio cholerae in PVP 360 with concentrations ranging from 0.9 to 6.7 w/w% and 1.2 w/w% mucin [7]. Conversely, previous studies performed with Escherichia coli [10] and P. aeruginosa [4] in PVP 360 showed an increase in the velocity of the order of 10% at concentrations in the range between 1—2 w/v %. Considering our modelling results, a possible 10% variation in the mean swimming velocity would not affect the transport properties in all the investigated polymer fluids (Figures 5B, 9). Conversely, shear-induced depletion was affected by the significant decrease of V in the PVP 360 concentration range we tested, where our results on motility are consistent with previous findings. Despite the drastic reduction of cell motility with increasing concentration of PVP360, we observe that the increase in transit time trun still makes it possible to experimentally observe depletion at a distance D = 50 cm from the inlet of the channel even for the 10 w/v% solution. In the non-Newtonian case, the xanthan gum solution used in our study did not induce an enhancement of the swimming velocity observed, for example, for E. coli in Methocel [11] and in carboxy-methyl cellulose [12], but not for V. cholerae in mucin [7]. Given the complex interplay between flagellar motility and rheology of polymer fluids [11, 19], the differences in the observations could be attributed to the particular bacterium and polymer we chose.
The mathematical model accounts for the change in viscosity and bacterial motility of the different solutions. However, it does not account for the microscopic structure of the polymeric fluids, the possible structural changes caused by the shear flow, and the consequent impact they would have on bacterial motility. The discrepancies between the concentration profiles B obtained with the experiments and the numerical simulations at high shear rates and high concentrations in PVP 360 and at high shear rates in the xanthan gum solution could be explained in light of the shear-induced structural rearrangements of the suspending fluid at the microscale. In these cases, the bulk rheological behavior may not be sufficient to fully capture the complex interplay between bacterial motility and the polymeric fluid structure described in [11, 19]. However, our simplified model was able to describe the overall trend of the shear-induced depletion, indicating that the rheology of the fluid and a realistic description of the bacterial swimming pattern are the most important factors driving bacterial transport in flow.
Interestingly, although the viscosity of PVP 360 5 w/v% (η = 38 mPa s, Figure 1B) is significantly lower than the zero-shear viscosity of the xanthan gum solution (η0 = 160 mPa s, Figure 1C), the shear-induced depletion was consistently lower in the Newtonian PVP 360 case. In the non-Newtonian case, the similarity between the experimental and the numerical B profiles obtained at constant bacterial swimming velocity (V0.1% and V(ηS)) suggests that two main factors contribute to the strong depletion observed in the non-Newtonian case: the high value of the bacterial swimming velocity V (Figure 6A) and the non-Newtonian shear rate profile
Given the impact of shear-induced depletion on surface colonization [23, 29] and bacterial chemotaxis [23, 26], our findings could have substantial medical and technological implications. For example, the respiratory, gastrointestinal, and reproductive tracts of animals are covered in mucus [1], a complex polymer fluid which is continuously stirred by ciliary motion. In these systems, a realistic description of bacterial transport and surface colonization would require to take into account the interplay between shear rate, cell motility and fluid rheology. By describing two prototypical cases, we hope to raise the interest of the community and foster further investigation in more complex scenarios, contributing to the creation of a more accurate description of bacterial transport in polymer solutions.
Data Availability Statement
The original contributions presented in the study are included in the article/Supplementary Material, further inquiries can be directed to the corresponding author.
Author Contributions
ES, RR, and RS designed research. GS, ES, TC, and YL performed the experiments. GS and ES analysed all the data. SG performed the rheological characterization of the polymer solutions. GS, ES, and RR designed and built the mathematical model. GS and ES wrote the manuscript and all authors edited and commented on the manuscript.
Funding
The authors acknowledge support from SNSF PRIMA grant 179834 (to ES), from a Symbiosis in Aquatic Systems Investigator Award from the Gordon and Betty Moore Foundation (GBMF9197; https://doi.org/10.37807/GBMF9197) (to RS), and from Simons Foundation Grant 542395 (to RS) as part of the Principles of Microbial Ecosystems Collaborative (PriME). Open access funding provided by ETH Zurich.
Conflict of Interest
The authors declare that the research was conducted in the absence of any commercial or financial relationships that could be construed as a potential conflict of interest.
Publisher’s Note
All claims expressed in this article are solely those of the authors and do not necessarily represent those of their affiliated organizations, or those of the publisher, the editors and the reviewers. Any product that may be evaluated in this article, or claim that may be made by its manufacturer, is not guaranteed or endorsed by the publisher.
Acknowledgments
The authors acknowledge Dr. Sam Charlton and Ursin Eberhard for the insightful discussions; Ela Burmeister for the technical support.
References
1. Lai SK, Wang Y-Y, Wirtz D, Hanes J. Micro- and Macrorheology of Mucus. Adv Drug Deliv Rev (2009) 61:86–100. doi:10.1016/j.addr.2008.09.012
2. Morgan SE, McCormick CL. Water-soluble Polymers in Enhanced Oil Recovery. Prog Polym Sci (1990) 15:103–45. doi:10.1016/0079-6700(90)90017-U
3. Sunthar P. Polymer Rheology. In: JM Krishnan, AP Deshpande, and PBS Kumar, editors. Rheology of Complex Fluids. New York, NY: Springer (2010). p. 171–91. doi:10.1007/978-1-4419-6494-6_8
4. Schneider WR, Doetsch RN. Effect of Viscosity on Bacterial Motility. J Bacteriol (1974) 117:696–701. doi:10.1128/jb.117.2.696-701.1974
5. Berg HC, Turner L. Movement of Microorganisms in Viscous Environments. Nature (1979) 278:349–51. doi:10.1038/278349a0
6. Kaiser GE, Doetsch RN. Enhanced Translational Motion of Leptospira in Viscous Environments. Nature (1975) 255:656–7. doi:10.1038/255656a0
7. Grognot M, Mittal A, Taute KM. Vibrio cholerae Motility in Aquatic and Mucus-Mimicking. Appl Environ Microbiol (2021) 87:e01293–21. doi:10.1128/aem.01293-21
8. Keller JB. Effect of Viscosity on Swimming Velocity of Bacteria. Proc Natl Acad Sci U.S.A (1974) 71:3253–4. doi:10.1073/pnas.71.8.3253
9. Magariyama Y, Kudo S. A Mathematical Explanation of an Increase in Bacterial Swimming Speed with Viscosity in Linear-Polymer Solutions. Biophysical J (2002) 83:733–9. doi:10.1016/S0006-3495(02)75204-1
10. Martinez VA, Schwarz-Linek J, Reufer M, Wilson LG, Morozov AN, Poon WCK. Flagellated Bacterial Motility in Polymer Solutions. Proc Natl Acad Sci U.S.A (2014) 111:17771–6. doi:10.1073/pnas.1415460111
11. Qu Z, Breuer KS. Effects of Shear-Thinning Viscosity and Viscoelastic Stresses on Flagellated Bacteria Motility. Phys Rev Fluids (2020) 5:1–14. doi:10.1103/PhysRevFluids.5.073103
12. Patteson AE, Gopinath A, Goulian M, Arratia PE. Running and Tumbling with E. coli in Polymeric Solutions. Sci Rep (2015) 5:1–11. doi:10.1038/srep15761
13. Li C, Qin B, Gopinath A, Arratia PE, Thomases B, Guy RD. Flagellar Swimming in Viscoelastic Fluids: Role of Fluid Elastic Stress Revealed by Simulations Based on Experimental Data. J R Soc Interf (2017) 14:20170289. doi:10.1098/rsif.2017.0289
14. Qin B, Gopinath A, Yang J, Gollub JP, Arratia PE. Flagellar Kinematics and Swimming of Algal Cells in Viscoelastic Fluids. Sci Rep (2015) 5:9190. doi:10.1038/srep09190
15. Kamdar S, Shin S, Leishangthem P, Francis LF, Xu X, Cheng X. The Colloidal Nature of Complex Fluids Enhances Bacterial Motility. Nature (2022) 603:819–23. doi:10.1038/s41586-022-04509-3
16. Liu B, Powers TR, Breuer KS. Force-free Swimming of a Model Helical Flagellum in Viscoelastic Fluids. Proc Natl Acad Sci U.S.A (2011) 108:19516–20. doi:10.1073/pnas.1113082108
17. Spagnolie SE, Liu B, Powers TR. Locomotion of Helical Bodies in Viscoelastic Fluids: Enhanced Swimming at Large Helical Amplitudes. Phys Rev Lett (2013) 111:1–5. doi:10.1103/PhysRevLett.111.068101
18. Qu Z, Temel FZ, Henderikx R, Breuer KS. Changes in the Flagellar Bundling Time Account for Variations in Swimming Behavior of Flagellated Bacteria in Viscous media. Proc Natl Acad Sci U.S.A (2018) 115:1707–12. doi:10.1073/pnas.1714187115
19. Zöttl A, Yeomans JM. Enhanced Bacterial Swimming Speeds in Macromolecular Polymer Solutions. Nat Phys (2019) 15:554–8. doi:10.1038/s41567-019-0454-3
20. Wheeler JD, Secchi E, Rusconi R, Stocker R. Not just Going with the Flow: The Effects of Fluid Flow on Bacteria and Plankton. Annu Rev Cel Dev. Biol. (2019) 35:213–37. doi:10.1146/annurev-cellbio-100818-125119
21. Rusconi R, Stocker R. Microbes in Flow. Curr Opin Microbiol (2015) 25:1–8. doi:10.1016/j.mib.2015.03.003
22. Son K, Brumley DR, Stocker R. Live from under the Lens: Exploring Microbial Motility with Dynamic Imaging and Microfluidics. Nat Rev Microbiol (2015) 13:761–75. doi:10.1038/nrmicro3567
23. Rusconi R, Guasto JS, Stocker R. Bacterial Transport Suppressed by Fluid Shear. Nat Phys (2014) 10:212–7. doi:10.1038/NPHYS2883
24. Ezhilan B, Saintillan D. Transport of a Dilute Active Suspension in Pressure-Driven Channel Flow. J Fluid Mech (2015) 777:482–522. doi:10.1017/jfm.2015.372
25. Stark H. Swimming in External fields. Eur Phys J Spec Top (2016) 225:2369–87. doi:10.1140/epjst/e2016-60060-2
26. Bearon RN, Hazel AL. The Trapping in High-Shear Regions of Slender Bacteria Undergoing Chemotaxis in a Channel. J Fluid Mech (2015) 771:1–13. doi:10.1017/jfm.2015.198
27. Miño GL, Baabour M, Chertcoff R, Gutkind G, Clément E, Auradou H, et al. E. coli Accumulation behind an Obstacle. AiM (2018) 08:451–64. doi:10.4236/aim.2018.86030
28. Altshuler E, Miño G, Pérez-Penichet C, Río Ld., Lindner A, Rousselet A, et al. Flow-controlled Densification and Anomalous Dispersion of E. coli through a Constriction. Soft Matter (2013) 9:1864–70. doi:10.1039/c2sm26460a
29. Secchi E, Vitale A, Miño GL, Kantsler V, Eberl L, Rusconi R, et al. The Effect of Flow on Swimming Bacteria Controls the Initial Colonization of Curved Surfaces. Nat Commun (2020) 11:2851. doi:10.1038/s41467-020-16620-y
30. Słomka J, Alcolombri U, Secchi E, Stocker R, Fernandez VI. Encounter Rates between Bacteria and Small Sinking Particles. New J Phys (2020) 22:043016. doi:10.1088/1367-2630/ab73c9
31. Mcdonald JC, Duffy DC, Anderson JR, Chiu DT, Wu H, Schueller OJA, et al. Fabrication of Microfluidic Systems in Poly(dimethylsiloxane). Electrophoresis (2000) 21:27–40. doi:10.1002/(sici)1522-2683(20000101)21:1<27::aid-elps27>3.0.co;2-c
32. Wyatt NB, Liberatore MW. Rheology and Viscosity Scaling of the Polyelectrolyte Xanthan Gum. J Appl Polym Sci (2009) 114:4076–84. doi:10.1002/app.31093
33. Cai Q, Li Z, Ouyang Q, Luo C, Gordon VD. Singly Flagellated Pseudomonas aeruginosa Chemotaxes Efficiently by Unbiased Motor Regulation. MBio (2016) 7:7. doi:10.1128/mBio.00013-16
34. Qian C, Wong CC, Swarup S, Chiam K-H. Bacterial Tethering Analysis Reveals a "Run-Reverse-Turn" Mechanism for Pseudomonas Species Motility. Appl Environ Microbiol (2013) 79:4734–43. doi:10.1128/AEM.01027-13
Keywords: bacterial motility, poiseuille flow, polymer solution, microfluidics, rheology, Pseudomonas aeruginosa
Citation: Savorana G, Geisel S, Cen T, Ling Y, Stocker R, Rusconi R and Secchi E (2022) Transport of Pseudomonas aeruginosa in Polymer Solutions. Front. Phys. 10:910882. doi: 10.3389/fphy.2022.910882
Received: 01 April 2022; Accepted: 31 May 2022;
Published: 30 June 2022.
Edited by:
Xiang Cheng, University of Minnesota Twin Cities, United StatesReviewed by:
Bin Liu, University of California, Merced, United StatesHarold Auradou, Fluides, Automatique et Systèmes Thermiques (FAST), France
Copyright © 2022 Savorana, Geisel, Cen, Ling, Stocker, Rusconi and Secchi. This is an open-access article distributed under the terms of the Creative Commons Attribution License (CC BY). The use, distribution or reproduction in other forums is permitted, provided the original author(s) and the copyright owner(s) are credited and that the original publication in this journal is cited, in accordance with accepted academic practice. No use, distribution or reproduction is permitted which does not comply with these terms.
*Correspondence: Eleonora Secchi, esecchi@ethz.ch