A multilayer network model for studying the impact of non-pharmaceutical interventions implemented in response to COVID-19
 Peiyu Chen1*
  Xudong Guo1
  Zengtao Jiao2 Shihao Liang2 Linfeng Li2 Jun Yan2 Yadong Huang1 Yi Liu1 Wenhui Fan1
- 1Department of Automation, Tsinghua University, Beijing, China
- 2Yidu Cloud AI Lab, Yidu Cloud (Beijing) Technology Co., Ltd., Beijing, China
Non-pharmaceutical interventions (NPIs) are essential for the effective prevention and control of the COVID-19 pandemic. However, the scenarios for disease transmission are complicated and varied, and it remains unclear how real-world networks respond to the changes in NPIs. Here, we propose a multi-layer network combining structurally fixed social contact networks with a time-varying mobility network, select the COVID-19 outbreak in two metropolitans in China as case studies, and assess the effectiveness of NPIs. Human mobility, both in relatively fixed places and in urban commuting, is considered. Enclosed places are simulated by three different types of social contact networks, while urban commuting is represented by a time-varying commute network. We provide a composite framework that captures the heterogeneity and time variation of the real world and enables us to simulate large populations with low computational costs. We give out a thorough evaluation of the effectiveness of NPIs (i.e., work from home, school closure, close-off management, public transit limitation, quarantine, and mask use) under certain vaccine coverage varying with implementation timing and intensity. Our results highlight the strong correlation between the NPI pattern and the epidemic mitigation effect and suggest important operational strategies for epidemic control.
Introduction
In the ongoing COVID-19 pandemic, more than 200 countries have reported 179,723,542 confirmed cases and 3,894,122 deaths by 25 June 2021 [1]. Most countries implemented strict non-pharmaceutical interventions (NPIs) for epidemic prevention and control. Mathematical modeling has been widely used to study the impact of NPIs on the COVID-19 pandemic [2–14] focusing on the impact of face mask use. The study mentioned in references [7, 9, and 12] studied the influence of the lockdown; the study mentioned in reference [10] considered the effects of a range of different testing, isolation, tracing, and physical distancing scenarios; the study mentioned in reference [15] investigated the role of public health interventions during the early COVID-19 epidemic in China; the study mentioned in reference [16] studied the effects of lockdown and medical resources; the study mentioned in reference [11 and 17] estimated the impact of travel restrictions, as well as travel duration; and the study mentioned in reference [13] quantified the impact of physical distance measures.
Compared to mean-field compartmental models, agent-based epidemic models represent more detailed descriptions of the epidemic spreading in the real world. Its ability to model contact tracing allows for human mobility to be studied in detail. Human mobility pattern is acknowledged as one of the essential aspects of the epidemic spreading [17]. Relatively fixed places such as schools, workplaces, or conferences and high mobility places such as subways, buses, and airplanes are two essential types of locations for the transmission of pathogens.
On one hand, human mobility in relatively fixed places such as schools, workplaces, and communities has been studied [18, 19]. To study these microscale policies being used to respond to the COVID-19 pandemic, agent-based influenza pandemic models have been commonly developed to evaluate the impact of NPIs [ and 20 –22]. They studied several lockdown policies in Singapore in the early spread of COVID-19. Chang et al. [21] evaluated the impact of case isolation, home quarantine, and social distancing with varying levels of compliance, and school closures in Australia. Kucharski et al. [10] simulated the effect of a range of different testing, isolation, tracing, and physical distancing scenarios in the United Kingdom. Isella et al. [22] studied human mobility at a scientific conference and a museum exhibition by a static interaction network.
On the other hand, human mobility in the urban commuting demand between highly frequented locations is also a key factor for pathogens transmissions. Based on information from urban commuting, epidemiological contact network models have been built as an alternative to studying the impact of human mobility on epidemic spreading [18, 23–25] and construct the time-varying vehicle social encounter network with the help of public transport smart card data. However, owing to the high computation cost of the agent-based modeling method, the population size of the agent-based model is limited. Also, some studies turn to focus on one aspect of human mobility avoiding computational limitations. A thorough study of the epidemic spreading based on agent-based models, including social contact networks, is worth studying.
Different from the mentioned studies, which focus on repetitive social contact or urban commuting, we proposed a multi-layer network that takes both of them into consideration. Our work aims to model the real epidemiological contact networks in detail with the mass population. Our model considers different contact patterns (i.e., repetitive social contacts and contacts through daily transit), capturing the heterogeneity and time-varying nature of human mobility. We use the agent-based model, including three types of social contact networks for repetitive social contact modeling and a time-varying network for contact in urban commuting.
The development of the COVID-19 vaccine and how the NPIs influence the epidemic spreading in high-risk countries with the availability of COVID-19 vaccines is a major concern for national governments in the near future. We use the epidemic data from a second wave in two metropolises in China (i.e., Beijing and Guangzhou) as cases. Based on our multi-layer network, we study the impact of school closure, close-off community management, work from home, public transit restrictions, mask use, and quarantine. In other words, we examine the NPIs on account of mobility patterns both for the government and individuals. We derive a series of suggestions for slowing down epidemic spread from our simulation results. The main contributions of our study are as follows:
a) Propose a multi-layer network, where human mobility in relatively fixed places and in urban commuting are both considered.
b) Raise a simulation-based solving framework, which enables to simulate epidemic to spread in a large population with low computational costs.
c) Heterogeneous implementation of NPIs between tracks or even between families is studied and the outcome of such analysis can give a more diverse and detailed evaluation of NPIs.
The rest of the study is organized as follows. In section 2, we introduce the methodology of establishing the multi-layer contact networks and modeling the dynamic of epidemic transmission. In section 3, we analyze the NPIs using real-world cases and study the effectiveness of each NPI. In section 4, discussion and conclusion are made and policy suggestions are offered.
Material and methods
Agent-based model
We consider a population of n individuals resembling the actual population structure of Beijing and Guangzhou according to basic sociodemographic indicators (e.g., age structure, household size, employment rates, workgroup distribution, school size distribution, and commuting data). Our agent-based model is based on FluTE [26], which is a publicly available stochastic influenza epidemic simulation model. The population is partitioned into a set of geographical administrative districts D = 1, … , k, and each district is divided into several communities Cd = 1, … , l. Each community is separated by households of different sizes and ndc is the number of individuals in the cth community. The household is the closest social contact unit and the distance between individuals is organized as a hierarchy that the contact rate decreases with the increase of the social contact unit (i.e., household, household cluster, community, and district).
Different from the social networks built by FLuTE, workers’ daily commute is considered and more detailed NPIs are designed in our proposed multi-layer network. Details of our model are described as follows. Daily contact is defined in four settings, where influenza transmission occurs, namely communities, schools, workplaces, and public transportation. As shown in Figure 1, each layer represents one of the settings and contacts that happen in school, workplace, and household layers are relatively independent and in step with each other. The links between nodes represent the possible channels of disease transmission. Unlike the other three layers, the community layer [described in section (c)], which simulates contacts that happen in public transportation, is asynchronous with other layers. In other words, social contacts for the same individual can happen both in the community layer and other layers in a time step. In the community layer, nodes in the macroscopic diagram represent communities, while in the microscopic diagram, each node represents a person. Here, the amount of nodes in each household is determined by sampling from the actual household size distribution. An age group is associated with each node following the actual age distribution by household size. Referring to the multinomial distribution of schooling and employment rates by age, each node is determined whether it also participates in the school or workplace layer. Analogously to what has been described for the household layer, the workplace layer is composed of nw disconnected components, each one representing a workplace. The number of nodes in each workplace is sampled from the actual workplace size distribution. Individuals in each workplace are further subdivided into several workgroups, which are regarded as the smallest contact units in the workplace layer. The school layer is composed of ns disconnected components, each one representing a school. The number of nodes in each school is sampled from the actual school size distribution by school level (e.g., pre-school, primary school, middle school, and high school). In addition, the individuals only interact in the community layer during the night.
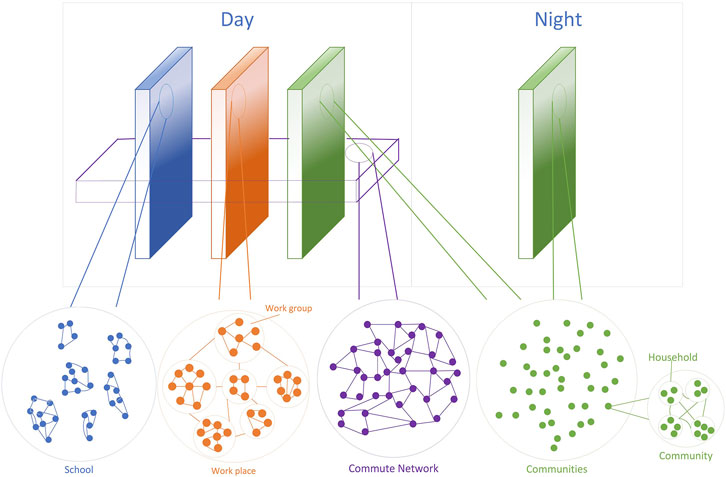
FIGURE 1. Model structure. Visualization of the multi-layer network separating the day and night social contact structure. Note that individuals (the nodes) transit between layers relies on the commute layer, which is interspersed among other layers.
Disease dynamics
As shown in Figure 2, we describe the influenza transmission process as a discrete-time susceptible–undiagnosed–infectious–ascertained–removed (SUIAR) model with time step t (corresponding to half of a day). The population is divided into five classes according to the individuals’ state of disease: susceptible (S, those who may come in contact with an infectious person and enter the undiagnosed state before being infected), undiagnosed (U, the asymptomatic or mildly symptomatic infectious without hospitalization or isolation who are not diagnosed and have the probability of transmitting disease to susceptible), infectious (I, those who are infected and diagnosed), ascertained (A, a transient state between infectious and recovered state), and recovered (R, those who have died or recovered would be removed from the epidemic propagation process). Compared with the typical SEIR model, there are two differences that need to be explained. Firstly, the exposed state, which denotes those who have been infected but cannot transmit it has been replaced by the undiagnosed state, which is more similar to the infectious state. This can be explained by the fact that virus such as COVID-19 is highly infectious during the incubation period, so the individuals in the exposed state play little role in our model. Besides, the individuals in the undiagnosed state play an essential role in virus spreading and need to be traced and tracked carefully. Secondly, an ascertained state is added to our model. Those who are infected and diagnosed (state I) need to be reexamined and once confirmed, they would be in the ascertained state. It should be noted that although the infectious are contagious, they have already been isolated, that is, the virus transmission channel between infectious and susceptible individuals has been cut down.

FIGURE 2. Schematic of the disease dynamic. Individuals may be in five states: susceptible (S) to the disease, infected but undiagnosed (U), Infectious (I) but yet not ascertained, ascertained (A), and recovered or dead (R).
We define Si,t, Ui,t, Ii,t, Ai,t, Ri,t as the Bernoulli random variable that individual I would be in one state at time t. Here, Si,t + Ui,t + Ii,t + Ai,t + Ri,t = 1,
where pri and prs are two personal attributes. To be specific, the former means the probability for undiagnosed individuals to infect others, while the latter means the probability to be infected by undiagnosed individuals. Here, prs is given:
where BVEs represents the baseline vaccine efficiency for susceptible individuals, VEs means the vaccine efficiency for susceptibility, and EFF [γi] represents the vaccine efficiency associated with the age groups. Besides, θl,i,j is the contact weight in layer l between individual i and j, l ∈ L = {c, s, w}, where L is the set of layers, c, s, and w represent communities, school, and workplace, respectively. The value of θl,i,j is also related to the contact place, the individual’s age group, and the NPIs implemented in time t. For instance, if the contact infection happens in the community layer, θc,i,j can be expressed as follows:
where Mi ∈ [0, 1] is the protection rate of mask the individual worn, the smaller the rate is the more effective the protection is.
Similarly, if the contact infection happens in workplace layer, θw,i,j can be expressed as follows:
where cpw [γi] represent the contact rate between individual i and j in the workplace for the age group γi. If the contact infection happens in school layer, θs,i,j can be expressed as follows:
where cps [γi] represent the contact rate between individual i and j in school for the age group γi.
The probability of S → U for individual i can be expressed as λi = 1 − ∏j∈U (1 − λi,j,t), where Σj∈Uλi,j,t ≤ 1. μ is the probability of U → I. T1 and T2 are the time delay for I → A and A → R, respectively. Based on Eqs 1–5, the one-to-one transmission probability can be calculated. To give an overall understanding of the dynamics, the epidemic transmission process is summarized as the following system equations:
Calculating p(Si,t = 1, Uj,t = 1) requires the joint distribution of Si,t and Uj,t, which is usually unavailable. According to individual-based mean-field approximation, we assume that Si,t and Uj,t are independent. Therefore, this leads to
It should be noted that Eqs 6–11 are only raised for understanding the disease dynamics but not for model realization.
Commute network
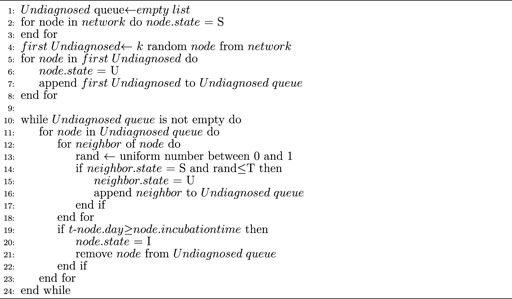
The commute network is constructed by the Erdős-Rényi model Erdos et al. [27], which is based on approximately Poisson degree distribution. Each undiagnosed individual has the opportunity to infect other susceptible individuals through social contacts, which are organized in non-chronological and arbitrary order. The commute network is probabilistic breadth-first traversal and it maintains four types of node lists: i. Susceptible, ii. Newly-undiagnosed, iii. Currently-undiagnosed, and iv. Infected. The epidemic dynamic based on the node list is described in Algorithm 1. For initialization, a fixed number of nodes will be placed into the currently-undiagnosed list, while the rest of the nodes remain in the susceptible list. In each time step, the following procedures may occur if there are exposed commuting workers at time t, otherwise, the commute simulation would be skipped. Here, T means the probability for S state individuals to be infected by their infected neighbors.
1) For nodes in the currently-infected node list, a randomly generated number between 0 and 1 is allocated for each edge connecting to the neighbor of susceptible nodes. The state of the susceptible neighbor would transmit to “Undiagnosed” if the random number is smaller than the transition probability in the commute network (α mentioned in Supplementary Material). And it would be deleted from the susceptible list and added to the end of the newly-undiagnosed list.
2) After all the nodes in the currently-undiagnosed list have been checked in the procedure (1) for disease transmission, the nodes in the newly-infected list are moved to the currently-infected list.
3) For nodes in the currently-infected node list, the infection time for each node would be calculated and once the infection time is longer than the individual’s virus latent duration, the node would be moved to the infected list.
Algorithm 1. Epidemic dynamic in commute network.
Here, the commute network could not predict the real chains of the transmission, since infections happen in cohorts and the sequence of transmission events is in arbitrary order. To reduce the computational costs, the state of nodes the in commute layer would be returned to the agent-based model and the chain of transmission would be tracked in the agent-based events.In terms of the conversion of the node types, the commute flows are randomly reconnected in each time step, while retaining the connectivity between commute workers (mentioned in “Algorithm 1” in Supplementary Material). The random reconnect procedure is constructed as follows: 1) shuffle the susceptible node list, 2) choose a fixed number of nodes in the susceptible node list in order and break all the related edges, and 3) randomly reconnect all the broken edges and check the completion of commute network. This process randomly reconnects the commuter flows, which represents the changes in commuter routes in the real world.
Simulation-Based Solving Framework
In the previous agent-based models [24, 26, and 28], the social contacts of each agent are included, which are time-consuming, especially for contacts in urban commuting. Different from them, the proposed multi-layer network with a time-varying commute network overcomes two difficulties. Firstly, the agent-based model, considering one-to-one contagious behavior with heterogeneous networks, is time-consuming for modeling transit contacts. Secondly, the agent-based modeling method is highly dependent on data granularity. However, the commute network varied from second to second, which deals with a large quantity of data. For example, for an N commuters network, the commute data are sampled n times per half day. At each time step t, the one-to-one contact probability is considered for each person in state S, where the complexity is O(N2n). For a T time intervals simulation, the total time complexity is O(N2nT). Besides, the network structure and the state for each node need to be stored at each time step, hence, the space complexity is O(N2nT). Such time and space complexity restricts the simulation scale and is hard to scale up population size at the city level. Our solving framework (Supplementary Material, Algorithm 1), which can be regarded as a sparse network effectively simplifies the simulation. Only strong edges between susceptible nodes and exposed nodes rather than the entire contact network are considered. And the mutual contacts in a commuter are constructed as a network, in other words, the commute network is relatively fixed in a time interval. Based on this way, the time complexity can be reduced to O (kNT), where
Model Calibration
The model is calibrated to reproduce the COVID-19 during the 2020.02 COVID-19 outbreak in Beijing (supplemental material) and the 2021.05 outbreak in Guangzhou. It is noted that the epidemic in Beijing studied in our work is a case without an available vaccine, while the epidemic in Guangzhou is simulated with certain vaccine coverage. So far vaccines are available in most of the countries, we mainly focus on the question of how the NPIs work on epidemic prevention, and the simulation for the 2020.02 outbreak in Beijing is used for model validation presented in the supplemental material. The epidemiology parameters are referred to in the literature [3, 6, and 29], and the mobility data are obtained from Qian et al. [30]. The officially reported cases are based on for Disease Prevention and Control [31,32], and the data for population structure is captured from [33 and 34]. Based on the census, the population is divided into five groups by age (0–4 year old, 5–18 year old, 19–29 year old, 30–64 year old, and 65 and older). The mobility rate, contact probability, and viral load vary in different age groups. Population in Beijing and Guangzhou are divided into 16 and 11 tracts according to the number of administrative districts.
We calibrated the model by the daily reported cases for Disease Prevention and Control [31 and 32]. The NPIs that governments had implemented are also considered in model calibration. Note that about 50% of working-age citizens have already been vaccinated before the second outbreak of COVID-19 in Guangzhou. To simulate cases, where vaccines are available, our model takes the vaccine efficiency, inoculation coverage, and individuals, who are allowed to be vaccinated into account. We take as a reference the vaccination applied in Guangzhou, the reported clinical trial results of CoronaVac [35] and identify the vaccination-related parameters through available data.
The Guangzhou government imposed strict lockdown measures after the first was case confirmed on 21 May 2021. Schools and workplaces in medium and high-risk areas are closed and social contacts in related communities were also reduced by strict entry and exit control policies. Besides, restrictions on public transport (e.g., bus routes and subway stations within the prevention and control region were suspended, and limiting the public transport capacity) were taken to slow down the spread of the virus. We accounted for the effect of mobility restrictions by setting the coverage and duration of the NPIs according to the publicity available data from the Chinese government. To provide quantification of the extent of NPIs that would be needed to prevent the second wave of COVID-19, several parameters are introduced to model NPIs (Supplementary Material, Section 1; Table1). In the calibrated model we use the reported policy-related data as well as the quantified parameters according to the actual situation to model the NPIs enforced by the Chinese local government.
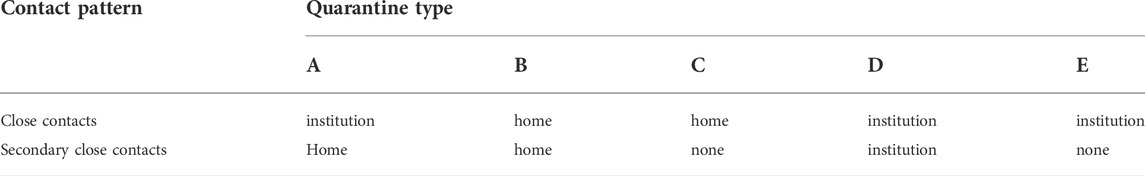
TABLE 1. Different types of quarantine policies. “Home” means home-based quarantine and “institution” means institution-based quarantine. Five types (A–E) of quarantine policies are studied.
Specifically, the probability of duration for the incubation period in days is taken from Lauer et al. [29], and the basic production number is estimated by Read et al. [36]. The values of contact probability are estimated by fitting the daily evolution of reported infections in COVID-19 in Guangzhou and Beijing (Supplementary Material Table S2). These contact probabilities are in general agreement with other simulation models for Disease Prevention and Control [31]. Figure 3 presents the output of the calibrated model and the reported real-world data. We did an automated search for the optimal values of the number of the per-contact layer-dependent disease transmission probabilities and the contact probabilities within or without groups that minimized the sum of squared differences between the model’s estimates of confirmed cases. The simulation is carried out 100 times under each parameter setting and takes its average output as the result for model calibration. The randomness of the model is reflected in the set of the random seed. The random seed is selected randomly in each round of the simulation, which ensures the randomness of the simulation. In Figure 3, the blue shading represents the 95% confidence interval, which is calculated by the results of 100 times simulation under different random seeds. And the blue curve represents the mean value of the results.
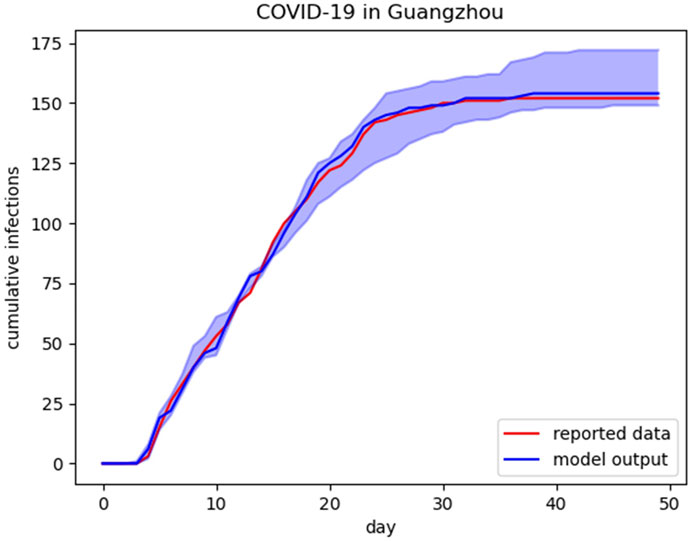
FIGURE 3. Calibration. Blue curve illustrates the predictions from the model and red curve is actual cumulative infections data. The blue shading represents the 95% CI for the simulation results.
Note that our model adopts a commute layer to capture the potential social contact by daily commute. In order to disentangle the contribution of commute in halting the COVID-19 spreading, we block the channel of virus transmission through the commute and compare the increasing trend of diagnoses and the final scale of the outbreak with the output of the original calibrated model. As shown in Figure 4, about 8.5% of cumulative infections decrease when the virus transmitted by daily commute is cut down. There is no denying that the model without a commute network layer can also be calibrated to fit the reported epidemic data. However, the contact probabilities in other places such as schools, workplaces, and households in the model without commute network layer can be overestimated for the virus transitions through daily commute are miscategorized into other human activities. Our results suggest that the commute network can be an essential mediate in the spread of the virus for the spread of epidemic slows down when the commute-based virus transmission is cut down.
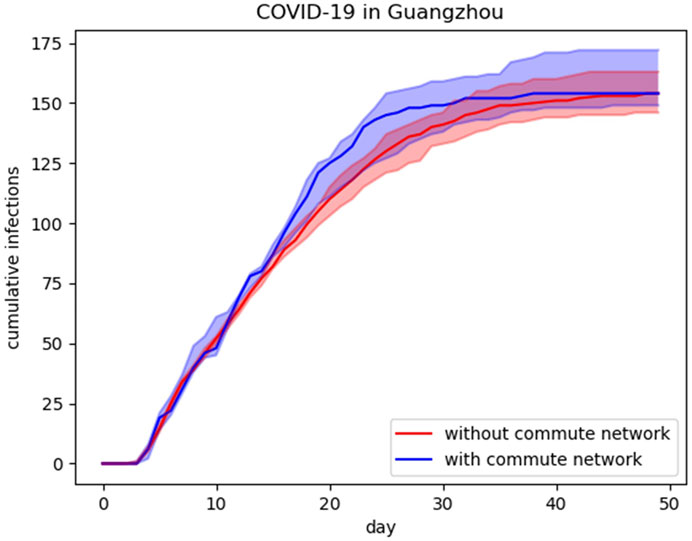
FIGURE 4. Output of model with and without commute layer. Blue curve shows the predictions from the model with commute layer and red curve is the output of model without commute layer. The blue (red) shading represents the 95% CI for the simulation results.
Results
We evaluate the impact of NPIs on both the government level and individual level by comparing the final epidemic size as well as the epidemic duration. Here, we regard 7 days without new cases as the passing of the wave of an epidemic outbreak. The NPIs enforced by the government evaluated in our study can further be classified into two kinds: human mobility restrictions and individual activity restrictions. Specifically, human mobility is limited through adjusting the public transit system operation and individual activity is reduced through school closure, work from home, closed-off community management, and quarantine. On the other hand, individual preventative behavior refers to mask use in our study. The enforcement of NPIs enacts on the day that the first cases are confirmed. The caveat is that the impact of each NPI is not studied alone but evaluated under the case that other NPIs also be enforced with a certain intensity. However, most countries did not adopt such strict NPIs as the Chinese government. To adopt a general case that is feasible for most countries, we ease the policies acted by the Chinese government, in other words, the implementation of NPIs in the baseline cases is slightly loose than in the calibrated cases and the essential parameters for baseline case are listed in Supplementary Table S2. Benefit from the baseline case, a more obvious impact of the variation of NPIs can be observed in a realistic case. Instead of the value of epidemic size, we are concerned about the relative change the NPIs bring about, hence, the ease of policies is acceptable for this study. It should be mentioned that the NPIs are implemented reactively after the first case is confirmed.
Closed-Off Community Management
We start by investigating the effect of community-wide activities reduction. The caveat is that the closed-off community management includes but is not limited to reducing the number of available entrances, limiting residents to go outdoors, and banning non-residents from entering. We account for the effect of close-off management by varying the community contact reduction probabilities from 0 to 1 and the duration of the NPI from 10 to 40 days Figure 5 shows the final epidemic size and the duration of the outbreak in different scenarios. We observe that the epidemic size reduces with the increase in policy intensity. When the NPI duration is shorter than 15 days, the effect of contact reduction is limited even with a high reduction probability. Specifically, the effect of close-off management becomes significant when its proportion is higher than 0.5 with a relatively long implementation time (more than 25 days). Moreover, it should be stressed that the duration and intensity of community contact reduction are equally important for the NPI can hardly work under a duration of less than 15 days. Here, the 100% community contact reduction is an ideal scenario, which is difficult to achieve for community contacts that guarantee people’s daily life are required during the epidemic outbreak. Besides the impact of contact reduction on the duration of the outbreak shows a similar trend to the epidemic size.
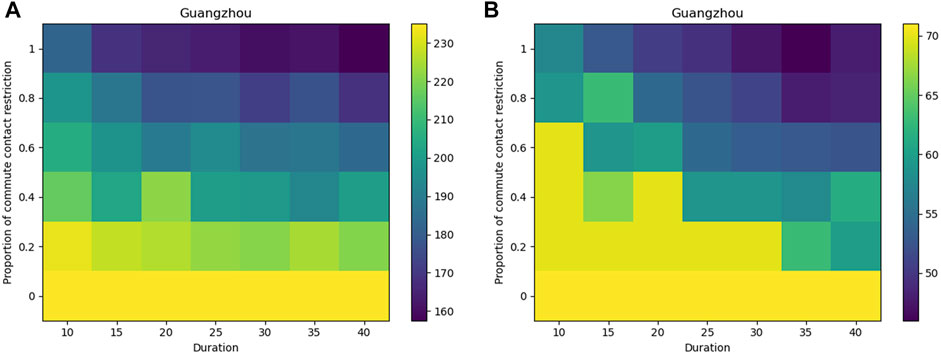
FIGURE 5. Effect of close-off community management. Higher proportion or longer duration of commute contact restriction denotes more severe NPIs. We take the total number of infections (A) and the duration of the epidemic (B) as an evaluation index.
School Closure
School closure is another NPI for reducing human activities especially juvenile activities. We estimate two types of closure policies: 1. Classes of schools in medium to high-risk areas are suspended, while others in low-risk areas remain open, 2. Close all schools in the city as long as there is a confirmed case. Also, we consider the cases without a school closure policy as a comparison. Notably, the result (Figure 6) indicates that the impacts of two school closure scenarios are similar and a 15 days duration of NPI can cut off the channels of transmission between students efficiently. Although school closure policy effectively reduces the number of contacts within the specific age group and hence, cuts down the onward transmission, the NPI can cause harm to workers’ ability to go to work, disrupt students’ path of learning and reduce economic productivity [19]. Therefore, closing schools by track is more effective than closing all schools in reducing virus transmission, and about 15 days duration is recommended.
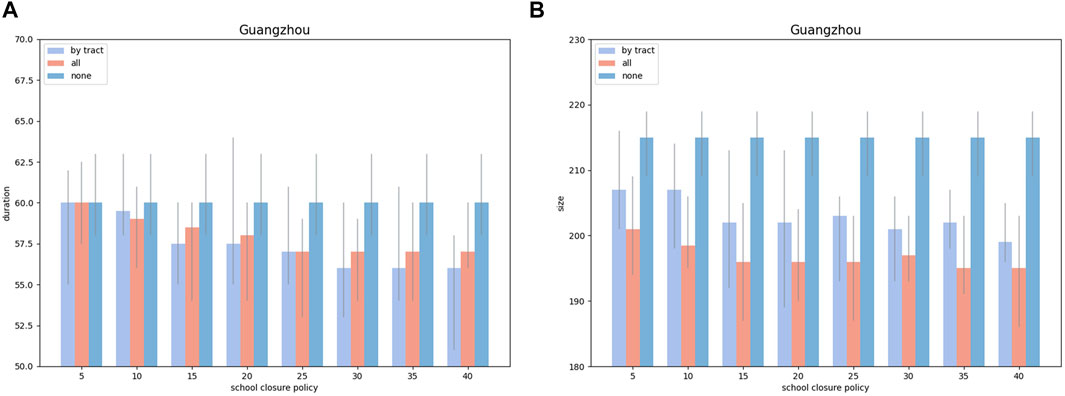
FIGURE 6. Effect of suspending classes of schools. Longer duration of school closure denotes more severe NPIs. Light blue pillars represent policies enforced by the tract, red pillars represent policies enacted by all tracts and blue pillars represent the case without school closure. We take the total number of infections (A) and the duration of the epidemic (B) as an evaluation index. The error bars represent the 95% CI for the simulation results.
Work From Home
As for workers, individual mobility and collective interactions in the workplace are both strongly connected with the transmissions of pathogens. Focusing on the workers’ social contacts, NPIs both for commute restrictions and interaction restrictions in the workplace are considered in our model. Collective interactions in the workplace are reduced by the work-from-home policy and the workers’ mobility is restricted by shutting down the public transit systems.
Similar to the evaluation for other NPIs, a set of different options for the proportion of workers who work from home and the policy execution time are considered. The results (Figure 7) suggest that the effect of workers’ collective interaction restriction becomes significant (about 12.6% of cases be averted compared with the baseline) when the proportion of workers working from home reaches an intermediate level (0.4–0.6). Besides, the results indicate that working from home for more than 20 days can achieve the desired effect if enough workers have been enforced to work at home on time.
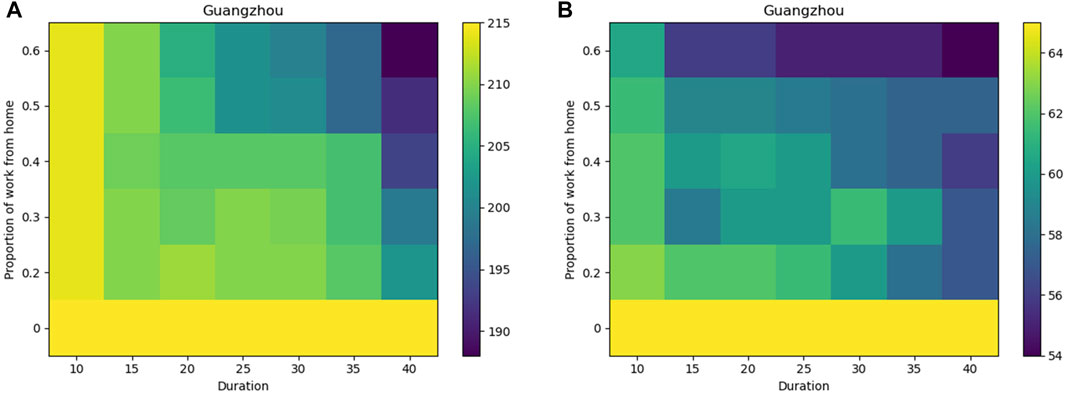
FIGURE 7. Effect of work from home policies. Higher proportion or longer duration of commute contact restriction denotes more severe NPIs. We take the total number of infections (A) and the duration of the epidemic (B) as an evaluation index.
Shut Down of Public Transit System
To explore the pattern of repeated encounters on the public transit system, we use the commute network layer to measure the number of workers being infected during commute between consecutive encounters of paired individuals. Like the assessment of work-from-home policy, we simulate the application of public transit system restrictions with different degrees of intensity and time duration. We assume that the suspension of public transportation service is a sign of workers’ mobility restrictions on the corresponding transportation routes. Values of restriction proportion vary from 0 to 0.6 and the implementation time ranges from 10 to 40 days. The heat maps in Figure 8 illustrate the impact of shutting down the different percentages of a public transit system. A more than 50% reduction in public transit systems can be effective in preventing the spread of an epidemic, while a low degree of public transit system reduction has a limited effect on epidemic spreading. Our assessment corresponds to Wu’s statement Wu et al. [37] that a 50% reduction in inter-city mobility in Wuhan has a negligible effect on the COVID-19 epidemic dynamics. However, the epidemic size is less sensitive to shutting down public transit systems than other NPIs discussed in our study. We believe that this is due to the fact that the workers’ mobility relies heavily on the work at home policy and the shutting down of the public transit system should match up with the implementation of the work at home policy. Besides, the duration time for mobility restriction is equally important with the reduction rate, in other words, the mobility restrictions produce benefits only if applied strictly enough and only if paired with sufficient execution time.
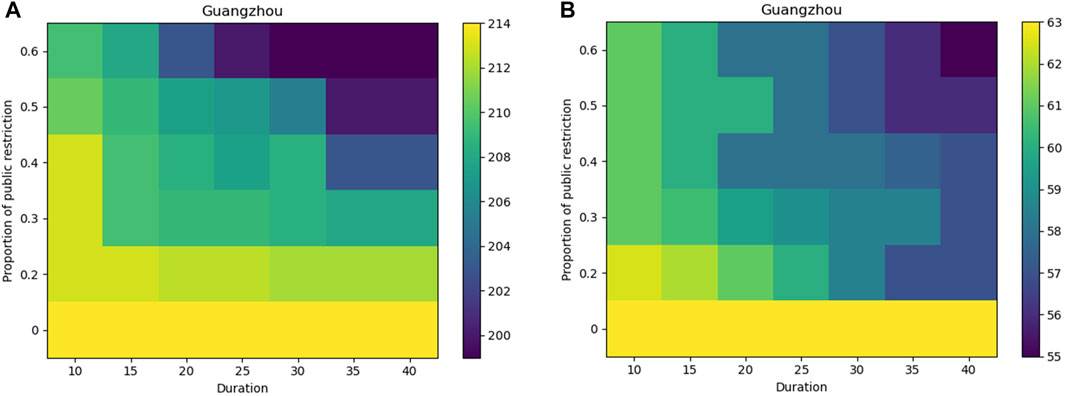
FIGURE 8. Effect of suspension of public transportation service. Higher proportion or longer duration of suspension of public transportation service denotes more severe NPIs. We take the total number of infections (A) and the duration of the epidemic (B) as an evaluation index.
Quarantine
Furthermore, quarantine for potentially infected people is also a crucial means of disease control. Here, two types of measures are modeled including institution-based quarantine and home-based quarantine. The former is modeled after China, with the quarantine of close contacts in specialized facilities cutting down further onward within-household transmission. While the latter requires close or secondary close contacts quarantine at home, which cuts down contact with others except with family members. Dickens et al. [38] studied these quarantine methods by the effect of different combined quarantine scenarios. Overall, we simulate five typical scenarios (Table 1), arranging different types of quarantine according to the risk level of the close contacts. Results in Figure 9 suggest that scenarios B and C lead to worse conditions than other scenarios, which adopt the institution-based quarantine, indicating that the institution-based quarantine is more effective than the home-based quarantine in cutting down the viral loads between mild infections and susceptible individuals. Similar dynamics are observed from other scenarios (A, D, and E) that the larger the quarantine policy covered the smaller the final epidemic size is. As a result of scenario, scenario A has a neglectable difference from scenario D, we believe that quarantine for the secondary close contacts can be appropriately eased, while the close contacts adopt a stricter quarantine policy. Crucially, the institution-based quarantine obviated most of the risk of within-household transmission, which is a commonly seen viral load. In contrast, home-based isolation, which relies on self-consciousness, will probably lead to increased infections. Therefore, we recommend policymakers in countries with limited medical resources consider institution-based quarantine for close contacts as well as for mild infections when facing a second COVID-19 wave.
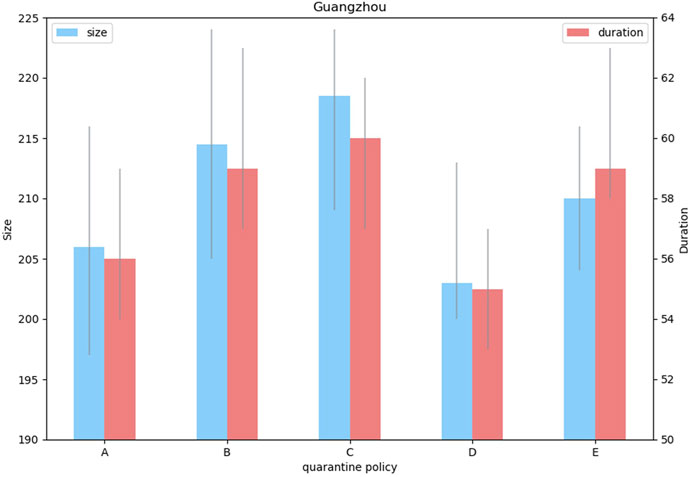
FIGURE 9. Effect of different types of quarantine policies. The correspondence between the type number and its detailed description is presented in Table 1. Blue pillars represent cumulative cases and red pillars represent the epidemic duration. The error bars represent the 95% CI for the simulation results.
Mask Use
NPIs investigated above are almost carried out by governments and public health departments. However, there has been limited international consensus on the use of face masks among the public. The use of masks as an infection control measure is now common in East and Southeast Asia and was recommended early in the pandemic by the Chinese government. In contrast, Western countries have been slower to encourage any adoption of masks, although there is a growing recognition that this should be part of public health policy for mitigating the spread of COVID (Eikenberry et al., [2]; Worby and Chang [8]). In our study, we estimate the role of face masks used among the public on the spread of COVID-19. We simulated outbreaks under a variety of mask use coverage rates associated with an assumption of 50% mask effectiveness and identified the resulting total numbers of infections and the duration of the epidemic (Figure 10). Consistently, we find the reduction in total infections increased with the expanding coverage of face mask use. The impact of scaling up the proportion of mask-wearing to the final epidemic size and the epidemic duration is generally linear based on current parameter settings. It is worth noting that increasing the coverage of face mask use makes great contributions to the control of the epidemic process, nevertheless, face mask use alone cannot be sufficient to mitigate epidemic outbreaks. Instead, a masks policy would need to be combined with other NPIs to reduce COVID-19 transmission efficiently.
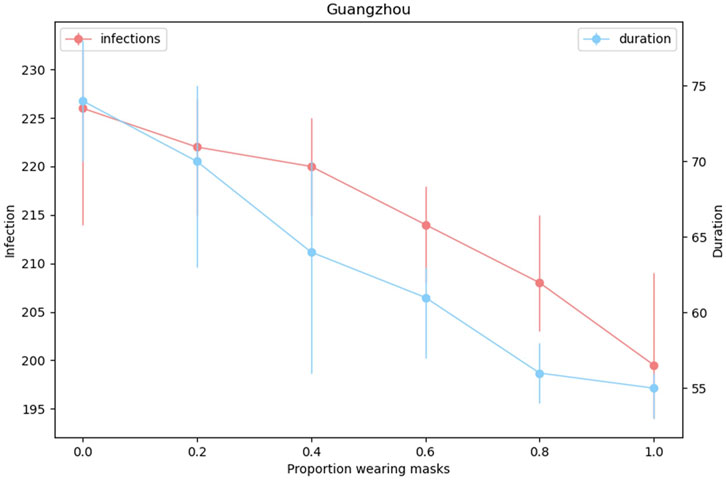
FIGURE 10. Effect of different proportions of mask use. We take the total number of infections and the duration of the epidemic as an evaluation index. Blue curve indicates the predictions of epidemic duration and red curve is the cumulative infections. The error bars indicate the 95% CI for model output.
Discussion
So far vaccines are available for the COVID-19 pandemic, and the impact of NPIs needs to be further evaluated. We proposed a multi-layer contact network that combines structurally fixed social contact networks with a time-varying mobility network, capturing the real-world features of individual daily interactions, and an abstract commute network, capturing human mobility patterns. Note that our model makes computation less expensive than the pure agent-based models since the commute network as a whole can be modeled, instead of tracking each individual agent. Based on the characteristics of the given metro contact networks (MCNs) [30], we obtain the aggregated commute network, which is time-varying by partially reconnecting the nodes in each time step. Benefit from the computational cost, the proposed multi-layer network can be occupied in cases with tens of millions of agents in several minutes, which can be a challenge for most agent-based models [28]. For most agent-based epidemic models that cannot take into account contacts both in enclosed places and through spatial transmission, our proposed framework can be used as a viable tool to fill this gap.
As the Chinese Center for Disease Control and Prevention reported that breakthrough infections happen with all vaccines [39], both the government and the individual could not relax vigilance and NPIs should be studied to make arrangements on implementing regular epidemic prevention and control measures as well as advancing economic and social development. Based on our model, two types of NPIs (restricting human mobility in relatively fixed places and in daily commute) are evaluated for the case of the second wave of COVID-19 outbreak, where relative vaccines are available. Specifically, we elucidate six types of NPIs enforced both by the government and the individual, including closed-off community management, school closure, work from home, shut down of the public transit system, mask use, and quarantine. Note that the public transit system restriction, aiming at reducing human mobility, is evaluated by the time-varying commute network. Here, we calibrate the model by the reported cases of Chinese metropolitan cities’ second wave of the epidemic. We apply different coverage ratios and duration of NPIs denoting their intensity and regard the relative size of cumulative confirmed cases and the duration of the epidemic as evaluation indexes. We derive a series of conclusions on how to apply NPIs to fight against COVID-19. First, our results indicate limitations in the implementation of these NPIs. Their public health value could be limited, while the NPIs are enforced with severe intensity for this could destroy the order of regular work and life. Moreover, we observe that suspending classes of school by track is recommended rather than closing all classes for closing down all classes does not show obvious effects compared with closing school by track. Furthermore, our study discovers that the institution-based quarantine is more effective than individual-based quarantine in epidemic control and prevention and these methods can both be carried out based on the possibility of infection of the susceptible individuals. Lastly, it is worth noticing that mask use plays an essential role in disease prevention and is a highly recommended NPI in the face of the second wave of outbreaks. However, other NPIs are also required to reduce the epidemic more efficiently.
It is noted that our model has the generalization ability. By leveraging the generality of our multi-layer network, the NPIs can further be studied under different backgrounds and more forms of NPIs can be pursued. First, the hierarchical organizational model structure allows us to implement NPIs by tracks or even by smaller units (i.e., household cluster and household). In this vein, school closure policies could be enforced at a local level instead of the whole city. Similarly, quarantine types could be arranged according to the level of intimacy between close contacts and infections. Second, human mobility and individual interaction are both considered by the multi-layer network structure. Therefore, NPIs aim at restricting spatial mobility or human interactions can both be assessed. Third, we set an interface for the population census, geographic information, data about the commute, and the NPIs’ related data (i.e., starting or ending point, coverage rate), offering access to further research.
Our study is affected by limitations. First, we analyze the effect of NPIs by specific factors varying from 0 to 1 representing the degrees of NPIs implementation. More detailed information for NPIs is needed to quantify the implementation of policies. Second, the type of strain is not considered. Our model needs to preset viral load, which varies from age group, degree of closeness, and infection status. In future work, information about strains can be added and our model can be adapted to more types of epidemic spread.
In conclusion, we proposed a multi-layer network including three types of social contact networks for repetitive social contact modeling and a time-varying network for contact in urban commuting. NPIs aiming at controlling and preventing the second wave of the epidemic, especially for the vaccine available cases are studied and notable suggestions are given according to the model output.
Data availability statement
The original contributions presented in the study are included in the article/Supplementary Materials, further inquiries can be directed to the corresponding authors.
Author contributions
PC, XG, ZJ, and SL contributed to conceptualization, methodology, and investigation. LL and JY contributed to the funding acquisition. PC and XG contributed to the software and formal analysis. YH, YL, and WF contributed to supervision and validation. All the authors wrote the studies.
Funding
This work was supported by the Ningbo “2025 S&T Megaprojects” (grant numbers 2021Z021).
Conflict of interest
Author ZJ, SL, LL, and JY were employed by the company Yidu Cloud (Beijing) Technology Co., Ltd.
The remaining authors declare that the research was conducted in the absence of any commercial or financial relationships that could be construed as a potential conflict of interest.
Publisher’s note
All claims expressed in this article are solely those of the authors and do not necessarily represent those of their affiliated organizations, or those of the publisher, the editors, and the reviewers. Any product that may be evaluated in this article, or claim that may be made by its manufacturer, is not guaranteed or endorsed by the publisher.
Supplementary material
The Supplementary Material for this article can be found online at: https://www.frontiersin.org/articles/10.3389/fphy.2022.915441/full#supplementary-material
References
1. Organization WH. Covid-19 situation report (2021). Available from: www.who.int/emergencies/diseases/novel-coronavirus-2019/situation-reports (Accessed June 25, 2021).
2. Eikenberry SE, Mancuso M, Iboi E, Phan T, Eikenberry K, Kuang Y, et al. To mask or not to mask: Modeling the potential for face mask use by the general public to curtail the Covid-19 pandemic. Infect Dis Model (2020) 5:293–308. doi:10.1016/j.idm.2020.04.001
3. Shen M, Peng Z, Xiao Y, Zhang L. Modeling the epidemic trend of the 2019 novel coronavirus outbreak in China. The Innovation (2020) 1:100048. doi:10.1016/j.xinn.2020.100048
4. Maier BF, Brockmann D. Effective containment explains subexponential growth in recent confirmed Covid-19 cases in China. Science (2020) 368:742–6. doi:10.1126/science.abb4557
5. Wu JT, Leung K, Leung GM. Nowcasting and forecasting the potential domestic and international spread of the 2019-ncov outbreak originating in wuhan, China: A modelling study. The Lancet (2020) 395:689–97. doi:10.1016/s0140-6736(20)30260-9
6. Li Q, Guan X, Wu P, Wang X, Zhou L, Tong Y, et al. Early transmission dynamics in wuhan, China, of novel coronavirus–infected pneumonia. N Engl J Med Overseas Ed (2020) 382:1199–207. doi:10.1056/nejmoa2001316
7. Schlosser F, Maier BF, Jack O, Hinrichs D, Zachariae A, Brockmann D, et al. Covid-19 lockdown induces disease-mitigating structural changes in mobility networks. Proc Natl Acad Sci U S A (2020) 117:32883–90. doi:10.1073/pnas.2012326117
8. Worby CJ, Chang H-H. Face mask use in the general population and optimal resource allocation during the Covid-19 pandemic. Nat Commun (2020) 11:4049. doi:10.1038/s41467-020-17922-x
9. Firth JA, Hellewell J, Klepac P, Kissler S, Kucharski AJ, Spurgin LG. Using a real-world network to model localized Covid-19 control strategies. Nat Med (2020) 26:1616–22. doi:10.1038/s41591-020-1036-8
10. Kucharski AJ, Klepac P, Conlan AJ, Kissler SM, Tang ML, Fry H, et al. Effectiveness of isolation, testing, contact tracing, and physical distancing on reducing transmission of sars-cov-2 in different settings: A mathematical modelling study. Lancet Infect Dis (2020) 20:1151–60. doi:10.1016/s1473-3099(20)30457-6
11. Chinazzi M, Davis JT, Ajelli M, Gioannini C, Litvinova M, Merler S, et al. The effect of travel restrictions on the spread of the 2019 novel coronavirus (Covid-19) outbreak. Science (2020) 368:395–400. doi:10.1126/science.aba9757
12. Flaxman S, Mishra S, Gandy A, Unwin HJT, Mellan TA, Coupland H, et al. Estimating the effects of non-pharmaceutical interventions on Covid-19 in Europe. Nature (2020) 584:257–61. doi:10.1038/s41586-020-2405-7
13. Jarvis CI, Van Zandvoort K, Gimma A, Prem K, Klepac P, Rubin GJ, et al. Quantifying the impact of physical distance measures on the transmission of Covid-19 in the UK. BMC Med (2020) 18:124. doi:10.1186/s12916-020-01597-8
14. Ma X, Luo X-F, Li L, Li Y, Sun G-Q. The influence of mask use on the spread of Covid-19 during pandemic in New York city. RESULTS PHYSICS (2022) 34:105224. doi:10.1016/j.rinp.2022.105224
15. Tian H, Liu Y, Li Y, Wu C-H, Chen B, Kraemer MUG, et al. An investigation of transmission control measures during the first 50 days of the Covid-19 epidemic in China. SCIENCE (2020) 368:638–42. doi:10.1126/science.abb6105
16. Sun G-Q, Wang S-F, Li M-T, Li L, Zhang J, Zhang W, et al. Transmission dynamics of Covid-19 in wuhan, China: Effects of lockdown and medical resources. Nonlinear Dyn (2020) 101:1981–93. doi:10.1007/s11071-020-05770-9
17. Giles JR, zu Erbach-Schoenberg E, Tatem AJ, Gardner L, Bjørnstad ON, Metcalf C, et al. The duration of travel impacts the spatial dynamics of infectious diseases. Proc Natl Acad Sci U S A (2020) 117:22572–9. doi:10.1073/pnas.1922663117
18. Mo B, Feng K, Shen Y, Tam C, Li D, Yin Y, et al. Modeling epidemic spreading through public transit using time-varying encounter network. Transportation Res C: Emerging Tech (2021) 122:102893. doi:10.1016/j.trc.2020.102893
19. Panovska-Griffiths J, Kerr CC, Stuart RM, Mistry D, Klein DJ, Viner RM, et al. Determining the optimal strategy for reopening schools, the impact of test and trace interventions, and the risk of occurrence of a second Covid-19 epidemic wave in the UK: A modelling study. Lancet Child Adolesc Health (2020) 4:817–27. doi:10.1016/s2352-4642(20)30250-9
20. Koo JR, Cook AR, Park M, Sun Y, Sun H, Lim JT, et al. Interventions to mitigate early spread of sars-cov-2 in Singapore: A modelling study. Lancet Infect Dis (2020) 20:678–88. doi:10.1016/s1473-3099(20)30162-6
21. Chang SL, Harding N, Zachreson C, Cliff OM, Prokopenko M. Modelling transmission and control of the Covid-19 pandemic in Australia. Nat Commun (2020) 11:5710. doi:10.1038/s41467-020-19393-6
22. Isella L, Stehlé J, Barrat A, Cattuto C, Pinton J-F, Van den Broeck W, et al. What’s in a crowd? Analysis of face-to-face behavioral networks. J Theor Biol (2011) 271:166–80. doi:10.1016/j.jtbi.2010.11.033
23. Sun L, Axhausen KW, Lee D-H, Huang X. Understanding metropolitan patterns of daily encounters. Proc Natl Acad Sci U S A (2013) 110:13774–9. doi:10.1073/pnas.1306440110
24. Liu Q-H, Ajelli M, Aleta A, Merler S, Moreno Y, Vespignani A, et al. Measurability of the epidemic reproduction number in data-driven contact networks. Proc Natl Acad Sci U S A (2018) 115:12680–5. doi:10.1073/pnas.1811115115
25. Liu F, Li X, Zhu G. Using the contact network model and metropolis-hastings sampling to reconstruct the Covid-19 spread on the “diamond princess”. Sci Bull (2020) 65:1297–305. doi:10.1016/j.scib.2020.04.043
26. Chao DL, Halloran ME, Obenchain VJ, Longini IM. Flute, a publicly available stochastic influenza epidemic simulation model. Plos Comput Biol (2010) 6:e1000656. doi:10.1371/journal.pcbi.1000656
27. Erdos P, Rényi A. On the evolution of random graphs. Publ Math Inst Hung Acad Sci (1960) 5:17–60.
28. Kerr CC, Stuart RM, Mistry D, Abeysuriya RG, Rosenfeld K, Hart GR, et al. Covasim: An agent-based model of Covid-19 dynamics and interventions. Plos Comput Biol (2021) 17:e1009149. doi:10.1371/journal.pcbi.1009149
29. Lauer SA, Grantz KH, Bi Q, Jones FK, Zheng Q, Meredith HR, et al. The incubation period of coronavirus disease 2019 (Covid-19) from publicly reported confirmed cases: Estimation and application. Ann Intern Med (2020) 172:577–82. doi:10.7326/m20-0504
30. Qian X, Sun L, Ukkusuri SV. Scaling of contact networks for epidemic spreading in urban transit systems. Sci Rep (2021) 11:4408. doi:10.1038/s41598-021-83878-7
31.Beijing Center for Disease Prevention and Control. Covid-19 situation in beijing (2021). Available from: https://www.bjcdc.org/indexcdc.html (Accessed June 25, 2021).
32.Guangzhou Center for Disease Prevention and Control. Covid-19 situation in guangzhou (2021). Available from: http://gzcdc.org.cn/(Accessed June 25, 2021).
33. Statistics BMB. 2020 beijing statistical yearbook (2021). Available from: http://tjj.beijing.gov.cn/(Accessed June 25, 2021).
34. Bureau GS. 2020 guangzhou statistical yearbook (2021). Available from: http://tjj.gz.gov.cn/(Accessed June 25, 2021).
35. Palacios R, Batista AP, Albuquerque CSN, Patiño EG, Santos Jd. P, Tilli Reis Pessoa Conde M, et al. Efficacy and safety of a Covid-19 inactivated vaccine in healthcare professionals in Brazil: The profiscov study. SSRN Electron J (2021). doi:10.2139/ssrn.3822780
36. Read JM, Bridgen JR, Cummings DA, Ho A, Jewell CP. Novel coronavirus 2019-ncov: Early estimation of epidemiological parameters and epidemic predictions. MedRxiv (2020).
37. Wu C, Chen X, Cai Y, Zhou X, Xu S, Huang H, et al. Risk factors associated with acute respiratory distress syndrome and death in patients with coronavirus disease 2019 pneumonia in wuhan, China. JAMA Intern Med (2020) 180:934. doi:10.1001/jamainternmed.2020.0994
38. Dickens BL, Koo JR, Wilder-Smith A, Cook AR. Institutional, not home-based, isolation could contain the Covid-19 outbreak. The Lancet (2020) 395:1541–2. doi:10.1016/s0140-6736(20)31016-3
Keywords: epidemic model, agent-based modeling method, network, non-pharmaceutical intervention, mobility
Citation: Chen P, Guo X, Jiao Z, Liang S, Li L, Yan J, Huang Y, Liu Y and Fan W (2022) A multilayer network model for studying the impact of non-pharmaceutical interventions implemented in response to COVID-19. Front. Phys. 10:915441. doi: 10.3389/fphy.2022.915441
Received: 08 April 2022; Accepted: 01 July 2022;
Published: 12 August 2022.
Edited by:
Ayse Peker-Dobie, Istanbul Technical University, TurkeyReviewed by:
Alejandro Lage Castellanos, University of Havana, CubaGui-Quan Sun, North University of China, China
Copyright © 2022 Chen, Guo, Jiao, Liang, Li, Yan, Huang, Liu and Fan. This is an open-access article distributed under the terms of the Creative Commons Attribution License (CC BY). The use, distribution or reproduction in other forums is permitted, provided the original author(s) and the copyright owner(s) are credited and that the original publication in this journal is cited, in accordance with accepted academic practice. No use, distribution or reproduction is permitted which does not comply with these terms.
*Correspondence: Peiyu Chen, cpy19@mails.tsinghua.edu.cn