The education index in the context of sustainability: Thermo-economic considerations
 Giulia Grisolia
 Debora Fino
 Umberto Lucia
- 1Dipartimento Energia “Galileo Ferraris”, Politecnico di Torino, Torino, Italy
- 2Dipartimento di Scienza Applicata e Tecnologia, Politecnico di Torino, Torino, Italy
Sustainable development requires new technical solutions to be realized, due to the new approach to production, consumption, and management of resources. These technologies also require technical skills from workers and citizens. These technical abilities are mostly based on the knowledge of mathematics and sciences, acquired during schooling years. In this study, we develop a thermo-economic analysis of sustainable development in relation to the needs of mathematical and technical skills of future workers. To do so, the Education Index is considered to improve it toward a measure of the technical abilities of young people, maintaining its present social meaning of preventing child exploitation. The result is an improvement of the Thermodynamic Human Development Index, by introducing the OECD-PISA assessment, to allow the decision makers to analyze their policies, based on a more comprehensive vision of the present, to better design the future. Finally, we point out the need to focus public policies on the continuous stimulus of intellectual reasoning and on problem-solving-based education to develop the processing capacity and foster the creative capabilities of the younger population that builds the backbone of the future workforce.
Introduction
Nowadays, pandemic emergencies, climate change and extreme weather events, pollution, food production and security, and energy production and security have highlighted the complexity of problems which require non-trivial solutions [1–3], which must be based on a dynamical use of scientific and technical knowledge. This is particularly true in relation to sustainable development; indeed, it requires that workers and engineers have skills to use advanced technologies with the aim of reducing CO2 and pollutant emissions. In this context, it is important to find a measurement of the technical abilities of students, who are the workers of the future. Only by maintaining a creative approach to science and technological issues can sustainable development be realized. As pointed out by the World Bank: “Human capital accumulation is a complex process” [4] and it is a central driver of sustainable growth [5].
The role of improved schooling can be considered a central part of most development strategies [6–8], even if it has become controversial due to the consideration that expansion of school attainment has not guaranteed improved economic conditions. Many studies have analyzed the role of cognitive skills in promoting economic well-being, with a particular focus on the role of school quality and quantity [9–12]. These studies have highlighted strong evidence that the cognitive skills of people, rather than mere school attainment, are powerfully related to individual earnings, the distribution of income, and economic growth. Moreover, recent empirical results have pointed out the importance of the level of skills, their complementarity, and the robustness of the relationship between skills and growth [13, 14].
Indeed, although most of the initiatives on the education of the Millennium Development Goals [15] were based on the strategy of raising the schooling levels of the population, some uncertainties in this strategy have been pointed out [14]:
• Developed and developing countries present several differences other than schooling levels;
• A number of countries have improved their schooling opportunities, but their well-being has not grown;
• Education programs require an effective management system to pursue social goals.
Thus, some considerations must be introduced to improve the socio-economic consequences of education, focusing not only on the schooling years, but also on the abilities acquired by students during this time, and cognitive skills were pointed out to have a key role [16, 17]. They are related to both quantity and quality of schooling; indeed, Ciccone et al. [18] and Hanushek et al. [14] have pointed out that schooling that does not improve cognitive skills presents a limited impact on economic development.
So, a measure of the abilities to solve complex problems and develop reasoning is important for the capability and productivity of the future workforce as a whole to organize productivity sites, depending on the technological skills required. Indeed, this is all the more concerning as work requirements are evolving quickly, which necessitates the ability to adapt to change and conceptualize complex ideas in a multidisciplinary setting [19–24]. Therefore, these abilities are fundamental to facing actual global challenges and sustainability issues and the resulting choices, from a multidisciplinary viewpoint. Indeed, going toward more sustainable societies implies the development of new solutions and technologies to reduce the environmental anthropic footprint and to ensure a decent quality of life for all people. To approximate this quantitatively, the United Nations (UN) has developed an indicator for assessing the progress and well-being of a country, by taking into consideration its economic growth and its population’s education level and life expectancy, i.e., the Human Development Index, HDI [25–27].
Recently, to introduce also the evaluation of the consumption of resources and the ecological impact of human activities, this indicator has been amended to yield a thermo-economic indicator, the so-called Thermodynamic Human Development Index (THDI) [28, 29]. In both these indexes, an educational index is taken into account due to its importance for human development and well-being: the Education Index (EI). It considers a country’s educational attainment by introducing the average adult years of schooling and the expected years of schooling for students, which are fundamental aspects from a social viewpoint, related to a better quality of life and to avoiding child labor [30]. But, on the contrary, this index is not able to provide information on the student’s individual problem-solving skills and technical or scientific knowledge that are key levers for technology improvements and the bases for more sustainable global conditions.
Moreover, the benefits of education, including economic growth, have been shown to be more closely associated with learning [14], whereas other aspects of education are associated with years of schooling [31]. So, these two dimensions of education must be considered together. Improving the quality of education has more impact if a large number of children go to school for a longer period and programs that increase years of schooling lead to more knowledge if the underlying education system is of a higher quality.
Consequently, all these aspects should be introduced into the EI indicator, to perform the assessment of a country’s education level and its sustainable potential. In this context, since the year 2000, PISA has been a worldwide study organized by the Organization for Economic Co-operation and Development (OECD) in member and non-member nations, aimed at evaluating education systems by measuring 15-year-old school pupils’ performances in Mathematics, Science, and Reading. This assessment can be a useful tool to obtain unified information on students’ abilities from different countries, as it is the broadest dataset of schooling performances available [32].
In this study, starting from the consideration that sustainable development also requires the introduction of new technologies, with related advanced technical abilities, we wish to improve the measurement of sustainability by improving the Thermodynamic Human Development Index in that we consider the OECD’s Program for International Student Assessment (PISA) results. Indeed, the role of the index is to allow the decision maker to make choices at present for future times. Thus, the THDI is an indicator based on the measurement of both socio-economic and technical facets. Among the socio-economic components, there is an index related to education, which allows us to gain information on the number of schooling years. But, even if it is a fundamental aspect for preventing the labor child, it cannot consider the abilities acquired by students. These skills are fundamental for the future of people because any person realizes himself/herself both as a human being in emotional growth and as an active member of society in his/her job. Thus, this last human expression in the future work environment can be achieved only through a deep ability in problem solving, technical skills, etc., which must be measured during the schooling years to support young people to improve their knowledge for the requirements of future work. In this way, we maintain the aims of the Education Index and add information on skills. To do so, a way to measure the abilities is required. OECD-PISA represents, even if with all the limits related to this approach, a unified tool to improve this Education Index.
The study is organized as follows: in the section Materials and Methods, the main components of the HDI are presented and those of the THDI. Then, the new indicator that considers the OECD-PISA results (OP) is introduced. Consequently, a new education index, more professional-oriented (EIp) is proposed and introduced into the THDI, obtaining the THDIp. An analytical consideration of the relation between the OP and the components of the thermo-economic indicator, IT, is carried out. In the Results section, the values for the normalization of OP are shown. Moreover, an analysis of 21 countries is presented in relation to their OP and EI trends and results. Consequently, the new THDIp is compared to THDI, highlighting the need to also consider the quality of education (in particular, of scientific disciplines) and not only the number of years spent at school. In the Discussion section, some considerations on the results are developed, and then they are also summarized in the Conclusion section.
Materials and methods
First, we consider that the process of education involves [33]:
• Lifelong process, with the aim of providing continuous improvement of personal abilities and skills;
• Social aim, with the result to improve the individual potential to allow anyone to become aware and a productive member of society;
• Personal aim, to allow any individual to become a respected person in the social context based on his/her cooperation to improve society, by providing his/her knowledge and skills;
• Cultural aim, by improving the sense of society, art, morals, laws, etc.;
• Personal character of any individual, with the improvement of honesty, truthfulness, justice, goodness, etc.;
• Intellectual aim, with the improvement of the methodological skills of problem solving.
Any thermo-economic evaluation related to a country must introduce an indicator to quantify the country’s conditions. In particular, as it concerns education, the United Nations Development Program (UNDP) has defined the Education Index, EI, as [34]
where
• MYSI is the Mean Years of Schooling Index, defined as MYSI = MYS/15 [34], where MYS are the Mean Years of Schooling. The latter represents the average number of completed years of education, attended by the country’s population aged 25 years and above [35];
• On the other hand, EYSI is the Expected Years of Schooling Index, defined as EYSI = EYS/18 [34], where EYS is the Expected Years of Schooling. The latter is the amount of time (expressed in years) that a child, starting now his educational path, is expected to spend at school or university (sum of the age-specific enrollment ratios for primary, secondary, post-secondary non-tertiary, and tertiary education) [36].
The EI represents one of the three components of the Human Development Index, HDI, which is an indicator of the development level of a set country, as it regards education, health, and per capita income [37]. It is the geometric mean of three normalized indices that are representative of each dimension [25], and its analytical definition is [34]
with LEI being the Life Expectancy Index, while EI represents the Education Index and II stands for the Income Index. The Life Expectancy Index LEI is expressed as [34]
where LE denotes the Life Expectancy at birth, indicative of the overall mortality level of a country and it corresponds to the years that a newborn is expected to live at current mortality rates [38]. The UN has set its minimum and maximum values to 20 and 85 years, respectively [34]. The UN defined the Normalized Income Index II as follows:
where GNIpc is the gross national income per capita at purchasing power parity (PPP), with minimum and maximum values set by the UN [34] as 100.00 $ and 75,000.00 $, respectively. However, the Human Development Index does not take into account the country’s technological level or its environmental impact. Therefore, considering also the technological stage and the environmental anthropic footprint, an improvement of the HDI has recently been introduced, which puts forward an irreversible thermodynamic approach [28, 39]:
where [29]:
where the numerator represents the power lost due to irreversibility, related to the entropy generation rate, that can be written as follows [40–42]:
where
The index related to education is always EI, both in THDI (Eq. 5) and in HDI (Eq. 2). EI considers a given country’s educational attainment by introducing average adult years of schooling and expected years of schooling for students, which are fundamental aspects from a social viewpoint, related to a better quality of life [34]. However, this index does not provide information on the student’s individual problem-solving skills and technical or scientific knowledge that are key factors to develop new technologies and actions toward the achievement of more sustainable global conditions. Thus, all these aspects must be introduced when performing the assessment of a country’s education level and its sustainable potential. Therefore, to consider also these aspects of the educational component of the Human Development Index, and consequently for the Thermodynamic Human Development Index, we propose to include the OECD’s Program for International Student Assessment (PISA) data.
As such, we now consider for each country the normalized OECD’s PISA scores [43] for Maths and Sciences, by introducing their arithmetic mean as follows:
where OP is the OECD’s PISA Index, based on the normalized values of the scores in Mathematics (Mth) and Sciences (Sci). Then, it is possible to obtain a new education index, which equally weighs both the social aspects related to education, already previously considered, and the student’s skills, which can help them be prepared to face actual current and future challenges:
where the subscript p means professional-oriented.
Then, we can obtain a Thermodynamic Human Development Index professional-oriented, which also considers the pupil’s competences:
This last index can be used to develop a thermo-economic analysis of a country and to measure its sustainability, containing aspects related to human well-being: society, economy, and environment. Indeed, THDIp encloses the following quantities:
• The social quantity related to a long and healthy life, LEI, which represents an index related to people and their possible access to social services;
• The quantity related to education, EIp, which encloses information both on the schooling time and on the knowledge level;
• A thermo-economic quantity, IT, which contains information on:
• The technological level, expressed by the environmental impact through the entropy generation;
• The economic well-being, expressed by the Income Index, II.
The aim of this study is to introduce an indicator to highlight the need for high-level skills in the educational system for sustainable development. To show this relation, we can introduce some simplifications by considering the following hypotheses:
• The LEI indicator is considered constant because it is not affected by education;
• The EI indicator is considered constant, because—for this consideration—our interest is related to the acquired knowledge skills and not to the time spent in school.
Under these hypotheses, we consider that, in relation to the definition of THDIp, a system is sustainable if the THDIp index grows with time, which is analytically expressed by a positive first differential:
from which it follows that
Now, some considerations can be introduced for this analytical result:
• Environmental sustainability implies that dIT < 0, if the mathematical and scientific skills grow, then d (OP) > 0, and the condition of sustainability (12) is always verified;
• If dIT > 0, the condition of sustainability (12) results is verified only if:
which means that the environmental impact can be accepted only in relation to an improvement of the educational and socio-economic conditions of a country. This result is in agreement with the approach of the United Nations for developing countries.
Results
OECD’s Program for International Student Assessment is a triennial assessment, which provides information on some core school subjects, including Mathematics and Sciences, focusing on the students’ extrapolation ability from what they have learned and what they know by applying this knowledge to unfamiliar settings in several competence areas [44]. Much like the other indicators considered within the HDI, a normalization of the Mathematics and Sciences results for each country has been developed, by considering the initial average score for all the subjects (equal to 500 [44]) and the related standard deviation (equal to 100 [44]). So, to manage the normalization for all scores of each country, the minimum value for the Mathematics and Sciences results has been set to 1.5 times the standard deviation below the average score (350), and its maximum value has been set to 1.5 times standard deviation above the average score (650). Normalization is developed by using the formula suggested by the United Nations Technical Reports on HDI [34], with the aforementioned minimum and maximum values:
where Q represents the normalized quantity (Mth or Sci score), qactual the actual value of the considered quantity, and qmin and qmax stand for the minimum and maximum values, respectively, set for the quantity q itself.
Figure 1A shows the results of the arithmetic average of the normalized Mathematics (Mth) and Sciences (Sci) scores, obtained by means of Eq. 8, for the following countries: Australia, Austria, Belgium, Brazil, Canada, Denmark, Finland, France, Germany, Greece, Italy, Japan, Mexico, the Netherlands, Norway, Portugal, Russian Federation, Spain, Sweden, the United Kingdom, and the United States of America. The years in which the OECD’s PISA surveys have been performed are 2006, 2009, 2012, 2015, and 2018.
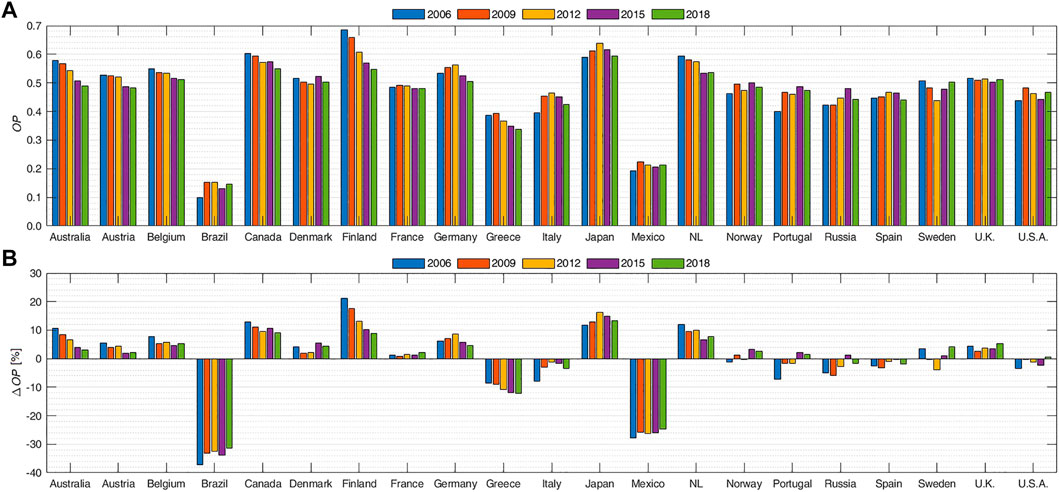
FIGURE 1. (A) Values of the arithmetic mean of the normalized OECD’s PISA scores in Mathematics and Sciences (OP) in 2006, 2009, 2012, 2015, and 2018 for the following countries: Australia, Austria, Belgium, Brazil, Canada, Denmark, Finland, France, Germany, Greece, Italy, Japan, Mexico, the Netherlands (NL), Norway, Portugal, Russian Federation (Russia), Spain, Sweden, the United Kingdom (UK), and the United States of America (USA). The OECD’s PISA scores have been retrieved from the OECD’s database [43]. (B) Percentage variation for each of the aforementioned year and country from the annual OP mean value within the considered countries.
It is evident that for all countries, the results referred to in 2018 present a decreasing trend if compared to the ones of the previous years. In particular, in 2018, the OP of each country has decreased with respect to the country maximum value itself, which can be quantified as follows: 15% for Australia, -9% for Austria, -7% for Belgium, -3% for Brazil, -9% for Canada, -4% for Denmark, -20% for Finland, -2% for France,-10% for Germany, -14% for Greece, -9% for Italy, -7% for Japan, -5% for Mexico, -10% for the Netherlands, -3% for Norway and Portugal, -8% for the Russian Federation, -6% for Spain, -1% for Sweden and the United Kingdom, and -3% for the United States of America. We must highlight that since 2018 PISA data are available also for China, which ranks at the top of all scores of the assessments. However, Chinese participation differs from other countries, considering only the regions of Beijing, Shanghai, Jiangsu, and Zhejiang, or the wealthiest and most economically developed regions in China [45].
Figure 1B represents for each country, for each reference year, the percentage variation of the normalized OECD’s PISA value from its average annual value within the countries considered. The average value for the i-th year has been calculated as follows:
where j indicates the j-th country considered and N the total number of them.
These results from Figures 1A, B suggest the need of an improvement in teaching scientific disciplines, to allow pupils to receive better bases for the growth of their technical abilities. Indeed, these pupils will obtain a job in a more technological context (their future), and their well-being in that work environment will be related to their technical abilities. Thus, policy-makers must pay particular attention to performing the present choices in the educational context to better design a future sustainable society.
Figure 2A shows for each country the UN’s Education Index values, EI, in 2006, 2009, 2012, 2015, and 2018. One can appreciate that for almost all the countries, an increasing trend in their EI has occurred, presenting the maximum value in 2018. Only Australia, Denmark, and Portugal present their EI maximum value in 2012, 2012, and 2015, respectively. However, their tendency is increasing again, moving toward their previous maximum values. For the four Chinese regions included, they raised their EI from 2006 (0.551) to 2018 (0.649) with the top scores in Mathematics and Sciences for the regions of Beijing, Shanghai, Jiangsu, and Zhejiang (OP = 0.802); they exhibit high levels of the teaching of mathematical, physical, and engineering topics, as reported in Ref. [46].
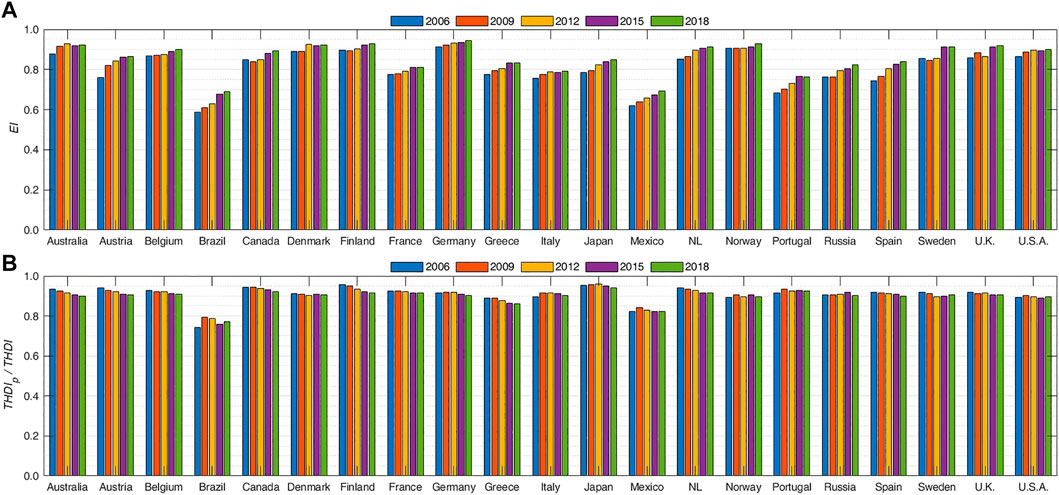
FIGURE 2. (A) Values of the United Nation’s Education Index EI in 2006, 2009, 2012, 2015, and 2018 for the following countries: Australia, Austria, Belgium, Brazil, Canada, Denmark, Finland, France, Germany, Greece, Italy, Japan, Mexico, the Netherlands (NL), Norway, Portugal, Russian Federation (Russia), Spain, Sweden, the United Kingdom (UK), and the United States of America (USA). The UN’s EI data have been retrieved from the United Nations Development Program - Human Development Report database [47]. (B) Ratio between the Thermodynamic Human Development Index professional-oriented, THDIp, and the original one, THDI, of the same countries in the same years. Data to perform their evaluation have been retrieved in the following datasets [47–55].
The UN’s Education Index, which is closely related to social aspects than to the pupil’s knowledge and skills, presents for all countries a positive trend. Once both normalized indexes linked to education have been obtained (EI and OP), it is possible to evaluate their geometric mean, EIp, by means of Eq. 9, and the Thermodynamic Human Development Index professional-oriented, THDIp, introducing EIp into Eq. 10. Therefore, Figure 2B presents the ratio between THDIp and THDI to highlight the impact of considering also the students’ capabilities or the aspects related to scientific reasoning and problem-solving skills, which will aid in preparing young people to face both current and future global challenges with greater awareness and knowledge. From Figures 2A, B, it is possible to highlight that the indicator THDIp improves information on a country, showing a deeper analysis of the context and maintaining its characteristics as concerns IT and LEI.
We observe that the ratio between THDIp and THDI presents values lower than 1 for all countries and an overall decreasing trend for all of them. This is due to considering within EIp different aspects of education: the social one, related to the years of schooling (included in EI), and the student’s gain of knowledge in scientific and reasoning disciplines (included in OP). Indeed, even if the EI had an increasing trend during the period 2006–2018, the OECD’s PISA scores over the same period on Mathematics and Sciences have affected the overall EIp results, and subsequently, the related THDIp values. In particular, new policies are required to achieve sustainable societies. To do so, a high level of scientific knowledge and problem-solving skills will be required.
We must highlight that the effect of the decreasing trend in EIp will emerge in future decades, when 15-year old students—who were tested in these PISA studies—will grow up and become active workers, playing crucial roles in their societies.
The THDI and THDIp values for the countries considered here have grown during the period from 2006–2018, which means that the overall countries’ well-being and their environmental impact are improving. However, as previously stated, the rebound effect caused by the 15-year-old student’s lower performances in problem-solving and scientific knowledge may affect global achievements in the future. Furthermore, a positive relationship exists between national estimates of cognitive skills and product sophistication [56] which has consequences for a country’s innovation output, intellectual property position, and therefore, its long-term global economic competitiveness.
Discussion
The aim of this study is to introduce the evaluation of the abilities of students in relation to sustainable development in the United Nations’ Education Index. Indeed, the UN’s Education Index is an index more related to social aspects than to the pupil’s knowledge and skills. But, in the context of sustainable development, the introduction and use of new technologies require related abilities for their effective use and improvement. So, a key role emerges for technical skills, to allow future workers to be able to approach new jobs, innovation, and individual contribution to work results and social improvement. The EI does not measure these skills. Thus, the measurement of the workers’ skills must be considered in relation to their future jobs, constrained by sustainable development. To do so, the OECD PISA results are considered, because PISA is a comprehensive and accurate international assessment of student learning outcomes [44]. Moreover, this assessment has not been designed to test the knowledge levels of any student but to extrapolate their abilities in relation to their knowledge. Thus, it is a comprehensive test on which students exploit their abilities at work, related to their knowledge and skills for specific issues. Moreover, PISA results are useful for policymakers to assess both the quality and equity of learning outcomes attained by the 15-year-old students [24].
To measure the effectiveness of education in sustainable development, we have developed our analysis by introducing some considerations related to the students’ Mathematics and Scientific education within the recently developed Thermodynamic Human Development Index, THDI. This is an indicator of sustainability, with education being a fundamental component of it. As such, public policies on education, from quality and access to affordability, are critical in preventing social and economic inequality in the future. The Education Index EI is a component of both THDI and the United Nations’ Human Development Index, HDI, but EI accounts only for the average years of schooling that are essential from a social standpoint. Indeed, this parameter is not only strictly related to education but also to child labor. As such, in an effort to also include aspects related to the actual people’s knowledge and their potential future ability to conceptualize complex ideas in a multidisciplinary setting, we have included the OECD’s Program for International Student Assessment (PISA) results. PISA is an international metric that measures what people actually know and can do with that knowledge [57], longitudinally monitoring the outcomes of the education systems. In particular, that assessment is carried out every 3 years on 15-year-old pupils, testing their achievements in three main domains: Literacy, Mathematics, and Sciences, verifying if the students have acquired the fundamental skills and knowledge that are essential for full participation in modern societies [44]. Moreover, it has been highlighted that higher education must include training in sustainability disciplines [58], and Mathematics plays a key role in the achievement of sustainable development goals [59–62].
Nowadays, PISA data are available mostly for high- and middle-income countries. However, the OECD is promoting PISA for its Development (PISA-D) initiative. The aim of this project is to enlarge the assessment, making it more accessible and suited to a wider range of countries, with its extension also to out-of-school children aged between 16 and 18, and to the pupil’s parents to collect even more relevant information on the countries’ education system and their citizens’ knowledge level.
The Thermodynamic Human Development Index, THDI, represents a thermodynamic improvement of the HDI toward environmental considerations, related also to the technological level of a country and to its sustainability level, by means of the Gouy–Stodola theorem and to the losses due to irreversibility [28, 29]. But, with regards to education, these indexes present the previously highlighted limit of considering only the number of schooling years in the EI, without any consideration for the professional skills achieved. From a socio-economic viewpoint, the education level plays a more fundamental role rather than the number of schooling years. Therefore, to show the appropriate correction of the THDI, the OECD-PISA results have been included. Consequently, we have modified EI by introducing the professional measure, EIp, by considering the normalized OECD-PISA marks for Mathematics and Sciences with Eq. 9. Indeed, the OP index is assumed to be related to the development of skills and abilities of young people. We have shown that the THDIp/THDI ratio presents a negative trend for almost all countries from the period 2006–2018. This fact cannot be ignored by policymakers due to its relevance for building now the competencies of future generations and, by doing so, laying the groundwork to develop more sustainable, equitable societies, introducing topics able to fuel creativity for new approaches and methodologies in education to achieve better performance in Mathematics and Sciences, to allow students to build the dynamic knowledge required by the complexity of sustainable development [63].
The results emphasize that this is based on technological advancements and the proper use of such new technologies; both require applying Mathematics and technical sciences which in turn necessitate having acquired relevant knowledge. Components of the sustainable indexes related to education have been improved by introducing the OECD-PISA measures into the Education Index. The result is a correction of both the THDI and HDI indexes by now also taking into account the capabilities of students in relation to Mathematics and Sciences and not only the number of schooling years.
Conclusion
In this study, to achieve the targets of sustainable development, a new component within the Thermodynamic Human Development Index has been introduced. This new component of THDI concerns its dimension related to education. In particular, it has been considered an index based on the OECD-PISA normalized results on Mathematics and Sciences (calculated by means of Eq. 14 for both the subjects), by using their mean value via Eq. 8. Then, this indicator has been linked to the UN’s Education Index through the geometric mean (Eq. 9). So, the new indicator, the Thermodynamic Human Development Index professional-oriented, THDIp has been obtained.
In this context, an analysis of some countries has been developed. The results have shown that for all the countries considered, the values of the indicator related to the OECD-PISA scores have decreased in 2018 with respect to the last decade. Therefore, this trend has also affected the tendency of the sustainability indicator THDIp, which for all countries results in lower than the THDI. This implies that particular attention should also be addressed to improve and preserve the education level, especially concerning mathematical and scientific knowledge, which are required to design and manage new sustainable solutions, technologies, and policies for the future.
Data availability statement
The original contributions presented in the study are included in the article/Supplementary Material; further inquiries can be directed to the corresponding author.
Author contributions
UL: conceptualization; methodology; formal analysis; investigation; writing—original draft; review; and editing; supervision; project administration; funding acquisition; and validation. DF: investigation; writing—original draft; review; and editing; supervision; project administration; and funding acquisition. GG: conceptualization; methodology; investigation; writing—review and editing; visualization; data curation; and validation.
Conflict of interest
The authors declare that the research was conducted in the absence of any commercial or financial relationships that could be construed as a potential conflict of interest.
Publisher’s note
All claims expressed in this article are solely those of the authors and do not necessarily represent those of their affiliated organizations, or those of the publisher, the editors, and the reviewers. Any product that may be evaluated in this article, or claim that may be made by its manufacturer, is not guaranteed or endorsed by the publisher.
References
1. Bejan A. Science and technology as evolving flow architectures. Int J Energ Res (2009) 33:112–25. doi:10.1002/er.1427
2. Bejan A. Why we want power: Economics is physics. Int J Heat Mass Transfer (2012) 55:4929–35. doi:10.1016/j.ijheatmasstransfer.2012.05.046
3. Bejan A, Lorente S. Constructal theory of generation of configuration in nature and engineering. J Appl Phys (2006) 100:041301. doi:10.1063/1.2221896
4. Gatti R, Corral P, Dehnen N, D’Souza R, Mejalenko J, Pennings S. The human capital index - the 2020 update. Policy research working paper. New York: World Bank Group - Education Global Practice (2021).
5. Azevedo JP, Goldemberg D, Montoya S, Nayar R, Rogers H, Saavedra J, et al. Will every child be able to read by 2030? Defining learning poverty and mapping the dimensions of the challenge. Policy Research Working Paper 9588. New York: World Bank Group - Education Global Practice (2021).
6. Blackburn ML, Neumark D. Omitted-ability bias and the increase in the return to schooling. J Labor Econ (1993) 11:521–44. doi:10.1086/298306
7. Blackburn ML, Neumark D. Are ols estimates of the return to schooling biased downward? Another look. Rev Econ Stat (1995) 77:217–30. doi:10.2307/2109861
8. Bosworth BP, Collins SM. The empirics of growth: An update. Brookings Pap Econ Activity (2003) 2:113–206. doi:10.1353/eca.2004.0002
9. Card D, Krueger AB. Does school quality matter? Returns to education and the characteristics of public schools in the United States. J Polit Economy (1992) 100:1–40. doi:10.1086/261805
10. Currie J, Moretti E. Mother’s education and the intergenerational transmission of human capital: Evidence from college openings. Q J Econ (2003) 118:1495–532. doi:10.1162/003355303322552856
11. De Gregorio J, Lee JW. Education and income inequality: New evidence from cross-country data. Rev Income Wealth (2002) 48:395–416. doi:10.1111/1475-4991.00060
12. Glewwe P. The relevance of standard estimates of rates of return to schooling for education policy: A critical assessment. J Develop Econ (1996) 51:267–90. doi:10.1016/s0304-3878(96)00415-4
13. Hanushek EA, Woessmann L. The role of cognitive skills in economic development. J Econ Lit (2008) 46:607–68. doi:10.1257/jel.46.3.607
14. Hanushek EA, Woessmann L. Do better schools lead to more growth? Cognitive skills, economic outcomes, and causation. J Econ Growth (Boston) (2012) 17:267–321. doi:10.1007/s10887-012-9081-x
15.UNESCO. Education for all: The quality imperative. EFA Global Monitoring Report. Paris: UNESCO (2005).
16. Cohen D, Soto M. Growth and human capital: Good data, good results. J Econ Growth (Boston) (2007) 12:51–76. doi:10.1007/s10887-007-9011-5
17. Acemoglu D, Johnson S, Robinson JA. Reversal of fortune: Geography and institutions in the making of the modern world income distribution. Q J Econ (2002) 117:1231–94. doi:10.1162/003355302320935025
18. Ciccone A, Peri G. Identifying human-capital externalities: Theory with applications. Rev Econ Stud (2006) 73:381–412. doi:10.1111/j.1467-937x.2006.00380.x
19. Bakhshi H, Downing J, Osborne M, Schneider P. The future of skills: Employment in 2030. London: Pearson and Nesta (2017).
20. Mevarech Z, Kramarski B. Critical Maths for innovative societies: The role of metacognitive pedagogies. Paris: OECD Publishing (2014).
21.OECD. PISA 2012 assessment and analytical framework: Mathematics, reading, science, problem solving and financial literacy. Paris: PISA-OECD Publishing (2013).
22.OECD. Research protocol for OECD project on assessing progression in creative and critical thinking skills in education. Paris: OECD Publishing (2015).
23.OECD. Skills for social progress: The power of social and emotional skills, OECD skills studies. Paris: OECD Publishing (2015).
25.UNDP Human Development Report Office. Concept and measurement of human development. Human development report 1990. New YorkNew York: United Nations Development Programme (1990).
26. Sagar AD, Najam A. The human development index: A critical review. Ecol Econ (1998) 25:249–64. doi:10.1016/S0921-8009(97)00168-7
27. Hickel J. The sustainable development index: Measuring the ecological efficiency of human development in the anthropocene. Ecol Econ (2020) 167:106331. doi:10.1016/j.ecolecon.2019.05.011
28. Lucia U, Grisolia G. The gouy-stodola theorem—from irreversibility to sustainability—The thermodynamic human development index. Sustainability (2021) 13:3995. doi:10.3390/su13073995
29. Lucia U, Grisolia G. Irreversible thermodynamics and bioeconomy: Toward a human-oriented sustainability. Front Phys (2021) 9:659342. doi:10.3389/fphy.2021.659342
30. Team EGMR. Education for all development index (EDI). In: Michalos AC, editor. Encyclopedia of quality of life and well-being research. Dordrecht: Springer Netherlands (2014). p. 1810–1. doi:10.1007/978-94-007-0753-5_838
31. Angrist N, Evans DK, Filmer D, Glennerster R, Rogers FH, Sabarwal S. How to improve education outcomes most efficiently? - a comparison of 150 interventions using the new learning-adjusted years of schooling metric. Policy Research Working Paper 9450. New York: World Bank Group - Education Global Practice (2020).
32. Villar A. The educational development index: A multidimensional approach to educational achievements through pisa. Mod Economy (2013) 4:403–11. doi:10.4236/me.2013.45042
34.United Nations Development Program. Calculating the human development indices - graphical presentation. United Nations: Technical notes hdr (2020).
35.[Dataset] UNESCO - Institute for statistics. Mean years of schooling (2022). Available from: http://uis.unesco.org/en/glossary-term/mean-years-schooling (Accessed July 28, 2022).
36.[Dataset] The World Bank. Expected years of schooling (2022). Available from: https://databank.worldbank.org/metadataglossary/world-development-indicators/series/SE.SCH.LIFE (Accessed July 28, 2022).
37. Javaid A, Akbar A, Nawaz S. A review on human development index. Pak J Humanit Soc Sci (2018) 6:357–69. doi:10.52131/pjhss.2018.0603.0052
38.[Dataset] World Bank Group. Life expectancy at birth, total (years) (2021). Available from: https://data.worldbank.org/indicator/SP.DYN.LE00.IN (Accessed March 27, 2022).
39. Lucia U, Fino D, Grisolia G. A thermoeconomic indicator for the sustainable development with social considerations. Environ Develop Sustainability (2021) 24:2022. doi:10.1007/s10668-021-01518-6
41. Grisolia G, Fino D, Lucia U. Thermodynamic optimisation of the biofuel production based on mutualism. Energ Rep (2020) 6:1561–71. doi:10.1016/j.egyr.2020.06.014
42. Lucia U, Fino D, Grisolia G. Thermoeconomic analysis of earth system in relation to sustainability: A thermodynamic analysis of weather changes due to anthropic activities. J Therm Anal Calorim (2020) 145:701–7. doi:10.1007/s10973-020-10006-4
43.[Dataset] OECD. Science performance (PISA) (indicator) (2022). 10.1787/91952204-en. Available from: https://data.oecd.org/pisa/science-performance-pisa.htm#indicator-chart (Accessed February 5, 2022).
44.OECD. PISA for development assessment and analytical framework. Reading, mathematics and science. Paris: Programme for international student assessment, OECD (Organisation for Economic Co-operation and Development (2018). doi:10.1787/9789264305274-en
45. Candido HHD, Granskog A, Tung LC. Fabricating education through PISA? An analysis of the distinct participation of China in PISA. Eur Educ (2020) 2020:1–20. doi:10.1080/10564934.2020.1759097
46. Liu J, Lynn R. An increase of intelligence in China 1986–2012. Intelligence (2013) 41:479–81. doi:10.1016/j.intell.2013.06.017
47.[Dataset] UNDP. Education index (data) (2022). Available from: https://hdr.undp.org/en/indicators/103706 (Accessed February 5, 2022).
48.[Dataset] United Nations Development Programme. Education index (2022). Available from: http://hdr.undp.org/en/indicators/103706 (Accessed February 5, 2022).
49.[Dataset] United Nations Development Programme. Human development index (2022). Available from: http://hdr.undp.org/en/indicators/137506 (Accessed February 5, 2022).
50.[Dataset] World Bank Group. Climate change knowledge portal- temperature data (2022). Available from: https://climateknowledgeportal.worldbank.org/download-data (Accessed February 5, 2022).
51.[Dataset] Wischnewski B, Wagner R. Calculation of thermodynamic state variables of carbon dioxide (2022). Available from: https://www.peacesoftware.de/einigewerte/co2_e.html (Accessed February 5, 2022).
52.[Dataset] OECD Data. Primary energy supply (2022). Available from: https://data.oecd.org/energy/primary-energy-supply.htm (Accessed February 5, 2022).
53.[Dataset] OECD Data. Air and GHG emissions (2022). Available from: https://data.oecd.org/air/air-and-ghg-emissions.htm (Accessed February 5, 2022).
54.[Dataset] World Bank Group. GNI per capita, PPP (constant 2017 international) $ (2022). Available from: https://data.worldbank.org/indicator/NY.GNP.PCAP.PP.KD (Accessed February 5, 2022).
55.[Dataset] United Nations Development Programme. Life expectancy index (2022). Available from: http://hdr.undp.org/en/indicators/103206 (Accessed February 5, 2022).
56. Lapatinas A, Litina A. Intelligence and economic sophistication. Empir Econ (2019) 57:1731–50. doi:10.1007/s00181-018-1511-y
58. Eilks I. Science education and education for sustainable development – justifications, models, practices and perspectives. Eurasia J Math Sci Technol Educ (2015) 11:149–58. doi:10.12973/eurasia.2015.1313a
59. Akinmola EA. Developing mathematical problem solving ability: A panacea for a sustainable development in the 21st century. Int J Educ Res (2014) 2:1–8.
60. Vintere A. A constructivist approach to the teaching of mathematics to boost competences needed for sustainable development. Rural Sustainability Res (2018) 39:1–7. doi:10.2478/plua-2018-0001
61. Lafuente Lechuga M, Cifuentes Faura J, Faura Martinez U. Mathematics applied to the economy and sustainable development goals: A necessary relationship of dependence. Educ Sci (2020) 10:339. doi:10.3390/educsci10110339
62. Araya R, Collanqui P. Are cross-border classes feasible for students to collaborate in the analysis of energy efficiency strategies for socioeconomic development while keeping co2 concentration controlled? Sustainability (2021) 13:1584. doi:10.3390/su13031584
63. Horta LMP. Sharp teacher training and the new constructal pedagogical supervision theory for sustainable development. Eur J Sustain Develop Res (2022) 6:em0183. doi:10.21601/ejosdr/11895
64.[Dataset] UNDP - Human Development Reports. Hdi and components time-series (2022). Available from: https://hdr.undp.org/sites/default/files/data/2020/HDI_HDR2020_040722.csv (Accessed July 28, 2022).
65.[Dataset] World Bank. Gdp per capita, ppp (constant 2017international $) (2022). Available from: https://data.worldbank.org/indicator/NY.GDP.PCAP.PP.KD (Accessed July 28, 2022).
66.[Dataset] OECD. Oecd skills surveys (2022). Available from: https://pisadataexplorer.oecd.org/ide/idepisa/dataset.aspx (Accessed July 28, 2022).
Nomenclature
Latin symbols
Mass flow rate, [kg s−1]
S, Entropy
Entropy generation rate, [W K−1]
sg, Specific entropy generation
t, Time, [s]
T, Temperature, [K]
Useful power, [W]
Indicators and indexes
EI, Education Index, Eq 1
EYS, Expected Years of Schooling
EYSI, Expected Years of Schooling Index
GDP, Gross Domestic Product [$]
GNIpc, Gross National Income per capita
HDI, Human Development Index
II, Income Index, Eq 4
IT, Indicator based on thermo-economic considerations, Eq 6
LE, Life Expectancy at birth
LEI, Life Expectancy Index, Eq 3
Mth, Normalized Mathematics OECD’s PISA score
MYS, Mean Years of Schooling
MYSI, Mean Years of Schooling Index
OP, Index based on the OECD’s PISA results, Eq 8
Sci, Normalized Sciences OECD’s PISA score
THDI, Thermodynamic Human Development Index
Subscript
0, Environment or References
CO2, Carbon dioxide
in, Input or inflow
p, Professional-oriented
pc, Per capita
Acronyms
OECD, Organization for Economic Co-operation and Development
PISA, Program for International Student Assessment
UN, United Nations
UNDP, United Nations Development Program
Keywords: education index, irreversible thermodynamics, OECD-PISA, sustainability, THDI indicator
Citation: Grisolia G, Fino D and Lucia U (2022) The education index in the context of sustainability: Thermo-economic considerations. Front. Phys. 10:968033. doi: 10.3389/fphy.2022.968033
Received: 13 June 2022; Accepted: 03 August 2022;
Published: 26 August 2022.
Edited by:
Joan J. Carvajal, University of Rovira i Virgili, SpainReviewed by:
Baogui Xin, Shandong University of Science and Technology, ChinaZahra Hajabdollahi, University of Glasgow, United Kingdom
Copyright © 2022 Grisolia, Fino and Lucia. This is an open-access article distributed under the terms of the Creative Commons Attribution License (CC BY). The use, distribution or reproduction in other forums is permitted, provided the original author(s) and the copyright owner(s) are credited and that the original publication in this journal is cited, in accordance with accepted academic practice. No use, distribution or reproduction is permitted which does not comply with these terms.
*Correspondence: Giulia Grisolia, giulia.grisolia@polito.it