The core of board networks and firm value
- 1Division of Business Administration, Chosun University, Gwangju, South Korea
- 2Department of Anesthesiology, University of Michigan, Ann Arbor, MI, United States
We examine the statistical and dynamic properties of board networks connected through interlocking directorates. We find that the degree distribution of a board network follows a power-law distribution. Furthermore, the evolution of the core–periphery structure of board networks over time is related to market stability. This result implies that firms, when densely connected to other boards, would like to keep their position as core groups in board networks. Firm value shows a statistically positive relationship with firms centrally positioned in a board network. Overall, we suggest that board networks can help us understand market stability and serve as an alternative information channel for increasing the firm value. These findings imply that the statistical and dynamic properties of board networks uncover information transmission during the global financial crisis. This paper contributes to interdisciplinary applications of physics in economics and finance in terms of the dynamics of a core–periphery structure of board networks.
1 Introduction
A large body of literature has examined the characteristics of interlocking directorates and the impact of interlocking directorates on corporate governance. Recently, many papers have studied the form of a network by corporate governance as members of a corporate board operate on the boards of two or more companies and create a link between different companies.
This paper explores time-varying board networks depending on economic situations. Assuming that a core board has valuable information, we expect a high level of transition probability between core peripheral boards in a board network. This is why they prefer to gain knowledge from advice by sharing it with directors in volatile market conditions. We calculate market stability based on the probability of transition in board networks to estimate structural consistency. We then investigate how the connectedness of board networks affects the firm value. When core boards are beneficial in the network structure, the center of board networks could facilitate their valuation. This is why the link between them in different companies could serve as a channel for information transmission.
This paper contributes to the recently thriving literature on the structure of interlocking directorates. Specifically, we investigate the impact of interlocking directorates on the firm value in terms of a core–periphery. A core–periphery is a network that includes a group of tightly linked nodes as the core and a group connected by the remaining weakly connected nodes as the periphery. Core boards, consisting of director-sharing, take the lead in the industry’s most productive companies in decision-making [1,2]. We propose that having a board member occupy the central position of the board network as an advisory actor, rather than monitoring quality, exerts a more effective influence on the operations of a corporate firm. In particular, core boards were persistent during the sample period span 2000–2015. Finally, we present a positive relationship between the influential firms we measure by the composite centrality index (CCI) in the board network and firm valuation. Our evidence supplements studies that show that board member connectivity represents the power or reputation of a board member.
In this study, we underscore that the number of connections with boards can deliver valuable information via social capital for the organizational strategy of a firm. First, the board networks estimated by interlocking directorates include a non-trivial topological feature. This presents as a heavy tail in the degree distribution with an estimated alpha ranging from 3.33 to 6.90, capturing neither purely regular nor random graphs. This forecasts the existence of some boards with more connections than others, which have an informative position in the board network [1,3]. Second, the core–periphery structure of the board network tends to maintain itself continuously. This result is consistent with the “winner takes the most” capability, with a small number of companies taking a large share of the market [4–6]. In particular, board members attempt to link with the financial industry’s skilled directors when the financial market is unstable, as in the 2008–2009 global financial crisis. Third, our CCI calculated by board networks has a statistically positive impact on the firm value measured by Tobin’s q at the 1% level. (This is consistent with the influence of bank networks with [7]. These results imply that the connectedness between firms based on a physical relationship, such as interlocking directorates and overlapping portfolios, could be a measure of power in board networks. These results shed light on the research on the relationship between the network structure and firm value.)
The theoretical implications of our findings are as follows. Network connections among directors improve the firm value. This relation is consistent with studies that social links encourage information sharing, opinion exchange, and decision-making. Our paper also reveals that the degree of interlocking directorates is noteworthy to board characteristics. For practitioner and policy implications, these results endorse that the degree of interlocking directorates can be valuable to firms. Social links with other board members might be crucial for human resource management. Consequently, employing new board members connected to the incumbent members can be favorable to firms.
The rest of the present paper proceeds as follows: Section 2 explains the related works in the literature; in Section 3, we present our data and describe our primary network measures; Section 4 delivers the patterns of board networks in the United States and provides our main results regarding network effects on corporate outcomes; and Section 5 concludes.
2 Related works
Numerous theories have been developed to elucidate the relationship between interlocking directorates and corporate outcomes. One is the busyness hypothesis, according to which the busyness of directors is defined by more than two connections with other boards that employ low-quality monitoring, which could weaken the pivotal role of a board of directors [8]. For example, CEO connections with other top executives and directors cause fraudulent activity [9]. Firms with better-connected audit committees reduce financial reporting quality [10].
The other is the reputation hypothesis. [11] argue that director reputation and board power render the dynamics of board interlocking. For instance, in mergers and acquisitions between firms with current board connections, acquirers obtain higher announcement returns in transactions where the acquirer and target share a director [12,13]. In addition, companies with private equity deal exposure from interlinked directors are more likely to receive private equity offers in a sample of U.S.-listed companies [14].
Therefore, we follow the concept of valuable information sharing through interlocking directorates. This line of research on board director interlocking emphasizes that interactions between firms through board members have important implications for fundamental questions related to a firm’s decision-making. We extend this analysis by exploring a board network: board members are not involved in specific firms but rather are connected to other firms in a complex board network. This suggests that firms may choose valuable information that is transmitted through the board network. Here, we investigate the characteristics of a board network and how inter-firm relations affect the firm value. In addition, the methodology for the transition probability from a core–periphery structure in this paper is related to the literature of complex networks related to Markov chain and game theory [15,16]. Moreover, this application has an association with measuring network vulnerability and community detection in complex networks [17,18].
3 Methodology
This paper demonstrates the application of methods from statistical physics to socioeconomic phenomena. First, we construct a board network via the interlocking directorates of board members and then analyze the core and periphery structure to understand the evolution of board networks. Second, to find the economic meaning of sharing information in a board network, we check the relationship between corporate outcomes and board network properties.
3.1 Sample selection
We use the RiskMetrics database of the Investor Responsibility Research Centre (IRRC) to construct board networks. This database includes comprehensive information concerning board members and top executives for S&P 500, S&P MidCap, and S&P SmallCap firms, including historical directors’ details such as their board meetings, age, employment status, ethnicity, gender, and name. We supplement RiskMetrics data with accounting information from Standard and Poorś Compustat. Our focus is on the details of the structure and practice of firms listed in S&P 1500 over the 2000–2015 period. To link information from RiskMetrics and Compustat, we manually follow [19] and match unique company identifiers and director identifiers. We, then, hand-match the remaining company identifiers and director identifiers. To adjust the dual-class shares of a firm, we designate one share per firm based on the highest total asset. To construct a sample, we exclude firms with fewer than 10 million dollars of total assets and sales and book values under one million dollars. In addition, we winsorized the sample at the 1% and 99% levels of variables for the regression. Finally, we build our sample using 17,791 director-year observations. We gather 12 industrial classifications from the Fama–French website, as illustrated in Table 1. A schematic representation of this study can be seen in Figure 1.
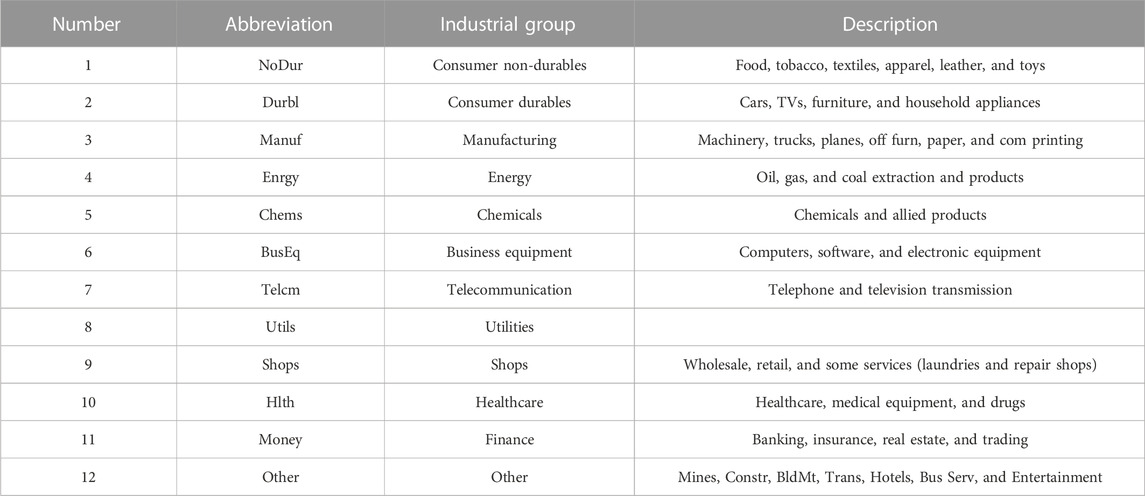
TABLE 1. Groups based on Standard Industrial Classification (SIC). We downloaded SIC codes from the Fama–French website to divide sample firms into 12 industry groups.
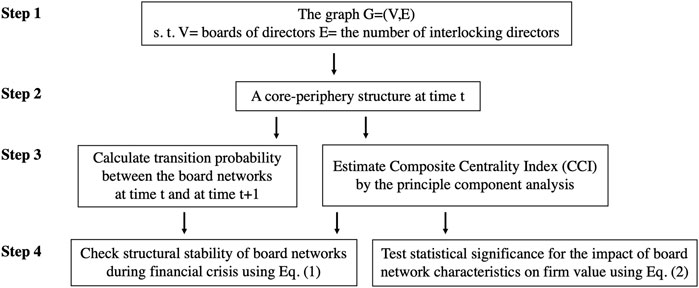
FIGURE 1. Schematic diagram. We construct board networks by interlocking directorates and investigate a core–periphery structure from 2000 to 2015. The structural stability is calculated by Eq. 1, and the impact of centrality from the board network on the firm value is estimated by Eq. 2.
3.2 Network construction
Let us consider a network with V nodes and E links, defined as G (V,E). Network G is defined by the adjacency matrix
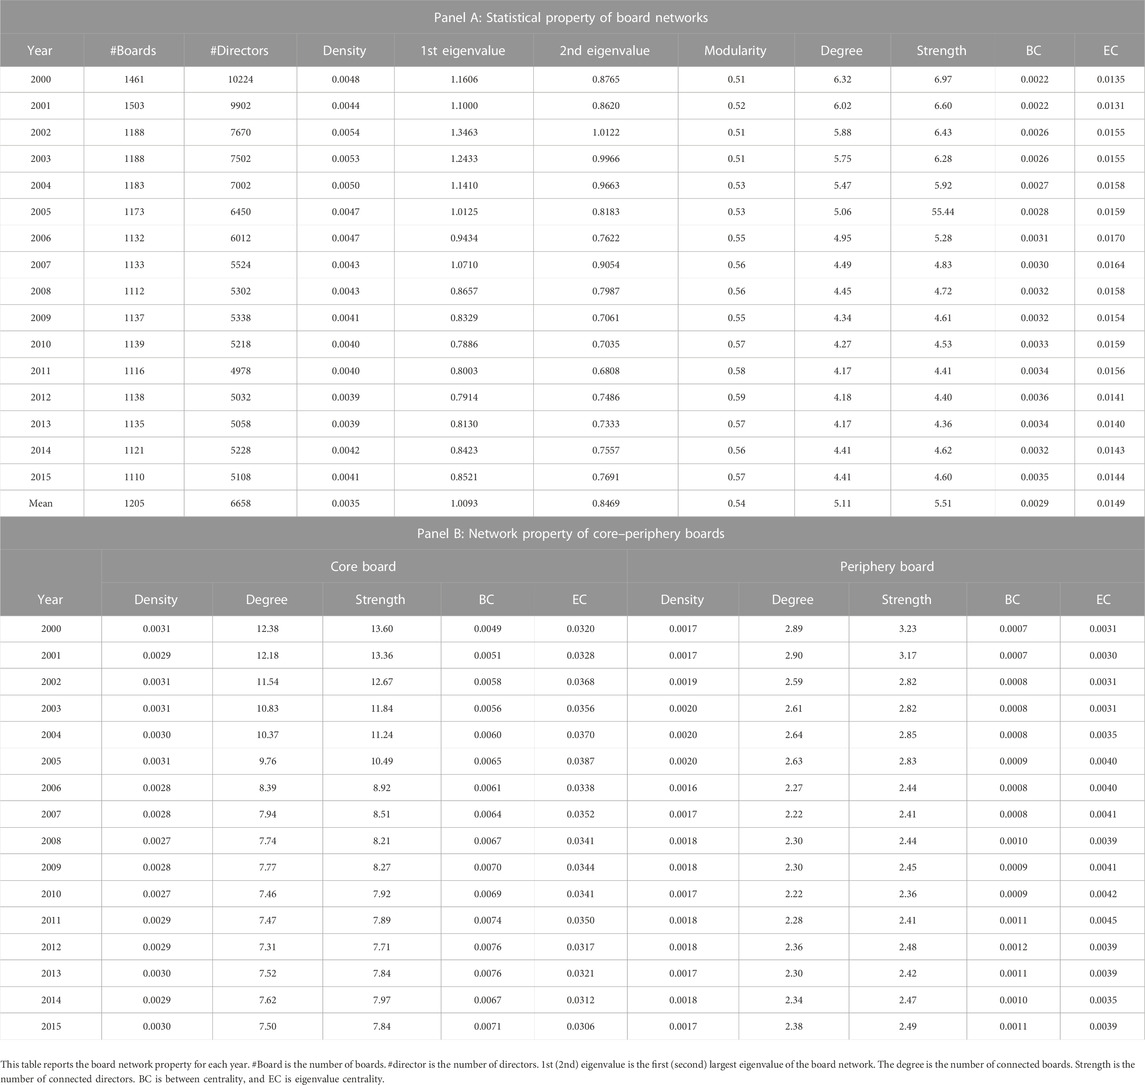
Table 2 shows the properties of the board network from 2000 to 2015. We first calculate the board network density as the ratio of the number of links to possible connections among the boards of directors. This can be interpreted as the cohesiveness or extensiveness of contact between them. According to [3], social capital operates as a resource formed by social ties, which consist of members collaborating with others in a given society. The roles of social capital are to enhance trust and cooperation in the network. Board network density is higher when most board members hope to create many linkages with each other in regard to information.
In identifying hierarchical systems in the board network in Table 2, we calculate modularity by a community detection algorithm to analyze the structure of the networks. Modularity measures the strength of division in a network into subgroups [23–25]. A high modularity value indicates good community division. In further discovering structure dynamics, we measure the core–periphery structure of a board network. From the blockmodeling results, the nodes with many links to other nodes are designated to the core, and the remaining nodes evolve as part of the periphery [24,26]. Intuitively, core blocks are topologically the most valuable blocks in the board network, which turns out to be densely connected among them, highly central in the entire network, and opinion leaders. We use the abbreviations CC (core–core blocks), PP (periphery–periphery blocks), and PC (periphery–core blocks) explained in Figure 2.
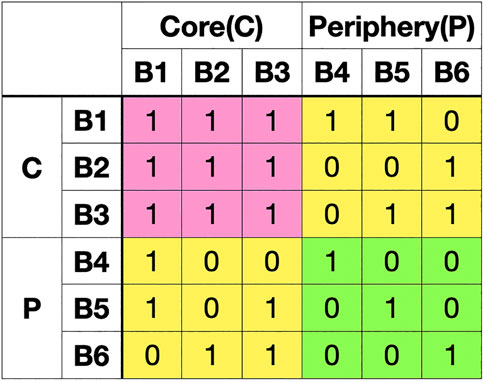
FIGURE 2. Example of CC, PP, and PC (CP) blocks in the board network at time t. Each B1–B6 denotes the company’s board of directors. When B1 and B2 have sharing directors, they are connected and designated by 1. A board of directors in the pink range is considered a CC (core–core) block. In other words, the boards in a CC block have connection with other boards. A board of directors in the green range is considered a PP (peripheral–peripheral) block. A board of directors in the yellow range is considered PC (peripheral–core) and CP (core–peripheral) blocks because the board of the director network is symmetric, so PC and CP blocks are the same.
3.3 Centrality measure
Next, we assume that board members with multiple interlocks denote a greater power of interdependence in their network. We estimate the positional quality of each firm as a centrality measure on a multidimensional basis, consistent with previous studies (e.g., [10,22]), exploring patterns that contemplate both the importance of the particular company and the thickness of its circumstances. Centrality measures allow us to identify pivotal firms in the overall network. For this study, we focus on the network measures of degree, eigenvector centrality (EC), and betweenness centrality (BC), which capture different aspects of connectedness based on interlocking directorates.
The degree of a board network indicates the number of connections to other firms through board members [27]. Board members with a high degree with other boards in board networks have additional information related to projects or the financial conditions that surround them. We, then, adopt eigenvector centrality to measure the influence on other nodes in the network, which is relatively easy to calculate in a large and complex network [28]. The eigenvector centrality measures the intrinsic features in our networks created through boards of directors based on how much valuable information they receive and how much it affects other firms. We can easily measure the eigenvector centrality by power iterations. Betweenness centrality describes the extent to which an individual board is connected to other boards in a network. Conceptually, the measure evaluates the possibility that knowledge transmits via board members under the assumption that data are transmitted in a network. The raw score is divided by (N − 1) × (N − 2), and N is the total number of nodes [29]. This is why the size of a board network changes each year, as our empirical examination in Table 2.
Due to the positive correlations between degree, EC, and BC in Table 3 for the regression, we calculate the CCI. We standardize the board-level centrality scores to have a mean of 0 and standard deviation of 1 and then combine these three measures to reduce the dimensionality of the variables using principal component analysis [7,30]. In Table 4, we report the descriptive statistics of the centrality measures and the CCI for board members. The centrality measures are presented at the firm level. The average degree is 4.95, which means that the boards usually have connections with five firms by interlocking directorates. The main focus of our paper is measuring the transmission of information by a centrality measure. We use the board network to measure each firm’s importance in the social structure as the weight of the number of interlocked boards from other firms. A firm with low centrality tends to receive little information from other firms. In contrast, a firm with high centrality may promote technology and feedback on recent performance with different firms. This is because corporate boards use interlocking directorates to access the private information about a firm. Figure 6 shows an example of the core and periphery of board networks.
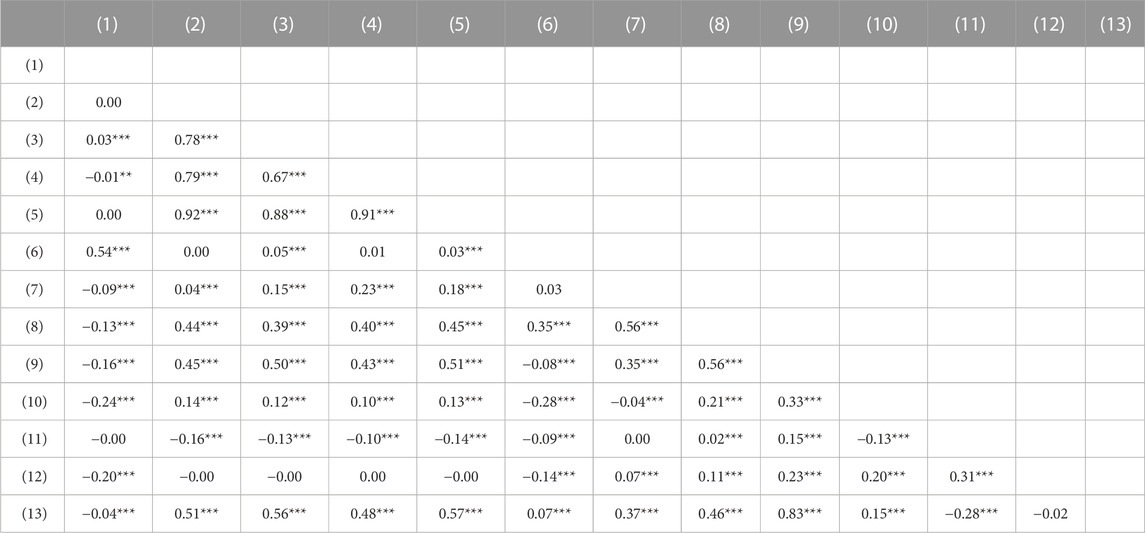
TABLE 3. Similarity matrix showing the correlation of each pair. (1) Tobin’s q, (2) Degree, (3) Betweenness, (4) Eigenvector, (5) CCI, (6) ROA, (7) lnAge, (8) BoardSize, (9) FirmSize, (10) Leverage, (11) Tangibility, (12) Growth, and (13) lnSale. This table presents the Pearson correlation coefficient of the dependent variables with centrality measures and control variables used in our analysis. Detailed variable descriptions are provided in Section 3.1. ** and ***, respectively, denote significance at 5% and 1%.
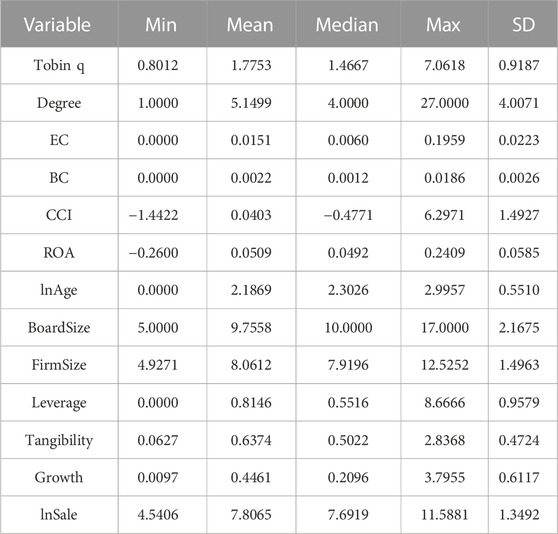
TABLE 4. Descriptive statistics. This table reports the minimum, mean, median, and maximum values of each variable used in our model. It also shows the respective standard deviations. Detailed variable descriptions are given in Section 3.1. All variables are winsorized at the 1st and 99th percentile levels.
3.4 Stability measure
Since we must analyze the evolution of the board network over time, it is important to design a suitable structure to estimate the variation of the board network. The main task, here, is to determine how to divide the whole network into subparts. One way is to define the core–periphery blocks from the board network. We estimate the transition probability of core–periphery blocks between time t-1 and time t in the board network. Most cores are defined as a degree greater than median of the overall degree of the board network at time t. We expect the board of core blocks to remain in position at next time t+1 due to positive assortativity [31]. However, in special circumstances such as the financial crisis, we expect the core–periphery position to be less maintained. This paper defined structural stability to investigate the ratio of changing their position between the core boards and periphery boards to get informative knowledge about appropriate strategies related to the market status. Measurements of structural stability by the dynamics of the board network are calculated as follows:
where D1(t)(D2(t)) denotes the total diagonal (off-diagonal) elements of the matrix of transition probability from time t-1 to time t. We visualize the matrix of transition probability in Figure 3 for illustrative purposes. C(t) is the core board at time t. P(t) is the periphery board at time t. E(t) is not connected to a board at time t. In other words, D1(t) is the sum of the CC (core to core), PP (periphery to periphery), and EE (exit to exit) blocks. D2 denotes off-diagonal elements of transition probability including CP(core to periphery), CE(core to exit), PC(periphery to core), PE(periphery to exit), EC(exit to core) and EP(exit to periphery). D2(t) is the sum of the transition probabilities of firms changing positions between groups, such as the core, periphery, and exit. The stability of the board network ranges between ‒1 and 1. When the stability of the network is ‒1, this denotes a completely switched core–periphery block of the board network. When the stability of the network is 1, this denotes the zero transition probability of the board network.
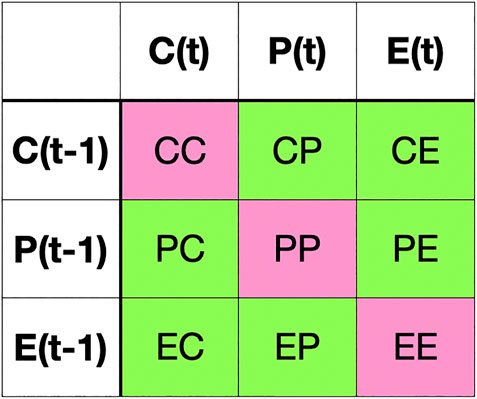
FIGURE 3. Example of D1 and D2 based on transition probabilities in the board network. The CC block shows the transition probability from core (t-1) to core (t). The PP block shows the transition probability from periphery (t-1) to periphery (t). The EE block shows the transition probability from exit (t-1) to exit (t). D1 is calculated as the sum of CC, PP, and EE blocks, colored in pink in this figure. D2 is calculated as the sum of off-diagonal elements colored in green in this figure.
3.5 Model specification
One of the significant driving forces behind investment decisions is information. Here, we assume that the board network concerns how the information-sharing process through board members influences the firm value in the market. Therefore, we employ a regression model to test whether the information shared through the board network is related to the firm value. We use Tobin’s q as a dependent variable in the regression model, which is the ratio of the market value [32,33]. The measure of Tobin’s q is stable over time, making it a promising measure as a significant determinant of the market value of a firm in the literature [34]. We approximately estimate Tobin’s q as book assets minus book equity plus the market value of equity divided by book assets in line with much of the literature [35]. The value of a brand and human resources of a firm that is leading the market lead people to invest. Investors believe that such a value could lead to future growth opportunities. A Tobin’s q of more than one means that the valuation value in the market is higher than the company’s book value. A firm tends to have a competitive advantage in the market, so it has sufficiently completed its growth. Investing in a firm could generate a stable return without a high return. On the other hand, a Tobin’s q of less than one means that the value of the firm viewed in the market is lower than that of the assets held by the firm, where growth is already at its limit or a problematic condition. There is a high likelihood of competition being extreme or belonging to the industry specification. Ultimately, a specification industry or problematic company is possible. Firms with a high ownership concentration have a high Tobin’s q. The key independent variable is the CCI of the board network derived from Eq. 2. In separate regressions reported in Table 5, we investigate the effects of centrality measures, such as CCI, degree, eigenvector centrality (EC), and betweenness centrality (BC), on the firm value based on the literature [10,36,37].
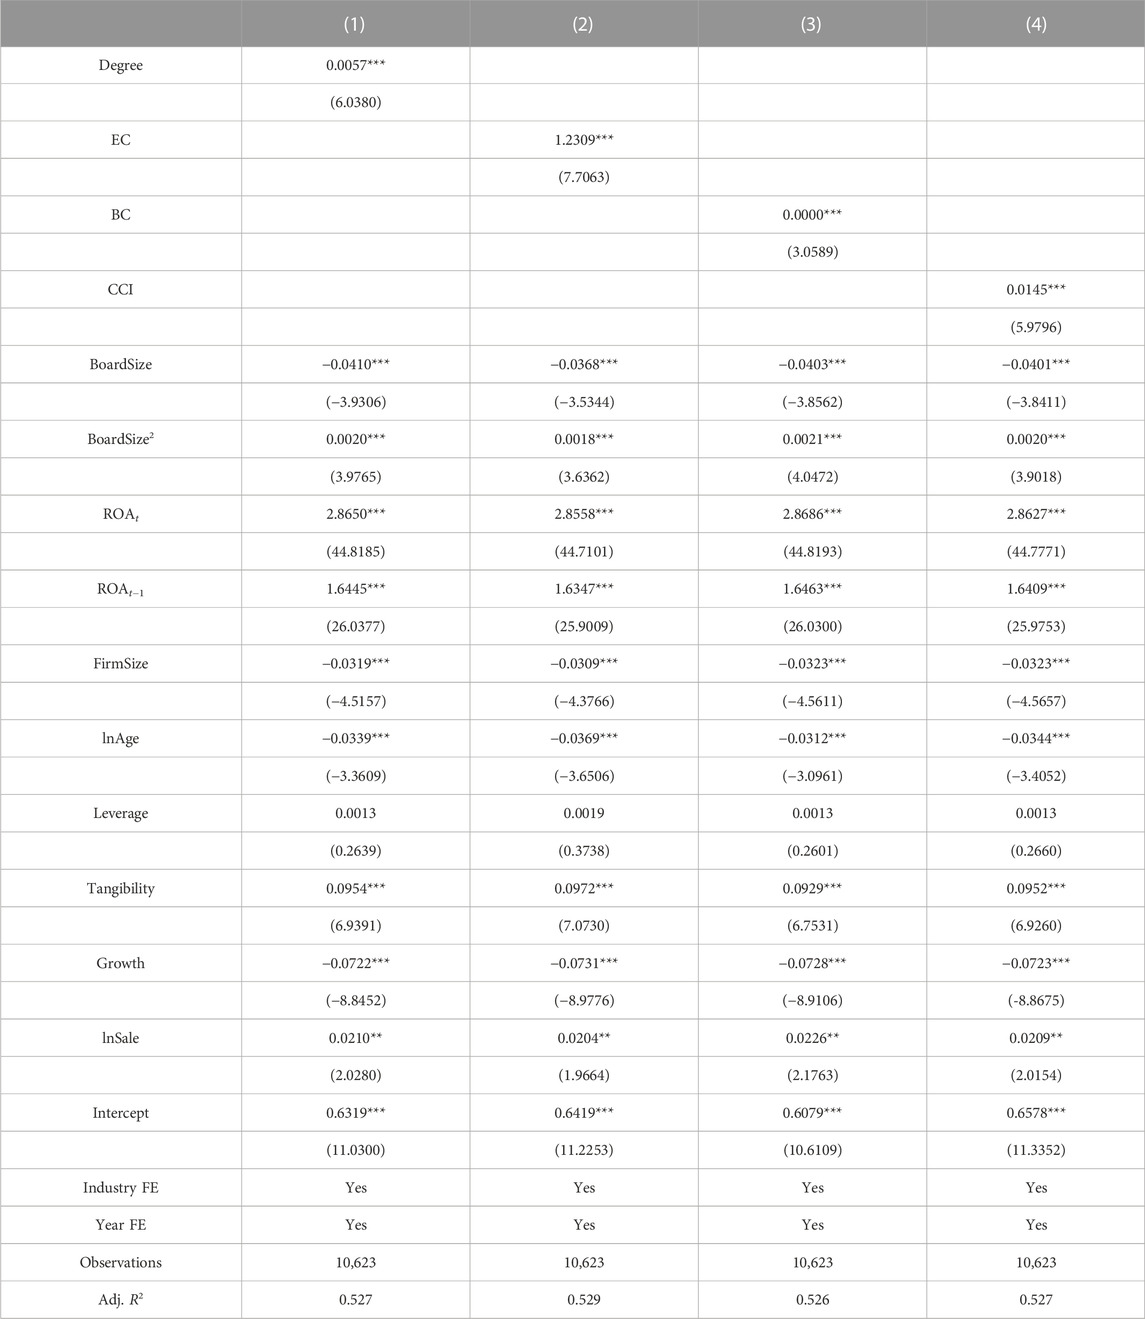
TABLE 5. Effect of network properties on Tobin’s q; this table presents the estimation results for an ordinary least square regression of board network centrality and other control variables on Tobin’s q. The dependent variable is the log of Tobin’s q. Detailed variable descriptions are provided in Section 3.1. Columns (1), (2), and (3) give the regression coefficient estimates obtained using each centrality and (4) using the CCI. T-statistics are reported in parentheses. *, **, and *** indicate significance at the 10%, 5%, and 1% levels, respectively. All variables are winsorized at 1% and 99%.
β1 captures the effect of centrality on Tobin’s q, which we anticipate to have a positive value after including control variables and industry and year-fixed effects in view of information sharing between connected boards. We include several control variables that may affect our results. First, we use industry and year-fixed effects. Because the industry has an impact on accounting profits, we include 12 industry dummies for the two-digit Standard Industrial Classification (SIC) to control for unobserved effects [38,39]. Furthermore, we use year dummies to control macroeconomic effects. Second, we control for firm characteristics that may influence strategic decisions for the firm organization. Our control variables are based on the modeling used in the literature [10,35,40,41]. The board size is calculated by the natural logarithm of the number of directors on the board. In particular, considering that the sensitivity of the board size may vary depending on the level of network connectivity, the board size variable quadratic term is added to the model to capture the movement of board size sensitivity changing non-linearly. In addition, the firm size is defined by the natural logarithm of total assets, and sale is defined by the natural logarithm of sale. Leverage is the ratio of the book value of the total debt to the book value of assets. Sale and leverage are proxies for complexity and the CEO’s need for advice [35]. Tangibility is measured by the ratio of the shareholder’s equity to sale. Growth is estimated by net property, plant, and equipment divided by sales. Firm age is the number of years since the first trading date on Compustat. Return on assets (ROA) is the ratio of earnings before interest, taxes, depreciation, and amortization to the book value of assets. The firm value depends on the current and previous profitability of a firm measured by ROA [35,40]. Third, we extract 12 different subsamples from the sample to account for the properties of industries, according to the two-digit SIC in our further analysis, as shown in Section 4.3. As suggested by the literature, including [36,37], a board of directors tend to be evaluated by its abilities in different industries, according to the relationships between industries or industrial property. We note that the opinions of board members about value maximization for shareholders vary by industry.
4 Empirical results
In this section of the paper, the primary goal is to investigate the characteristics of the reciprocate board interlock concerning the core and periphery concept of complex network theory. In addition, we test whether the interlocking structure of the board network can explain the corporate performance and change in the economic status in the core and periphery structure.
4.1 Board network effects
The main goal of this paper is to identify the relationship between firms and the network constructed by the interlocking of board members. First, we discuss how networks are defined to investigate their dynamics. A board network can be defined by the N × N adjacency matrix, network, consisting of N unique companies as nodes that are connected via the interlocking of board members as edges. Emphasizing the information channel between firms through board directors, edges are generally defined as bridges of firms. Each network has a different set of nodes from 2000 to 2015 described in Table 2, where the connections between nodes are the firm’s relationships in the board director networks, accomplished by simply treating the firm matrices.
Interlocks operate as communication channels by sharing inside information across boards. [42] and [43] have shown that board networks have the incentive to construct based on advantages and spillovers from knowledge sharing. To illustrate the networks inconsistent with the previous literature, Figure 4 presents representations of two simple board networks of 12 industries for US firms. These networks are a subset of the entire board network of US companies.
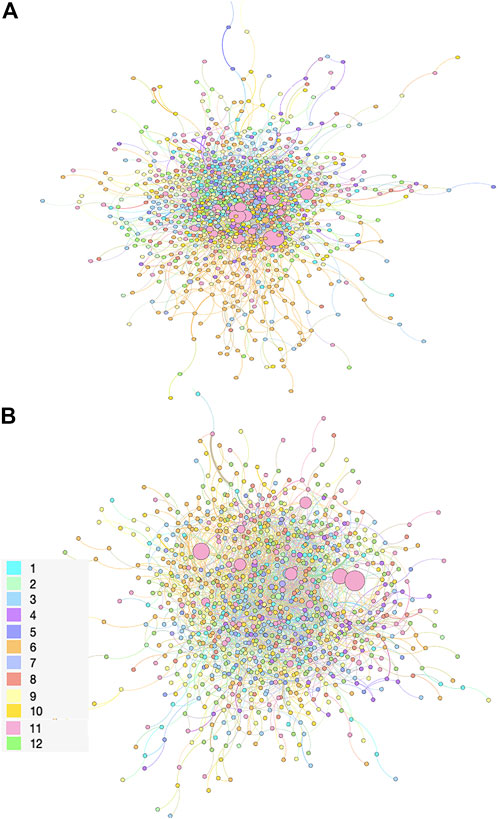
FIGURE 4. Configuration of board networks (A) in 2002 (normal period) and (B) in 2008 (tranquil period). A node represents a company, and an edge represents a link by interlocking directorates between boards. Node size means the total asset of the company. Node colors indicate the industrial groups of boards: (1) NoDur, (2) Durbl, (3) Manuf, (4) Enrgy, (5) Chems, (6) BusEq, (7) Telcm, (8) Utils, (9) Shops, (10) Hlth, (11) Money, and (12) Other.
Although a firm’s relationships constructed by board members are modeled as a bivariate analysis, based on an information-sharing channel used in M&A research, Figure 4 suggests that the connections between firms are complex. The valuable information created by board members flows through complex board networks. Weighted symmetric networks are evident via firms. To observe the impact of the flow of valuable information between firms by board directors on market stability, we use graph theory and social networks. We briefly introduce the techniques used in Section 3.2, including the concepts of several centralities, clustering, and shortest path length.
In Figure 4, the board networks of normal status consist of 1,188 nodes and 7,020 edges. The board network of the subprime crisis includes 1,112 nodes and 5,000 edges. The different colors correspond to industry sectors. If each firm does not share board members, then the board network is similar to an island. There are no connections between companies. We create board networks based on the sharing of board members for two subperiods to analyze whether the evolution of the board network is related to market stability. The board network, shown in Figures 4A, B, shows firms with higher edges between firms, irrespective of market status, implying that the valuable information created through board members of each firm has flowed to other companies.
As shown in Figures 5A, B, the degree (K) distribution function of the board network implies that most firms share small board members with other firms, whereas firms with strong influence in a market are connected to many firms. We find that the degree distribution function of 2002 (2008) follows the power-law distribution with an exponent of 4.2 (4.9). To more clearly verify the distribution function of the board network, we establish methods proposed by [44] and [45]. We conduct a likelihood ratio test and include the four distributions, including the exponential, stretched exponent, power-law, and power-law cutoff distribution functions of the power-law hypothesis, as shown in Table 6. We find that the degree distribution functions follow a power law when compared to exponential, stretched exponential, and power laws with cutoff distributions. The power-law exponents of degree distributions of the board network for each subperiod lie in ranges 3.33 and 5.91, except for 2002. Our observation implies that there are firms with valuable information through interlocking by board members.
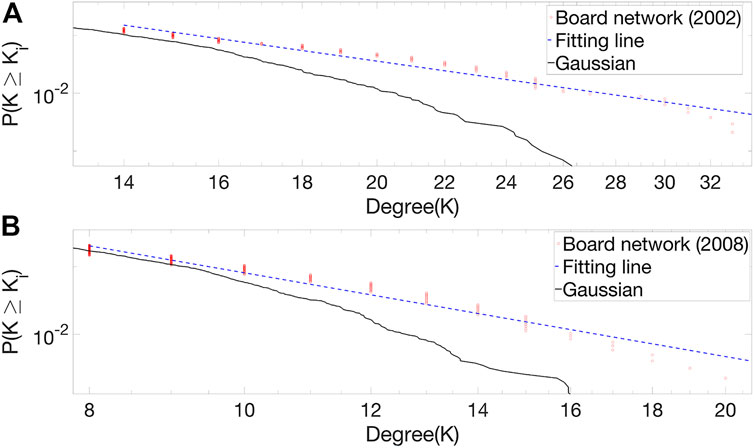
FIGURE 5. Cumulative distribution function (CDF) for the degree of the board network is plotted with a log–log scale. The CDF for the degree distribution of the network during two subsample periods (A) 2002 and (B) 2008, the Gaussian distribution, and the fitted data correspond to the red circle, the black line, and the dashed blue lines, respectively.
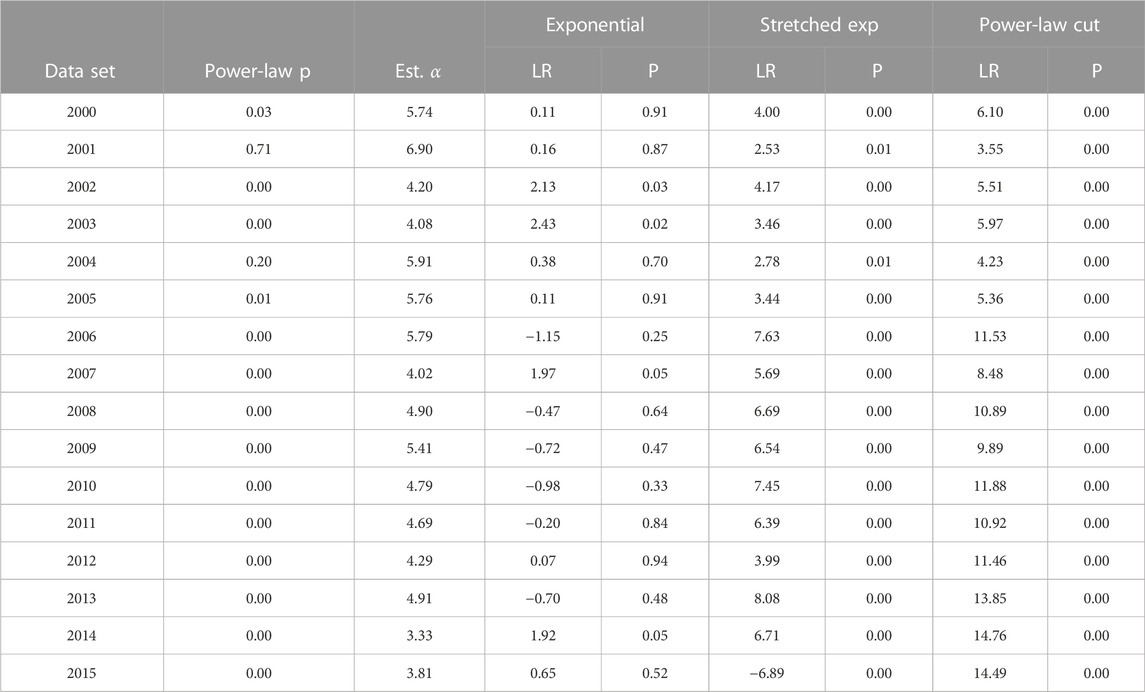
TABLE 6. Comparisons of the fitted power-law behavior to alternatives. This table shows the results of the power-law test proposed by [44] for the degree distribution of board networks from 2000 to 2015. The estimated α is the power-law exponent of the degree distribution.
From here on, we examine the concept of the core–periphery structure through two classes of nodes in view of the hierarchical relationships in board networks. One class forms a cohesive subgraph of the core where nodes are connected to each other in a maximal sense, and the other class is a periphery that is more loosely connected to the core. Figure 6 and Figure 7 shows the 100 simulation results of a random network using the benchmark of the 2000 and 2015 board networks. In the simulation, there are no large differences between the density of the core–core and the density of the periphery and core–periphery blocks. Figure 8A shows the network density of the empirical database. In the figures, the density of the core–core block increases more than that of the periphery–periphery block. Before the financial crisis, the density of the core–core block decreased from 0.02 to 0.014 in 2006. Figure 8B shows that this is not caused by a size effect to check the size of core boards measured by the number of core boards. We discover that the small number of core boards with many connections to other boards is more active than periphery boards.
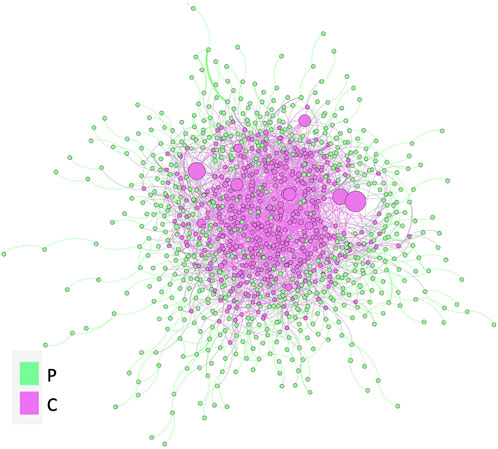
FIGURE 6. Board network in 2008 (tranquil period). A node represents a company, and an edge represents a link by interlocking directorates between boards. Node sizes denote the total assets of a company. Node colors indicate the core–periphery structure.
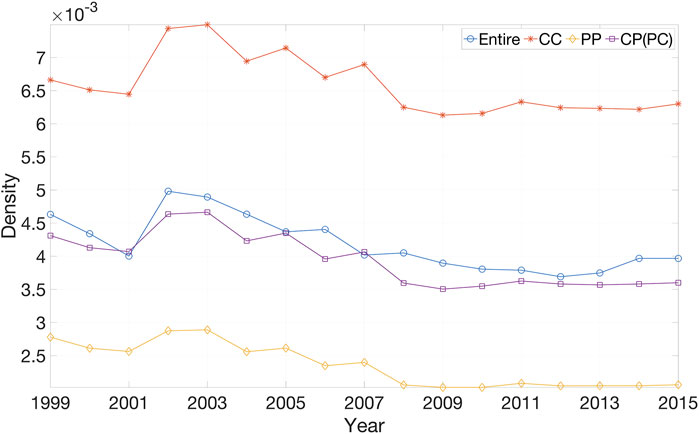
FIGURE 7. Density of a random network of 100 simulations, CC/PP/CP(PC) blocks. The definition of CCP/PP/CP(PC) blocks is explained in Figure 2. In the simulation, there are no large differences between the density of the core–core block and the density of the periphery and core–periphery blocks.
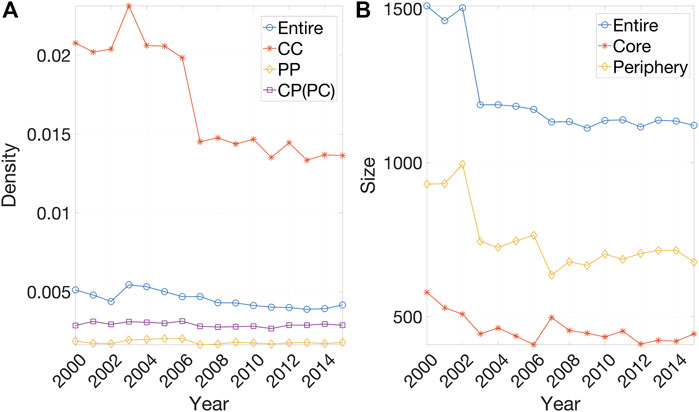
FIGURE 8. (A) Density of the entire network and CC/PP/CP(PC) blocks; (B) the number of nodes of core and periphery boards. The definition of CCP/PP/CP(PC) blocks is explained in Figure 2. In the figures, the density of the core–core block increases more than that of the periphery–periphery block.
Panel A of Table 2 presents the properties of board networks and the characteristics of the core and periphery during the sample period. The number of interlocked boards sharply decreased in 2002, which might reflect the impact of post Sarbanes–Oxley (SOX). In line with [46], the density of reciprocate board interlock ties has a tendency toward reinforcement after SOX. In view of the pattern of the fraction of edges, the density of the core–core block, ρcc, is higher than that of the periphery–periphery block, ρpp [26]. We present consistent results, as shown in Figure 8 and Table 2.
Generally, the magnitude of the eigenvalue explains how well-connected the entire network is in diagnosing the synchronizability of networks. The largest eigenvalue (λ1) for each discrete time explains the variance of the component in the board network. In other words, the largest eigenvalues indicate the behavior of the matrix component, given a market-wide effect. The second largest eigenvalue (λ2) of the board networks could be interpreted as the variability of behaviors due to the local effect. Therefore, both eigenvalues are considered indicators of how easily the network will synchronize. In Panel A of Table 2, the largest (second) eigenvalue increased in 2002 post-SOX and in the 2007 pre-crisis period, which means the board network tends to synchronize systemically and idiosyncratically in unstable conditions or a tranquil period. From the financial crisis of 2008–2009, modularity sharply increases, which means the board network shows well-constructed subgroups in the network. The average betweenness centrality (BC) of the board networks gradually increased from 2000 to 2015. From a macroscopic perspective, bridging roles or “structural holes” represent the power to control the individuals they link. In other words, board networks tend to increase the influence of a board member as a bridging role among clusters.
In Panel B in Table 2, core–periphery structures have different network characteristics. Overall, core boards have more connections with other boards than periphery boards. This shows that the average degree of core boards is three times higher than those of periphery boards. Additionally, there are consistent patterns of betweenness centrality and eigenvector centrality due to a positive relationship between network centralities. Figure 9 shows the fraction of degree in the core–periphery structure by industry. The divisions are grouped by the two-digit SIC. The fraction of the degree of the core boards and the periphery boards in each industry is calculated as the degree of each industry divided by the total degree of the core boards and the periphery boards, respectively. In Figure 9, regardless of the degree and strength, industrial groups with higher degrees of core blocks include Manuf, Shops, BusEq, and Money. This is why firms with many business relationships with other firms in manufacturing and business equipment could form the core with the highest degree in board networks. Moreover, firms with valuable knowledge in the financial industry could form the core with higher degrees than other industries in the board network. We could use this result for risk measurement as exposures to each industry group rather than for valuation for each industry group.
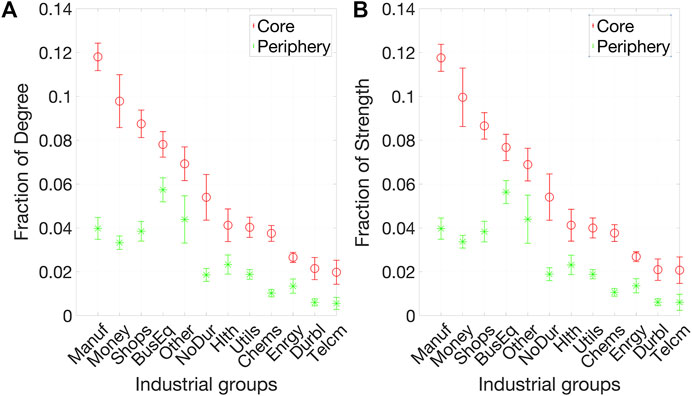
FIGURE 9. Fraction of the (A) degree and (B) strength of industrial groups. The industry description is shown in Table 1. The fraction of the degree of the core boards and the periphery boards in each industry is calculated as the degree of each industry divided by the total degree of the core boards and the periphery boards, respectively. The industrial groups with higher degrees of core blocks include Manuf, Shops, BusEq, and Money.
In summary, we find a heavy-tailed property of board networks, which means that some corporate boards play an influential role in a board network. To investigate whether core boards are in an informative position in board networks, we examine the hierarchical structure in the following section.
4.2 Evolution of board networks in a core–periphery structure
In this section, we provide a detailed analysis of the hierarchical structure of a board network. Thus far, our study shows that some firms have more connections in view of the core–periphery structure. We compare our board networks, following the hierarchical structure with a random graph benchmark. It is worth noting that there are influential core boards at the center of a board network, unlike in a random graph. Recently, [47] and [48] emphasized the potential importance of the network structure to shocks. Because board networks have hub companies with dense connections, they play a particular role that cannot be ignored in information propagation. Figure 6 illustrates the core–periphery structure of the board network in 2008. Pink nodes having a lot of links with other boards represent the core boards. We expect directors serving financial institutions to have valuable knowledge of strategic organization in risky situations. This is why supervisory directors’ banking experience positively affects banks’ performance during a financial crisis [49].
Table 7 includes transition probabilities of the state of a board for the discrete model to explain the stability of a company’s position in a board network. For instance, the first columns indicate the probabilities of a core board in year t-1(Ct−1) changing from the periphery (Pt−1) or exiting the market (Et−1), being a core member in year t (Ct). On the contrary, there is asymmetry in shifting from a core board to a periphery board and vice versa; the diagonal elements are high at over 70% due to the autocorrelation of each cluster. In line with [31], we find higher persistence in the CC and PP blocks than the PC and CP blocks between years; Figure 10 shows the transition probability (TP) of (a) CC/PP/EE blocks, (b) off-diagonal blocks, and (c) the structural stability of the board network. Structural stability is estimated by Eq. 1 in the transition probability matrix between time t and time t+1 calculated by the core–periphery structure for each year (2000–2015). The stability of the y-axis in Figure 10C denotes structural stability based on the transition probability between the core and periphery of the yearly matrix, calculated in Table 7. In Figure 10, we find that most transition probabilities are stable over time with little variation from year to year except in a precise period (2007). This was caused by increasing off-diagonal term elements in the transition probability from 2006 to 2007. This trend denotes that structural stability via a core–periphery structure changed to prepare financial information before the subprime mortgage crisis. This stability derives from the micro level of mutual links via interlocking directorates. We check the transition matrix from boards to the connected board’s industry, as shown in Table 7. In Table 8, Column 1-2 represent the connected boards of off-diagonal elements such as the PC, CP, EC, and EP blocks for 2007.

TABLE 7. Transition matrix: discrete model. C, P, and E stand for core, periphery, and exit, respectively. This matrix is calculated by the example of Figure 3. We calculated the transition probability each year and then averaged it during 2000–2015.
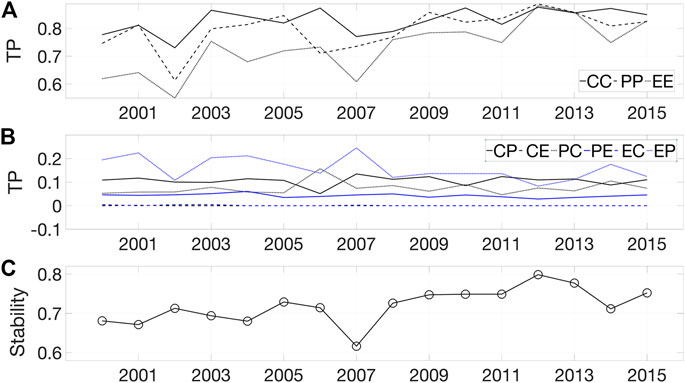
FIGURE 10. Transition probability (TP) of (A) CC/PP/EE blocks and (B) off-diagonal blocks and (C) the structural stability of the board network. Structural stability is estimated by Eq. 1 in the transition probability matrix between time t and time t+1 calculated by a core–periphery structure for each year (2000–2015). Structural stability via the core–periphery boards changed to prepare financial information before the 2007–2009 financial crisis.
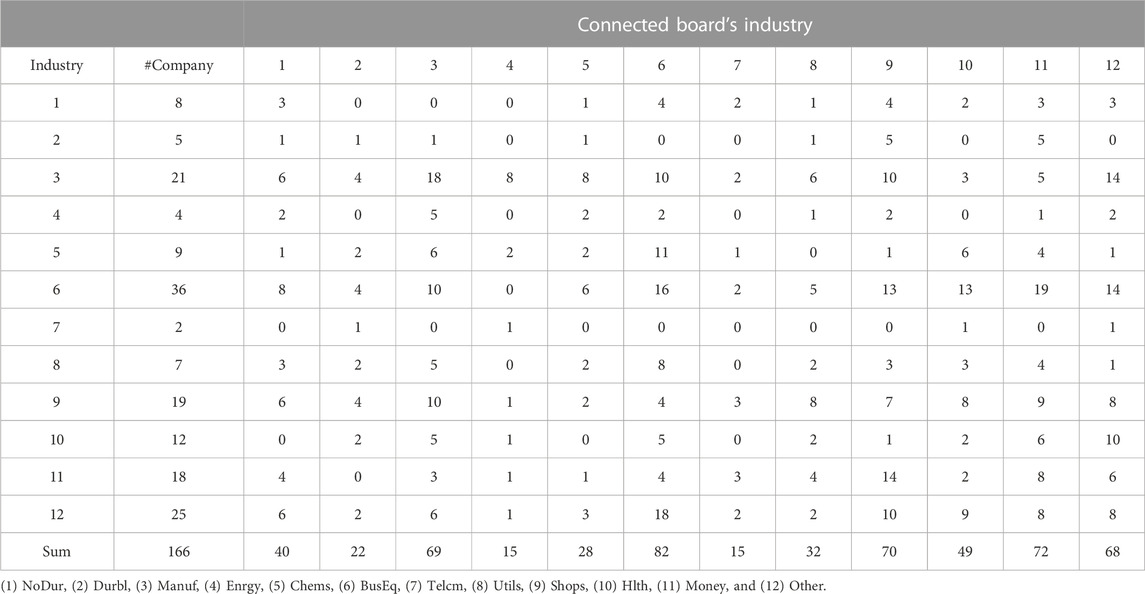
TABLE 8. Adjacency matrix of off-diagonal elements in the transition matrix at the industry level for the year 2007.
Table 8 and Figure 11 include the added information based on the transition matrix of 2007. Table 8 represents the interlocking ratio of industrial groups in 2007. The first and second columns of Table 8 display the industrial groups and the number of board members constructed in the board network in 2007, respectively. The connected board’s industry includes the connected board’s industry groups with the board network to investigate the impact of knowledge sharing between industries via interlocking directorates. Overall, the boards corresponding to the industrial groups of business equipment (82), money (72), telecommunications (70), and manufacturing (69) have more connections with the boards than other industry groups in the network. This means that some boards try to enrich the relationship with boards by having valuable information on economic responses.
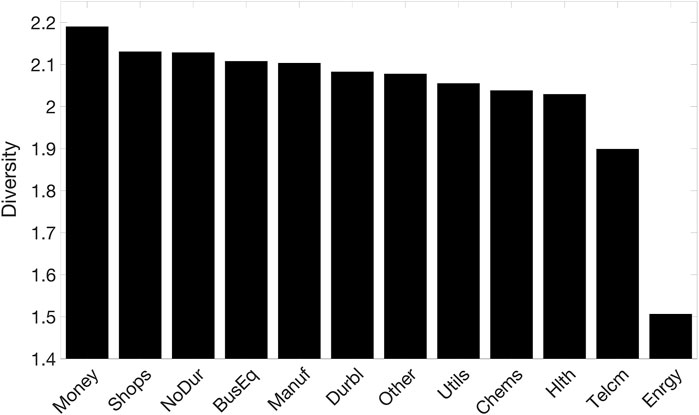
FIGURE 11. Industrial diversity of the interlocking directorates of off-diagonal elements during the pre-crisis period. Diversity is calculated by the Shannon entropy of the interlocking ratio to each industry using the off-diagonal elements from the connected boards in 2007.
We, then, calculate the diversity of the connected interlocking industry from the nodes in the off-diagonal elements. Figure 11 presents the diversity of connections by sector measured as Shannon entropy by the following equation: Diversity = -
To summarize our argument, we argue that before the 2008–2009 financial crisis, board networks show a tendency to transition toward becoming core blocks via interlocking directorates with financial institutions because of restricted information access and limited information supply.
4.3 Impact of board networks on the firm value
To the extent that the board networks in the United States have heterogeneous properties, we anticipate that the strategic behaviors of boards and their central characteristics could affect Tobin’s q. The role of the board of directors in performance is divided into two tasks 1) long-term direction for an organization and 2) internal policies for the company and soliciting stakeholder feedback. Each board is composed to embark on its straightforward functions. A board was used to decide the long-term direction of the corporate strategy. Regarding this concept, [51] insisted that external network ties determine a board’s abilities and its influence on corporate performance. In line with the literature, we assume that boards with high centrality scores in networks have high-quality board abilities. Based on our assumption, centralized boards can earn more from a long-term project than other boards. In this context, we would expect a positive effect of connectedness on the firm value measured by Tobin’s q because Tobin’s q estimates the value of a firm’s intangible assets, such as monopoly power, goodwill, high-quality managers, and growth opportunities [33].
Table 5 shows the ordinary least square regression result of board network centrality on Tobin’s q. In Table 5, each column shows the results of the explanatory variable changed to the dimension of centralities. The coefficient on Tobin’s q is positive and statistically significant and positive in terms of degree (β1 = 0.0057; p < 0.01), eigenvector centrality (β1 = 1.2309; p < 0.01), betweenness centrality (β1 = 0.0000; p < 0.01), and CCI (β1 = 0.0145; p < 0.01) in columns (1)–(4) of Table 5. These results show that a board network tends to promote firm performance by improving knowledge sharing and communication among a board of directors and encouraging integration among directors. The findings of this study support agency theory by showing a positive relationship between the CCI and firm value. Regarding the composition of a board of directors, the results of this study have important management implications. We conclude that a board with a high centrality score could be beneficial in maintaining varied information and external links and advising management along with behavioral integration and communication among board members. The results of control variables are generally consistent with the prior literature. In line with [35, 52], we show that the coefficient of board size has a significantly negative impact (β2 = −0.0401; p < 0.01) and the coefficient of board size 2 has a significantly positive impact (β3 = 0.0020; p < 0.01) in column (4) of Table 5. This suggests that the optimal board size is 10 by β2 + 2β3BoardSize = 0. In other words, a firm with more than 10 board members can be expected to create a positive firm value when members have valuable information through interlocking directorates. We obtain similar results when using regression with other centrality measures instead of the CCI, as shown in columns (1)–(3) of Table 5. This finding is analyzed by many scholars to provide evidence for the concept that smaller boards are better and that the relationship between the board size and firm value forms a U-shaped curve [35]. In addition, regarding operations, size, and the extent of reliance on external capital, complex firms have greater advisory needs than simple firms [53].
Our work has focused on operating income by division. Divisions are grouped by the two-digit SIC. It is worth noting that Tobin’s q varies by industry and firm. Firms with too much physical ownership are bound to be insensitive to the rapidly changing trends of change. To show the relationship between board networks and Tobin’s q, we regress the CCI on Tobin’s q, according to each industry in Table 9. The results in Table 9 show the regression coefficient according to the fraction of degree in Figure 9. The industry groups classified with a higher fraction of degree, as shown in columns (4)–(8) of Table 9, have significantly positive coefficients at the 1% level except for manufacturing and shops. Meanwhile, the industry groups with a lower fraction of degree in columns (9)–(11) do not show significant coefficients.
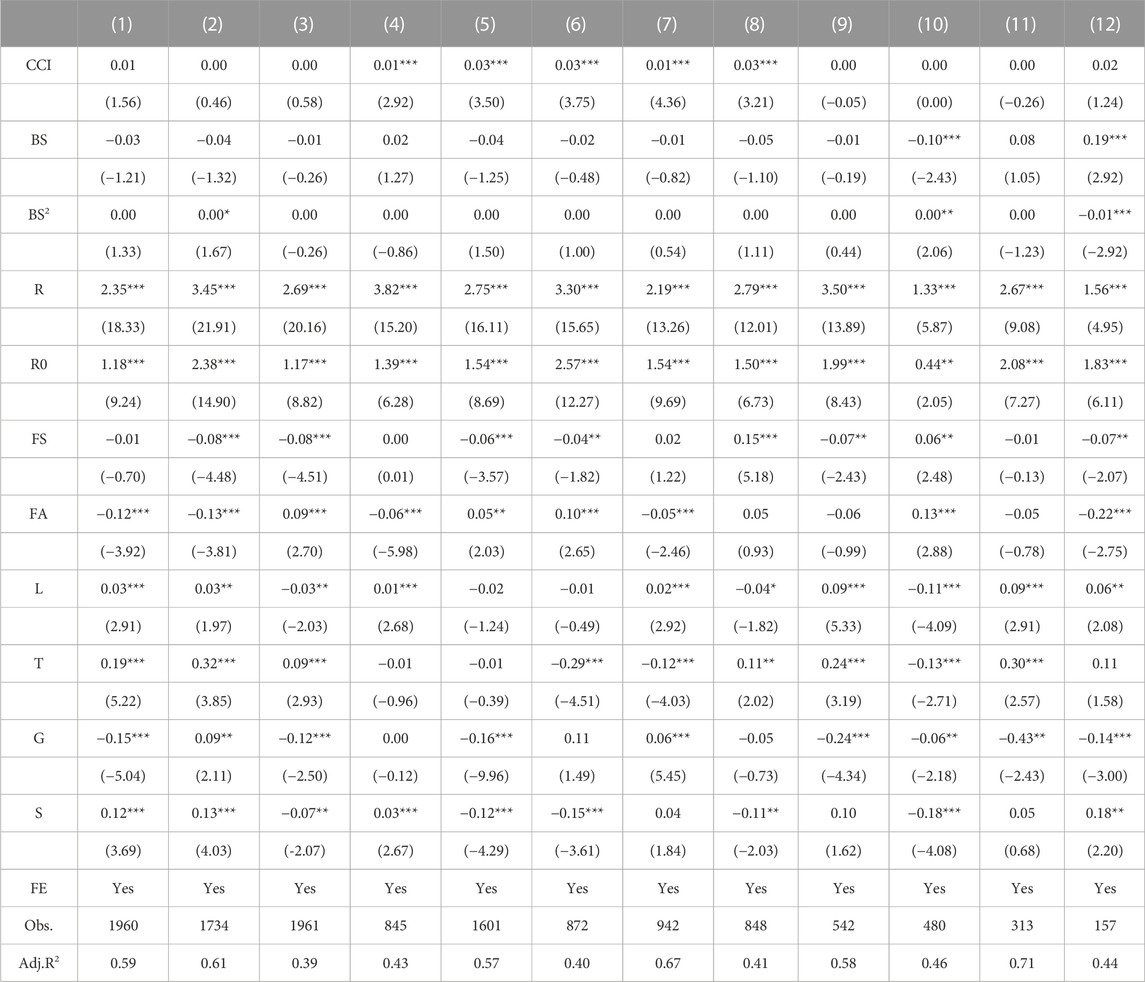
TABLE 9. Effect of network properties on Tobin’s q according to each industry. CCI is the composite centrality index, BS is board size, BS2 is the square term of board size, R is ROA, R0 is lagged ROA, FA is firm age, FS is firm size, L is leverage, T is tangibility, G is growth, and S is sale, including year fixed effects. Columns (1)–(12) present coefficient estimates for various subsamples including industry fixed effects. For various subsamples, the table represents the estimation results for an ordinary least square of board network characteristics and other control variables on Tobin’s q. (1) Manuf, (2) Shops, (3) BusEq, (4) Money, (5) Other, (6) NoDur, (7) Utils, (8) Hlth, (9) Chems, (10) Energy, (11) Durbl, and (12) Telcm. T-values are in parentheses. *, **, and *** indicate significance at the 10%, 5%, and 1% levels, respectively. All variables are winsorized at 1% and 99%.
In summary, we conclude that the 2008–2009 financial crisis affected the switching behavior of the core and periphery boards and that the centrality of board networks has a statistically positive impact on the firm value, as measured by Tobin’s q.
5 Conclusion
The goal of this investigation was to determine if statistical and dynamic properties of board networks would reveal information sharing between board members during the global financial crisis in the United States. This study constructed a corporate network using information between board members extracted from S&P 1500 in the RiskMetrics database. Our findings identify closely connected cores around small boards with relatively large numbers of links. The degree distribution of corporate networks follows a power-law distribution with statistical tests. In addition, we confirm that core boards dominate board networks composed of empirical data from random benchmarks. This result supports a kind of self-organization in board networks as denoting distinctly non-random structures [31, 54]. Furthermore, we provide evidence that a board in the financial sector has to be a core block in conditions of market instability.
Our study has a couple of limitations. First, we have not considered the influence from individual characteristics of each director. The possibility is that the representative index extracted from the director network can be utilized as the weighted variable for reflecting the ability of board members. Second, although this study found the board network dynamics concerning the financial crisis, it is difficult to fully understand the network dynamics with this result alone because a mathematical model of the network evolution is needed.
We conclude that the structural characteristics formed through connections between board members for the quality of corporate monitoring and advising to deliver information also affect the firm value. Our findings support the reputation hypothesis and offer a specific indicator of the network’s structural stability from a core–periphery structure. The existence of a small number of highly connected boards in the network structure and its impact on the firm value will be a cornerstone for future research. The direction of further developments is the network prediction based on the transition probability and director’s ability.
Data availability statement
The data analyzed in this study are subject to the following licenses/restrictions. The data necessary to generate the results observed from this paper can be provided by the corresponding author. Requests to access these datasets should be directed to Gabjin Oh, phecogjoh@gmail.com.
Author contributions
AP: conceptualization, data curation, methodology, investigation, formal analysis, writing—original draft, writing—review and editing, and funding acquisition. GO: conceptualization, supervision, methodology, investigation, writing—original draft, and writing—review and editing.
Funding
This work was supported by the Ministry of Education of the Republic of Korea and the National Research Foundation of Korea (NRF-2021S1A5B5A16078803).
Acknowledgments
The authors would like to thank seminar participants at the 2018 Asia Pacific Econophysics Conference in Taipei. The conclusions, views, opinions, and errors are those of the authors.
Conflict of interest
The authors declare that the research was conducted in the absence of any commercial or financial relationships that could be construed as a potential conflict of interest.
Publisher’s note
All claims expressed in this article are solely those of the authors and do not necessarily represent those of their affiliated organizations, or those of the publisher, the editors, and the reviewers. Any product that may be evaluated in this article, or claim that may be made by its manufacturer, is not guaranteed or endorsed by the publisher.
References
2. Wang W-K, Lu W-M, Kweh QL, Nourani M, Hong R-S. Interlocking directorates and dynamic corporate performance: The roles of centrality, structural holes and number of connections in social networks. Rev Managerial Sci (2021) 15:437–57. doi:10.1007/s11846-019-00347-2
4. Baldenius T, Melumad N, Meng X. Board composition and ceo power. J financial Econ (2014) 112:53–68. doi:10.1016/j.jfineco.2013.10.004
5. Adams RB, Almeida H, Ferreira D. Powerful ceos and their impact on corporate performance. Rev Financial Stud (2005) 18:1403–32. doi:10.1093/rfs/hhi030
6. Autor D, Dorn D, Katz LF, Patterson C, Van Reenen J. The fall of the labor share and the rise of superstar firms. Q J Econ (2020) 135:645–709. doi:10.1093/qje/qjaa004
7. Oh G, Park A. Lending diversification and interconnectedness of the syndicated loan market. Front Phys (2021) 8:581994. doi:10.3389/fphy.2020.581994
8. Falato A, Kadyrzhanova D, Lel U. Distracted directors: Does board busyness hurt shareholder value? J Financial Econ (2014) 113:404–26. doi:10.1016/j.jfineco.2014.05.005
9. Khanna V, Kim EH, Lu Y. Ceo connectedness and corporate fraud. J Finance (2015) 70:1203–52. doi:10.1111/jofi.12243
10. Omer TC, Shelley MK, Tice FM. Do director networks matter for financial reporting quality? Evidence from audit committee connectedness and restatements. Manag Sci (2020) 66:3361–88. doi:10.1287/mnsc.2019.3331
11. Zajac EJ, Westphal JD (1996). “Director reputation, ceo/board power, and the dynamics of board interlocks,” in: Academy of management proceedings. ed: S Taneja (Briarcliff Manor, NY: Academy of Management), 254–258.
12. Cai Y, Sevilir M. Board connections and m&a transactions. J Financial Econ (2012) 103:327–49. doi:10.1016/j.jfineco.2011.05.017
13. Ishii J, Xuan Y. Acquirer-target social ties and merger outcomes. J Financial Econ (2014) 112:344–63. doi:10.1016/j.jfineco.2014.02.007
14. Stuart TE, Yim S. Board interlocks and the propensity to be targeted in private equity transactions. J Financial Econ (2010) 97:174–89. doi:10.1016/j.jfineco.2010.03.012
15. Li H-J, Bu Z, Wang Z, Cao J. Dynamical clustering in electronic commerce systems via optimization and leadership expansion. IEEE Trans Ind Inform (2019) 16:5327–34. doi:10.1109/tii.2019.2960835
16. Li H, Xu W, Qiu C, Pei J. Fast markov clustering algorithm based on belief dynamics. IEEE Trans Cybernetics (2022) 1–10. doi:10.1109/tcyb.2022.3141598
17. Li H-J, Wang Z, Cao J, Pei J, Shi Y. Optimal estimation of low-rank factors via feature level data fusion of multiplex signal systems. IEEE Trans Knowledge Data Eng (2020) 34:1–2871. doi:10.1109/tkde.2020.3015914
18. Li H-J, Wang L, Bu Z, Cao J, Shi Y. Measuring the network vulnerability based on markov criticality. ACM Trans Knowledge Discov Data (Tkdd) (2021) 16:1–24. doi:10.1145/3464390
19. Coles JL, Daniel ND, Naveen L. Co-opted boards. Rev Financial Stud (2014) 27:1751–96. doi:10.1093/rfs/hhu011
20. Mizruchi MS. What do interlocks do? An analysis, critique, and assessment of research on interlocking directorates. Annu Rev Sociol (1996) 22:271–98. doi:10.1146/annurev.soc.22.1.271
21. Granovetter M, Action E. Economic action and social structure: The problem of embeddedness. Am J Sociol (1985) 91:481–510. doi:10.1086/228311
22. Larcker DF, So EC, Wang CC. Boardroom centrality and firm performance. J Account Econ (2013) 55:225–50. doi:10.1016/j.jacceco.2013.01.006
23. Newman ME. Fast algorithm for detecting community structure in networks. Phys Rev E (2004) 69:066133. doi:10.1103/physreve.69.066133
24. Newman ME. Finding community structure in networks using the eigenvectors of matrices. Phys Rev E (2006) 74:036104. doi:10.1103/physreve.74.036104
25. Reichardt J, Bornholdt S. Statistical mechanics of community detection. Phys Rev E (2006) 74:016110. doi:10.1103/physreve.74.016110
26. Borgatti SP, Everett MG. Models of core/periphery structures. Social networks (2000) 21:375–95. doi:10.1016/s0378-8733(99)00019-2
27. Borgatti SP, Mehra A, Brass DJ, Labianca G. Network analysis in the social sciences. science (2009) 323:892–5. doi:10.1126/science.1165821
28. Bonacich P. Power and centrality: A family of measures. Am J Sociol (1987) 92:1170–82. doi:10.1086/228631
29. Wasserman S, Faust K. Social network analysis: Methods and applications. Cambridge: Cambridge University Press (1994).
31. Milaković M, Alfarano S, Lux T. The small core of the German corporate board network. Comput Math Organ Theor (2010) 16:201–15. doi:10.1007/s10588-010-9072-4
32. Tobin J. A general equilibrium approach to monetary theory. J money, credit banking (1969) 1:15–29. doi:10.2307/1991374
33. Perfect SB, Wiles KW. Alternative constructions of tobin’s q: An empirical comparison. J empirical Finance (1994) 1:313–41. doi:10.1016/0927-5398(94)90007-8
34. Shleifer A, Vishny RW. A survey of corporate governance. J Finance (1997) 52:737–83. doi:10.1111/j.1540-6261.1997.tb04820.x
35. Coles JL, Daniel ND, Naveen L. Boards: Does one size fit all? J financial Econ (2008) 87:329–56. doi:10.1016/j.jfineco.2006.08.008
36. Coles JL, Li Z, Wang AY. Industry tournament incentives. Rev Financial Stud (2018) 31:1418–59. doi:10.1093/rfs/hhx064
37. Ashraf R, Dass N, Nanda V. Industry centrality: Weak ties, industry attributes, and managerial contracting. Financial Manag (2022) 51:663–99. doi:10.1111/fima.12380
38. Fama EF, French KR. Industry costs of equity. J financial Econ (1997) 43:153–93. doi:10.1016/s0304-405x(96)00896-3
40. Daines R. Does Delaware law improve firm value? J Financial Econ (2001) 62:525–58. doi:10.1016/s0304-405x(01)00086-1
41. Joh SW. Corporate governance and firm profitability: Evidence from Korea before the economic crisis. J financial Econ (2003) 68:287–322. doi:10.1016/S0304-405X(03)00068-0
43. Scott J. Networks of corporate power: A comparative assessment. Annu Rev Sociol (1991) 17:181–203. doi:10.1146/annurev.so.17.080191.001145
44. Clauset A, Shalizi CR, Newman ME. Power-law distributions in empirical data. SIAM Rev (2009) 51:661–703. doi:10.1137/070710111
45. Virkar YS. Power-law distributions and binned empirical data. Ph.D. thesis. Boulder: University of Colorado (2012).
46. Withers M, Kim JYR, Howard M. The evolution of the board interlock network following sarbanes-oxley. Social Networks (2018) 52:56–67. doi:10.1016/j.socnet.2017.05.005
47. Acemoglu D, Carvalho VM, Ozdaglar A, Tahbaz-Salehi A. The network origins of aggregate fluctuations. Econometrica (2012) 80:1977–2016. doi:10.3982/ECTA9623
48. Gabaix X. The granular origins of aggregate fluctuations. Econometrica (2011) 79:733–772. doi:10.3982/ECTA8769
49. Fernandes C, Farinha J, Martins FV, Mateus C. Supervisory boards, financial crisis and bank performance: Do board characteristics matter? J banking Regul (2017) 18:310–37. doi:10.1057/s41261-016-0037-5
50. Güner AB, Malmendier U, Tate G. The impact of boards with financial expertise on corporate policies. Massachusetts: National Bureau of Economic Research (2006).
51. Carpenter MA, Westphal JD. The strategic context of external network ties: Examining the impact of director appointments on board involvement in strategic decision making. Acad Manag J (2001) 44:639–60. doi:10.5465/3069408
52. Guest PM. The impact of board size on firm performance: Evidence from the UK. Eur J Finance (2009) 15:385–404. doi:10.1080/13518470802466121
53. Klein A. Firm performance and board committee structure. J L Econ (1998) 41:275–304. doi:10.1086/467391
Keywords: board networks, firm value, interlocking directorates, network core, network formation
Citation: Park A-Y and Oh G (2023) The core of board networks and firm value. Front. Phys. 11:1099870. doi: 10.3389/fphy.2023.1099870
Received: 16 November 2022; Accepted: 13 January 2023;
Published: 03 February 2023.
Edited by:
Umberto Lucia, Polytechnic University of Turin, ItalyReviewed by:
Okyu Kwon, National Institute for Mathematical Sciences, Republic of KoreaYinhai Fang, Nanjing Forestry University, China
Hui-Jia Li, Beijing University of Posts and Telecommunications (BUPT), China
Copyright © 2023 Park and Oh. This is an open-access article distributed under the terms of the Creative Commons Attribution License (CC BY). The use, distribution or reproduction in other forums is permitted, provided the original author(s) and the copyright owner(s) are credited and that the original publication in this journal is cited, in accordance with accepted academic practice. No use, distribution or reproduction is permitted which does not comply with these terms.
*Correspondence: Gabjin Oh, phecogjoh@chosun.ac.kr
 A-Young Park
 Gabjin Oh