Optimum design of acoustic stealth shape of underwater vehicle model with conning tower
 Yuhang Tang1
  Zilong Peng
- 1Unit 92578 of the People’s Liberation Army, Beijing, China
- 2School of Energy and Power Engineering, Jiangsu University of Science and Technology, Zhenjiang, China
We present an optimization algorithm for achieving optimal acoustic stealth performance during designing an underwater vehicle shape in the free field using COMSOL-MATLAB integrated software. A component superposition method based on phase interference is adopted to simplify and decompose a nonaxisymmetric complex underwater vehicle model into two main parts: the hull and the conning tower. The shape of underwater vehicle hull is described mathematically with a sequence of undetermined coefficients for optimization. The basic mathematical principle of the proposed method is Kirchhoff approximation, also called planar element method (PEM). Additionally, some examples and experimental results show that this method can realize the automatic optimization design of acoustic stealth shapes for underwater vehicle model in a given frequency band and acoustic incident angle range. The underwater vehicle design has a smooth appearance with low target strength (TS) or angle detection rate for most detection angles and frequency bands after optimized.
1 Introduction
With the development of underwater acoustic countermeasure technology, developing a means of designing the shapes of underwater vehicles more scientifically to reduce their TSs and improve their acoustic stealth ability is a topic of great interest in underwater acoustic physics. Underwater vehicles constitute the most important type of equipment among the underwater weapons of all countries, and their shape design is a major and complicated task. The shape design of early underwater vehicles was generally performed empirically, and the drag coefficient was obtained through experimentation or simulation (computational fluid dynamics, CFD). Finally, the performance was compared to determine an optimum shape. Mackay [1] experimentally measured the drag coefficient of the standard underwater vehicle model under different Reynolds numbers and compared the results with the DSSP20 simulation data. Suman et al. [2] calculated and evaluated the hydrodynamic performance of different ellipsoidal shapes of underwater vehicle heads based on CFD and obtained an optimum underwater vehicle head shape, which was verified experimentally. Praveen [3] used CFD simulation and experiments to study the influence of the length of an underwater vehicle on the hydrodynamic performance caused by the attack angle of an axisymmetric underwater vehicle and studied the linear variation of the drag coefficient with the length-to-diameter ratio (L/D). Moh et al. [4] performed CFD analysis on all available equations of the stern shapes of all underwater vehicles from the perspective of minimum resistance and discussed the optimum hydrodynamic shape of the stern of the underwater vehicle. The next work [5] involved examining an underwater vehicle or torpedo-segmented bare hull (bow, middle, and stern) using different linear CFD calculations and comparing the results to obtain an underwater vehicle hull shape with less resistance. Using the CFD method and FLOW VISION software, the optimal L/D of the hydrodynamic shape of a cylindrical hull was proposed [6].
With the introduction of optimization algorithms, the design of underwater vehicle shapes has entered a new stage. Vasudev et al. [7] established a multi-objective optimization framework for underwater vehicle shape design and optimized the internal volume and hydrodynamic resistance of the underwater vehicle by integrating the non-dominant sequencing genetic algorithm and Reynolds-average Navier–Stokes solver into one code. In a follow-up study [8], a genetic algorithm (GA) was used to solve the design optimization problem of an autonomous underwater vehicle (AUV) under the five-parameter axisymmetric description. Through this approach, the hull shape at a constant speed was optimized, and the flow resistance coefficient was significantly reduced. Paz et al. [9] established a comprehensive model of underwater vehicle conceptual design (hull geometry parameterization, mobility model based on slender body theory, and resistance formula) applicable to a multi-objective optimization technique (GA) to find a design solution that minimized the turning diameter and created resistance requirements. Ting et al. [10] proposed an underwater vehicle shape optimization platform composed of multiple commercial software packages to reduce the navigation resistance of underwater vehicles and to improve their energy utilization and endurance. These scholars obtained excellent results in the automatic optimization design of ship shapes, but their work did not consider the TS changes caused by the development of active detection in the shape design of underwater vehicles.
A considerable breakthrough has been made in the method of calculating the acoustic scattering of underwater targets, but for the complex structures of underwater vehicles, only numerical calculations or approximate calculations using acoustic scattering can be employed. More complete numerical calculation methods and approximation methods include the finite element method (FEM) and boundary element method (BEM) [11, 12], T-matrix method [13–15], time domain finite difference method (TDFDM) [16, 17], deformation column method (DCM) [18–20], and wave superposition method (WSM) [21]. There are many other approximate methods. The highlight model (HM) proposed by Tang [22] decomposes a target into simple sub-targets, calculates the highlight parameters of the sub-targets separately, and finally obtains the TS of the whole target according to the principle of linear superposition. Abawi [23] used the Kirchhoff Approximation (KA) to establish a method of obtaining the frequency- and time-domain solutions of an acoustic scattering field of arbitrary shape. To improve the calculation rate of the PEM, Lavia [24] proposed using curved elements instead of planar elements. The numerical solution of the TS agrees well with the precise solution. Kookhyun [25] proposed a method of quickly estimating the sonar cross-sections of large and complex underwater targets such as Underwater vehicles and torpedoes. This method is based on the deterministic scattering center model, uses a combination of physical and geometric optics to construct a scattering center database, and then utilizes the database to perform polynomial interpolation on the incident angle to reconstruct the sonar cross-section. Fan et al. [26] established visual graphical acoustics computing based on the Kirchhoff approximate equation. Based on OpenGL technology, this method involves converting the geometric model into the visual pixel graphics of the target on the screen, obtaining the target surface normal vector and space distance information contained in the pixel, and finally converting the surface integral in the prediction of echo characteristics into the pixel summing calculation of the visual graphics on the screen. Using the Kirchhoff approximation method, Peng et al. [27] performed a scattering time-domain echo simulation of a surface ship radiated through the sonar area, and verified the effectiveness of this method experimentally. However, the research work of these scholars only predicts the acoustic target intensities of existing underwater vehicles and does not include a low-TS underwater vehicle shape design method. Li et al. proposed an optimal design method for the acoustic stealth shape of the underwater vehicle head [28] and bottom object [29] with relatively lower TS, based on the Nelder–Mead optimization algorithm and finite element method.
To address this shortcoming, a non-axisymmetric complex underwater vehicle target was simplified and decomposed in this study using the component phase interference superposition method into two main parts: the hull and the conning tower (both considered as rigid targets). Then, the underwater vehicle hull and conning tower were utilized as the optimization objects to explore the optimization design of an acoustically concealed shape in a given incident angle range and frequency band. This approach overcomes the limitations of the previous underwater vehicle shape optimization design method that only considers hydrodynamic performance and opens a new channel for underwater vehicle shape design.
In this paper, the benchmark underwater vehicle models are selected as our research object. The optimization method of the head shape of benchmark hull and conning tower with lower TS under the incidence of plane wave with multi-frequencies and multi-angles is studied. This paper is organized as follows. In Section 2, the physical acoustical method is introduced, which is the basis of calculating TS of the arbitrary target. In Section 3, we introduce the optimum design of acoustic stealth shapes of underwater vehicle hull and conning Tower, respectively. In Section 4, we present the optimization results of hull and conning tower for a give frequency band and detection angle. In Section 5, the PEM method is verified by experimental results. Finally, a summary and a discussion of the results are presented in Section 6.
2 Physical acoustical method
The difficulty of solving the problem of acoustic scattering from complex targets such as underwater vehicles has led to many approximate solution theories, such as physical acoustics. Figure 1 shows a schematic diagram of the derivation of the physical acoustic method.
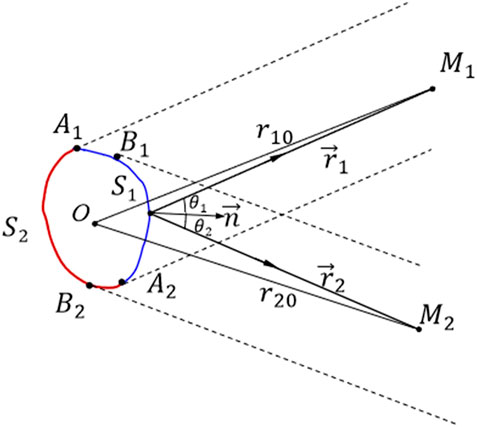
FIGURE 1. Schematic diagram of the derivation of the physical acoustic method with the source and receiver separated.
Omitting the time factor
where S1 is the area directly illuminated by the incident sound wave, called the bright area, and S2 is the area not illuminated by the incident sound wave, called the shadow area.
where Pi, Ps is the incident sound pressure and the scattering sound pressure. And the incident pressure is expressed as
Considering the far-field conditions
Substituting Eqs 2–4 into Eq. 1 yields
In monostatic situation,
The details of calculation of Eq. 6 can be found in Ref. [28], which is omitted here.
3 Optimum design of acoustic stealth shapes of underwater vehicle hull and conning tower
Based on the PEM, this section considers the underwater vehicle hull and conning tower (considered as a rigid target at this stage) as the optimization objects and establishes the method of obtaining an optimized shape for acoustic concealment with a plane wave of a given frequency band and incident angle range. The optimized hull is a simplified benchmark hull model. During the optimization process, the generatrix line type of underwater vehicle hull is parameterized and controlled by a specific segment function that uses six hull optimization variables to describe it quantitatively. Before optimization, the conning tower is a simplified model of the benchmark conning tower. During the optimization process, the shape of the conning tower is regulated by the bottom and top contour lines and four optimized lofting control curves. The bottom contour line type remains the same as that of the original benchmark conning tower, and the top contour line type is obtained by scaling the bottom contour line type (by a scaling factor a). The deviation of each optimized lofting control curve from its corresponding initial lofting control curve is characterized by a Bernstein polynomial and scaling factor a.
The optimization method takes the displacement change rate of the hull and conning tower and the gradient of the lofting control curve as the constraints. The simulated annealing (SA) optimization algorithm is used to iterate the hull generatrix segmentation function. The six variables in the segmented function of the generatrix of the boat body to be determined, parameterized model of the conning tower of the command board, segmented function of the boat body generatrix, and contour control of the conning tower of the command board are iterated when the minimum optimal objective function is obtained through optimization calculation. Then, the optimal hull and conning tower shapes for acoustic concealment are determined. The optimized objective function is obtained by combining the COMSOL-MATLAB integrated modeling technology and the PEM to calculate the TSs of the hull and conning tower in a given frequency band and angle range and is weighted in a specific way. Figure 2 provides the details of the optimization algorithm flow.
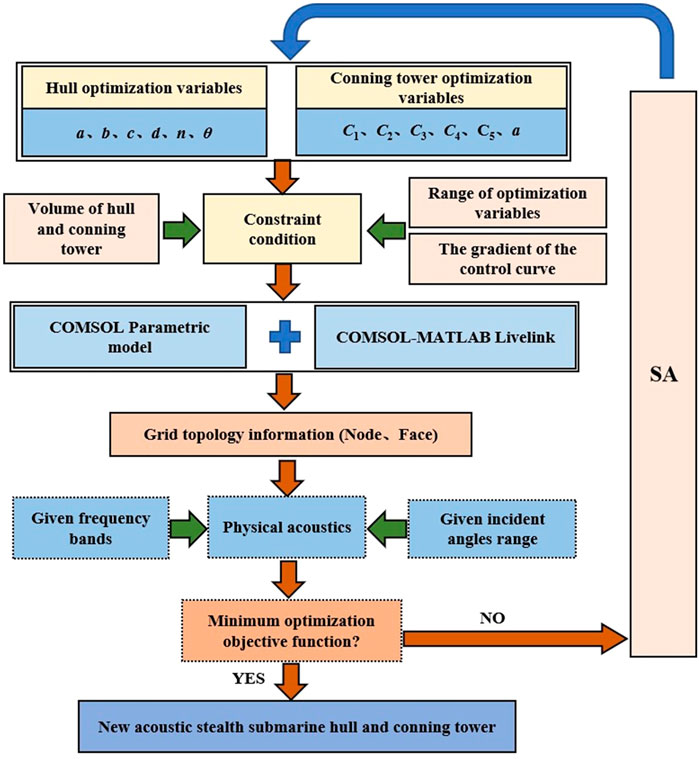
FIGURE 2. Schematic diagram of hull and conning tower optimization method.
3.1 Underwater vehicle hull geometry description and optimized variable control
Most underwater vehicle hulls are axisymmetric targets and can be divided into three parts: bow, middle, and stern. Figure 3A provides a schematic diagram of the linear piecewise function of the hull.
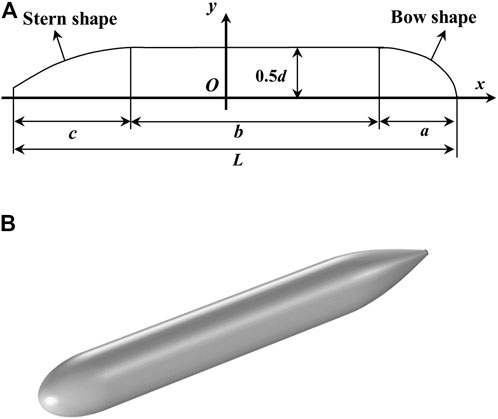
FIGURE 3. (A) Geometric description of axisymmetric hull. (B) Original hull.
The overall length of the hull is
Equation 7 is the bow linear function. Linear bow control can be achieved by introducing variable n and combining variable a. Equation 8 is the stern linear function. Through variables c and θ linear stern control can be realized.
The overall shape of the hull can be controlled by variables a, b, c, d, n, and θ. To make the optimized hull shape more reasonable, the range of optimization variables and optimization constraints should be set. Table 1 shows the ranges of the optimization variables.
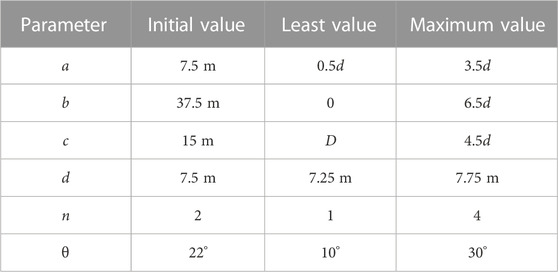
TABLE 1. Optimization variable range settings for hull.
It can be seen from Table 1 that the total length L changes with the diameter of the hull in the optimization process. To obtain a reasonable shape, additional hull volume constraints need to be imposed. Figure 3B depicts the initial hull shape. The initial hull volume is V0 = 2,220.4 m3. During the optimization process, V satisfies 85% V0 ≤ V ≤ 115% V0.
The stern linear function is more complicated and changeable. To make the optimized stern result more reasonable and to avoid a concave stern, the boundary constraints are shown as
3.2 Geometric description of conning tower and optimal variable control
The conning tower, also known as the underwater vehicle bridge, is one of the most important parts of a underwater vehicle. As a complex structure, there is no general function expression for the shape of a conning tower. Hence, parametric modeling of the conning tower was performed using the lofting tool in the geometric modeling software. Basic geometric modeling software has such a modeling tool.
It can be seen from Figure 4 that parametric modeling of the conning tower can be realized in the optimization process through four lofting control curves. The steps of the parametric modeling process for the conning tower are as follows. Firstly, the contour shape of the bottom surface of the conning tower remains unchanged. Then, the uppermost contour of the conning tower becomes the bottom contour after plane scaling (by a zoom factor a). Next, moving up 3.5 m along the z-axis, the zoom center is located at the origin of the x-y coordinate system. Finally, using the lofting operation, based on the bottom and top contours, lofting is performed along the four lofting curves to obtain the new conning tower.
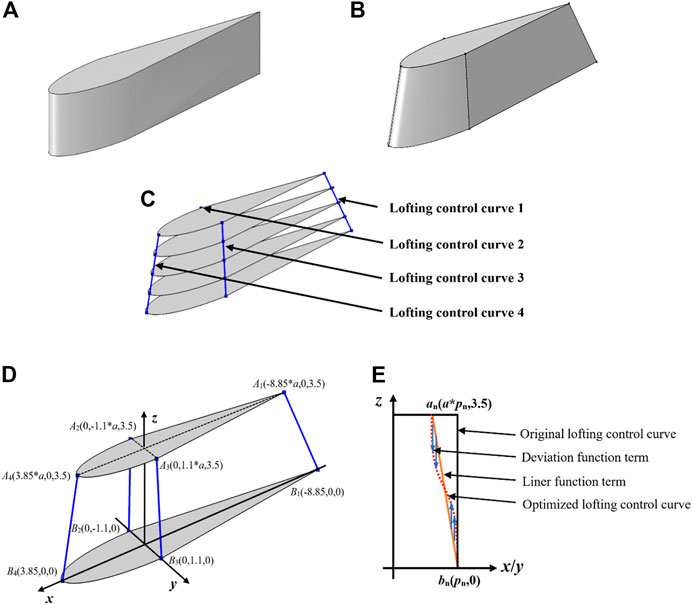
FIGURE 4. Basic idea of conning tower parametric modeling in the optimization process. (A) Original benchmark conning tower. (B) Optimized conning tower. (C) Lofting control curve of the conning tower. (D) Key points of 3D lofting control curve optimization. (E)Two-dimensional deviation function.
The optimized lofting control curve function can be obtained by adding the designed deviation function based on the lofting curve (linear function), as shown in Figure 4.
As shown in Figure 4D, there are two important position points for the four fitting control curves. Each lofting control curve is converted into a two-dimensional plane. As shown in Figure 4E, the corresponding points are converted, where An and Bn are converted into an and bn, respectively. The coordinates of an and bn are (a × pn, 4) and (pn, 0), respectively, and p1, p2, p3, and p4 are −8.85, −1.1, 1.1, and 3.85, respectively. When the first and second control curves are distributed on the negative semi-axes in the x and y directions, Figure 4E is not applicable. At this time, only the corresponding points and curves are mirrored on the z-axis.
The optimized lofting control curve function is composed of two items: a linear function item and a deviation function, as shown in Figure 4E. The deviation function is shown in Eq. 10. The basic expression of the fifth-order Bernstein polynomial, which serves as the basis function to express the deviation function (without the i = 0 term) is
Taking the third optimized lofting control curve function as an example, its two-dimensional plane is the y-z plane and the formula is expressed as
Gradient constraints of the optimized lofting control curve are set to avoid the discontinuity of echoes of the optimized conning tower, which can be expressed as
The boundary gradient constraints of the second, third, and fourth optimized lofting control curves correspond to the first, second, and third terms of Eq. 13, respectively. In the first one, the lofting control curve is optimized, and
The volume constraint is also set. The volume of the original benchmark conning tower is V0 = 28.6 m3, and the volume constraint is 85% V0 ≤ V ≤ 115% V0.
The overall shape of the conning tower can be controlled by variables a, C1, C2, C3, C4, and C5, and the ranges of the optimized variables are set, as shown in Table 2.
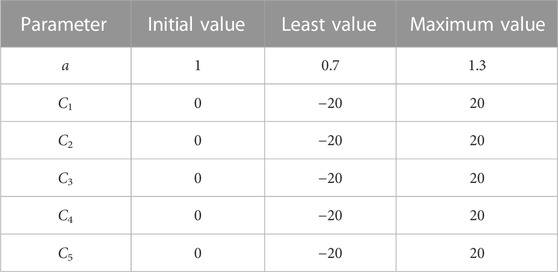
TABLE 2. Optimization variable ranges for conning tower.
3.3 Objective function
In the optimization process, the objective function of the optimization design must be clarified. Considering the deficiencies of the optimization objective function, a new type of acoustic stealth shape optimization objective function suitable for the hull and conning tower is proposed. The optimized objective function is determined by taking the product of the energy superposition of the TS at different incident angles and different frequency points and the linear average of all TS in the optimization process, to obtain the underwater vehicle hull and conning tower shapes for acoustic concealment. Equation 14 gives the optimization target used by this algorithm.
where n and N is the start frequency and end frequency of optimization, respectively. N1 is the number of frequency points, m is the start angle of incidence, M is the end angle of incidence, M1 is the optimized number of angles,
Figure 5 presents the TS calculation diagrams of the underwater vehicle hull and conning tower used in the optimization process. When calculating the TS of the conning tower, the z-axis coordinate of the lowest profile surface of the conning tower is 3.75 m, and the acoustic geometric center of the hull is set at the center of the hull when calculating the TS. That is, for both the hull and conning tower, the acoustic geometric center of the TS calculation is at the coordinate origin (0, 0, 0) to ensure that the relative positions of the hull and conning tower space remain unchanged and the correctness of the echoes from the hull and conning tower assembly are obtained by overlapping the complex sound pressures of the sub-components.
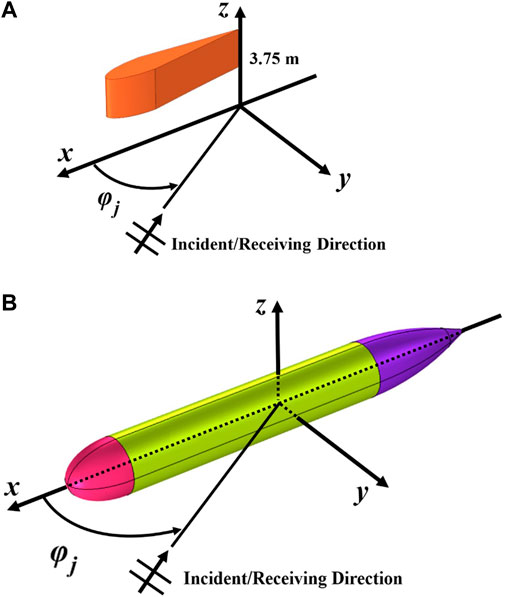
FIGURE 5. Schematic diagram for calculating the TSs of the hull and conning tower. (A) Conning tower. (B) Hull target.
It should be noted that the parametric modeling method given in Section 3.1 is only for the conning tower. When calculating the TS of the conning tower, the z-axis coordinate of the lowest surface of the conning tower is 3.75 m to ensure that the relative position of the conning tower space remains unchanged.
3.4 Introduction to SA optimization algorithm
The SA algorithm was firstly proposed by Metropolis et al. [30] in 1953. This approach is a stochastic optimization algorithm based on the Monte Carlo iterative solution strategy. Its starting point is based on the similarity between the annealing process of solid matter in physics and general combinatorial optimization problems. The SA algorithm starts from a certain high initial temperature, and with the continuous decrease of the temperature parameters, combined with probabilistic sudden jump characteristics, it randomly finds the global optimal solution of the objective function in the solution space. That is, the local optimal solution can jump out probabilistically and eventually tend to the global optimum.
The SA algorithm is an optimization algorithm that can effectively avoid falling into local minima and finally approaches the global optimal serial structure by giving the search process a time-varying probability jump ability that eventually approaches zero. Figure 6 presents a flow chart of the basic concept.
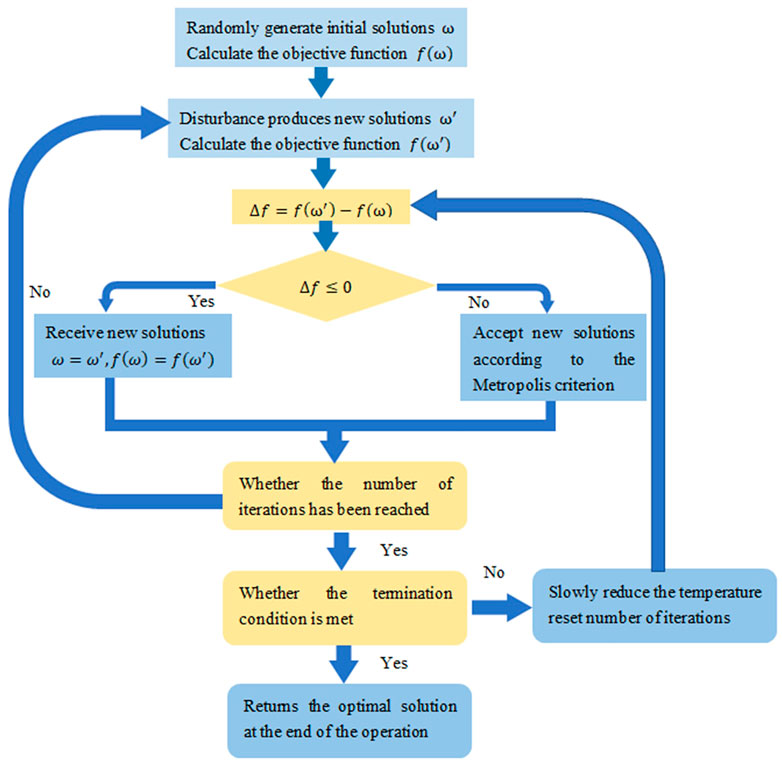
FIGURE 6. Basic concept of SA.
4 Optimization results
4.1 Multi-frequency and multi-angle optimization of hull
When the plane wave is irradiated onto the underwater vehicle hull with a frequency modulation signal, the unknown detection angle greatly increases the possibility of exposure. To reduce the probability of being discovered, this section presents the optimal hull design for acoustic concealment considering multiple frequencies and angle. The optimized objective function under the working conditions in Eq. 14 should be simplified, as shown in Eq. 15:
where n is the optimized start frequency, N is the optimized stop frequency, N1 is the number of optimized frequency points, m is the optimized initial angle of incidence, M is the optimized final angle of incidence, M1 is the optimized number of angles,
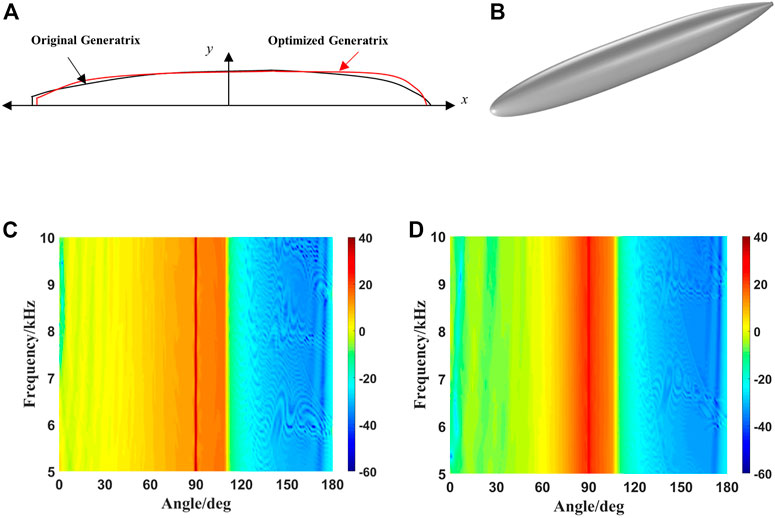
FIGURE 7. Comparison of the hull generatrices before and after optimization and three-dimensional diagram after optimization. (A) Front and rear hull generatrices. (B) Optimized 3D model of the hull. (C) Angle–frequency spectra of hull TS before optimization. (D) Angle–frequency spectra of hull TS after optimization.
The six optimized variables of the bus-line type control in the optimized new hull are a = 23.6259 m, b = 5.6487 m, c = 31.2789 m, d = 7.5690 m, n = 2.1950, and θ = 18.3310°. When the hull before and after optimization is irradiated by plane acoustic wave at a frequency of 5.0–10.0 kHz and an incident angle of 0°–180°, the TS angle–frequency spectrum can be calculated, as shown in Figures 7C, D.
The TS angle–frequency spectra of hull before and after hull optimization have their limitations. Therefore, Figure 8 compares the horizontal azimuth characteristics and angle detection rate of the hull at different frequency points. Because the azimuth characteristics and angular detection rate of the hull are the same at each frequency point, the results are only under two frequency points.
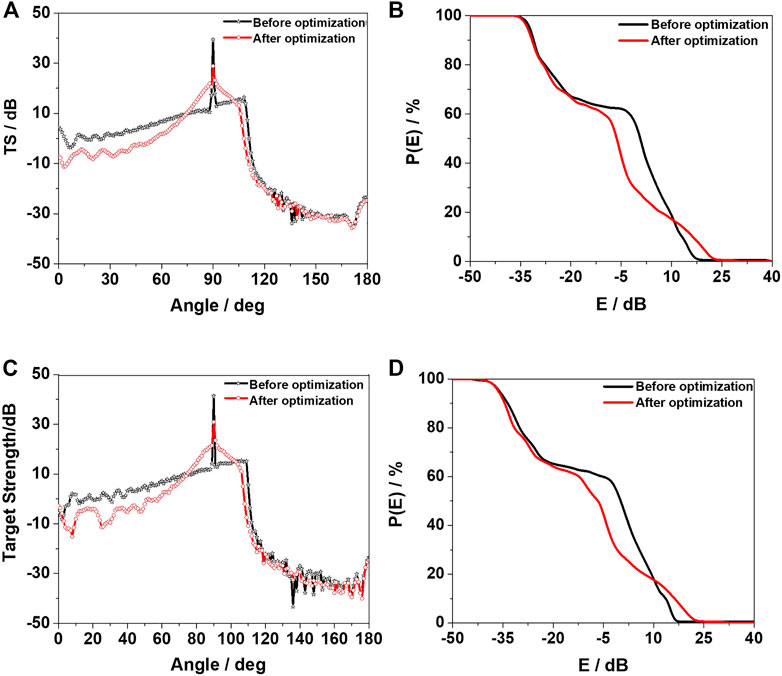
FIGURE 8. Azimuth characteristics and detection rate with respect to angle of the TS of the hull before and after optimization. (A,B) are f = 5.0 kHz. (C,D) are f = 10.0 kHz.
Figures 8A–D compare the azimuth characteristics and angle detection rate of the TS before and after optimization of the hull at f = 5.0 kHz and f = 10.0 kHz. The TS of the optimized hull is lower than that of the original hull at most angles and frequencies. Although the optimization has a certain effect, the optimized objective function has certain limitations and does not specifically consider the changes in the TS at all angles and frequencies. Within the range of 120°–180°, the TS of the hull before and after optimization does not differ much. After optimization, it is reduced by approximately 3 dB compared to that before optimization. The reason is that the echo energy at the stern part of the hull is relatively weak in this angle range, and the reduction range is limited, making little contribution to the optimization objective function. The algorithm ignores this part in the process of optimization through iteration. The same conclusion can be obtained from the angle detection rate graph, where the angle is 0°–180° with a step length of 1° and the frequency range is 5.0–10.0 kHz with a step length of 0.05 kHz. After calculation, the total average TS after optimization is reduced by 5.89 dB compared to that before optimization. For the abeam direction (90°), the total average TS after optimization is reduced by 10.37 dB compared to that before optimization. After optimization, the hull displacement is 85.2% of V0.
4.2 Multi-frequency and multi-angle optimization of the conning tower
The optimization objective function used for conning tower shape optimization is given by Eq. 14. The optimized frequency band was selected to be 5.0–10.0 kHz, and the step length was 0.25 kHz for optimization. The optimization angle range was 0°–180° with a step length of 1°. Figure 9 compares the fourth lofting control curve of the optimized conning tower and shows the optimized three-dimensional diagram. The calculation time was 113 h, and the computer parameters were as mentioned earlier.
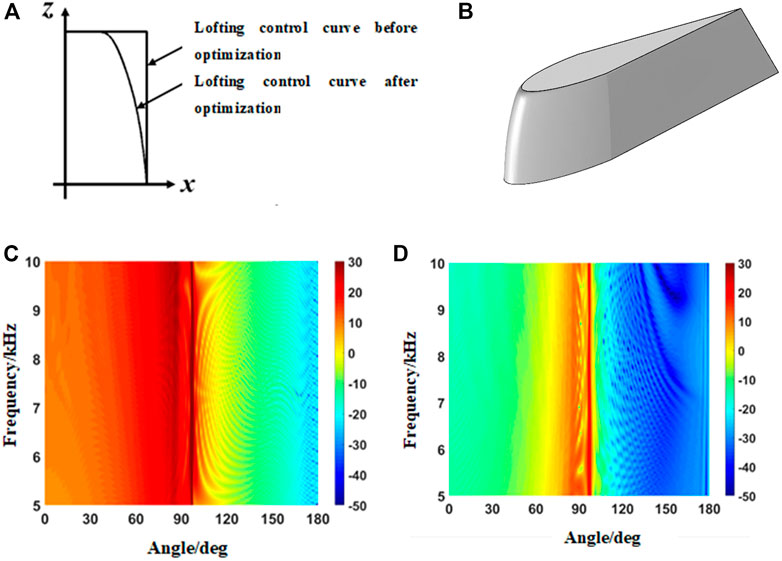
FIGURE 9. Optimized conning tower models. (A) Lofting control curve comparison. (B) Optimized conning tower model. (C) Angle–frequency spectra of the conning tower TS before optimization. (D) Angle–frequency spectra of the conning tower TS after optimization.
The six optimized variables of the tower model obtained through optimization are a = 0.7730, C1 = 3.3020, C2 = 16.0461, C3 = 18.1762, C4 = 16.0281, and C5 = 8.1101. Figures 9C, D shows the angle–frequency spectra of the TS of the conning tower before and after optimization.
The horizontal azimuth characteristics of the TS and angle detection rate of the conning tower under different frequency were compared as well, as shown in Figure 10. It can be seen from Figure 10 that in the optimized frequency band and angle range, the optimized conning tower has a lower TS than the original conning tower. This conclusion can also be seen from the comparison of the conning tower detection rate before and after optimization, where the incident angle range is 0°∼180° with a step size of 1° and the frequency range is 5.0–10.0 kHz with a step size of 0.05 kHz. After calculation, the total average TS after optimization is reduced by 18.21 dB compared to that before optimization, and the optimized volume is 85.1% V0.
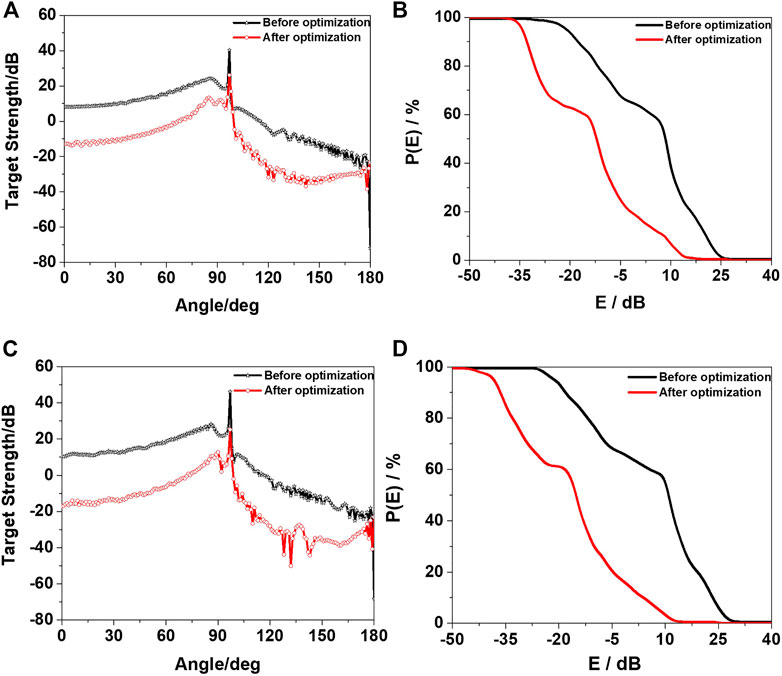
FIGURE 10. Azimuth characteristics and angle detection rate of the conning tower TS before and after optimization. (A,B) are f = 5.0 kHz. (C,D) are f = 10.0 kHz.
4.3 Evaluation of optimization effect of hull and conning tower combination
Sections 4.1, Sections 4.2 described the optimization of the acoustic stealth shapes of the hull and conning tower. The original benchmark hull and conning tower combination and optimized hull and conning tower combination were used to calculate the TS (ignoring the errors caused by assembly). The specific dimensions were described in the text. TS calculation diagram is shown in Figure 11.
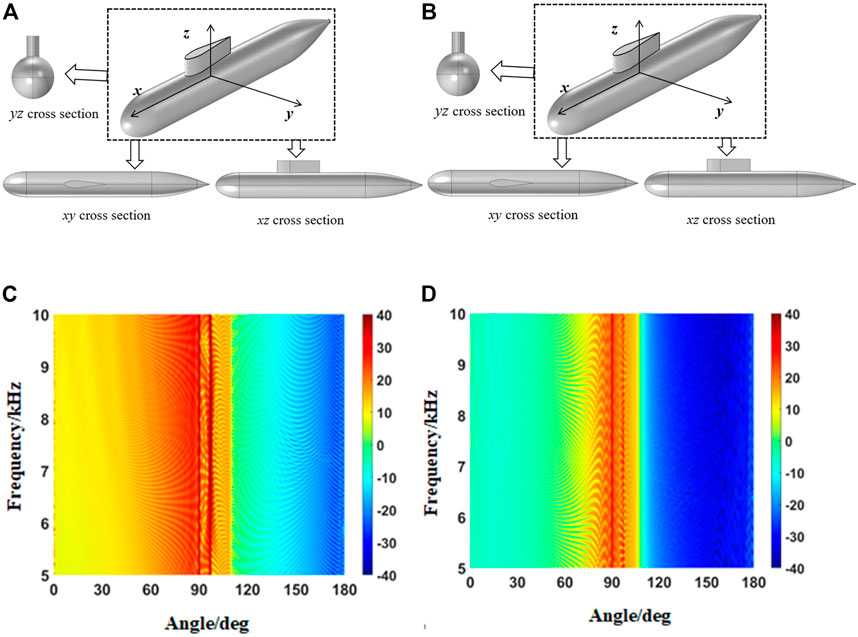
FIGURE 11. (A) Original model. (B) Optimized model. (C) Angle–frequency spectra of the TS of the assembly of the hull with conning tower before optimization. (D) Angle–frequency spectra of the TS of the assembly of the hull with conning tower after optimization.
Using the PEM to calculate the original and optimized benchmark hull and conning tower combinations, the angle–frequency spectrum of the TS was obtained in Figure 11. Figure 12 presents the azimuth angle characteristics and detection rate according to the angle for the optimized front and rear hull and conning tower combination at different frequency points.
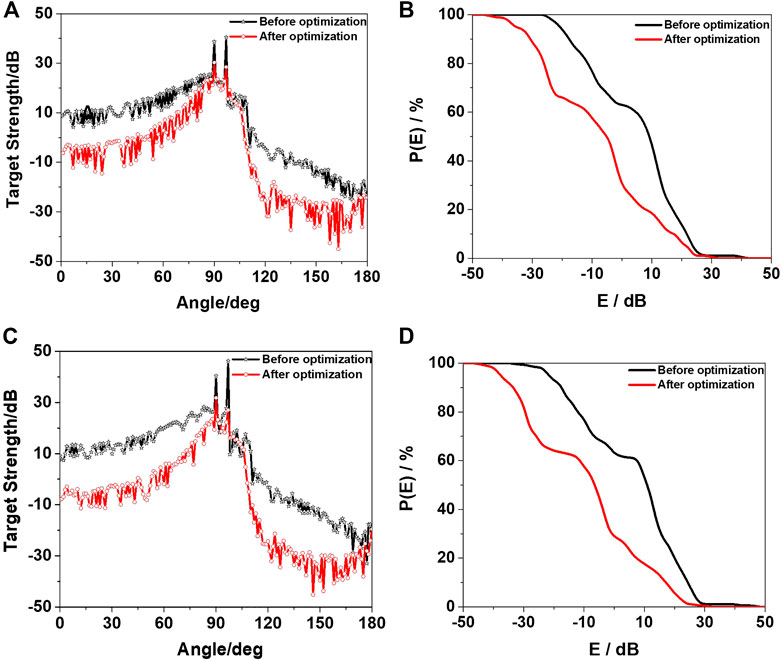
FIGURE 12. Comparison of azimuth characteristics and angle detection rate of TS of the assembly of the hull and conning tower before and after optimization. (A,B) are f = 5.0 kHz. (C,D) are f = 10.0 kHz.
It can be seen from Figures 11, 12 that the TS of the hull and conning tower combination before and after optimization are quite different. In most angle ranges, the sound concealment of the optimized hull and conning tower combination is obviously better than that before optimization, where the incident angle range is 0°–180° with a step size of 1° and the frequency range is 5.0–10.0 kHz with a step size of 0.01 kHz. After calculation, the total average TS after optimization is reduced by 10.58 dB compared to that before optimization. The total average TS after optimization is reduced by 10.36 dB at the abeam direction compared with that before optimization.
5 Experimental verification
The specific Benchmark submarine model and the test equipment are shown in Figure 13. It is a scale single shell benchmark model with a scaling value of 1:15.
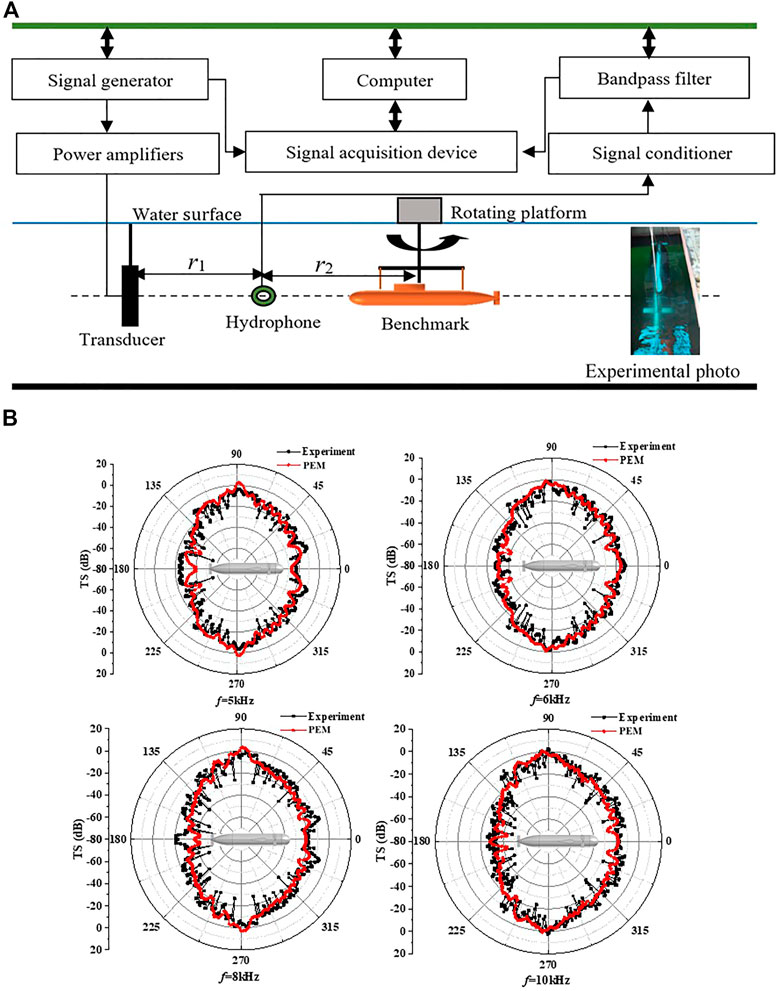
FIGURE 13. (A) Test equipment layout. (B) TS results comparisons between the experimental and PEM results at different frequencies.
The TS calculation formula is as follows
where ps and ps@1m are the echo pressure from Benchmark submarine received by the hydrophone and at 1 m, respectively. p1 is sound pressure of sound source received by hydrophone. r1 and r2 are the distances between hydrophone and transducer or target center, respectively. Vs and V1 are voltage amplitudes of target echo and sound source received by hydrophone, respectively.
The shell is considered as a rigid target in the simulation calculation. TS comparisons of a Benchmark submarine between the experimental results and PEM in monostatic configuration are shown in Figure 13.
As illustrated in Figure 13, at the frequency of 5, 6, 8, and 10 kHz, the TS directivity of Benchmark presents a butterfly shape for both simulation results and experimental results, that is, the TS is low when the acoustic wave is incident from bow and stern, and highest during the abeam incident.
By conducting the acoustic scattering experiment of Benchmark submarine scale model in lake, the experimental results at different frequencies are obtained. From Figure 13B, the TS average errors between PEM and experimental results are within ±3 dB with a good agreement.
6 Conclusion
In this study, the hull and conning tower of an underwater vehicle (considered as rigid targets) were used as the optimization objects, and the method of optimizing the underwater vehicle shape for acoustic concealment considering incident plane waves of multiple angles and frequencies was established based on the PEM. Experiment results is used to prove that PEM and experimental results are in good agreement. The volume change rates of the hull and the conning tower, and the gradient of the generatrix or lofting control curve is chosen as constraints. the. The six variables in the precise section function of the hull generatrix and the six variables in the parametric model of the conning tower were determined respectively by applying SA optimization algorithm. The weight of the TS in the given frequency band and angle range of the hull and conning tower shell was chosen as the optimized objective function by applying COMSOL-MATLAB integrated modeling technology combined with the PEM. After optimization, the six variables in the segmental function of the hull generatrix and the shape control function of the conning tower were obtained to determine the optimal hull and conning tower shapes for acoustic concealment, when the optimized objective function was the smallest.
(1) The optimization method proposed in this paper overcomes the original limitation of relying only on experience or hydrodynamic performance optimization to modify the line shapes of the underwater vehicle hull and conning tower. Further, it can be utilized to perform automatic optimization of the shapes of the hull and conning tower for acoustic concealment within a given frequency band and angle range.
(2) When the plane wave was f = 5.0–10.0 kHz and an incident angle range of 0°–180°, the optimized hull has a total average TS 5.89 dB lower than that before optimization when this method is applied. In particular, the abeam angle is reduced by about 10.37 dB, and the optimized volume is 85.2% V0. The total averaged TS of the optimized conning tower is 18.21 dB lower than that before optimization in the optimized frequency band, and the optimized volume is 85.1% V0.
(3) When the plane wave was f = 5.0–10.0 kHz and the incident angle range is 0°–180°, the total average TS of the hull and conning tower combination is reduced by 10.58 dB compared with combination of hull and conning tower before optimization. When the abeam angle is 90°, the total average TS after optimization is reduced by 10.36 dB compared to that before optimization.
The optimization method proposed in this paper has still some deficiencies. For example, one of the constraint conditions is the volume or displacement of optimization model should be within 15%, which makes the reduction of TS depends on two factors, i.e., both the shape modification and the volume variation. However, if the volume variation can be constrained within 1%, the optimization work will be more rigorous and convincing. But meanwhile, the convergence performance of this optimization will be worse and unsatisfied, and the optimization process will be more time-consuming. Thus the optimization algorithm need further research and improvement in the future. In conclusion, the optimization method can greatly reduce the TS of the hull and conning tower in a given frequency band and incident angle range, enabling the automatic optimization of underwater vehicle hull and conning tower shapes for acoustic stealth. This optimization method can serve as a reference for the design of underwater acoustic stealth vehicle shapes.
Data availability statement
The original contributions presented in the study are included in the article/supplementary material, further inquiries can be directed to the corresponding author.
Author contributions
We thank YT and BL for in modeling and simulation. We thank XW and ZP for instruction. We also thank XM and SG for their helpful discussions.
Funding
This work was supported by the Foundation Strengthening Program Area Fund of Science and Technology Commission of the Central Military Commission (No. 2020-JCJQ-JJ-228), Natural Science Foundation of Jiangsu Province (No. BK20200995) and National Youth Science Foundation of China (No.52201397).
Acknowledgments
We are grateful for the proofreading of the article by Jiaman Du. Finally, we would like to thank the reviewers for the insightful comments and helpful suggestions made.
Conflict of interest
The authors declare that the research was conducted in the absence of any commercial or financial relationships that could be construed as a potential conflict of interest.
Publisher’s note
All claims expressed in this article are solely those of the authors and do not necessarily represent those of their affiliated organizations, or those of the publisher, the editors and the reviewers. Any product that may be evaluated in this article, or claim that may be made by its manufacturer, is not guaranteed or endorsed by the publisher.
References
1. Mackay M, Defence R. The standard submarine model: A survey of static hydrodynamic experiments and semiempirical predictions. Halifax, Canada: Defence R&D (2003).
2. Suman KNS, Rao DN, Das HN, Bhanu Kiran G. Hydrodynamic performance evaluation of an ellipsoidal nose for a high speed under water vehicle. Jordan J Mech Ind Eng (2010) 4(5):641–52.
3. Praveen PC, Krishnankutty P. Study on the effect of body length on the hydrodynamic performance of an axi-symmetric underwater vehicle. Indian J Geo-Marine Sci (2013) 42(8):1013–22.
4. Moonesun M, Korol YM, Brazhko A. CFD analysis on the equations of submarine stern shape. J Taiwan Soc Naval Architects Mar Eng (2015) 34(1):21–32.
5. Moonesun M, Korol Y, Dalayeli H. CFD analysis on the bare hull form of submarines for minimizing the resistance. Int J Maritime Tech (2015) 3:1–16.
6. Moonesun M, Korol YM, Dalayeli H, Tahvildarzade D, Javadi M, Jelokhaniyan M, et al. Optimization on submarine stern design. Proc Inst Mech Eng M: J Eng Maritime Environ (2017) 231(1):109–19. doi:10.1177/1475090215625673
7. Vasudev KL, Sharma R, Bhattacharyya SK. Multi-objective shape optimization of submarine hull using genetic algorithm integrated with computational fluid dynamics. Proc Inst Mech Eng Part M: J Eng Maritime Environ (2019) 233(1):55–66. doi:10.1177/1475090217714649
8. Vasudev KL, Sharma R, Bhattacharyya SK. Shape optimisation of an AUV with ducted propeller using GA integrated with CFD. Ships and Offshore Structures (2018) 13(2):194–207. doi:10.1080/17445302.2017.1351292
9. Paz JDM, Muñoz ODT. Multiobjective optimization of a submarine hull design. Ciencia y tecnología de buques (2014) 7(14):27–42. doi:10.25043/19098642.92
10. Gao T, Wang Y, Pang Y, Cao J. Hull shape optimization for autonomous underwater vehicles using CFD. Eng Appl Comput Fluid Mech (2016) 10(1):599–607. doi:10.1080/19942060.2016.1224735
11. Wu TW, Li WL, Seybert AF. An efficient boundary element algorithm for multi-frequency acoustical analysis. The J Acoust Soc America (1993) 94(1):447–52. doi:10.1121/1.407056
12. Everstine GC, Henderson FM. Coupled finite element/boundary element approach for fluid–structure interaction. J Acoust Soc America (1990) 87(5):1938–47. doi:10.1121/1.399320
13. Waterman PC. New formulation of acoustic scattering. J Acoust Soc America (1969) 45(6):1417–29. doi:10.1121/1.1911619
14. Waterman PC. Matrix theory of elastic wave scattering. J Acoust Soc America (1976) 60(3):567–80. doi:10.1121/1.381130
15. Boström A. Scattering of stationary acoustic waves by an elastic obstacle immersed in a fluid. J Acoust Soc America (1980) 67(2):390–8. doi:10.1121/1.383925
16. Jie S, Weisong Z, Xiangjun J, Xin Z, Malekian R. Underwater broadband acoustic scattering modelling based on FDTD. Elektronika ir Elektrotechnika (2015) 21(2):58–64. doi:10.5755/j01.eee.21.2.11513
17. Ma L, Wang R, Xiang H. Computation of bi-static target strength and separation of forward-scattering sound from objects. Acta Acustica (2009) 6.
18. Stanton TK. Sound scattering by cylinders of finite length. III. Deformed cylinders. J Acoust Soc America (1989) 86:691–705. doi:10.1121/1.398193
19. Stanton TK. Sound scattering by spherical and elongated shelled bodies. J Acoust Soc America (1990) 88(3):1619–33. doi:10.1121/1.400321
20. Partridge C, Smith ER. Acoustic scattering from bodies: Range of validity of the deformed cylinder method. J Acoust Soc America (1995) 97(2):784–95. doi:10.1121/1.412943
21. Sarkissian A. Method of superposition applied to scattering from a target in shallow water. J Acoust Soc America (1994) 95(5):2340–5. doi:10.1121/1.409870
23. Abawi AT. Kirchhoff scattering from non-penetrable targets modeled as an assembly of triangular facets. J Acoust Soc America (2016) 140(3):1878–86. doi:10.1121/1.4962735
24. Lavia EF, Gonzalez JD, Blanc S. Modeling high-frequency backscattering from a mesh of curved surfaces using Kirchhoff Approximation. J Theor Comput Acoust (2019) 27(04):1850057. doi:10.1142/s2591728518500573
25. Kim K, Cho JH, Kim JH, Cho DS. A fast estimation of sonar cross section of acoustically large and complex underwater targets using a deterministic scattering center model. Appl Acoust (2009) 70(5):653–60. doi:10.1016/j.apacoust.2008.07.009
26. Fan J, Tang WL, Zhuo LK. Planar elements method for forecasting the echo characteristics from sonar targets. J Ship Mech (2012) 16(1-2):171–80.
27. Peng Z, Wang B, Fan J. Simulation and experimental studies on acoustic scattering characteristics of surface targets. Appl Acoust (2018) 137:140–7. doi:10.1016/j.apacoust.2018.02.014
28. Li B, Peng Z, Wen H, Fan J, Song H. Research on the optimization design of acoustic stealth shape of the underwater vehicle Head. Acoust Aust (2020) 48:39–47. doi:10.1007/s40857-019-00170-5
29. Li B, Zhou F, Fan J, Wang B, Peng Z. Research on the optimization design of the acoustic stealth shape of a bottom object. J Theor Comput Acoust (2022) 30(02):2150009. doi:10.1142/s2591728521500092
Keywords: target strength, acoustic stealth, phase interference, optimization design, underwater vehicle model, conning tower
Citation: Tang Y, Wang X, Miao X, Gao S, Li B and Peng Z (2023) Optimum design of acoustic stealth shape of underwater vehicle model with conning tower. Front. Phys. 11:1105787. doi: 10.3389/fphy.2023.1105787
Received: 23 November 2022; Accepted: 16 January 2023;
Published: 07 February 2023.
Edited by:
Zhixiong Gong, Shanghai Jiao Tong University, ChinaReviewed by:
Yongou Zhang, Wuhan University of Technology, ChinaChengzhi Shi, Georgia Institute of Technology, United States
Copyright © 2023 Tang, Wang, Miao, Gao, Li and Peng. This is an open-access article distributed under the terms of the Creative Commons Attribution License (CC BY). The use, distribution or reproduction in other forums is permitted, provided the original author(s) and the copyright owner(s) are credited and that the original publication in this journal is cited, in accordance with accepted academic practice. No use, distribution or reproduction is permitted which does not comply with these terms.
*Correspondence: Xueren Wang, wangxueren@aliyun.com