Dynamic 18F-FDG-PET kinetic parameters for epileptogenic zone localization in drug-resistant epilepsy
 Kitiwat Khamwan1,2
  Chanan Sukprakun1
  Chusak Limotai3,4
  Suda Jirasakuldej3,4
  Attapon Jantarato5 Thiravat Hemachudha6
  Supatporn Tepmongkol1,2,4,7*
- 1Division of Nuclear Medicine, Department of Radiology, Faculty of Medicine, Chulalongkorn University, Bangkok, Thailand
- 2Chulalongkorn University Biomedical Imaging Group, Department of Radiology, Faculty of Medicine, Chulalongkorn University, Bangkok, Thailand
- 3Department of Medicine, Faculty of Medicine, Chulalongkorn University, Bangkok, Thailand
- 4Chulalongkorn Comprehensive Epilepsy Center of Excellence (CCEC), King Chulalongkorn Memorial Hospital, Bangkok, Thailand
- 5National Cyclotron and PET Centre, Chulabhorn Hospital, Chulabhorn Royal Academy, Bangkok, Thailand
- 6Department of Medicine (Neurology), Neuroscience Centre for Research and Development, Thai Red Cross Emerging Infectious Disease-Health Science Centre, Faculty of Medicine, Chulalongkorn University, Bangkok, Thailand
- 7Cognitive Impairment and Dementia Research Unit, Faculty of Medicine, Chulalongkorn University, Bangkok, Thailand
Objective: Precisely localizing the seizure onset zone remains a challenging task in drug-resistant epilepsy (DRE) patients especially given its critical role in successful surgery and effective management. This study aimed to investigate the kinetic parameters of regional 18F-fluorodeoxyglucose (FDG) uptake in DRE patients, aiming to identify the kinetic parameters best enabling the identification of the epileptogenic region.
Methods: Consecutive DRE patients with clinically mandated interictal 18F-FDG PET/CT were recruited from October 2019 to September 2020 for pre-surgical evaluation. Immediately after injecting 18F-FDG of 112–179 MBq, dynamic data were acquired for 90 min. The motion correction and resampling to the Montreal atlas was performed in order to generate a transformation matrix. 116 volume of interests (VOIs) and regional time-activity curves (TACs) were generated by employing the automated anatomical labeling (AAL) template using PMOD software. Kinetic parameters of FDG unidirectional blood-brain clearance (K1), efflux (k2), phosphorylation (k3), and net metabolic flux (Ki) were derived using irreversible 2-tissue-compartment model with an image-derived input function (IDIF). The kinetic parameters values obtained from all regions were ranked and compared with the presumed epileptogenic zone (EZ).
Results: Eleven DRE patients (5 males, 6 females, mean age 35.1 ± 10.2 years) were analyzed. We found that the region with the lowest values of Ki provided correct lateralization in 7/7 (100%) of patient with temporal lobe epilepsy (TLE) and the region with the lowest Ki and k3 parameters showed concordance with the EZ in 100% and 71.4% of patients, respectively.
Conclusion: The present parametric approach to the evaluation of FDG-PET may be more sensitive than semi-quantitative approaches for the detection of pathophysiology in the EZ of patients with medically unresponsive TLE in addition to the routine clinical investigations.
1 Introduction
Epilepsy is a prevalent neurological disorder that affects millions worldwide, and about one-third of patients with epilepsy become medically intractable, often requiring surgery for achievable management [1]. Precisely localizing the epileptogenic zone (EZ) is essential for successful surgical intervention. Functional imaging techniques such as 99mTc-ethyl cysteinate dimer (ECD) ictal-interictal single photon emission computed tomography (SPECT) and 18F-fluorodeoxyglucose-positron emission tomography (FDG-PET) play a crucial role in identifying EZ and differentiating them from non-epileptogenic regions, particularly in patients with drug-resistant epilepsy (DRE) or discordant cases where conventional magnetic resonance imaging (MRI) has limited sensitivity [2–5]. 18F-FDG PET is typically used in interictal studies for presurgical evaluation since ictal studies are difficult to obtain due to slow brain glucose uptake and the short decomposition time of 18F. The main advantage of interictal 18F-FDG PET over interictal 99mTc-ECD SPECT is that 18F-FDG PET provides a better spatial resolution, thus results in higher diagnostic sensitivity for EZ localization [6].
In epilepsy, it was known that there is mutation of gene controlling oxidative phosphorylation affecting mitochondrial function [7–11]. Since the structure of mitochondria is disrupted in neuropathological study, the utilization of glucose in this area is less. This results in the focally reduced FDG uptake or the known relative hypometabolism in the EZ. However, the limitations of static FDG-PET (sFDG-PET) in accurately defining the surgical margin pose a significant challenge [12, 13]. Overcoming these limitations and achieving accurate localization of the seizure origin remain the greatest challenges for epilepsy pre-surgical evaluation.
Pharmacokinetic (PK) modeling plays a critical role in studying radiotracer kinetics in the human body, particularly in the field of nuclear medicine, which includes neuroimaging [14–16]. Applying kinetic models and quantifying PET data is of great interest for accurately localizing seizure onset zones in difficult epilepsy cases. While some studies have shed light on local cerebral FDG metabolism during epilepsy, our understanding of this phenomenon is limited, and most previous studies have investigated FDG kinetics in healthy adults or animals [17–22]. Their applicability to epilepsy has yet to be ascertained. As such, the establishment of PK models specific to epilepsy is a critical need, and would help optimize treatment for patients with DRE.
To achieve accurate localization of EZ, it is crucial to understand the differences in FDG kinetics and transfer rate between EZ and normal human brain areas. Therefore, the present study aimed to investigate the kinetic parameters for regional FDG uptake in DRE patients utilizing interictal dynamic FDG-PET (dFDG-PET) PK models. Quantitative analysis in terms of PK models that provide transfer rates and quantification in each region of the brain derived in this study can improve the localization of EZ for intractable epilepsy, ultimately leading to better management and outcomes for patients.
2 Materials and methods
2.1 Subjects
This study was conducted in accordance with the guidelines and regulations of our institutional review board (IRB) and obtained approval prior to patient recruitment. Consecutive DRE patients who underwent a prolonged video-electroencephalography (EEG) monitoring for presurgical evaluation and required 18F-FDG PET/CT study during October 2019 to September 2020 were scanned in this study. Written informed consent was obtained from all patients prior to the examination. Patients were received anti-seizure medications as per their usual regimen at the time of scanning procedure in order to control the seizure condition. All patients underwent MRI brain epilepsy protocol with T1-weighted and T2-weighted sequences. Patients who had last seizure within 48 h prior to the examination, or lacked EEG data were excluded from the study.
2.2 Dynamic PET/CT image acquisition
To conduct the kinetic modeling, PET/CT imaging was performed using a Siemens Biograph Vision 64-slice digital PET/CT system. All patients fasted for at least 6 h before the study. Prior to injection, blood glucose levels were checked to ensure the level below 120 mg/dL. Each patient was intravenously injected with 2.6 MBq/kg of 18F-FDG (half-dose protocol) and immediately followed by a 90-min dynamic PET scan. List-mode data were acquired and binned into 31 frames: 6 × 10 s, 8 × 30 s, and 17 × 300 s. PET image series for each frame was reconstructed using time-of-flight ordered subset expectation maximization (OSEM) algorithm with 8 iterations and 5 subsets, and matrix size of 440 × 440. Corrections for radioactivity decay, attenuation, model-based scatter, random events, and 5 mm Gaussian filtering of convolution kernel were applied to all PET image reconstructions. A low-dose CT scan protocol was used for attenuation correction and localization.
In this study, a non-invasive method, image-derived input function (IDIF) was utilized for alternative invasive arterial blood sampling [13, 23, 24]. The regions of interest (ROIs) were drawn by iso-contour (3D iso-contouring VOI tools using region-growing) inside the right internal carotid artery (ICA) in order to generate time-activity curve (TAC) input function for the kinetic modeling. Figure 1 shows the dFDG-PET images varying over time, which were used for generating the TAC at the internal carotid artery region as a non-invasive input function.
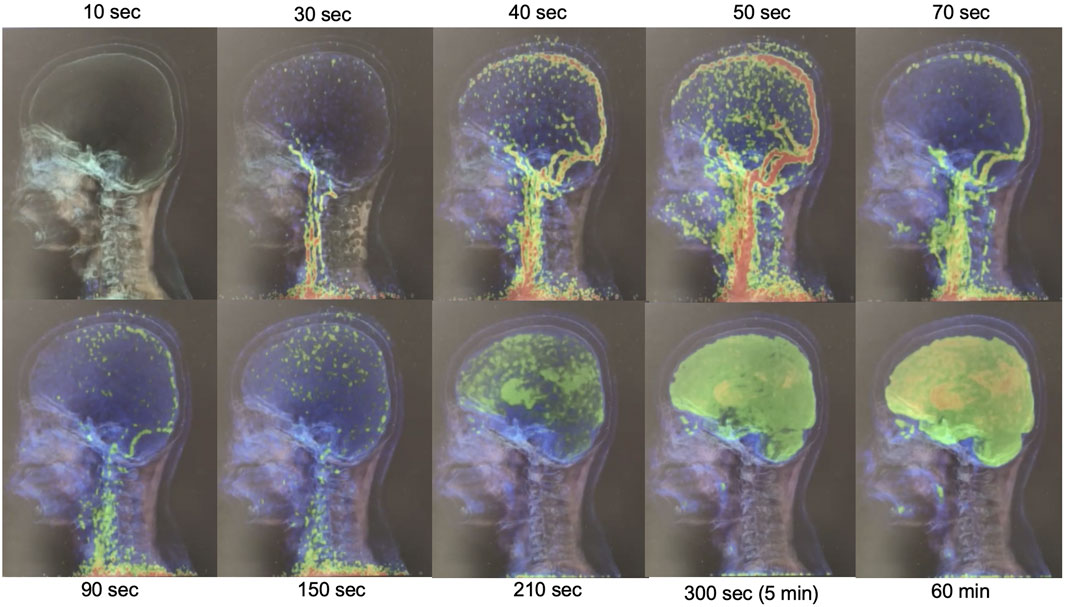
FIGURE 1. Illustration of dynamic-FDG PET images changing over-time for measuring the input function at the internal carotid artery region.
2.3 Regional tissue time-activity curves
In this study, 31 time-frames of dynamic PET images were transferred to the PMOD software (PMOD 4.101, PMOD Technologies Ltd.) to determine the FDG kinetic parameters in each patient. Image pre-processing was initiated with motion correction for the 90-min acquisition for the deformation process. PET data were averaged across the early 5 time-frames series to create a reference, which was used to perform a rigid body transform across all 31 frames of the dynamic PET. The motion-corrected PET frames were then re-sliced and co-registered with a PET template in the Montreal Neurological Institute (MNI) space using a non-rigid transform to generate a transformation matrix. The transformation information was then used to reorient the dynamic image into the MNI space. The resulting transformation matrix was inverted and applied to all ROIs to move them from the standard MNI template into the patient PET. A set of predefined volume of interests (VOIs) utilizing an automated anatomical labeling (AAL) template atlas was used to generate 58 VOIs per hemisphere, creating a total of 116 regional TACs for calculating the kinetic parameters. The overview workflow for spatial normalization, AAL atlas, which was used to automatically extract the VOIs and TACs for 116 local brain regions, and the IDIF for PK model, which was obtained using dynamic PET scan, is illustrated in Figure 2.
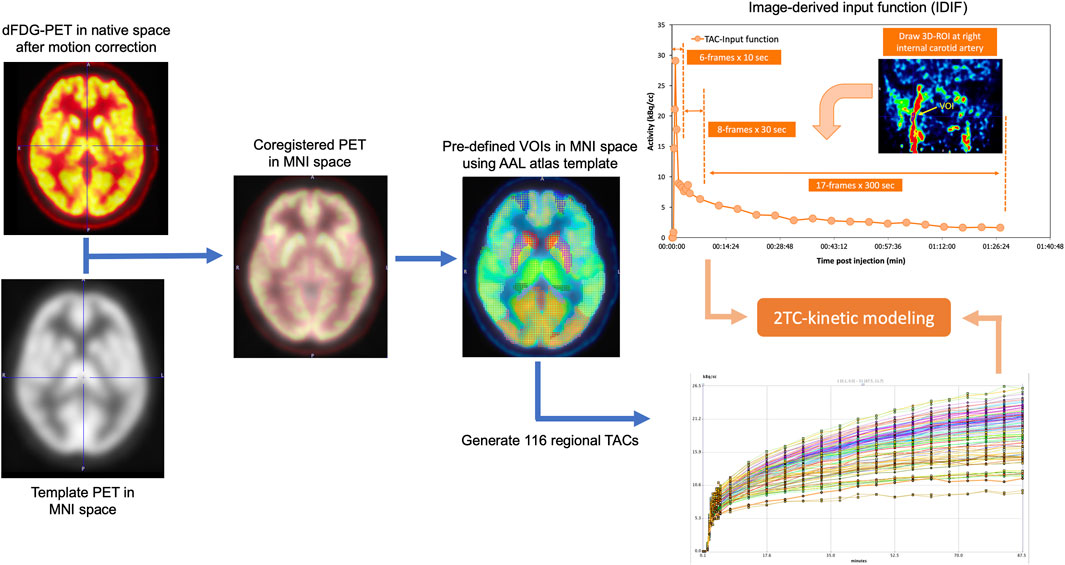
FIGURE 2. Overall workflow for PK model based on 2-tissue compartment (2TC) utilizing image-derived input function measured from dFDG-PET.
2.4 Compartmental modeling
By employing dFDG-PET measurements, the irreversible two-tissue compartment (2TC) model was used to develop the kinetic modeling for the dFDG-PET data utilizing the PKIN kinetic modeling module. The compartmental model used to describe the behaviors of FDG in brain tissue is depicted in Figure 3. The left compartment represents the vascular space for FDG, the center compartment represents the tissue space for free FDG, and the right compartment represents the tissue space for 18F-FDG-6-phosphate (FDG-6-P). The transfer rate constants between compartmental tissues are represented by K1 (FDG unidirectional blood-brain clearance), k2 (efflux), and k3 (phosphorylation). The corresponding ordinary differential equation of 2TC FDG kinetic modeling of each compartment can be expressed using Eq. 1 as follows [25, 26]:
where Cwb(t) represents the 18F-FDG activity concentration in whole blood derived from IDIF, C1(t) represents the activity concentration of free 18F-FDG, and C2(t) represents the activity concentration of metabolized or trapped 18F-FDG in the tissue space at time t. The constant K1 (unit: mL/min/cm3) is the rate of 18F-FDG delivery from the whole blood to the tissue space, k2 (unit: min-1) is the rate constant of tracer leaving the tissue space, whereas k3 (unit: min-1) is the rate constant of 18F-FDG being phosphorylated by hexokinase. Typically, this irreversible model widely assumes that the dephosphorylation process is negligible, therefore, FDG k4 rate constant can be considered to be zero (i.e., k4 = 0) for the majority of tissues. As a result, the irreversible FDG model using PMOD in this study includes 3 fittable parameters (i.e., K1, k2, k3). With regard to non-linear fitting of kinetic parameters, the initial values of Ki, K1, k2, and k3 were set to 0.05, 0.1, 0.01, and 0.01, respectively. The lower bound and the upper bound were set from zero to eight for all mentioned parameters.
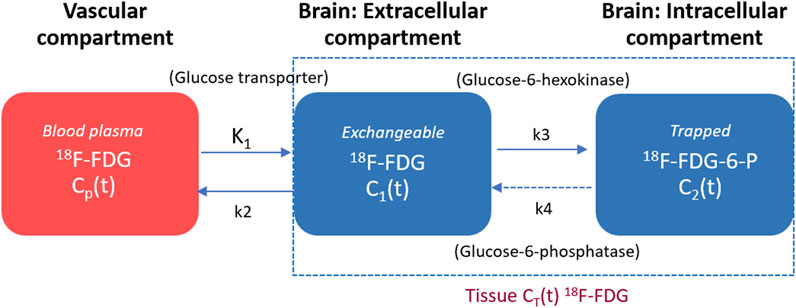
FIGURE 3. Two-tissue irreversible compartment model used for kinetic modeling of 18F-FDG.
The macro parameter Ki representing the net metabolic influx rate of 18F-FDG consumption can be calculated using Eq. 2 as follows [26, 27]:
The total radioactivity concentration in the tissue compartment as a function of time (CPET(t)) that can be measured by PET is the sum of the time courses of 18F-FDG in the vascular, intravascular and extravascular spaces, which can be written using Eq. 3 as follows [25–27]:
where ⊗ is the convolution operation symbol, K1 is the rate of 18F-FDG entry into the tissue, while k3/(k2+k3) represents how much 18F-FDG is metabolized or trapped as mentioned previously. For model fitting, the fraction of blood volume (vB, unit: mL/mL) is fixed at a physiologic value of approximately 5% to reduce the number of fitted parameters [15, 18, 19, 26, 28].
2.5 Potential epileptogenic zone verification
The consensus of the area of potential EZ was made by the multidisciplinary epilepsy team which consisted of epileptogists, neurosurgeons, diagnostic radiologists and nuclear medicine physicians. At the time of this study, results of the kinetic 18F-FDG study were not as part of information used for consensus decision.
2.6 Data analysis
The kinetic parameters of Ki, K1, k2, and k3 derived from kinetic modeling of 116 regions in each patient were analyzed. All rate constants among these regions were ranked and the lowest value of kinetic parameters was chosen, and compared with the presumed EZ identified by the concordance of at least 3 out of 4 pre-surgical workups, which are clinical semiology, scalp EEG, MRI, and static FDG-PET visual analysis results. The presumed EZ as established through the previously mentioned concordance was determined by assigning it to a specific region based on the AAL atlas.
3 Results
Eleven patients with DRE, aged 19–53 years (5 males, 6 females, mean age 35.1 ± 10.2 years) were carried out. Table 1 presents the characteristics of the study subjects with DRE referred to dFDG-PET in this study. The mean 18F-FDG activity administered to the patients was 135.5 ± 19.2 MBq, ranging from 110–179 MBq, and all dynamic scans of the 11 DRE patients were successful. Negative MRI findings were found in 2 patients (patient 5 and patient 6). Table 2 lists the summary of suspected area of EZ and related kinetic parameter findings. In this study, the suspected areas for EZ were found at the left temporal lobe in 4 patients, right temporal lobe in 3 patients, and inconclusive in 4 patients (patients 3, 6, 8, and 11). We thus excluded the patients who had inconclusive EZ due to the discordance of clinical, EEG, MRI, and PET/CT interpretation from the analysis of this study. When the lowest value of kinetic parameters was chosen and compared with the presumed EZ, we found that the net metabolic flux Ki and the rate constant k3 kinetic parameters provided high association with the suspected EZ in all patients. The lowest Ki values were concordance with the suspected EZ in all the remaining EZ identifiable 7 patients, while the lowest k3 values were found concordance in 5 out of 7 patients (71.7%).
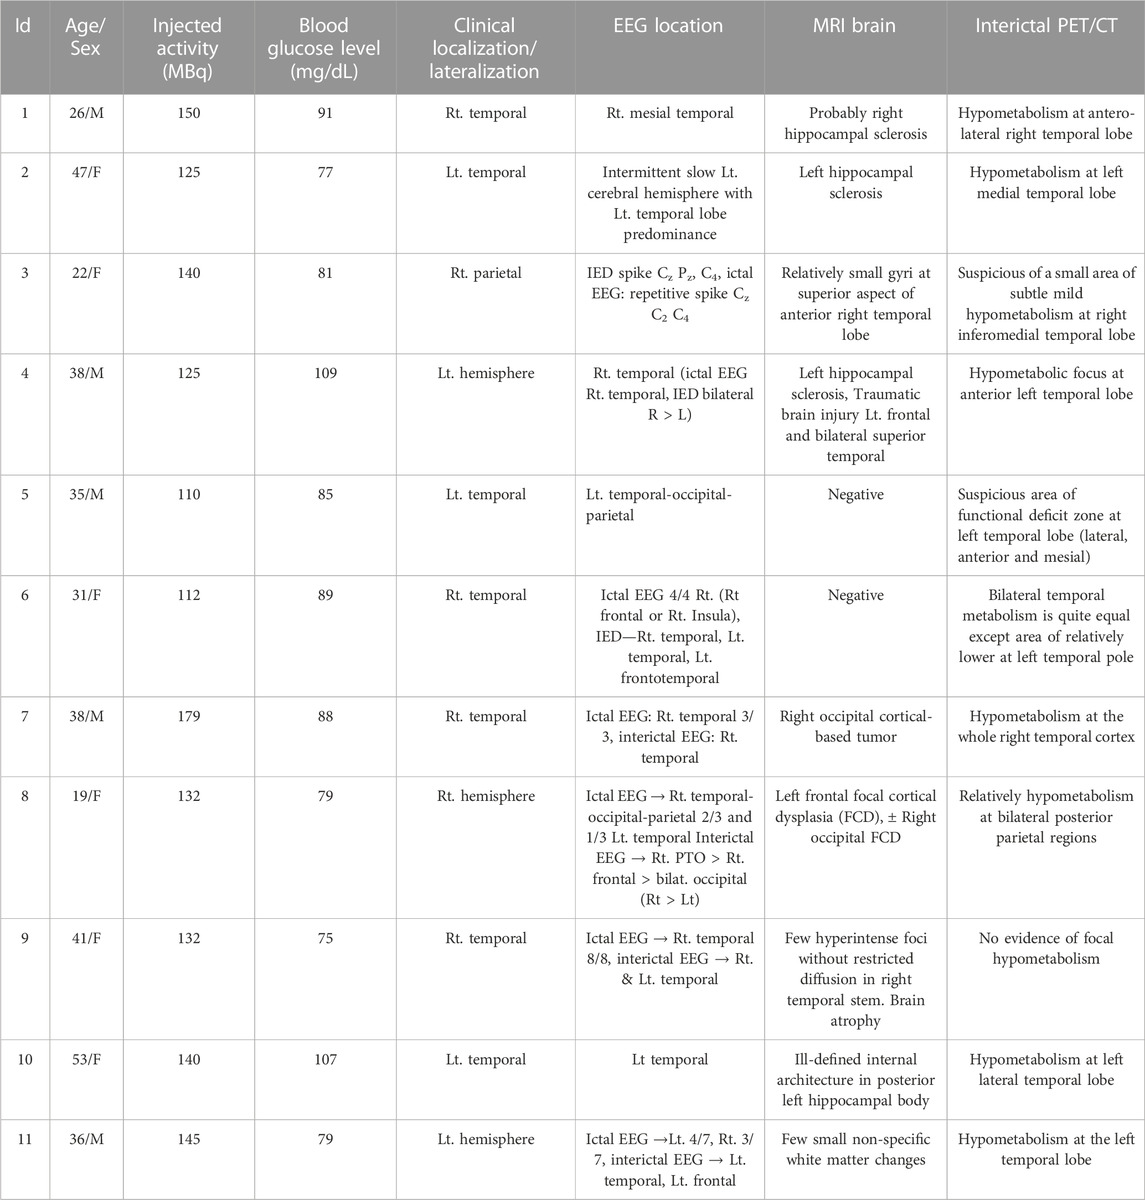
TABLE 1. Patient demographics data.
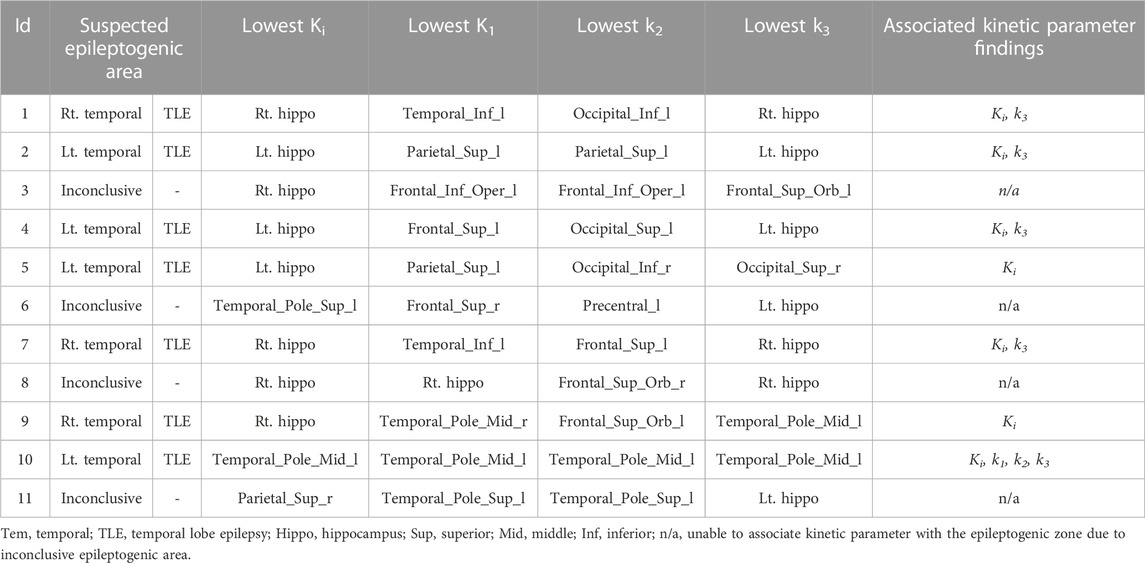
TABLE 2. Summary of suspected epileptogenic zone by pre-surgical workups and associated kinetic parameter findings.
Figure 4 illustrates the box plots of the rate constants of Ki, K1, k2 and k3 in presumed EZ regions found in this study. The plots indicated that the values of Ki and k2 were significantly lower and higher, respectively, in the presumed EZ regions compared to other regions. The details of regional FDG kinetic parameters determined from 11 DRE patients are provided in Supplementary Material S1.
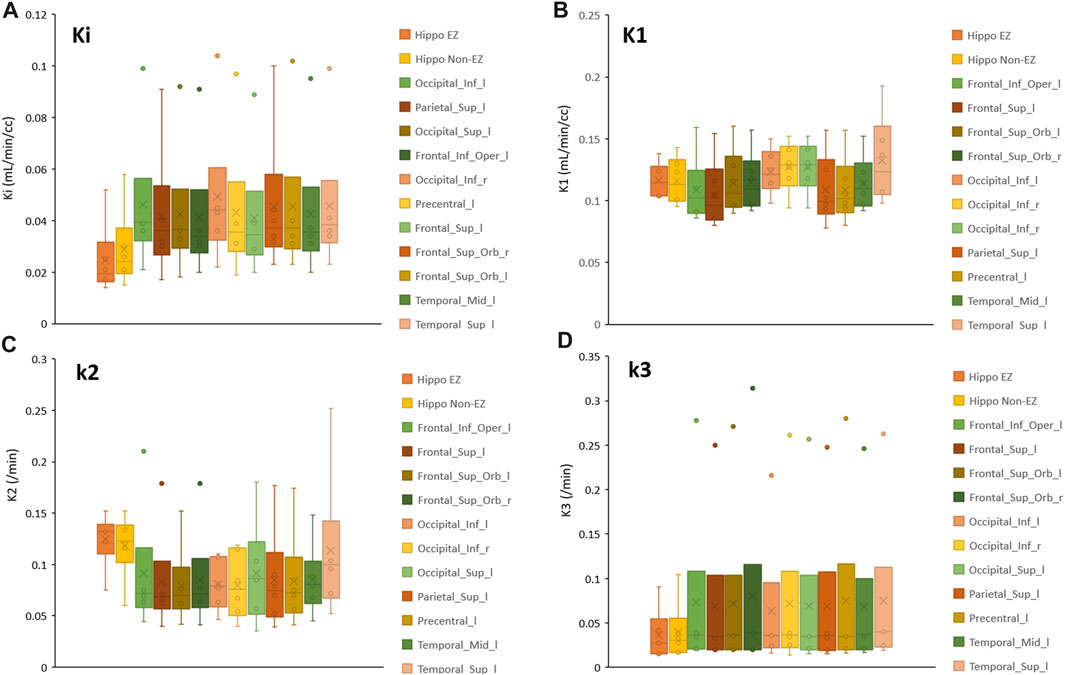
FIGURE 4. Box plot showing the rate constants in presumed EZ regions for (A) FDG net metabolic flux; Ki (B) FDG unidirectional blood-brain clearance; K1 (C) efflux; k2 and (D) phosphorylation; k3.
Figure 5 illustrates a comparison of the biokinetic in the presumed EZ and homologous regions in the contralateral hemisphere of a patient suspected to have presumed EZ in the left temporal region, showing hypometabolic areas at the left temporal lobe. The kinetic parameters were calculated from TAC generated from both the epileptogenic foci and counterpart homologous regions in the contralateral hemispheres. The lowest Ki values of 0.017 mL/min/cm3 and k3 of 0.034 min-1 were found in the left middle temporal pole region for this case, which were associated with the clinical diagnosis and EEG location.
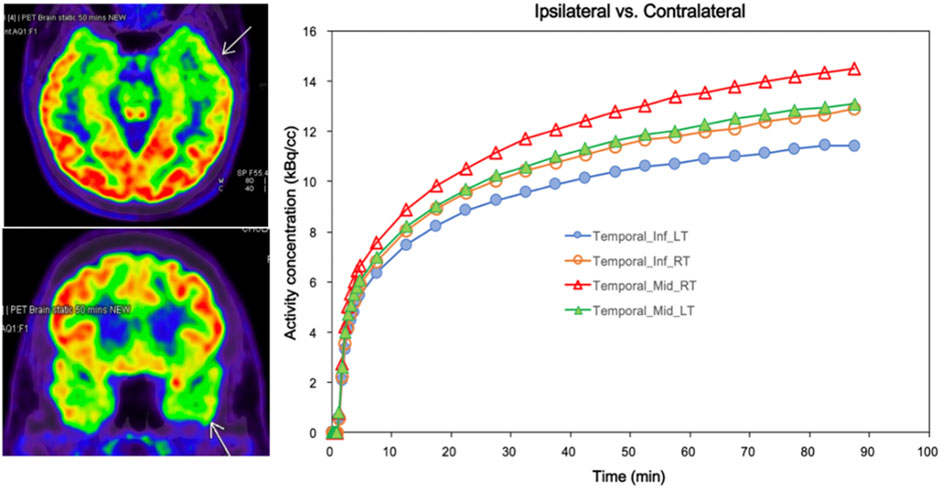
FIGURE 5. Comparison of biokinetic of ipsilateral and contralateral in patient who has suspected epileptic foci at Lt temporal lobe (Pt.10/F). The arrows on PET images indicate the hypometabolic areas at Lt temporal lobe corresponds to the lowest Ki (0.017) and k3 (0.034) at Lt middle temporal pole. Time-activity curves of dynamic FDG PET were generated in both the epileptogenic foci and the counterpart homologous regions in the contralateral hemispheres for calculating the kinetic parameters.
4 Discussion
Improving the localization of epileptic foci in DRE is of great interest, as visualization of hypometabolic areas on FDG-PET is non-specific to the EZ [29, 30]. In recent years, there have been huge efforts in using nuclear medicine techniques, both by visual and by quantitative analysis, for better localizing EZ [30]. Among these, the study of FDG biokinetic pattern in epilepsy is a method that has potential to benefit patients in clinical settings by avoiding invasive diagnoses [13]. To address this, we further investigated the kinetic parameters of regional FDG uptake using a 2TC-PK model of dFDG-PET in DRE patients for pre-surgical evaluation to see if a single kinetic parameter or a combination would benefit in EZ localization or not. Based on our results, we found that the lowest net metabolic flux (Ki) values were concordance with all of the presumed EZ. In addition, the rate constant of 18F-FDG phosphorylation (k3) was also lowest in 5 of 7 patients. Thus, both of these kinetic parameters can be used in isolation without comparison to any other brain reference regions (e.g., contralateral homologous brain region, cerebellum, pons, etc.). Of note is that although some patients showed that there were other structural abnormalities on their MRI (patients 4 and 9) or even if there was a lesion not related to epileptogenicity (patient 7), the lowest Ki and k3 were still located at the epileptogenic region. So, the utilization of dFDG-PET imaging combined with pharmacokinetic modeling has a potential to provide important information for the assessment and characterization of epileptic foci in DRE patients with discordant pre-surgical investigation data in addition to the use of FDG-PET visual analysis alone.
According to distribution of the kinetic values in representative brain regions illustrated in Figure 4, we observed that Ki and k3 showed decreasing trends, while k2 showed higher values in the presumed EZ. We also found that Ki was the lowest in all seven EZs, k3 was the lowest in 5 out of 7 patients, and k2 was the highest in 4 out of 7 patients. According to these results, we suggested that k3’s low value and high k2 might contribute to the low Ki. The high k2 values could be due to the accumulation of radiotracer in the extracellular compartment in the EZ, resulting in a high flux of the radiotracer back into the bloodstream.
Reference [18] described a mathematical model based on blood sampling to determine a local cerebral metabolic rate of glucose in 13 healthy subjects. The average kinetic parameters of FDG (Ki, K1, k2 and k3) in gray matter were 0.0334 ± 0.0058, 0.102 ± 0.028, 0.130 ± 0.066, and 0.062 ± 0.019 min-1 respectively, while in white matter were 0.0154 ± 0.0035, 0.054 ± 0.014, 0.109 ± 0.044, and 0.045 ± 0.019 min-1 respectively. Although the kinetic parameters Ki, K1, k2 and k3 in the suspected EZ of our study, as depicted in Figure 4, closely matched those reported by Huang et al, there were notable exceptions in the hippocampus areas for both EZ and non-EZ regions. It is important to note that Huang et al. reported their kinetic parameters in gray matter and white matter regions. Consequently, direct comparisons between their findings and those of our study may not be comparable, as we have reported the kinetic parameters specific to each local region derived from the AAL atlas.
In comparison to our study, Ref. [13] assessed the use of asymmetry indexes (ASYM) derived from dFDG-PET and from static FDG PET to identify the pathophysiology of metabolism in intractable epilepsy. They found that hypometabolism within epileptic foci may be related to reduced glucose phosphorylation (k3) compared to capillary influx (K1). This is in line with our study, in which k3 was usually lowest in the presumed EZ. This was also proven in a study of patients with temporal lobe epilepsy, in which the oxidative metabolism of glucose was reduced in the area of epileptogenicity, not the decrease of neuronal density [31]. The lowest net flux (Ki) in our study may be the result of low k3 as it is frequently the lowest parameter in the EZ. This finding corresponds with the previous genetic and pathological studies mentioned earlier in the introduction that the affecting pathology in epilepsy focused on phosphorylation, aka hexokinase activity or k3 in kinetic modeling. However, there might also be other factors causing low Ki because some of the presumed EZ did not show lowest k3 value.
The study by Ref. [12] utilized the parametric quantification from dFDG-PET imaging to locate hypometabolic foci in patients with no MRI evidence of focal epilepsy. The lowest negative z-scores were identified as hypometabolic. Their study found that dFDG-PET was able to detect focal regions of altered metabolism in all cases where standard clinical FDG-PET found no abnormalities. However, the authors suggest that further study is warranted to evaluate the specificity and sensitivity of dFDG-PET in larger cohorts to determine whether glucose dynamics can improve clinical utility for localization of epileptic foci over standard static PET techniques.
The reduced interictal uptake of 18F-FDG in the temporal lobe ipsilateral to the seizure focus in temporal lobe epilepsy (TLE) patients was studied by Ref. [32]. They attributed this reduction to regional differences in the lumped constant (lambda), indicative of altered glucose metabolism. Our study aligns with this finding by demonstrating altered glucose metabolism in DRE patients, emphasizing the importance of accurate metabolic assessments for epilepsy evaluation. The study by Ref. [33] focused on the coupling between regional cerebral glucose metabolism (rCMRGlc) and blood flow (rCBF) in TLE patients. They found a mismatch between metabolism and blood flow in the temporomesial structures, indicating that alterations in glucose metabolism might not always correspond to changes in blood flow. Their study resonnates with our findings, as we observed a specific kinetic parameter, the Ki and k3 to be a more reliable indicator of EZ compared to traditional static measures.
The use of PET templates instead of T1-weighted MRI in the MNI space for generating the transformation matrix allowed the results of automated AAL segmentation comparable to the T1-weighted MRI templates. In this study, we opted for an alternative approach for invasive arterial blood sampling in patients by extracting the IDIF from the ICA instead. This non-invasive method has demonstrated its robustness through a number of studies [13, 23, 24, 27, 34, 35]. Furthermore, it can offer relative simplicity and appropriateness for clinical implementation especially for patients with DRE. Unfortunately, this study did not correct the partial volume effect (PVE) for the IDIF, as outlined in previously mentioned literature. Consequently, the measured activity concentration employed to generate the IDIF may potentially be underestimated due to this effect, especially in smaller vessels. This underestimation could influence the peak of the IDIF TAC and the fitting of the kinetic model, potentially leading to an overestimation of the kinetic parameters. We acknowledge this limitation in our study. Another limitation is the number of studied subjects was relatively small. Since only one patient proceeded with epilepsy surgery, the localization of epileptic foci was not uniformly confirmed through the standard outcome of seizure remission following the resection of the identified regions. Therefore, further studies with larger cohorts and follow-up data after epilepsy surgery are merited to validate the findings.
5 Conclusion
This study investigated whether kinetic modeling approach has a potential to improve FDG-PET localization of epileptic foci in DRE patients. The findings from this study demonstrated that the net metabolic flux (Ki) and phosphorylation (k3) of 18F-FDG, as investigated using 2-tissue irreversible compartment model in dFDG-PET, were concordance with suspected epileptogenic regions with Ki as the most reliable parameter for identifying EZ. The presumed kinetic parameters obtained from this study provide non-invasive indicators and complement clinical setting to define the potential epileptic foci in addition to the other clinical information. This approach could contribute to more effective treatment options for DRE patients.
Data availability statement
The original contributions presented in the study are included in the article/Supplementary Material, further inquiries can be directed to the corresponding author.
Ethics statement
The studies involving humans were approved by the Faculty of Medicine, Chulalongkorn University. The studies were conducted in accordance with the local legislation and institutional requirements. The participants provided their written informed consent to participate in this study.
Author contributions
KK contributed the concept, methods, patient data collection and analysis, kinetic modeling, and manuscript drafting. CS contributed the concept, image analysis, and manuscript editing. CL contributed the patient recruitment, EEG data analysis, and manuscript editing. SJ contributed the patient recruitment. AJ contributed the image acquisition and patient data collection. TH contributed the concept. ST contributed the concept, methods, data analysis and interpretation, and manuscript drafting. All authors contributed to the article and approved the submitted version.
Funding
This work was supported by the Thailand Research Fund, Thailand Science Research and Innovation (grant number MRG6180141), and the Ratchadapiseksompotch Fund, Chulalongkorn University (grant number GB-A_61_006_30_02).
Acknowledgments
The authors would like to express their gratitude to epilepsy monitoring unit (EMU) team for taking care of the patients and sending patients for recruitment. We also thank to all Nuclear Medicine technologists at King Chulalongkorn Memorial Hospital, and at National Cyclotron and PET center Chulabhorn Hospital, Chulabhorn Royal Academy, for their help in patient data collection and image acquisition.
Conflict of interest
The authors declare that the research was conducted in the absence of any commercial or financial relationships that could be construed as a potential conflict of interest.
Publisher’s note
All claims expressed in this article are solely those of the authors and do not necessarily represent those of their affiliated organizations, or those of the publisher, the editors and the reviewers. Any product that may be evaluated in this article, or claim that may be made by its manufacturer, is not guaranteed or endorsed by the publisher.
Supplementary material
The Supplementary Material for this article can be found online at: https://www.frontiersin.org/articles/10.3389/fphy.2023.1233059/full#supplementary-material
References
1. Kwan P, Brodie MJ. Early identification of refractory epilepsy. New Engl J Med (2000) 342:314–9. doi:10.1056/NEJM200002033420503
2. Kim S, Mountz JM. SPECT imaging of epilepsy: an overview and comparison with F-18 FDG PET. Int J Mol Imaging (2011) 2011:e1–e9. doi:10.1155/2011/813028
3. Nasrallah I, Dubroff J. An overview of PET neuroimaging. Semin Nucl Med (2013) 43:449–61. doi:10.1053/j.semnuclmed.2013.06.003
4. Tepmongkol S, Srikijvilaikul T, Vasavid P. Factors affecting bilateral temporal lobe hypometabolism on 18F-FDG PET brain scan in unilateral medial temporal lobe epilepsy. Epilepsy Behav (2013) 29:386–9. doi:10.1016/j.yebeh.2013.08.017
6. Alabart NB, Parego XS. Imaging in epilepsy: functional studies. Radiología (2012) 54:124–36. doi:10.1016/j.rxeng.2012.06.002
7. Naviaux RK, Nguyen KV. POLG mutations associated with Alpers' syndrome and mitochondrial DNA depletion. Ann Neurol Official J Am Neurol Assoc Child Neurol Soc (2004) 55:706–12. doi:10.1002/ana.20079
8. Shoffner JM, Lott MT, Lezza AM, Seibel P, Ballinger SW, Wallace DC. Myoclonic epilepsy and ragged-red fiber disease (MERRF) is associated with a mitochondrial DNA tRNALys mutation. Cell (1990) 61:931–7. doi:10.1016/0092-8674(90)90059-n
9. Zsurka G, Hampel K, Nelson I, Jardel C, Mirandola S, Sassen R, et al. Severe epilepsy as the major symptom of new mutations in the mitochondrial tRNAPhe gene. Neurology (2010) 74:507–12. doi:10.1212/WNL.0b013e3181cef7ab
10. Kunz WS, Kudin AP, Vielhaber S, Blümcke I, Zuschratter W, Schramm J, et al. Mitochondrial complex I deficiency in the epileptic focus of patients with temporal lobe epilepsy. Ann Neurol (2000) 48:766–73. doi:10.1002/1531-8249(200011)48:5<766::aid-ana10>3.0.co;2-m
11. Meldrum BS. Excitotoxicity and selective neuronal loss in epilepsy. Brain Pathol (1993) 3:405–12. doi:10.1111/j.1750-3639.1993.tb00768.x
12. Seshadri V, Zarroli KA, Schetlick RS, Massey JC, Reyes JM, Eluvathingal Muttikal TJ, et al. Dynamic FDG-PET in localization of focal epilepsy: A pilot study. Epilepsy Behav (2021) 122:108204. doi:10.1016/j.yebeh.2021.108204
13. Tang Y, Liow J-S, Zhang Z, Li J, Long T, Li Y, et al. The evaluation of dynamic FDG-PET for detecting epileptic foci and analyzing reduced glucose phosphorylation in refractory epilepsy. Front Neurosci (2019) 12:993. doi:10.3389/fnins.2018.00993
14. Buratachwatanasiri W, Chantadisai M, Onwanna J, Chongpison Y, Rakvongthai Y, Khamwan K. Pharmacokinetic modeling of 18F-FDOPA PET in the human brain for early Parkinson’s disease. Mol Imaging Radionuclide Ther (2021) 30:69–78. doi:10.4274/mirt.galenos.2021.08831
15. Khamwan K, Plyku D, O’Reilly SE, Goodkind A, Cao X, Fahey FH, et al. Pharmacokinetic modeling of [18F] fluorodeoxyglucose (FDG) for premature infants, and newborns through 5-year-olds. EJNMMI Res (2016) 6:28–11. doi:10.1186/s13550-016-0179-6
16. Sgouros G, Frey EC, Bolch WE, Wayson MB, Abadia AF, Treves ST. An approach for balancing diagnostic image quality with cancer risk: application to pediatric diagnostic imaging of 99mTc-dimercaptosuccinic acid. J Nucl Med (2011) 52:1923–9. doi:10.2967/jnumed.111.092221
17. Eberlein U, Bröer JH, Vandevoorde C, Santos P, Bardiès M, Bacher K, et al. Biokinetics and dosimetry of commonly used radiopharmaceuticals in diagnostic nuclear medicine–a review. Eur J Nucl Med Mol Imaging (2011) 38:2269–81. doi:10.1007/s00259-011-1904-z
18. Huang SC, Phelps ME, Hoffman EJ, Sideris K, Selin CJ, Kuhl DE. Noninvasive determination of local cerebral metabolic rate of glucose in man. Am J Physiology-Endocrinology Metab (1980) 238:E69–E82. doi:10.1152/ajpendo.1980.238.1.E69
19. Loessner A, Alavi A, Lewandrowski KU, Mozley D, Souder E, Gur R. Regional cerebral function determined by FDG-PET in healthy volunteers: normal patterns and changes with age. J Nucl Med (1995) 36:1141–9.
20. Löscher W. Critical review of current animal models of seizures and epilepsy used in the discovery and development of new antiepileptic drugs. Seizure (2011) 20:359–68. doi:10.1016/j.seizure.2011.01.003
21. Mirrione MM, Tsirka SE. Neuroimaging in animal seizure models with 18F-FDG-PET. Epilepsy Res Treat (2011) 2011:e1–e8. doi:10.1155/2011/369295
22. Van Bogaert P, Wikler D, Damhaut P, Szliwowski H, Goldman S. Regional changes in glucose metabolism during brain development from the age of 6 years. Neuroimage (1998) 8:62–8. doi:10.1006/nimg.1998.0346
23. Zanotti-Fregonara P, Liow J-S, Fujita M, Dusch E, Zoghbi SS, Luong E, et al. Image-derived input function for human brain using high resolution PET imaging with [11C](R)-rolipram and [11C] PBR28. PLoS One (2011) 6:e17056. doi:10.1371/journal.pone.0017056
24. Croteau E, Lavallée É, Labbe SM, Hubert L, Pifferi F, Rousseau JA, et al. Image-derived input function in dynamic human PET/CT: methodology and validation with 11C-acetate and 18F-fluorothioheptadecanoic acid in muscle and 18F-fluorodeoxyglucose in brain. Eur J Nucl Med Mol Imaging (2010) 37:1539–50. doi:10.1007/s00259-010-1443-z
25. Wang G, Nardo L, Parikh M, Abdelhafez YG, Li E, Spencer BA, et al. Total-body PET multiparametric imaging of cancer using a voxelwise strategy of compartmental modeling. J Nucl Med (2022) 63:1274–81. doi:10.2967/jnumed.121.262668
26. Rahmim A, Lodge MA, Karakatsanis NA, Panin VY, Zhou Y, McMillan A, et al. Dynamic whole-body PET imaging: principles, potentials and applications. Eur J Nucl Med Mol Imaging (2019) 46:501–18. doi:10.1007/s00259-018-4153-6
27. Fahrni G, Karakatsanis NA, Di Domenicantonio G, Garibotto V, Zaidi H. Does whole-body Patlak 18F-FDG PET imaging improve lesion detectability in clinical oncology? Eur Radiol (2019) 29:4812–21. doi:10.1007/s00330-018-5966-1
28. Hays MT, Segall GM. A mathematical model for the distribution of fluorodeoxyglucose in humans. J Nucl Med (1999) 40:1358–66.
29. Tepmongkol S, Tangtrairattanakul K, Lerdlum S, Desudchit T. Comparison of brain perfusion SPECT parameters accuracy for seizure localization in extratemporal lobe epilepsy with discordant pre-surgical data. Ann Nucl Med (2015) 29:21–8. doi:10.1007/s12149-014-0905-y
30. Sukprakun C, Limotai C, Khamwan K, Pasawang P, Tepmongkol S. A novel method of seizure onset zone localization by serial Tc-99m ECD brain perfusion spect clearance patterns. Brain Imaging Behav (2022) 16:1646–56. doi:10.1007/s11682-022-00640-x
31. Vielhaber S, Von Oertzen JH, Kudin AF, Schoenfeld A, Menzel C, Biersack H, et al. Correlation of hippocampal glucose oxidation capacity and interictal FDG-PET in temporal lobe epilepsy. Epilepsia (2003) 442:193–9. doi:10.1046/j.1528-1157.2003.38102.x
32. Reutens DC, Gjedde AH, Meyer E. Regional lumped constant differences and asymmetry in fluorine-18-FDG uptake in temporal lobe epilepsy. J Nucl Med (1998) 39:176–80.
33. Fink G, Pawlik G, Stefan H, Pietrzyk U, Wienhard K, Heiss WD. Temporal lobe epilepsy: evidence for interictal uncoupling of blood flow and glucose metabolism in temporomesial structures. J Neurol Sci (1996) 137:28–34. doi:10.1016/0022-510x(95)00323-t
34. Hammers A, Panagoda P, Heckemann RA, Kelsch W, Turkheimer FE, Brooks DJ, et al. [11C] flumazenil PET in temporal lobe epilepsy: do we need an arterial input function or kinetic modeling? J Cereb Blood Flow Metab (2008) 28:207–16. doi:10.1038/sj.jcbfm.9600515
Keywords: drug-resistant epilepsy, pharmacokinetic modeling, compartmental modeling, dynamic-PET, PMOD software, epileptogenic zone localization
Citation: Khamwan K, Sukprakun C, Limotai C, Jirasakuldej S, Jantarato A, Hemachudha T and Tepmongkol S (2023) Dynamic 18F-FDG-PET kinetic parameters for epileptogenic zone localization in drug-resistant epilepsy. Front. Phys. 11:1233059. doi: 10.3389/fphy.2023.1233059
Received: 01 June 2023; Accepted: 25 September 2023;
Published: 10 October 2023.
Edited by:
Thomas Beyer, Medical University of Vienna, AustriaCopyright © 2023 Khamwan, Sukprakun, Limotai, Jirasakuldej, Jantarato, Hemachudha and Tepmongkol. This is an open-access article distributed under the terms of the Creative Commons Attribution License (CC BY). The use, distribution or reproduction in other forums is permitted, provided the original author(s) and the copyright owner(s) are credited and that the original publication in this journal is cited, in accordance with accepted academic practice. No use, distribution or reproduction is permitted which does not comply with these terms.
*Correspondence: Supatporn Tepmongkol, supatporn.t@chula.ac.th