Evolutionary game analysis of stakeholders’ decision-making behavior in agricultural data supply chain
 Heyang Zhao
 Jian Yang
- 1School of Computer and Information Technology School of Big Data, Shanxi University, Taiyuan, China
- 2School of Information, Shanxi University of Finance and Economics, Taiyuan, China
The significance of agricultural information sharing in fostering agricultural development cannot be overstated. This practice plays a pivotal role in disseminating cutting-edge agricultural technologies, cultivation methods, and pest control strategies, empowering farmers with valuable knowledge to enhance crop yield and quality. Moreover, it aligns with government objectives of resource sharing and addressing gaps, contributing to the advancement of agricultural modernization and the development of the industry chain. Despite its inherent benefits, the practical implementation of agricultural information sharing faces challenges. Stakeholders engaged in information sharing often prioritize individual benefits, potentially leading to a decline in agricultural information quality and the inefficient use of experimental resources. To confront this issue, the present research establishes a three-party evolutionary game model comprising an agricultural product data sharing platform, agricultural data providers, and agricultural data consumers. Leveraging dynamic system theory, the model analyzes the evolutionary stable strategies of stakeholders and investigates the critical factors influencing the strategic choices of these three parties. Experimental findings underscore the pivotal role of participants’ initial strategies, regulatory intensity, reward and punishment mechanisms, and information feedback in shaping stakeholder decision-making behavior. Implementation of measures such as heightened scrutiny of information on the sharing platform and fostering consumer trust in data emerges as imperative for enhancing system stability. These actions are essential for constructing an efficient and reliable information-sharing ecosystem, thereby facilitating the sustainable development of modern agriculture.
1 Introduction
In contemporary society, the progress of agricultural information technology has emerged as a crucial area of development in the agricultural realm, spearheading the transformation of agricultural production, management, and decision-making processes. The continuous advancement and application of information technology have provided agriculture with novel prospects for development, allowing for more efficient, intelligent, and sustainable agricultural production [1]. By leveraging advanced sensing technology, the Internet of Things (IoT), big data analysis, artificial intelligence (AI), and other approaches, agricultural informatization facilitates real-time monitoring and analysis of diverse agricultural data, encompassing factors such as soil conditions, weather patterns, crops, poultry, and livestock. This enables precise decision-making concerning key issues in agricultural production while simultaneously enhancing production efficiency and improving yield quality [2]. Nonetheless, the amount of data generated by a single institution or organization remains inherently limited. Consequently, establishing an efficient sharing mechanism between data providers and consumers has become an urgent priority. In a bid to addre ss the challenge of “data islands,” agricultural product information sharing platforms have emerged. These platforms enable the collection, integration, sharing, and analysis of dispersed agricultural information sourced from individual companies or organizational systems, thereby effectively mitigating the issues posed by the inconvenient exchange of agricultural information.
Furthermore, with the ongoing digitalization and informatization transformation of the agricultural industry, there is a growing demand for diverse and reliable data sources, along with increased requirements for data quality control [3]. Consequently, establishing a data sharing platform with integrated data governance capabilities becomes paramount. Data sharing not only reduces redundancy in data processing but also lowers the overall cost of agricultural research, fostering advancements in agricultural scientific research [4].
However, the mere construction of an agricultural product data sharing platform does not guarantee high-quality data sharing. From an economic perspective, agricultural data sharing is an ongoing process involving multiple stakeholders, each driven by their own interests to maximize [5]. For instance, agricultural data providers may choose to provide incomplete or inadequate information to minimize costs and increase income. Conversely, data consumers may opt to verify the accuracy of the provided information to avoid losses resulting from erroneous data. This dynamic can lead to the inefficient use of scientific research resources and funding, ultimately hindering the progress of agricultural research endeavors.
Evolutionary game theory is a theory that combines game theory analysis with dynamic evolutionary process analysis, placing a strong emphasis on achieving dynamic equilibrium. This theory originally emerged from the field of biological evolution and has successfully explained certain phenomena observed in biological evolution processes [6]. In contemporary economics, evolutionary game theory is widely utilized to analyze the factors influencing the development of social habits, norms, institutions, or systems, and to explain the processes through which they form, yielding significant insights Liu et al. [7].
In the agricultural sector, due to pronounced information asymmetry within the agricultural supply chain and the challenges associated with monitoring the quality of agricultural products, certain stakeholders are motivated by personal interests, potentially leading to harm to the interests of others and resulting in conflicts of interest within the supply chain [8]. In the context of this three-party game, complex interactions arise among the agricultural product information sharing platform, information providers, and consumers.
As an information intermediary, the agricultural product information sharing platform needs to maintain a balance between information providers and consumers [9]. The decisions made by these parties directly affect the operation and reputation of the platform. Information providers can choose to provide data rigorously or perfunctorily, while consumers make choices between trusting or distrusting the data. These decisions directly impact the data quality and credibility of the platform. Therefore, there is a dynamic evolutionary process where the decisions of the platform, information providers, and consumers mutually influence each other. The audit strategy of the platform, data provision strategy of information providers, and consumer attitudes towards data trust are constantly evolving. This dynamic equilibrium process is influenced by government regulation and consumer feedback, thereby affecting decision-making behaviors of all parties involved.
In this study, assumptions are made regarding the decision-making behavior of stakeholders engaged in the sharing of agricultural data. Subsequently, a tripartite evolutionary game model is developed, encompassing an information sharing platform and involving information providers and consumers. The decision-making behavior of each party is then studied under various influencing factors, and system equilibrium points are explored through the construction of replicator dynamic equations. Finally, strategies of participants are dynamically adjusted to achieve an optimal balance of interests through numerical simulation experiments.
The remaining parts of this article are structured as follows. Section 2 provides a literature review on agricultural data sharing. Section 3 presents a tripartite evolutionary game model for agricultural data sharing. In section 4, using replicator dynamics equations, the evolution patterns and trends of stakeholders’ interests are analyzed. The Jacobian matrix is employed to analyze the equilibrium points of the system and explore their stability. In Section 5, numerical simulation methods are used for analysis. Finally, relevant strategies and recommendations are summarized.
2 Related work
2.1 Agricultural data sharing
With the rapid development of information technology, the process of informatization in the agricultural field is accelerating. Agricultural informatization has not only changed the way of agricultural production, management, and decision-making but also has had a profound impact on the operation of the entire agricultural supply chain [10]. In order to better utilize agricultural data to promote agricultural production and research, the industry is studying agricultural data sharing models and how to achieve the optimal balance of interests between data providers, consumers, and sharing platforms.
[11] conducted a comprehensive review on the current status of open sharing of agricultural big data in China. Although the basic environment for data sharing has been continuously optimized, there are still several challenges hindering its progress. These challenges include constraints within the system, lack of standardized technology, and outdated laws and regulations. Consequently, [12] proposes that challenges such as low data volume, poor readability, and insufficient update rates still exist in the open sharing of agricultural big data. In order to address these challenges and promote the sharing of agricultural data, various measures are suggested, including top-level design, technological advancements, content standards, sharing mechanisms, and legal regulations. These measures aim to accelerate the open sharing and integration of agricultural data, ultimately enhancing the governance capacity of modern agriculture. [13] based on analyzing the problems of existing agricultural scientific data sharing, take problem analysis as the guide and discuss the applicability of consortium chains and agricultural scientific data management from three dimensions: traceability, shareability, and security. The core of smart agriculture is big data, but the current big data management model still has certain risks. In response to this issue, [14] propose the use of blockchain technology to better achieve the sharing of agricultural data. They analyze the advantages of blockchain-based big data sharing and improve the regional independence and information independence of major agricultural information websites, as well as improve the sharing methods.
[15] summarizes the concepts of data, scientific data, and scientific data systems, and through the research and extraction of information system success models and other theories, constructs a sustainable model for the use of agricultural scientific data sharing platforms. [16] indicates that this is aimed at providing data support for improving agricultural scientific data sharing platforms and guiding practical activities in agricultural scientific data.
Agricultural data possesses distinct characteristics, including extensive geographical distribution, substantial data volume, intricate structure, diverse types, and challenging acquisition. Consequently, the utilization of big data technology for the acquisition, storage, processing, and analysis of agricultural big data has emerged as a significant challenge in agricultural informatization. Based on this, [17] have studied the application system architecture and platform construction of agricultural big data, which has guidance significance for the processing of various types of agricultural data; at the same time, it has practical significance for decision-making in the entire process of agriculture. In addition, [18] explores the necessity of improving the management and utilization of agricultural information resources and internet-based agricultural information resources from both theoretical and practical aspects. Corresponding strategies are proposed for effective integration and utilization.
2.2 Evolutionary game
Evolutionary game theory, integrating principles from game theory and genetic evolution, serves as a mathematical model to explore the dynamic evolution of individual behaviors within populations. This methodology extensively applies to decipher strategic interactions among participants, offering insights into the cooperative and competitive relationships that evolve over time. Researchers, through the lens of evolutionary game theory, simulate strategic decision-making processes among various stakeholders in supply chain management. This application enhances supply chain efficiency, stability, and resilience, providing decision-makers with valuable guidance amid market dynamics and competitive pressures. Consequently, evolutionary game theory stands as a robust tool and framework for studying and optimizing supply chain management in scholarly research [19].
In an evolutionary game model with repeated interactions, [20] find that conditional cooperation is effective in promoting collaboration, especially under low-risk conditions. The risk threshold is crucial, as higher risks tend to enhance cooperation. Importantly, a timely transition from a defective to a cooperative strategy by conditional cooperators proves beneficial for sustaining high-level cooperation when the risk of failing to achieve collective goals exceeds a certain threshold.And by investigating coevolutionary dynamics between population state and reward systems, [21] find that interior stable coexistence state can emerge in our model.
While translating the original sentence into an academic style, I meticulously rephrased the text to augment conciseness, clarity, and the overall fluidity of the paragraph, demonstrating an assiduous commitment to linguistic refinement. The adjustments ensure that the content remains faithful to the original meaning but improves the quality of expression, [22] proposed a tripartite evolutionary game model to examine the interactions among crowd workers, crowd platforms, and task requesters in this study. Their focus was on analyzing the evolutionary stable strategies and trends exhibited by the different participants. The model considers the strategic decision-making of various stakeholders in the system and highlights the dynamic characteristics of the crowd working ecosystem. By examining the behaviors and choices of crowd workers, crowd platforms, and task requesters, the researchers acquire comprehensive insights into the emergence of long-term stability and patterns in this intricate environment. The analysis contributes to a more profound understanding of the interactions, adaptations, and evolution of these three key players over time.
Based on this, [23] used the evolution game theory to determine the optimal strategy energy system of multiple participants in the region and established a three-party game reciprocity model. The probability of strategy selection for the three participants under equilibrium and non-equilibrium strategies was analyzed. [24] addressed the insufficient stability research on three-party evolutionary games. They used a generalized three-dimensional dynamical system constructed by the replication dynamic equations to discuss the evolutionary trend of single-group strategies. Then, based on the Lyapunov stability theory, they analyzed the asymptotic stability of the system and, combined with the evolutionary trend of single-group strategies, discovered that all types of mixed strategy Nash equilibrium were saddle points. They also proved the zero eigenvalue non-ESS theorem and the ESS non-coexistence theorem, providing reference and inspiration for further research on evolutionary games.
In online knowledge communities, the monetization of knowledge has become a key focus of business models. [25] conducted an in-depth exploration of this topic. They established a three-party evolutionary game model to study different evolutionary stable strategies, evolutionary trends, and factors affecting these evolutionary paths. This research provides important decision support for the operation of online knowledge communities and proposes new approaches to solving conflicts of interest in knowledge sharing.
In the era of big data, the sharing of medical data has become an urgent need to improve the quality and efficiency of healthcare services. [26] developed a three-party evolutionary game model tailored to medical sharing scenarios, highlighting the significance of regulation and governance of data flow quality in addition to ensuring data security. By achieving stability within the medical data sharing system, this research provides significant insights and recommendations for enhancing the management of medical data sharing, providing valuable guidance for stakeholders’ informed decision-making. Furthermore, this study also extends to mobile crowdsourcing, contributing to its efficiency and fairness.
[27] conducted an in-depth exploration of the behavioral strategies employed by crowdsourcing workers, crowdsourcing platforms, and task requesters. They achieved this by establishing a three-party evolutionary game model, enabling them to analyze the impact and constraints of these behavioral strategies on each other. This provided valuable insights into comprehending the dynamics of the mobile crowdsourcing market. Through simulation experiments, they verified the stability of equilibrium points within the three-party game system, emphasizing the interactions and mutual influences among different participants. The overarching objective was to promote the healthy development of the mobile crowdsourcing market and maximize social welfare.
The literature emphasizes the significant role of data sharing in modern agricultural informatization. These studies highlight challenges such as insufficient data volume, poor quality, and outdated regulations that impede its effectiveness. To overcome these challenges, studies suggest using big data technology and blockchain to enhance security and autonomy. Furthermore, the application of evolutionary game theory in domains like crowdsourcing and medical data sharing analyzes strategies and emphasizes stable approaches. This article aims to develop a multi-agent decision-making mechanism based on evolutionary game theory to optimize interactions between data providers, consumers, and platforms in order to improve governance and promote agricultural informatization.
3 Basic assumptions and model construction
3.1 Game relationship among three participants
As shown in Figure 1, in the agricultural product information sharing ecosystem, agricultural information providers provide data to the agricultural product information sharing platform. When providers are found to provide data with a lack of rigor, they will be fined by the platform. The rigor or lack thereof in providing data directly affects the data quality and stability of the ecosystem. At the same time, the agricultural product information sharing platform will review the collected information and then provide it to agricultural information consumers. If the data is reliable, agricultural information consumers will provide subsidies to the providers. However, if the data is unreliable, they will seek compensation from the platform. This complex ecosystem requires all parties to carefully balance their interests to ensure the sustainable development of information sharing.
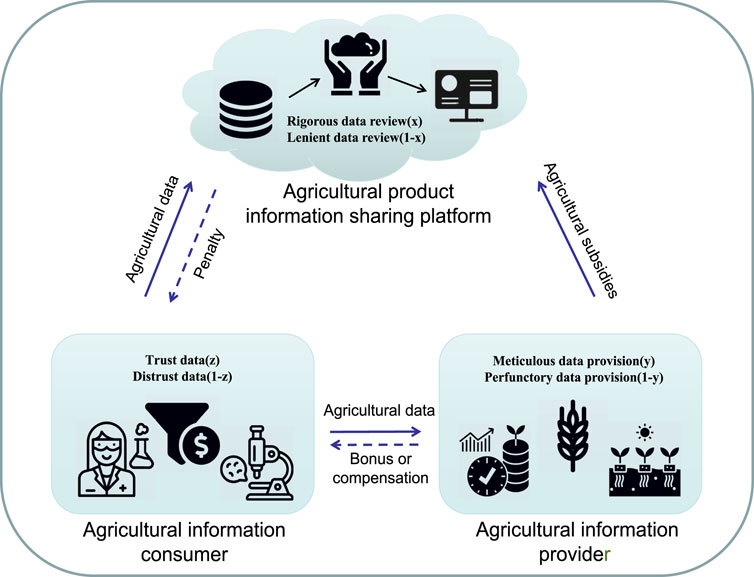
FIGURE 1. Agricultural big data sharing workflow.
3.2 Model assumptions
Assumption 1. The strategy of the agricultural product information sharing platform is represented as α = (α1, α2) = (rigorous data review, lenient data review). It selects α1 with a probability of x and α2 with a probability of 1 − x, where x ranges from 0 to 1.The strategy space of the agricultural information provider is denoted as β = (β1, β2) = (meticulous data provision, perfunctory data provision). It opts for β1 with a probability of y and β2 with a probability of 1 − y, where y ranges from 0 to 1.The strategy space of the agricultural information consumer is expressed as γ = (γ1, γ2) = (trust data, distrust data). It selects γ1 with a probability of z and γ2 with a probability of 1 − z, where z ranges from 0 to 1.
Assumption 2. When the agricultural information provider chooses meticulous data provision, the profit is Ra, and the cost of using professional equipment to collect data rigorously is Cb. When the agricultural information provider chooses perfunctory data provision, the profit is Rb, where Ra < Rb.
Assumption 3. When the agricultural information sharing platform chooses rigorous data review, the required manpower and material costs are Ca. When the agricultural information sharing platform chooses lenient data review, the perfunctory data provision by the agricultural information provider leads to a decrease in the average quality of agricultural data. In this case, the loss caused by the reputation loss of the agricultural product information sharing platform is Pa. When the agricultural information sharing platform rigorously reviews the data and discovers that it has been provided perfunctorily, it imposes a fine of T on the agricultural information provider and incurs a cost of F to acquire accurate data. The reputation benefit obtained by the agricultural information sharing platform from having authentic and reliable data is Pb, and it also receives a bonus H from the agricultural information consumers.
Assumption 4. When the agricultural information consumer distrusts the data, the cost of verification is Cd. If perfunctory data provision is discovered, the consumer can file a claim of B against the agricultural information sharing platform. If the agricultural information provider is found to voluntarily provide meticulous data, they receive an agricultural subsidy S. When the agricultural information consumer trusts the data but it is provided perfunctorily, the waste of experimental resources resulting from incorrect data is Pc.
Based on the aforementioned assumptions, to enhance the clarity of the game model, Table 1 presents the relevant behavioral parameters essential for the three-party evolutionary game model, along with their respective meanings.
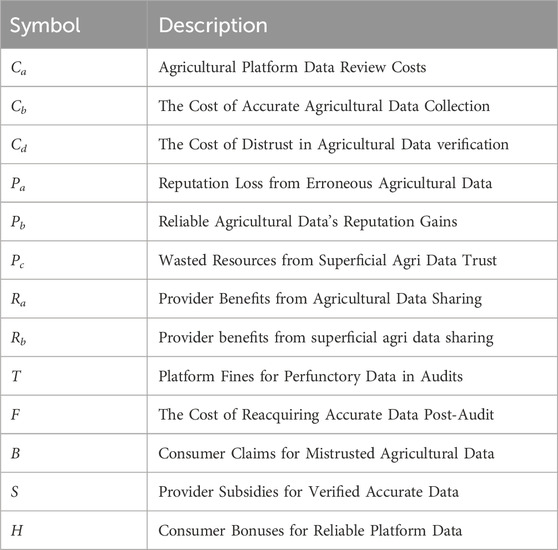
TABLE 1. Main symbols used in the paper.
3.3 Model construction
According to the above assumptions, the three-party game payoff matrix is established for the agricultural information sharing platform, the agricultural information provider, and the agricultural information consumer, as shown in Table 2.
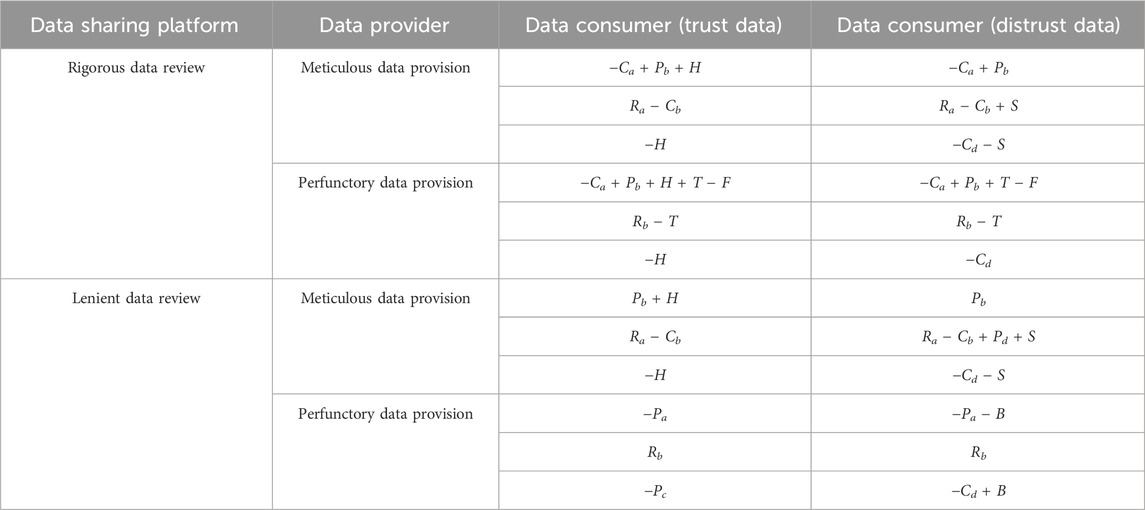
TABLE 2. Tripartite game benefit matrix.
4 Model analysis
4.1 Analysis of the stability of the strategy of agricultural product information sharing platform
The expected benefits and average expected benefits (U11, U12, U1) for strict or lenient data review on the agricultural product information sharing platform are as follows:
The equation for the replication dynamics of strategy selection in the agricultural product information sharing platform is:
The first-order derivative of x and the set G(y) are respectively:
The agricultural information sharing platform must satisfy the following conditions to be in a stable state: F(x) = 0 and
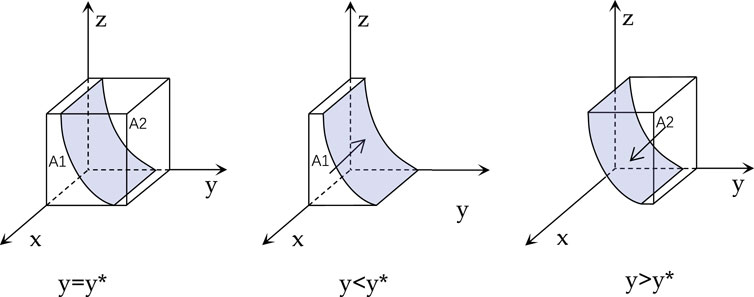
FIGURE 2. Phase diagram of the strategy evolution in agricultural information sharing platforms.
4.2 Stability analysis of agricultural information providers’ strategies
The expected benefits and average expected benefits (U21, U22, U2) for meticulous or perfunctory data provision by agricultural information providers are as follows:
The replication dynamics equation for strategy selection by agricultural information providers is:
The first-order derivative of y and the set J(z) are respectively:
For agricultural information providers to be in a stable state, they must satisfy the conditions: F(y) = 0 and dF(y)dy < 0, when they provide data meticulously. Since dF(z)dz < 0, J(z) is a decreasing function with respect to z. Therefore, when z = (−Cb + Ra − Rb + S + Tx)/S = z∗, J(z) = 0, dF(y)dy = 0, and the strategy cannot be determined. When z < z∗, J(z) > 0, and dF(y)dy|y = 0 < 0, then y = 0 is the ESS. Conversely, when z > z∗, y = 1 is the ESS. The phase diagram of strategy evolution for agricultural information providers is shown in Figure 3.
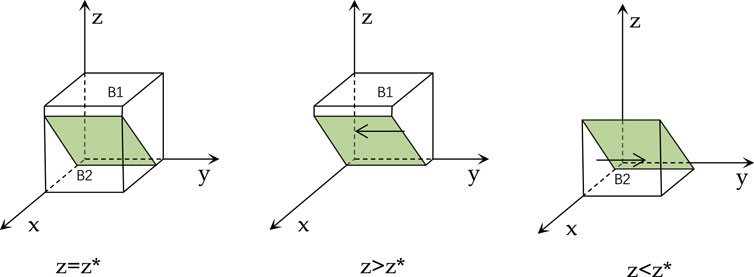
FIGURE 3. Phase diagram of the strategy evolution for agricultural information providers.
4.3 Stability analysis of agricultural information consumer’s strategies
The expected benefits and average expected benefits (U31, U32, U3) for agricultural information consumers’ trust or distrust in data are as follows:
The replication dynamic equation for strategy selection of agricultural information providers is:
The first-order derivative of z and the set H(x) are respectively:
For agricultural information consumers to trust data in a stable state, the following conditions must be met: F(z) = 0 and
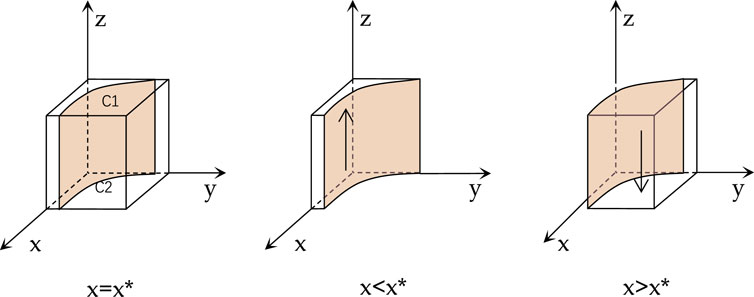
FIGURE 4. Phase diagram of the strategy evolution for agricultural information consumers.
4.4 Stability analysis of the equilibrium points in the three-party evolutionary game system
By utilizing the joint replicator dynamics equations of the agricultural information provider and agricultural information consumer through the agricultural product information sharing platform, a three-party evolutionary game system can be obtained From the equation F(x) = F(y) = F(z) = 0, nine system equilibrium points can be derived: (0,0,0), (0,0,1), (0,1,0), (0,1,1), (1,0,0), (1,0,1), (1,1,0), (1,1,1). However, these equilibrium points may not necessarily be the stable evolutionary strategies of the system. Therefore, it is necessary to further determine the stability of these nine points. Based on Friedman’s research [28], we constructed the Jacobian matrix of the three-party game as follows:
Following the principles of evolutionary game theory, equilibrium points’ nature can be determined by substituting them into the Jacobian matrix and analyzing the corresponding eigenvalues. An equilibrium point is classified as an ESS when all three eigenvalues are negative. A saddle point corresponds to the presence of one or two negative eigenvalues. Conversely, when all three eigenvalues are negative, it represents a see point. Table 3 provides a comprehensive overview of the eigenvalues associated with the eight equilibrium points obtained through their substitution into the Jacobian matrix.
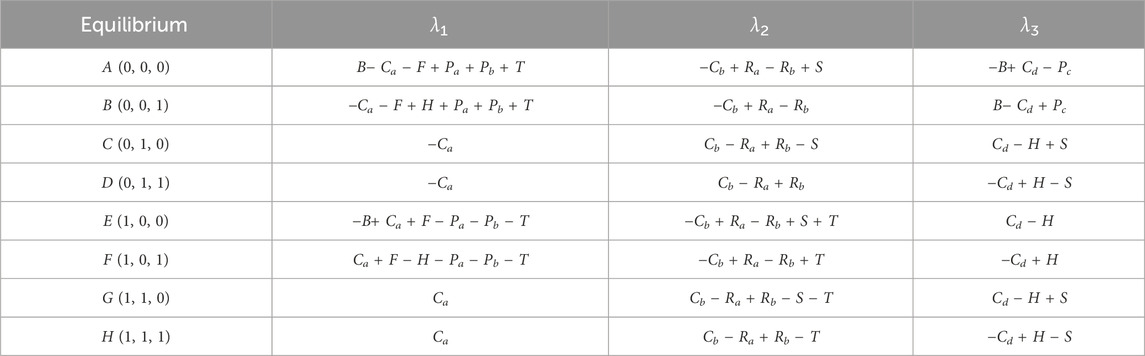
TABLE 3. System equilibrium points and eigenvalues.
Upon close scrutiny of Table 3, it is evident that the points (0,1,1), (1,1,0), and (1,1,1) each possess at least one positive eigenvalue, indicating their exclusion from the category of ESS. This highlights the infeasibility of depending solely on the supervision of the agricultural product information sharing platform. In contrast, the remaining five equilibrium points, as extensively examined in Table 4, may potentially acquire the status of ESS under specific conditions.
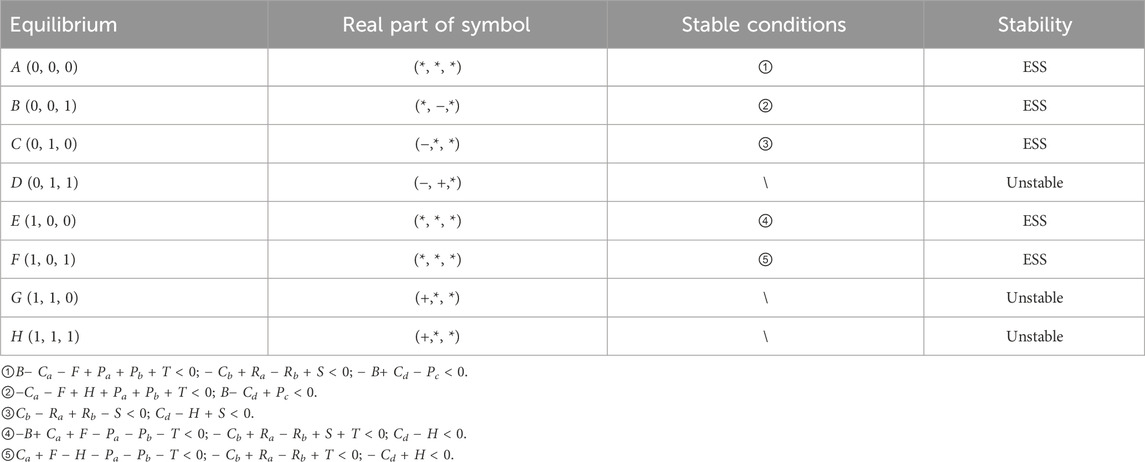
TABLE 4. Stability analysis of equilibrium points.
The comprehension of potential ESS necessitates an exploration of their characteristics and evolutionary trajectories. Within Table 4, the eigenvalues and evolutionary trends of these equilibrium points are presented, facilitating the identification of the conditions contributing to their stability. As such, the elucidated potential ESS provide valuable managerial insights and act as reference points for informed decision-making in governing the agricultural product information sharing system.
In the subsequent analysis, we will delve into the unique attributes of each ESS point, shedding light on the intricate dynamics that shape the stability of the system and offering a more comprehensive understanding of their potential roles and implications within the agricultural information sharing ecosystem.
4.4.1 Quantitative analysis of point A (0, 0, 0)
When condition ① is met, A is the equilibrium point of a three-player game, and the strategy combination for the three players is {loose data auditing, superficial data provision, distrust of data}. λ1, λ2, and λ3 need to be less than 0 to meet the stability condition. From λ1, λ2 and λ3 < 0, we can conclude:
These three inequalities represent:
• The difference between the reputation income, fine income, and audit cost of the agricultural product information sharing platform and the cost of obtaining correct data again is smaller than the sum of compensation paid by agricultural information consumers and reputation losses.
• The difference between the income of rigorous data provision by agricultural information providers and the income from subsidies received from scientific research institutions is smaller than the benefits of providing data in a perfunctory manner.
• The verification cost of agricultural information consumers is smaller than the sum of the loss of wasted experimental resources and the income from claiming to the platform.
The agricultural product information sharing platform can provide more accurate and reliable data by strengthening the audit process and ensuring the accuracy and completeness of the data, in order to attract more agricultural information consumers and scientific research institutions to use the platform and increase the platform’s reputation income.
4.4.2 Qualitative analysis of point B (0, 0, 1)
When condition is met, B is the equilibrium point of a three-player game, and the strategy combination for the three players is {loose data auditing, superficial data provision, trust in data}. Since Ra < Rb, we can infer that λ2 < 0, and λ1, λ3 need to be less than 0 to meet the stability condition. From λ1, λ3 < 0, we can conclude:
These three inequalities represent:
• The difference between the reputation income, fine income, institution bonus income, and audit cost of the agricultural product information sharing platform and the cost of obtaining correct data again is smaller than the reputation loss.
• The verification cost of agricultural information consumers is greater than the sum of the loss of wasted experimental resources and the income from claiming to the platform.
The agricultural product information sharing platform can take measures to help consumers conveniently verify data and provide relevant guidelines and tools. In addition, it can strengthen communication with agricultural information consumers and provide responsive customer support to reduce the likelihood of consumers wasting experimental resources and claiming income.
4.4.3 Quantitative analysis of point C (0, 1, 0)
When condition is met, C is the equilibrium point of a three-player game, and the strategy combination for the three players is {loose data auditing, rigorous data provision, distrust of data}. Since Ca > 0, we can infer that λ1 < 0, and λ2, λ3 need to be less than 0 to meet the stability condition. From λ2, λ3 < 0, we can conclude:
These three inequalities represent:
• The profit from perfunctory provision of data by agricultural information providers is smaller than the difference between the profit from rigorous data provision, agricultural subsidy income, and the cost of data collection.
• The verification cost and bonus paid by agricultural information consumers are smaller than the agricultural subsidy paid.
To encourage agricultural information providers to provide data rigorously, the platform can consider offering more appealing incentive measures. This can include increasing the amount or frequency of agricultural subsidies, as well as providing other incentives to encourage providers to offer accurate and complete data, thereby improving the data quality of the platform.
4.4.4 Quantitative analysis of point E (1, 0, 0)
When condition is met, E is the equilibrium point of a three-player game, and the strategy combination for the three players is {strict data auditing, superficial data provision, distrust of data}. λ1, λ2 and λ3 need to be less than 0 to meet the stability condition. From λ1, λ2, and λ3 < 0, we can conclude:
These three inequalities represent:
• The difference between the cost of strict audit, cost of obtaining data again, and reputation loss, and the sum of reputation loss, compensation costs, and fine income, is smaller than reputation loss.
• The difference between the profit from careful selection, agricultural subsidy income, and the difference between the cost of collection, is smaller than the difference between the profit from perfunctory selection and the fine received.
• The cost borne by agricultural information consumers is smaller than the bonus provided to the platform.
To enhance consumers’ trust and participation in the platform, the platform can consider providing a reasonable bonus mechanism to encourage consumers to actively participate in agricultural product traceability. This can include providing bonuses or discount coupons as feedback to stimulate consumer attention and willingness to purchase high-quality agricultural products. Agricultural consumers can also establish a comprehensive verification mechanism to reduce verification costs.
4.4.5 Quantitative analysis of point F (1, 0, 1)
When condition is met, F is the equilibrium point of a three-player game, and the strategy combination for the three players is {strict data auditing, superficial data provision, trust in data}. λ1, λ2 and λ3 need to be less than 0 to meet the stability condition. From λ1, λ2, and λ3 < 0, we can conclude:
These three inequalities represent:
• The difference between the cost of strict auditing, the cost of obtaining data again, and reputation loss is smaller than reputation loss, the bonus received from scientific research institutions, and fine income.
• The difference between the profit from careful selection and the cost of collection is smaller than the difference between the profit from perfunctory selection and the fine received.
• The cost borne by agricultural information consumers is greater than the bonus provided to the platform.
To reduce audit costs, the platform can utilize automation and intelligent technologies to process data, while establishing stable partnerships with data providers and collaborating with reliable data sources to reduce the cost of obtaining accurate data.
5 Numerical simulation and analysis
5.1 ESS comparative analysis
We conducted numerical simulation experiments to account for the complexity of relationships between multiple variables and parameters, which are difficult to measure accurately in practical situations. To ensure wide applicability and practicality of the obtained patterns, we established clear principles. These principles involve setting numerical values that accurately reflect the actual situation and minimizing changes in other variables when the ESS changes. This facilitates subsequent parameter sensitivity analysis. By adhering to these principles, our research effectively explores the evolutionary trends and patterns of three-party strategy equilibrium. See Table 5 for the initial numerical settings.
(1) (0,0,0) and (0,0,1) The distinction between the two ESS hinges on whether agricultural information consumers adopt a strategy of trusting the data. It is noteworthy that as this choice is made, Pc decreases while B increases. This suggests that augmenting the compensation cost for agricultural information consumers and curbing the wastage of experimental resources tend to steer agricultural information consumers towards embracing the data trust strategy. Figure 5. and Figure 6 illustrate the evolutionary trends within these two environmental systems. Notably, the x and y curves exhibit relatively minimal variations, while the z curve undergoes a transformation from 0 to 1. Initially, the z curve ascends and subsequently descends, indicating that research institutions’ inclination to adopt the trust strategy is not particularly strong. Numerous numerical experiments have consistently demonstrated that further reductions in Cd can abbreviate the equilibrium time and sustain a consistent downward trend in the curve.
(2) (0,0,0) and (0,1,0) The distinction between the two ESS lies in whether the agricultural information provider opts for a meticulous data provisioning strategy. It is noticeable that, with this choice, Cb, Cd, S experience a decrease, while H registers an increase. This indicates that the agricultural information provider inclines towards a rigorous data provisioning strategy due to the reduced costs associated with collecting data rigorously, lower verification expenses for agricultural information consumers, a decrease in agricultural subsidies, and an increase in bonuses received by the platform from research institutions. Figure 5 and Figure 7 depict the evolutionary trends within these two environmental systems. Remarkably, the x curve exhibits relatively minimal variations, while the z curve displays a faster rate of decline. Meanwhile, the y curve undergoes a transformation from 0 to 1, albeit with a longer equilibrium time. This suggests a moderate level of enthusiasm from the agricultural information provider when it comes to rigorously providing data. Multiple numerical experiments have consistently demonstrated that further reductions in T have the potential to abbreviate the equilibrium time.
(3) (0,0,0) and (1,0,0) The distinction between the two ESS revolves around whether the agricultural product information sharing platform opts for a stringent data auditing strategy. It is evident that, with this choice, Cd experiences a decrease, while both T and B register an increase. This suggests that a reduction in the verification cost for agricultural information consumers, a decrease in penalties imposed by the platform on agricultural information providers, and a decline in compensation claims from research institutions to the platform collectively drive the agricultural product traceability platform toward a preference for the rigorous data auditing strategy. Figure 5 and Figure 8 portray the evolutionary trends within these two environmental systems. Notably, the y and z curves exhibit relatively minimal variations, while the x curve undergoes a transformation from 0 to 1. However, it initially decreases before increasing, resulting in a longer equilibrium time. This pattern indicates a reduced level of enthusiasm from the agricultural product traceability platform in conducting thorough data audits. Multiple numerical experiments have consistently shown that further reductions in Pa and Pb have the potential to abbreviate the equilibrium time.
(4) (0,0,1) and (1,0,1) The disparity between the two ESS centers on whether the agricultural product information sharing platform adopts a rigorous data auditing strategy. It becomes evident that, in making this choice, Pa, Pb, Pc, and T all experience an increase. This signifies an escalation in the reputation benefits and losses for the platform, the conservation of resources by research institutions, and the heightened penalties imposed by the platform on agricultural information providers. These factors collectively drive the agricultural product traceability platform toward a preference for the rigorous data auditing strategy. Figure 6 and Figure 9 depict the evolutionary trends within these two environmental systems. Remarkably, the y and z curves exhibit relatively minimal variations, while the x curve undergoes a transformation from 0 to 1. As discussed in part (3) of the analysis, further reductions in Pa and Pb have the potential to abbreviate the equilibrium time.
(5) (1,0,0) and (1,0,1) The distinction between the two ESS hinges on whether agricultural information consumers adopt a strategy of trusting the data. It can be observed that as this choice is made, Cd, Pa, and Pb all experience an increase. This signifies an escalation in the verification cost for research institutions and the reputation benefits and losses for the platform, thereby driving agricultural information consumers toward a preference for trusting the data strategy. Figure 8 and Figure 9 delineate the evolutionary trends within these two environmental systems. Notably, the x curve, as analyzed in part (3), and the y curve exhibit relatively minimal variations. In contrast, the z curve undergoes a transformation from 0 to 1 in a smooth and rapid manner, indicating an elevated level of enthusiasm among agricultural information consumers to embrace the data trust strategy.
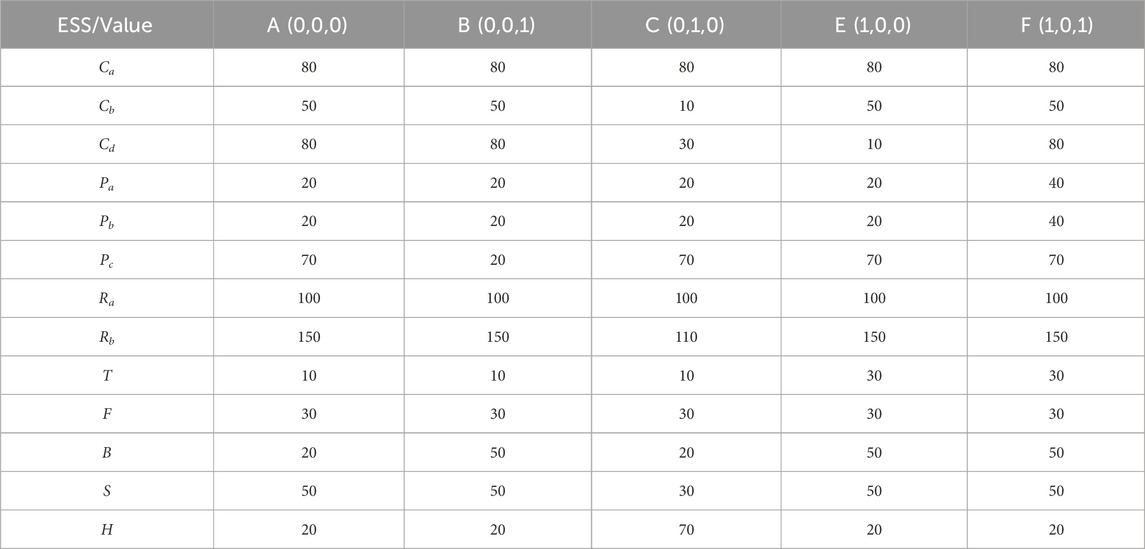
TABLE 5. Numerical values of different variables and parameters in ESS.
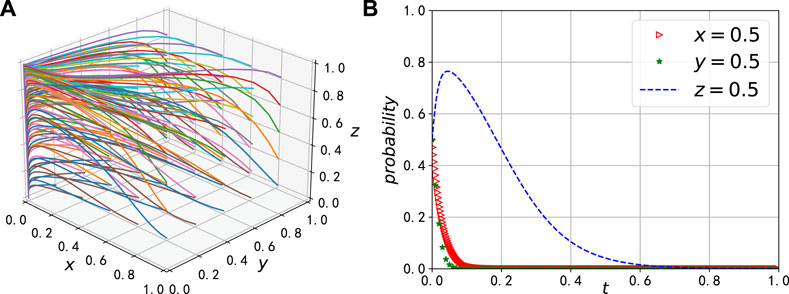
FIGURE 5. Evolutionary trajectory of A (0, 0, 0). (A) The 3D evolutionary chart, (B) Equilibrium state under the (corresponding point).
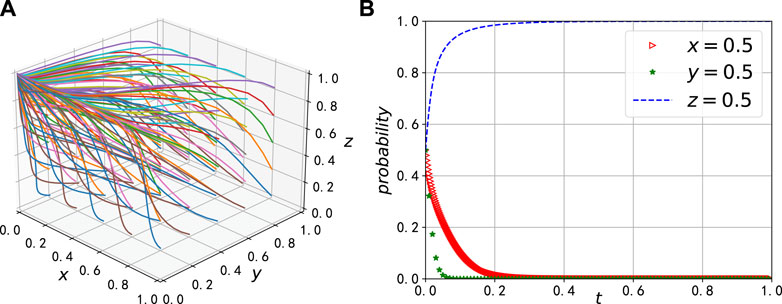
FIGURE 6. Evolutionary trajectory of B (0, 0, 1). (A) The 3D evolutionary chart, (B) Equilibrium state under the (corresponding point).
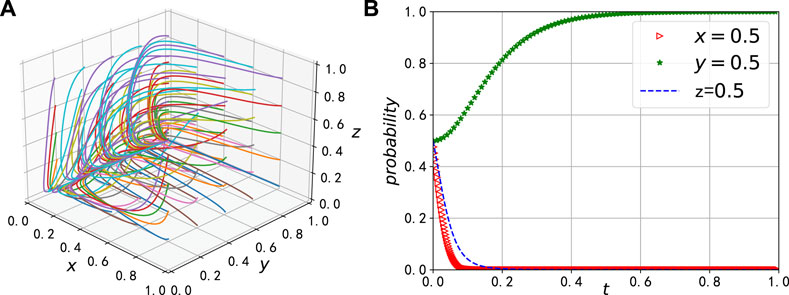
FIGURE 7. Evolutionary trajectory of C (0, 1, 0). (A) The 3D evolutionary chart, (B) Equilibrium state under the (corresponding point).
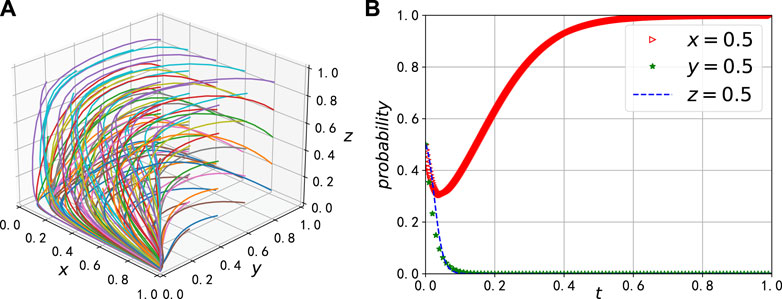
FIGURE 8. Evolutionary trajectory of E (1, 0, 0). (A) The 3D evolutionary chart, (B) Equilibrium state under the (corresponding point).
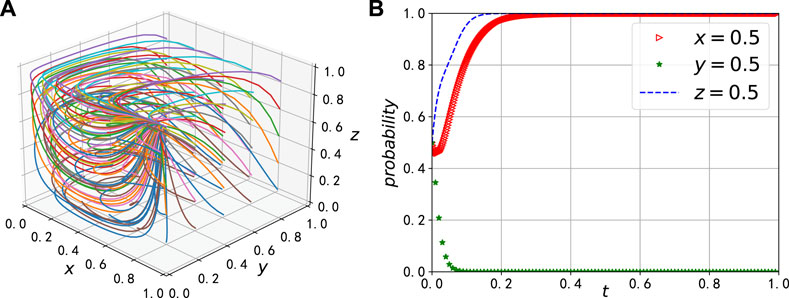
FIGURE 9. Evolutionary trajectory of F (1, 0, 1). (A) The 3D evolutionary chart, (B) Equilibrium state under the (corresponding point).
5.2 Initial probability analysis
In order to explore the impact of initial probabilities on the equilibrium of the three participants, the variables and parameters are kept constant.
In Figure 10, we set the initial probabilities of y and z to be both 0.5 and observe the evolution pattern of the system by changing the initial strategy of the agricultural product information sharing platform. As shown in Figure 10A, when the probability of strict data auditing increases from 0.2 to 0.8, the evolution speed of the agricultural information provider adopting a rigorous data provisioning strategy will increase, converging at a relatively stable rate. As shown in Figure 10B, the behavior of agricultural information consumers is less influenced, and their convergence rate to distrust is negatively correlated with z. This indicates that the auditing behavior of the agricultural product information sharing platform will influence the decision of whether agricultural information providers provide data rigorously or not, and strict auditing will compel them to provide more rigorous data.
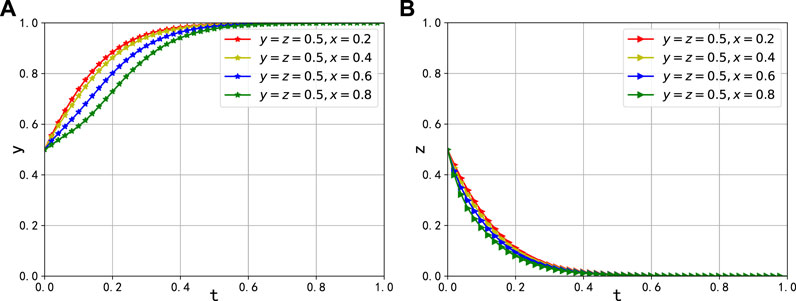
FIGURE 10. The impact of the initial probability of x on the evolutionary outcome and trajectory. (A) Effect on the evolution of y, (B) Effect on the evolution of z.
In Figure 11, we initially set both the probabilities of x and z to 0.5 and observe the system’s evolution pattern by varying the initial strategy of the agricultural information provider. As illustrated in Figure 11A, when the probability of rigorous data provisioning increases from 0.2 to 0.8, the behavior of the agricultural product information sharing platform is minimally affected, and its convergence rate to lenient data auditing remains relatively stable. In Figure 11B, the convergence rate of agricultural information consumers towards distrust is inversely correlated with the value of z. This implies that the data provisioning behavior of the agricultural information provider significantly influences the decision of whether agricultural information consumers choose to trust or not.
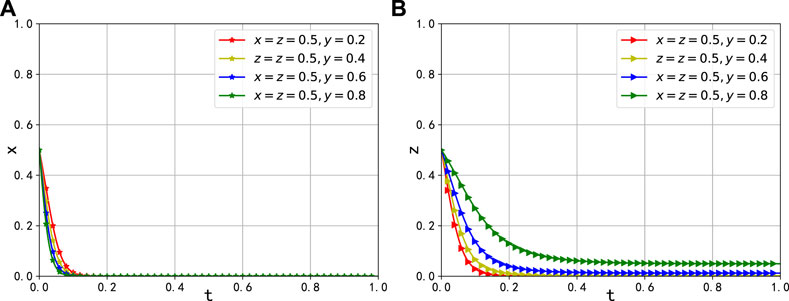
FIGURE 11. The impact of the initial probability of y on the evolutionary outcome and trajectory. (A) Effect on the evolution of x, (B) Effect on the evolution of z.
In Figure 12, we initialize the strategies of x and y at 0.5 and observe the system’s evolution pattern by altering the initial strategy of the agricultural information consumer. As z gradually increases from 0.2 to 0.8, as depicted in Figure 12A, the behavior of the agricultural product information sharing platform is minimally affected, and its convergence rate towards lenient data auditing remains nearly unchanged. As shown in Figure 12B, the evolutionary pace of the agricultural information provider, which adopts a rigorous data provisioning strategy, decelerates, and there are intermittent fluctuations towards the provision of perfunctory data. However, on the whole, it still leans towards the trend of providing well-researched data. This underscores the significant impact of strategy choices made by agricultural information consumers on the entire system. Since data represents a pivotal resource flowing throughout the entire sharing system, the reliability of the entire sharing system hinges on the decisions made by agricultural information consumers.
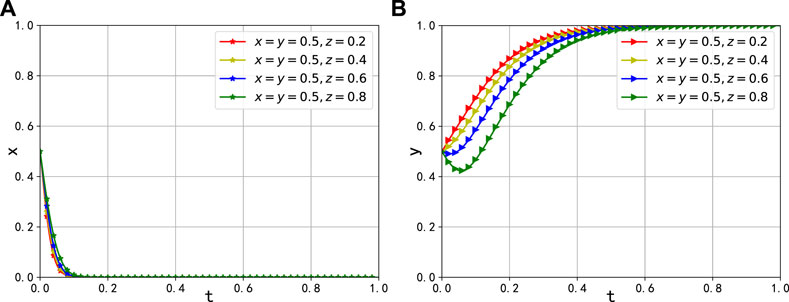
FIGURE 12. The impact of the initial probability of z on the evolutionary outcome and trajectory. (A) Effect on the evolution of x, (B) Effect on the evolution of y.
5.3 Partial parameter analysis
When the agricultural product information sharing platform chooses to relax data review standards, and scientific research institutions decide to distrust the data, agricultural information providers tend to reduce the cost of data collection rigor, as illustrated in Figure 13. With an initial value of Cb set at 30 and other parameters held constant, we examine the impact of reducing Cb to 10 and subsequently increasing it to 50 and 70, respectively.As Cb decreases to 10, the equilibrium point shifts from (0, 0, 0) to (0, 1, 0). However, when Cb increases to 50 and 70, there is no significant change in the equilibrium point. Furthermore, considering its implications in the x − z dimension, as Cb further increases to 70, the efficiency of agricultural information providers in evolving towards rigorous data provision also improves. This suggests that with lower values of Cb, agricultural information providers typically adopt the strategy of immediately providing data rigorously. Conversely, when the cost of data collection rises due to the necessity of purchasing professional equipment or hiring agricultural experts, they are more inclined to opt for perfunctory data provision, thereby increasing their profits. Hence, it is plausible to promote rigorous data provision by reducing the cost and price of professional equipment.
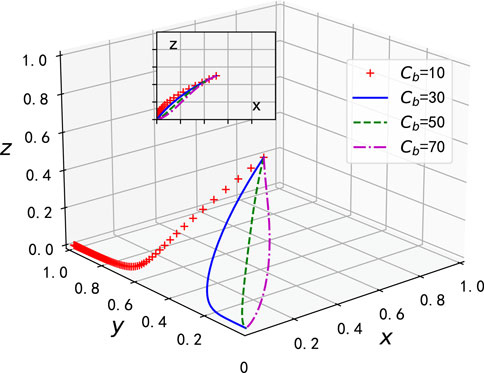
FIGURE 13. The impact of Cb on the evolutionary outcome and trajectory.
When the agricultural information sharing platform chooses to relax the review of data, and agricultural information providers choose to provide data perfunctorily, agricultural information consumers tend to reduce the waste of experimental resources caused by perfunctory low-quality data, as shown in Figure 14, we conducted a study on the impact of varying the initial value of Pc in an agricultural information consumer model. When the initial value of Pc is 100, we investigated its reduction to 20 and 10, as well as its increase to 200, while keeping the other parameters constant. When Pc decreases to 20 and 10, we observed a shift in the equilibrium point from (0, 0, 0) to (0, 0, 1). However, when Pc increases to 200, there is no notable change in the equilibrium point.Furthermore, the model predicts that as Pc further increases to 200, the efficiency of agricultural information consumers in evolving towards distrusting the data improves. This improvement is particularly evident when considering the x-z relationship.This indicates that for a smaller Pc, agricultural information consumers usually adopt the strategy of trusting the data immediately. However, when perfunctory low-quality data causes errors in experimental results or incorrect influences on research ideas, leading to an overall waste of experimental resources and an increase in the cost of resource waste, they are more willing to choose to distrust the data and prefer to incur certain costs to verify the data in order to ensure the accuracy of scientific research experiments.
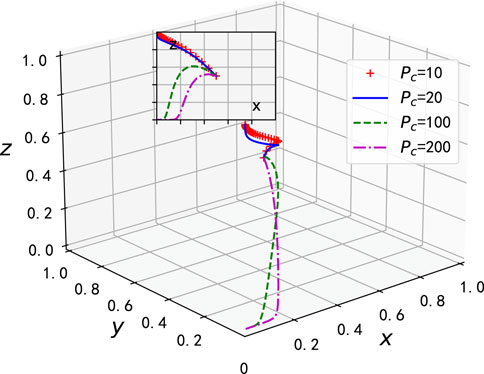
FIGURE 14. The impact of Pc on the evolutionary outcome and trajectory.
When agricultural information consumers confirm that the data is reliable and effective, they will provide agricultural subsidies to encourage agricultural information providers to continue growing crops and providing rigorous and reliable data in accordance with the original methods. If the bonuses received are generous enough, it will also incentivize agricultural information providers to continue practicing strict agriculture and provide reliable data. Hence, we initially set the value of S to 10 and gradually increased it to 50, 100, and 120 to observe its impact on decision-making behavior. As depicted in Figure 15, it becomes evident that the decision strategies of the three participants converge towards (0, 1, 1). Moreover, upon examining the x − z projection graph, it is apparent that higher values of S lead to a decision bias favoring trust in data from scientific research institutions, while agricultural information providers also tend to offer data more rigorously. This suggests that as subsidies from scientific research institutions to agricultural information providers increase, the latter are incentivized to actively and rigorously provide data. Consequently, scientific research institutions also develop greater trust in the data due to the improved data provision from agricultural information providers, thus establishing a virtuous cycle.
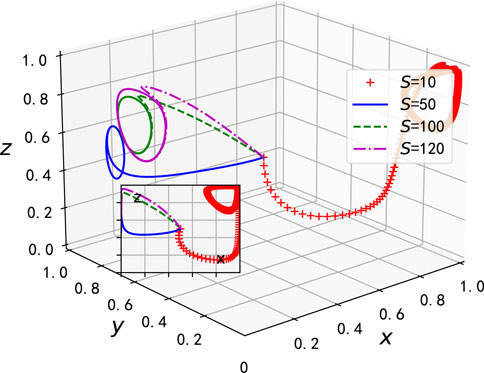
FIGURE 15. The impact of S on the evolutionary outcome and trajectory.
When agricultural information providers choose to provide data perfunctorily, the agricultural product information sharing platform aims to mitigate the wastage of experimental resources resulting from subpar data, as illustrated in Figure 16. With an initial value of T set at 30, and keeping other parameters constant, we investigate the impact of reducing T to 10 and subsequently increasing it to 80 and 100.As T decreases to 10, there is no significant change in the equilibrium point. However, when T increases to 80 and 100, the equilibrium point transitions from (0, 0, 0) to (1, 0, 1). Furthermore, when considering its implications in the x − z dimension, a decrease in T to 10 leads to an enhanced efficiency among agricultural information consumers in evolving towards a state of distrust in the data. This suggests that for smaller values of T, agricultural information consumers tend to adopt a strategy of distrusting the data. Nevertheless, when the severity of penalties for perfunctory data reaches a certain threshold, it indirectly promotes the rigor and reliability of the data. Consequently, agricultural information consumers become more inclined to trust the data.
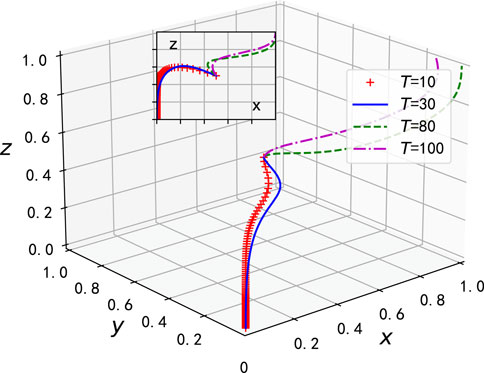
FIGURE 16. The impact of T on the evolutionary outcome and trajectory.
6 Conclusion and future works
In the era of agricultural informatization, the reliability of data and the sharing of information are crucial for the sustainable development of the entire agricultural ecosystem. This paper delves into the interaction between agricultural information providers, agricultural information consumers, and information sharing platforms from the perspective of game theory. Specifically, we examine the system’s evolutionary trends in light of whether agricultural information providers adopt a rigorous data-providing strategy and whether agricultural information consumers adopt a trusting data strategy. Based on the findings of this study, we propose some targeted recommendations.
1. Agricultural information sharing platform should establish a stringent review mechanism to ensure the reliability and accuracy of the agricultural data provided. This will enhance the trust of agricultural information consumers and promote information sharing and circulation. Simultaneously, implementing incentive measures is necessary to encourage agricultural information providers to provide reliable data. This will actively motivate them to collect and provide data, consequently improving the overall reliability of the system. Additionally, the information sharing platform should actively explore mutually beneficial cooperation mechanisms with other institutions to secure additional subsidies and policy support from the government.
2. Agricultural information providers should adopt a rigorous attitude to ensure that data collection methods are scientifically reliable, with regular data validation and auditing. They should also evaluate strategies to improve data provision. This ensures that the provided data is reliable and accurate, which helps to enhance reputation and credibility, and enables access to more agricultural subsidies and bonuses, thereby increasing the benefits of data sharing.
3. It is important to choose a reliable platform to provide data for agricultural information consumers. This can promote information sharing and collaboration, reduce waste of experimental resources, and improve system efficiency. However, when using the data, consumers should remain cautious and verify its accuracy to ensure the reliability of scientific research experiments. By establishing a foundation of trust on the platform, consumers can better balance the relationship between information sharing and experiment reliability.
In future, we will further explore sustainable development strategies and methods for agricultural information sharing ecosystems. Here are some potential research agendas:
1. Model Refinement and Expansion: The model can be further improved by considering more real-world factors, such as market changes and policy adjustments, in order to enhance its accuracy and applicability. This will enable a more accurate analysis of decision-making behaviors and strategic choices of stakeholders in different scenarios.
2. Policy Formulation and Regulation: We will further study how to guide the development of agricultural product information sharing platforms through policy formulation and regulation. This includes incentive mechanisms, reward policies, and penalties for improper behavior.
3. Transaction Environment Construction: Adopting blockchain and mobile sensing technology [29] to build a secure and convenient agricultural data sharing trading platform. Additionally, this platform also provides data analysis, decision support, and agricultural management services to assist users in making better decisions and managing production using agricultural data.
These future research directions will contribute to deepening our understanding of the agricultural information sharing ecosystem and provide stronger support and guidance for promoting agricultural sustainable development.
Data availability statement
The original contributions presented in the study are included in the article/Supplementary material, further inquiries can be directed to the corresponding author.
Ethics statement
The manuscript presents research on animals that do not require ethical approval for their study.
Author contributions
HZ: Writing–original draft, Writing–review and editing. JY: Formal Analysis, Funding acquisition, Supervision, Writing–review and editing.
Funding
The author(s) declare financial support was received for the research, authorship, and/or publication of this article. This work was supported in part by the National Social Science Fund of China (No. 23BJY205); the Humanities and Social Science Fund of Ministry of Education of China (No. 21YJCZH197).
Conflict of interest
The authors declare that the research was conducted in the absence of any commercial or financial relationships that could be construed as a potential conflict of interest.
Publisher’s note
All claims expressed in this article are solely those of the authors and do not necessarily represent those of their affiliated organizations, or those of the publisher, the editors and the reviewers. Any product that may be evaluated in this article, or claim that may be made by its manufacturer, is not guaranteed or endorsed by the publisher.
References
1. Osinga SA, Paudel D, Mouzakitis SA, Athanasiadis IN. Big data in agriculture: between opportunity and solution. Agric Syst (2022) 195:103298. doi:10.1016/j.agsy.2021.103298
2. Qu D, Wang X, Kang C, Liu Y. Promoting agricultural and rural modernization through application of information and communication technologies in China. Int J Agric Biol Eng (2018) 11:1–4. doi:10.25165/j.ijabe.20181106.4228
3. Klerkx L, Jakku E, Labarthe P. A review of social science on digital agriculture, smart farming and agriculture 4.0: new contributions and a future research agenda. NJAS-Wageningen J Life Sci (2019) 90:1–16. doi:10.1016/j.njas.2019.100315
4. Kamilaris A, Kartakoullis A, Prenafeta-Boldú FX. A review on the practice of big data analysis in agriculture. Comput Elect Agric (2017) 143:23–37. doi:10.1016/j.compag.2017.09.037
5. Susha I, Rukanova B, Zuiderwijk A, Gil-Garcia JR, Hernandez MG. Achieving voluntary data sharing in cross sector partnerships: three partnership models. Inf Organ (2023) 33:100448. doi:10.1016/j.infoandorg.2023.100448
6. Mirjalili S, Mirjalili S. Genetic algorithm. Evolutionary Algorithms and neural networks: Theory and applications,” in Studies in computational intelligence. Editors S. Mirjalili (Springer) (2019). p. 43–55.
7. Liu Y, Zuo J, Pan M, Ge Q, Chang R, Feng X, et al. The incentive mechanism and decision-making behavior in the green building supply market: a tripartite evolutionary game analysis. Building Environ (2022) 214:108903. doi:10.1016/j.buildenv.2022.108903
8. Herrera-Medina E, Riera Font A. A multiagent game theoretic simulation of public policy coordination through collaboration. Sustainability (2023) 15:11887. doi:10.3390/su151511887
9. Aaronson SA. Could a global “wicked problems agency” incentivize data sharing? United States: George Washington University (2023).
10. Shrivastava S, Marshall-Colon A. Big data in agriculture and their analyses. In: Encyclopedia of food security and sustainability. Amsterdam, Netherlands: Elsevier (2018). p. 233–7.
11. Guo T, Wang Y. Big data application issues in the agricultural modernization of China. Ekoloji Dergisi (2019).
12. Hu J, Zhang H, Irfan M. How does digital infrastructure construction affect low-carbon development? a multidimensional interpretation of evidence from China. J Clean Prod (2023) 396:136467. doi:10.1016/j.jclepro.2023.136467
13. Ngo QH, Kechadi T, Le-Khac N-A. Knowledge representation in digital agriculture: a step towards standardised model. Comput Elect Agric (2022) 199:107127. doi:10.1016/j.compag.2022.107127
14. Zhu L, Li F. Agricultural data sharing and sustainable development of ecosystem based on block chain. J Clean Prod (2021) 315:127869. doi:10.1016/j.jclepro.2021.127869
15. Liu W, Shao X-F, Wu C-H, Qiao P. A systematic literature review on applications of information and communication technologies and blockchain technologies for precision agriculture development. J Clean Prod (2021) 298:126763. doi:10.1016/j.jclepro.2021.126763
16. Hu J. Synergistic effect of pollution reduction and carbon emission mitigation in the digital economy. J Environ Manag (2023) 337:117755. doi:10.1016/j.jenvman.2023.117755
17. Xie N, Zhang X, Sun W, Hao X. Research on big data technology-based agricultural information system. In: International conference on computer information systems and industrial applications. Netherlands: Atlantis Press (2015). p. 388–90.
18. Yu-xiao L, Min C, Xu-wen G, Lian-feng Z. Research on the utilization and the management of agriculture information resources on internet. In: 2011 IEEE 3rd International Conference on Communication Software and Networks (IEEE); Held 27-29 May 2011; Xi'an, China (2011). p. 542–4.
19. Zhu Z, Wang X, Liu L, Hua S. Green sensitivity in supply chain management: an evolutionary game theory approach. Chaos, Solitons and Fractals (2023) 173:113595. doi:10.1016/j.chaos.2023.113595
20. Hua S, Hui Z, Liu L. Evolution of conditional cooperation in collective-risk social dilemma with repeated group interactions. Proc R Soc B (2023) 290:20230949. doi:10.1098/rspb.2023.0949
21. Hua S, Liu L. Coevolutionary dynamics of population and institutional rewards in public goods games. Expert Syst Appl (2024) 237:121579. doi:10.1016/j.eswa.2023.121579
22. GuoHua Z, Wei W Study of the game model of e-commerce information sharing in an agricultural product supply chain based on fuzzy big data and lsgdm. Technol Forecast Soc Change (2021) 172:121017. doi:10.1016/j.techfore.2021.121017
23. Ren H, Huang H, Li Q, Wu Q, Yang Y. Operation optimization of multi-participants in a regional energy system based on evolutionary game theory. Energ Rep (2020) 6:1041–5. doi:10.1016/j.egyr.2020.11.079
24. Han R, Yang M. Profit distribution and stability analysis of joint distribution alliance based on tripartite evolutionary game theory under the background of green and low carbon. Environ Sci Pollut Res (2022) 29:59633–52. doi:10.1007/s11356-022-19712-y
25. Yang J, Yan X, Yang W. A tripartite evolutionary game analysis of online knowledge sharing community. Wireless Commun Mobile Comput (2022) 2022:1–11. doi:10.1155/2022/4460034
26. Gao Y, Zhu Z, Yang J. An evolutionary game analysis of stakeholders’ decision-making behavior in medical data sharing. Mathematics (2023) 11:2921. doi:10.3390/math11132921
27. Hao H, Yang J, Wang J. A tripartite evolutionary game analysis of participant decision-making behavior in mobile crowdsourcing. Mathematics (2023) 11:1269. doi:10.3390/math11051269
28. Friedman D. Evolutionary games in economics. Econometrica: J Econometric Soc (1991) 59:637–66. doi:10.2307/2938222
Keywords: agricultural data sharing, decision-making behavior, evolutionary game, influencing factors, stability analysis
Citation: Zhao H and Yang J (2024) Evolutionary game analysis of stakeholders’ decision-making behavior in agricultural data supply chain. Front. Phys. 11:1321973. doi: 10.3389/fphy.2023.1321973
Received: 15 October 2023; Accepted: 27 December 2023;
Published: 16 January 2024.
Edited by:
Dun Han, Jiangsu University, ChinaCopyright © 2024 Zhao and Yang. This is an open-access article distributed under the terms of the Creative Commons Attribution License (CC BY). The use, distribution or reproduction in other forums is permitted, provided the original author(s) and the copyright owner(s) are credited and that the original publication in this journal is cited, in accordance with accepted academic practice. No use, distribution or reproduction is permitted which does not comply with these terms.
*Correspondence: Heyang Zhao, 202101004148@email.sxu.edu.cn