Implementation of the beam-loading effect in the tracking code RF-track based on a power-diffusive model
 Javier Olivares Herrador1,2*
  Andrea Latina1
  Avni Aksoy1,3 Nuria Fuster Martínez2 Benito Gimeno2 Daniel Esperante2,4
- 1CERN, Meyrin, Switzerland
- 2Instituto de Física Corpuscular (IFIC), CSIC-University of Valencia Calle Catedrático José Beltrán Martínez, Paterna, Valencia, Spain
- 3Institute of Accelerator Technologies, Ankara University, Ankara, Turkey
- 4Department of Electronic Engineering—ETSE, University of Valencia, Burjassot, Spain
The need to achieve high energies in particle accelerators has led to the development of new accelerator technologies, resulting in higher beam intensities and more compact devices with stronger accelerating fields. In such scenarios, beam-loading effects occur, and intensity-dependent gradient reduction affects the accelerated beam as a consequence of its interaction with the surrounding cavity. In this study, a power-diffusive partial differential equation is derived to account for this effect. Its numerical resolution has been implemented in the tracking code RF-Track, allowing the simulation of apparatuses where transient beam loading plays an important role. Finally, measurements of this effect have been carried out in the CERN Linear Electron Accelerator for Research (CLEAR) facility at CERN, finding good agreement with the RF-Track simulations.
1 Introduction
When a beam of charged particles travels through an accelerating structure, surface currents are generated in the surrounding conducting walls. These currents create electromagnetic (EM) fields that act on the beam, thus compromising the performance of the accelerator [1, 2]. When it comes to radiofrequency (RF) cavities, the impact of these fields can be such that a reduction in the accelerating gradient takes place. This phenomenon is known as the beam-loading (BL) effect [3–5].
The simplest model to understand the BL effect is to consider a pillbox. The calculation of the EM modes excited by a charged particle traveling on-axis [6–8] shows that, among others, the fundamental accelerating mode (TM01) is excited. This exhibits a non-negligible on-axis longitudinal electric field (Ez), which effectively reduces the accelerating gradient.
Most accelerating structures show high-quality factors for the fundamental mode [9, 10]. This implies that any excitation induced by the beam, such as the one described above, will persist in the cavities after the exciting bunch leaves the cavity. Therefore, a long-range transient effect is expected, meaning that late bunches will be decelerated by the EM field left by earlier bunches.
Beam-induced excitations are often described by wakefield formalism [8, 11]. In this context, the BL effect can be understood as a consequence of long-range longitudinal wakefields. For this reason, some tracking codes, like ELEGANT [12] or PLACET [13], implement self-consistent wakefield calculations based on the single-cell damped-oscillator model. However, this is a simple model that does not account for the effect of cavity coupling, which is crucial when considering BL in traveling-wave (TW) structures, where power flows from cell to cell.
ELEGANT and PLACET also offer the possibility of introducing externally computed wake functions with EM solvers like CST Studio [14] or GdfidL [15]. However, the biggest drawback of this approach is the computational time required by these calculations since the simulation of complete realistic structures usually takes days, which limits the performance of beam dynamic simulations and beam parameter tuning.
An alternative perspective of the BL effect is given in [16], where the beam-induced field in standing-wave (SW) cavities is explained in terms of phasors for electron storage rings, and in [3, 17, 18], where the BL effect is presented in terms of a power-diffusive partial differential equation (PDE), which is analyzed for beam-loading compensation.
In this paper, an implementation of the BL effect in the tracking code RF-Track [19] is proposed, allowing the performance of beam dynamics simulations considering this phenomenon. For this, a unified description of the BL effect in both TW and SW structures overcoming ultrarelativistic assumptions (v ≃ c) is required. This has been achieved using a power-diffusive model similar to the model presented in [17,18].
Therefore, the starting point of this work is the derivation of a PDE accounting for gradient reduction in TW structures. From this equation, an analogous expression for SW structures is obtained, allowing the generalization of the BL effect to non-ultrarelativistic scenarios such as electron photo-injectors. The resolution of these PDEs has been implemented into RF-Track, and simulations of the BL effect in realistic scenarios are shown and compared with measurements in the CERN Linear Electron Accelerator for Research (CLEAR) [20].
2 Power-diffusive model
2.1 Quasi-static assumption
The consideration of transient scenarios requires describing EM fields under the quasi-static (QS) assumption [21]. In such a case, Ez is expressed as
with
Let E1 = E1(z, t) and E2 = E2(z, t) be two electric fields whose time-dependent quasi-static phasors are
Eq. 2 is obtained using the standard phasorial formalism, Eq. 3 is a direct consequence of the QS approximation [22], and Eq. 4 is obtained using Eqs 2, 3.
A first implication of the QS assumption is the temporal dependency of the following quantities defined in terms of the electric (E) and magnetic (H) fields:
where ɛ0 and μ0 represent the electric permittivity and magnetic permeability of vacuum, respectively;
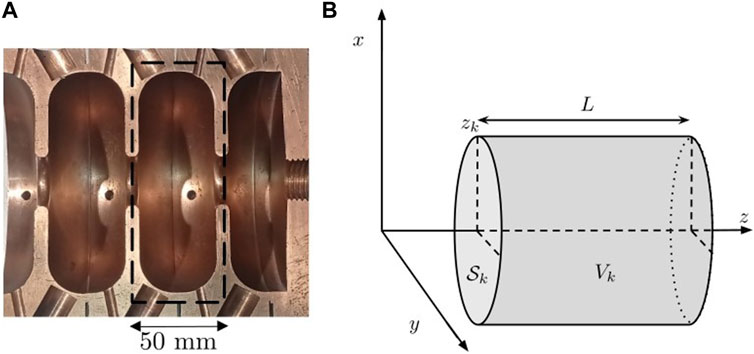
FIGURE 1. Cell considerations: (A) sectional cut of an S-band structure showing two complete cells. (B) Cell schematic representation and dimensions.
From Eqs 4–6, the following identity emerges as a consequence of the QS approximation:
The definition of the effective accelerating gradient in a cell (Geff) is also affected by the QS assumption:
where tq(z) is the time of flight of a particle with charge q that enters the cell at time t0. In a single cell within the RF period, particles are assumed to travel with a constant velocity v, expressed in terms of the speed of light c, through the factor β as v = βc. Under this consideration, the expression of the time of flight is [24]
From a physical point of view, Geff is the mean electric field that affects a particle during its flight. The design of TW structures often requires on-crest acceleration, achieved when tq is such that the field affecting the particle is
The magnitude relating G and Geff is the time-transit factor
To relate G with the stored EM energy and the dissipated power, the quality factor (Q) and the normalized shunt impedance per unit length
2.2 Derivation of a gradient reduction PDE in TW structures
The starting point for the derivation of a PDE describing gradient reduction in an accelerating structure is the Poynting theorem. Applied to the kth cell (see Figure 1B), it is expressed as [2]
where S is the Poynting vector and J is the current density. Under the paraxial approximation (vz ≫ vx, vy), the current density can be expressed as
where ρ is the volumetric charge density and βz is assumed to be constant within a cell and period.
Eq. 18 is time-averaged over a period. Using Eqs 1, 11, and 19, considering only the on-axis longitudinal electric field, we obtain
Then, Eq. 20 is integrated over the cell volume (see Figure 1B) and divided by L. Using the definition from Eq. 7 and denoting the longitudinal charge density as λq, this results in
For the second term, it should be recalled that the Poynting vector relates to the power balance in the cell as [2]
Regarding the time integral of the last term of Eq. 21, if a Gaussian bunch of charge qbunch and bunch-size σz are assumed, then
Substituting Eqs 22, 23 into Eq. 21 and using the definitions in Eqs 7–14, we obtain
For structures exhibiting high-resonant frequencies, their cells are short enough to assume the limit L → 0 Eq. 24. This leads to the following expression:
Finally, substituting Eqs 10, 15–17 into Eq. 25, after manipulation, one obtains
Equation 26 shows that the gradient reduction in accelerating cavities takes place because of the power flow between cells, heat dissipation, and the beam–cavity interaction. The last term of Eq. 26 is called the beam-loading term, and it captures the influence of the beam in gradient reduction. It depends linearly on the charge and the normalized shunt-impedance per unit length, i.e., the design of the cavity.
For the case of an ultrarelativistic beam with on-crest acceleration
2.3 The particular case of a SW photo-injector
Standing-wave accelerating structures do not exhibit the power flow from cell to cell, meaning that the net input power entering the kth cell, Pinput, has to be considered in the power balance since no flow from an external cell (coupler) feeds the structure. Therefore, the flux of the Poynting vector across the cell surface (see Figure 1B) has to be reconsidered as
For the input power Pinput, the transient response of a resonator to the power provided by the source has to be considered as follows:
with Gunloaded being the unloaded steady gradient that builds up in the cavity long-enough after the RF is turned on and ⟨Q⟩ being the loaded quality factor of all cells. However, r/Q is a geometrical factor that does not depend on coupling, so the following relation holds: rloaded/Qloaded = runloaded/Qunloaded ≡ r/Q [8].
Starting from Eq. 21 and using Eqs 27, 28, and following the same steps as before, the following PDE is derived for gradient reduction in SW structures:
3 Methods
3.1 Numerical implementation of the BL effect in RF-track
RF-Track [19] is a tracking code developed at CERN, which allows arbitrary particle tracking under the effect of external and self-induced forces. It is written in parallel C++, and it is imported into Python and Octave as a pre-compiled library. This software program offers a flexible accelerator description, handling complex 3D fieldmaps and computing self-consistent single-particle and collective effects such as space-charge, incoherent synchrotron radiation, or short-range wakefields, among others.
A dedicated BL module has been implemented in RF-Track based on the resolution of Eqs 26, 29 using the finite-difference method, which requires the discretization of longitudinal and temporal coordinates [26]. For this purpose, let Ltotal be the total length of the accelerating structure where tracking is to be performed and Tend be the time at which the considered beam leaves the structure.
Then, a two-dimensional space–time mesh of N × M is created, where the longitudinal spacing is
Afterward, the derivatives are discretized by Taylor-expanding them to the first order. This leads to the following expression for the calculation of the gradient in TW structures:
where
For a SW structure, the gradient is expressed as
At each tracking step (where particles have a position rpart and time tpart), the BL effect is computed by applying an additional kick (FBL). For this, a TM01 look-alike EM field (E01, B01) with gradient G* is calculated by solving Maxwell’s equations. G* is defined as G* = G(zpart, tpart) − G(zpart, 0) and is obtained by cubic-interpolating the result of Eqs 30, 33. Therefore, the BL kick is
Two different BL algorithms have been implemented in RF-Track depending on the velocity of the bunch. For ultrarelativistic bunches (v ≃ c) in TW structures, Eq. 32 can be precomputed prior to tracking, speeding up the overall process. If not, Eq. 32 has to be re-examined at each step of tracking. The flowcharts and differences of both approaches are shown in Figure 2.
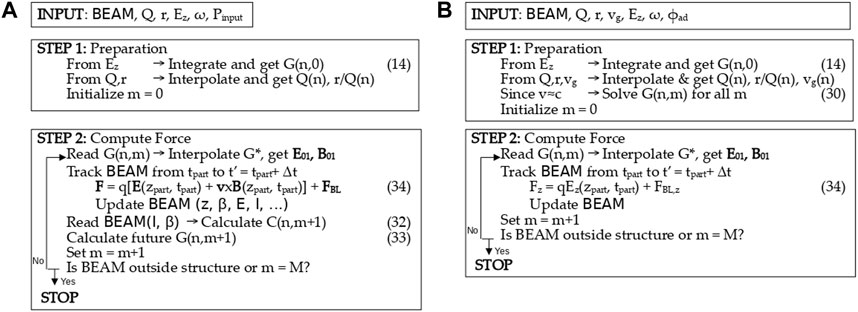
FIGURE 2. Flowchart of the beam-loading algorithms in RF-Track. (A) The left plot illustrates the non-ultrarelativistic SW case. (B) The right plot shows the ultrarelativistic TW case.
3.2 Benchmark of the BL effect implementation in RF-track
The performance of the new RF-Track BL modules has been assessed by simulating two well-studied scenarios of the compact linear collider (CLIC), a TeV-scale high-luminosity linear electron–positron collider under development by international collaborations hosted by CERN [9].
The two situations where beam-loading effects have been reproduced are CLIC accelerating structures (CLIC ASs), which consist of an X-band TW structure where the main beam is accelerated, and CLIC power extraction and transfer structures (CLIC PETS), which are passive cavities where CLIC’s drive beam is decelerated due to the BL effect and power is extracted to feed CLIC AS.
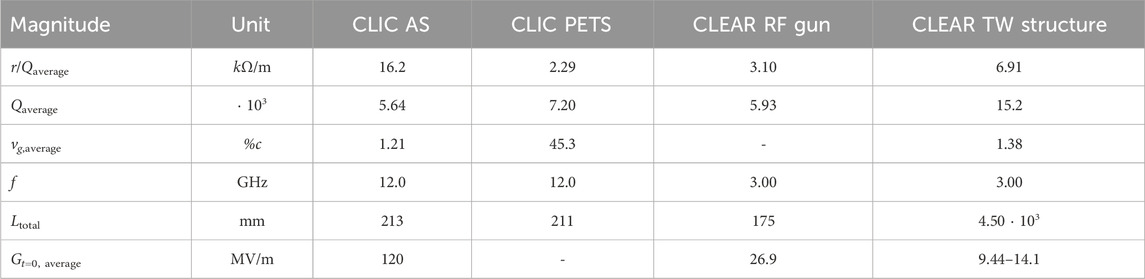
The structural specifications required for the simulations are shown in Table 1.
3.2.1 Gradient reduction in CLIC AS
A train of 312 bunches with qbunch = 500 pC and a bunch injection frequency of fb = 2.0 GHz has been tracked along CLIC TW accelerating structures. Figure 3 shows the gradient reduction due to BL when such a train enters the structure. The solid blue line illustrates the initial gradient along the structure. When the mentioned beam enters the structure, a gradient reduction (illustrated by red-dashed lines) occurs until a steady state is reached (solid red line).
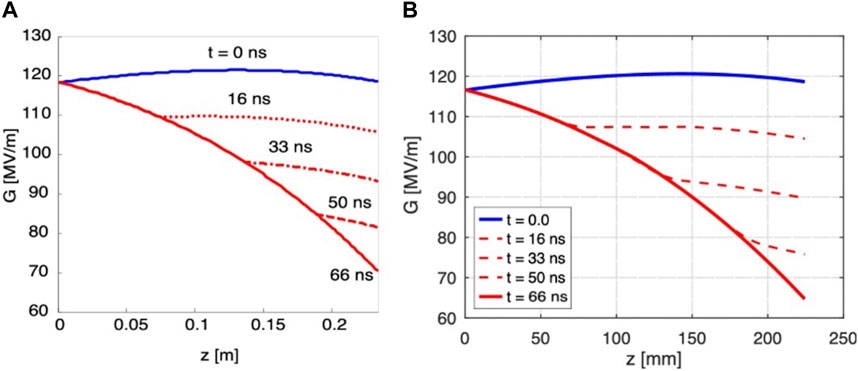
FIGURE 3. CLIC accelerating structure gradient diminution with time when a beam of 312 bunches with qbunch = 500 pC is injected with an injection frequency fb = 2.0 GHz. (A) Figure extracted from [17]. (B) RF-Track calculation.
On one hand, Figure 3A illustrates the analytical solution of Eq. 26, as shown in [17], making use of the Laplace transform method, which has also been benchmarked with HFSS [27] simulations. On the other hand, Figure 3B corresponds to the gradient reduction calculated with RF-Track.
Good agreement can be found between these two procedures, both in the magnitude of the fields and the time at which the steady state is reached. This happens at the so-called filling time (tfill), defined for TW structures and calculated for CLIC AS as
3.2.2 CLIC PETS
The case of a beam of 2,928 bunches with qbunch = 8.42 nC, bunch injection frequency fb = 12.0 GHz, an initial energy (E0) per bunch of 2.40 GeV going through 1492 CLIC PETS is shown in Figure 4, where the longitudinal phase space of the beam (Figure 4A) and the bunch 20 (Figure 4B) are displayed.
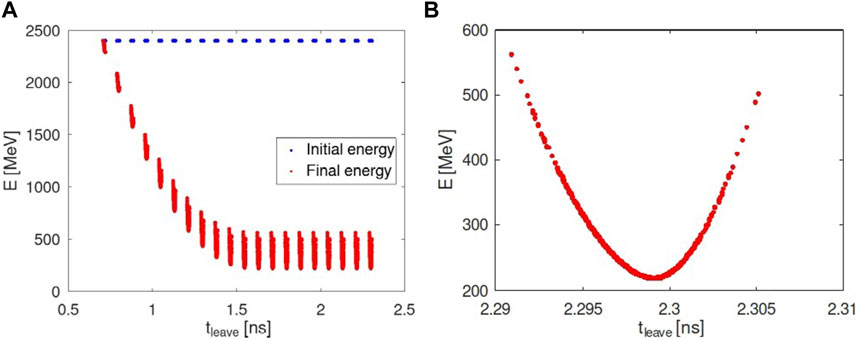
FIGURE 4. Longitudinal phase space for a beam of 2,928 bunches with qbunch = 8.42 nC, bunch injection frequency fb = 12.0 GHz, and E0 = 2.40 GeV after leaving 1492 PETS at a time tleave. (A) First 20 bunches. (B) 20th bunch.
Due to the beam-induced field, an energy loss of bunches takes place, as can be seen by comparing the initial and final energies in Figure 4A. This energy loss is not the same for all bunches since a transient regime takes place. In this case, the filling time is tfill = 1.6 ns and corresponds to the time needed to reach the steady state, coinciding with the time when the bunch 11 leaves the structure.
This simulation enables the calculation of the power-extraction efficiency factor (ηextr), defined and calculated for this case as
Similar CLIC PETS beam dynamics simulations and ηextr calculations were carried out in [28] with PLACET. A similar behavior of the bunches is reported, as well as an η-value of ηextr = 90%, which deviates 0.7% from RF-Track’s result in Eq. 36.
PETS are conceived in PLACET as specific elements where a group velocity-dependent flow of the longitudinal wakefield is admitted for this particular situation. However, this flowing wake strategy is not implemented in arbitrary TW structures, thus disabling the computation of this effect in externally fed structures.
In this sense, RF-Track constitutes an alternative for PETS simulation, which, in addition, generalizes the physics behind this effect to both TW and SW structures, allowing beam dynamics simulations and gradient calculation in such situations.
3.3 Beam-loading measurements in the CLEAR experimental setup
The CERN Linear Accelerator for Research at CERN is a versatile user facility providing a 200-MeV electron beam for accelerator R&D, irradiation studies for space, and medical applications [29]. It consists of a 25-m-long electron beam injector, called CALIFES [30], and a 16-m-long user beamline. The BL measurements have been performed in CALIFES, whose schematic representation is shown in Figure 5.
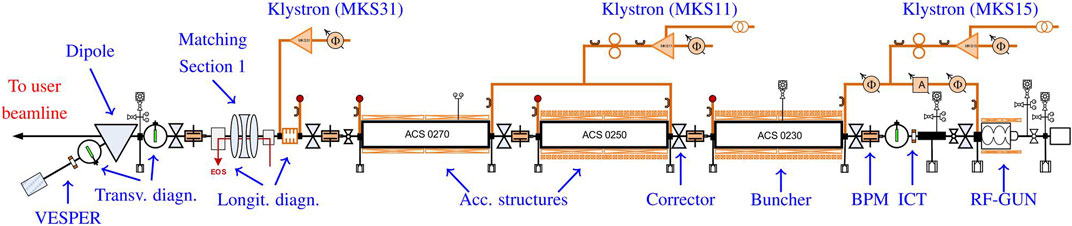
FIGURE 5. CALIFES schematic representation. The beam goes from right to left [31].
The electron beam is generated on a Cs2Te photo-cathode upon laser incidence and is captured by an RF gun [31]. Thereafter, three 4.5-m-long TW structures are placed to bunch and accelerate the beam. Both the RF-gun and the TW structures are fed by two independent 3-GHz modulators/klystrons, and a rich set of beam diagnostics is set along the beamline to monitor the beam. The main parameters of the accelerating structures are displayed in Table 1.
3.3.1 BL measurements in CALIFES’ photo-injector
Gun-loop voltage measurements can be carried out in CALIFES over an RF cycle. This allows the calculation of the beam-induced voltage reduction by comparing the voltage of an unloaded cycle (Vul) with the voltage of a beam-loaded cycle (Vl).
This can be seen in Figure 6A, where a voltage drop occurs when the beam is injected. The beam-induced energy loss from the first-to-last bunch (Eloss, BL) is defined as
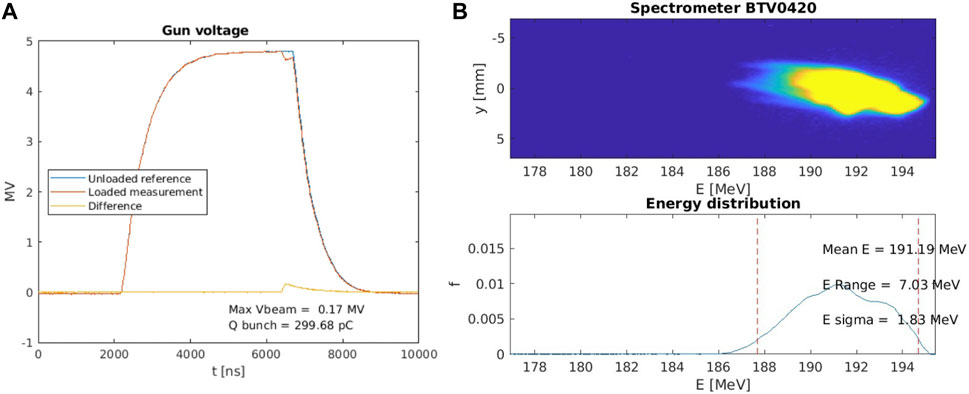
FIGURE 6. Beam-loading measurements at CLEAR. (A) Voltage read in the CLEAR RF gun loop. (B) Beam at the VESPER spectrometer and energy distribution.
Beam-induced energy losses for beams with varying bunches (Nbunches) and varying charge per bunch (qbunch) were measured following this procedure. For each beam configuration, a set of 20 data points
3.3.2 BL measurements in the VESPER spectrometer
The Very energetic Electron facility for Space Planetary Exploration missions in harsh Radiative environments (VESPER) [32] is a high-energy electron beamline for radiation testing that is part of CLEAR, as shown in Figure 5. Its spectrometer, consisting of a deflecting dipole and a screen (BTV0420), was used to measure the energy distribution of the beam after CLEAR TW accelerating structures.
Charged particles undergo dispersive effects in such a setup. Therefore, there is a relationship between the position x at which particles arrive at the screen and the energy E of them. This is shown in Figure 6B, where the image of the beam at BTV0420 allows the reconstruction of the beam energy spectrum.
Beams of varying Nbunches and qbunch were sent through the structure, and for each configuration, the mean energy of the train (⟨E⟩), the energy range (Erange), and the energy spread (σE) were recorded. A set of 20 measurements was obtained
4 Results and discussion
The experimental validity of the power-diffusive model and the accuracy of the two BL modules implemented in RF-Track have been assessed by a direct comparison of the simulation with measurements of the BL effect carried out in the CLEAR facility. A summary of the involved cavities can be found in Table 1.
4.1 CLEAR standing-wave photoinjector
A beam of 150 bunches with fb = 1.5 GHz was injected into the CLEAR RF gun. For different qbunch, the beam induced energy losses have been measured as exposed in Eq. 37. The results are shown in Figure 7A. The same scenario was simulated with RF-Track, and the beam-induced energy loss (Eloss, BL) dependency with qbunch is illustrated in Figure 7B.
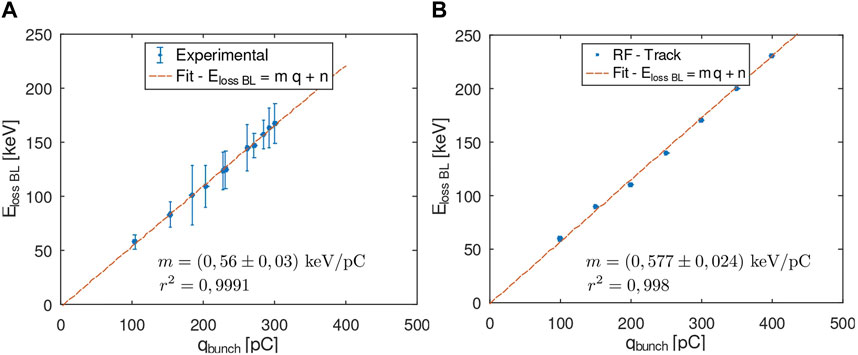
FIGURE 7. Beam-induced energy loss of a train of 150 bunches with a bunch spacing of 2T as a function of qbunch in the CALIFES gun. (A) Experimental measurements. (B) RF-Track simulation.
A linear dependency of the beam-induced energy loss with qbunch is found, as reflected by the high value of the r2 coefficient from the linear fit of both experimental and simulation data. This is consistent with the beam-loading term in Eq. 29, which depends linearly on
The positive sign of the slope (m) confirms that the higher the charge of the injected bunch, the greater the gradient reduction due to BL. A good agreement is found between the slopes obtained from the experimental data and RF-Track’s simulation, as shown in Table 2, where a slope deviation (δm) of 3.4% is obtained for this case.
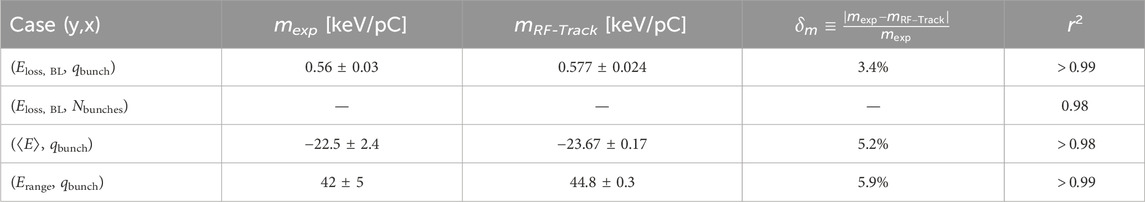
TABLE 2. Statistical indicators of the simulation–measurement agreement.
The validity of the BL model in non-ultrarelativistic SW structures relies on experimental results as to the knowledge of the authors, no tracking code incorporates this feature yet for β < 1. For that reason, additional measurements were taken in the CLEAR gun. In this case, a beam with a fixed charge per bunch of qbunch = 294 ± 24 pC was injected into the structure.
Figure 8 shows the dependency of Eloss, BL on the number of bunches. A similar conclusion can be drawn from this comparison: larger charges lead to greater energy losses as a consequence of beam-loading-induced gradient reduction, and accordance between simulations and measurement is obtained, as reflected by the large r2 value shown in Table 2.
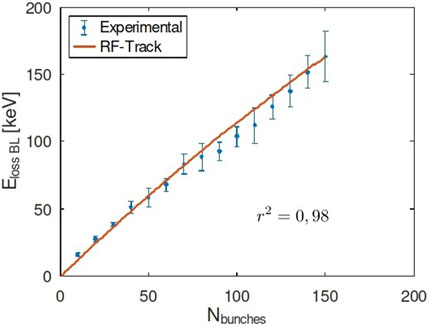
FIGURE 8. Beam-induced energy loss of a train with qbunch = 294 ± 24 pC and bunch injection frequency fb = 1.5 GHz as a function of the number of bunches in CLEAR RF-gun.
Finally, Figure 9 shows the evolution of the bunch-averaged time-transit factor from bunch to bunch. A slight variation in the time-transit factor from bunch to bunch is observed due to the BL-induced gradient reduction. Lower energy gains lead to lower velocities along the structure, which result in particles arriving at different times to the starting position of the cell, thus seeing a different phase of the accelerating electric field.
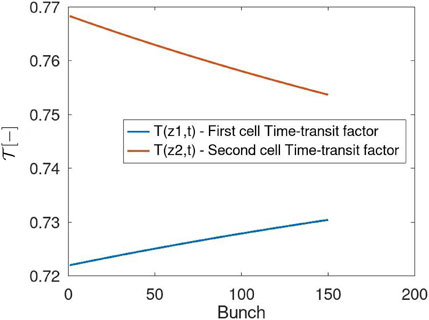
FIGURE 9. Time-transit factor evolution with time in the CLEAR RF gun.
4.2 CLEAR start-to-end performance
A beam of 50 bunches is injected into CLEAR, and its energy is measured in VESPER, as shown in Section 3.3.2. Several measurements have been taken for different values of the charge per bunch, ranging from 100 to 400 pC. Figures 10A, C show the dependency of ⟨E⟩ and Erange with the charge per bunch. Figures 10B, D show the analogous simulations in RF-Track.
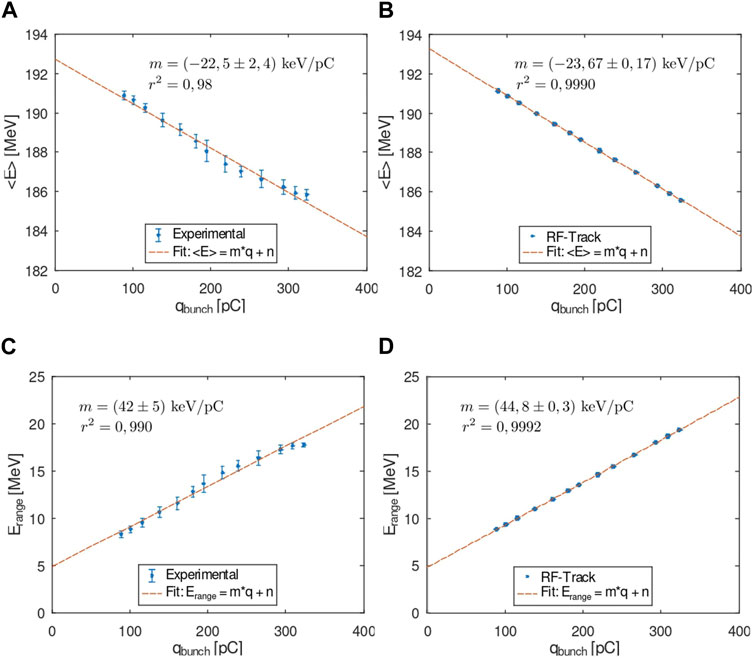
FIGURE 10. Beam-loading measurements for a train of 50 bunches with an injection frequency of 1.5 GHz going through CLEAR accelerating structures as a function of the charge per bunch. (A) Experimental mean energy. (B) RF-Track simulation for mean energy. (C) Experimental energy range. (D) RF-Track simulation for the energy range.
For both ⟨E⟩ and Erange, an agreement is found between measurements and simulations since results deviate only up to 5.9% and high r2 values are reported (see Table 2). In addition, the results indicate the same dependency of energy loss with beam charge, which is consistent with Eqs 26, 29.
5 Conclusion
Starting from the Poynting theorem, a power-diffusive model for both TW and SW structures has been derived and implemented into the tracking code RF-Track. The figures of merit employed for the deduction of Eqs 26, 29 are time-averaged over a period, thus limiting the validity of the BL module developed in RF-Track to timescales greater than T. As a result, it captures the long-range interaction from bunch-to-bunch but no intra-bunch effects.
As a consequence, the BL effect was implemented as a flexible module as described in Eqs 31–35, which can be supersposed to the other effects available in RF-Track. The designed tool captures the transitivity of the BL effect and reflects how this transition to a steady-state depends on the filling time of the structure. This allows the simulation of realistic scenarios where transient beam loading plays an important role, resulting in different energy losses from bunch to bunch (see Figures 4, 6).
Moreover, the simulation results show great agreement with experimental measurements in the CLEAR facility, as shown in Table 2, as well as consistency with the proposed physical model and previous theoretical results for particular cases [17].
In conclusion, a unique and accurate simulation tool accounting for the BL effect has been designed and implemented into the tracking code RF-Track, exhibiting rapid simulation speed—orders of magnitude below EM solvers, thus allowing tracking at runtime of these fields. This opens the door to novel accelerator designs where the BL effect is relevant, such as energy recovery LINACs, multi-species accelerating structures, such as positron sources for future colliders, or compact accelerator-based neutron sources.
Data availability statement
The raw data supporting the conclusion of this article will be made available by the authors, without undue reservation.
Author contributions
JO: conceptualization, data curation, formal analysis, investigation, methodology, software, visualization, and writing–original draft. AL: conceptualization, project administration, software, supervision, validation, writing–review and editing, and visualization. AA: methodology, supervision, validation, and writing–review and editing. NF: investigation, project administration, supervision, validation, visualization, and writing–review and editing. BG: investigation, project administration, supervision, validation, and writing–review and editing. DE: project administration, supervision, validation, investigation, and writing–review and editing.
Funding
The author(s) declare that financial support was received for the research, authorship, and/or publication of this article. Work supported by Generalitat Valenciana CDEIGENT/2021/012. The authors declare that this study received funding from CERN.
Acknowledgments
The authors thank Dr. Alexej Grudiev and Dr. Ping Wang for their valuable comments on the beam-loading effect and the CLEAR OP TEAM for the machine specifications provided.
Conflict of interest
The authors declare that the research was conducted in the absence of any commercial or financial relationships that could be construed as a potential conflict of interest.
Publisher’s note
All claims expressed in this article are solely those of the authors and do not necessarily represent those of their affiliated organizations, or those of the publisher, the editors, and the reviewers. Any product that may be evaluated in this article, or claim that may be made by its manufacturer, is not guaranteed or endorsed by the publisher.
References
1. Stupakov G, Penn G. Classical mechanics and electromagnetism in accelerator physics. Cham, Switzerland: Springer Nature (2018). p. 182–8.
2. Jackson JD. Classical electrodynamics, 57. Hoboken, New Jersey: John Wiley and Sons (1999). p. 75–8.
3. Leiss JE. Beam Loading and Transient behavior in travelling wave electron linear accelerators. In: PM Lapostolle, editor. Linear accelerators. Amsterdam, Holland: A.L. North Holland Publishing Company (1970). p. 147–72. Available at: https://www.osti.gov/biblio/4723270 (Accessed October 2023).
4. Saxon G. Theory of electron beam loading in linear accelerators. Proc Phys Soc Section B (1954) 67(9):705–16. doi:10.1088/0370-1301/67/9/306
5. Leiss JE, Penner S, Rose JE, Broberg JB. “Transient beam loading in electron linear Accelerators”in. IEEE Trans Nucl Sci (1965) 12(3):566–79.
6. Chao A. Physics of collective beam instabilities in high energy particle accelerators. New York, US: John Wiley and Sons (1993).
7. Wolski A. Beam dynamics in high energy particle accelerators. London, England: Imperial College Press (2014).
8. Ng KY. Physics of intensity dependent beam instabilities. Batavia, US: Fermi National Accelerator Laboratory (2005).
9. Aicheler M, Burrows P, Draper M, Garvey T, Lebrun P, Peach K, et al. A Multi-TeV linear collider based on CLIC technology: CLIC Conceptual Design Report. Menlo Park, CA, United States: SLAC National Accelerator Lab (2014).
10. Hubner K. Accelerators for high-energy physics. In: 2004 European School of High-Energy Physics; 30 May-12 June 2004; Geneva, Swizerland. CERN (2004). p. 361–94.
11. Kononenko O, Grudiev A. Transient beam-loading model and compensation in Compact Linear Collider main linac. Phys Rev ST Accel Beam (2011) 14:111001. doi:10.1103/physrevstab.14.111001
12. Borland M. ELEGANT: a flexible SDDS-compliant code for accelerator simulation (2000). doi:10.2172/761286
13. Latina A, Levinsen Y, Schulte D, Snuverink J. Evolution of the tracking code PLACET. In: Proceedings of the 13th International Particle Accelerator Conference, IPAC2013; 12-17 May 2013; Shanghai, China (2013).
14. Solvers ES, Compatibility C. CST studio suite (2020). Available at: https://www.3ds.com/ko/products-services/simulia/products/cst-studio-suite/solvers/ (Accessed October 11, 2023).
15. Bruns W. GdfidL v. 2.0: syntax and semantics (1998). Available at: www.gdfidl.de/Manual/ (Accessed October 11, 2023).
16. Wilson PB. Beam loading in high-energy storage rings. Menlo Park, US: SLAC National Accelerator Lab (1974).
17. Lunin A, Yakovlev V, Grudiev A. Analytical solutions for transient and steady-state beam loading in arbitrary travelling wave accelerating structures. Phys Rev Spec Top Accel Beams (2011) 14:05. doi:10.1103/PhysRevSTAB.14.052001
18. Jones RM, Dolgashev VA, Wang. JW. Dispersion, and energy compensation in high-gradient linacs for lepton colliders. Phys Rev St Accel Beams (2009) 12:051001. doi:10.1103/physrevstab.12.051001
19. Latina A. RF-track reference manual. Geneva, Switzerland: CERN (2020). doi:10.5281/zenodo.3887085
20. CLEAR. CLEAR beam line description (2023). Available at: https://clear.cern/content/beam-line-description (Accessed October 11, 2023).
21. Venkatasubramanian V Tools for dynamic analysis of the general large power system using time-varying phasors. Int J Electr Power Energ Syst (1994) 16(6):365–76. doi:10.1016/0142-0615(94)90023-x
22. Dome G. Basic RF theory, waveguides and cavities. In: CAS Proceedings. RF Engineering for particle accelerators. Oxford UK: Exeter College (1991).
23. Weiss M. Introduction to RF linear accelerators. In: CAS Proceedings. Fifth General Accelerator Physics Course; 7-18 September 1992; Jyväskylä, Finland (1992).
26. Vetterling WT. Numerical recipes example book (C++): the art of scientific computing. Cambridge: Cambridge University Press (2002). p. 1031.
27. ANSYS. ANSYS HFSS software (2024). Available at: http://www.ansoft.com/products/hf/hfss (Accessed October 2023).
28. Adli E. A study of the beam physics in the CLIC drive beam decelerator. Oslo (N): University of Oslo (2008). [PhD’s thesis].
29. Corsini R, Farabolini W, Malyzhenkov A, Dyksl LA, Koryskol P, Sjobak KN, et al. The design of a second user beamline for the CLEAR user facility at CERN. In: In: IPAC22: 13th International Particle Accelerator Conference; June 1, 2022; Bangkok, Thailand (2022). doi:10.18429/JACoW-IPAC2022-THPOST018
30. Navarro Quirante JL, Corsini R, Grudiev A, Lefreve T, Mazzoni S, Pan R, et al. CALIFES: a multi-purpose electron beam for accelerator technology tests. In: Proceedings of the 27th Linear Accelerator Conference, LINAC 2014; August 31-September 5, 2014; Geneva, Switzerland (2014).
31. Gamba D, Corsini R, Curt S, Doebert S, Farabolini W, Mcmonagle G, et al. The CLEAR user facility at CERN. NIMS-A. (2018) 909:480–3. doi:10.1016/j.nima.2017.11.080
32. VESPER. VESPER facility official site web (2023). Available at: http://vesper.web.cern.ch/ (Accessed October, 2023).
Keywords: beam loading, LINAC, energy loss, tracking simulation, transient, high-intensity beam, CLEAR, gradient reduction
Citation: Olivares Herrador J, Latina A, Aksoy A, Fuster Martínez N, Gimeno B and Esperante D (2024) Implementation of the beam-loading effect in the tracking code RF-track based on a power-diffusive model. Front. Phys. 12:1348042. doi: 10.3389/fphy.2024.1348042
Received: 01 December 2023; Accepted: 05 February 2024;
Published: 15 March 2024.
Edited by:
Yelong Wei, University of Science and Technology of China, ChinaReviewed by:
Jiahang Shao, Institute of Advanced Science Facilities, ChinaXingguang Liu, China Spallation Neutron Source, China
Valery Dolgashev, Stanford University, United States
Copyright © 2024 Olivares Herrador, Latina, Aksoy, Fuster Martínez, Gimeno and Esperante. This is an open-access article distributed under the terms of the Creative Commons Attribution License (CC BY). The use, distribution or reproduction in other forums is permitted, provided the original author(s) and the copyright owner(s) are credited and that the original publication in this journal is cited, in accordance with accepted academic practice. No use, distribution or reproduction is permitted which does not comply with these terms.
*Correspondence: Javier Olivares Herrador, javier.olivares.herrador@cern.ch