Insights into the structure–function relationship of missense mutations in the human TOP2A protein in ovarian cancer
 Kannan Kavitha
  Arumugam Mohanapriya*
- Department of Biotechnology, School of Bioscience and Technology, Vellore Institute of Technology, Vellore, Tamil Nadu, India
Topoisomerase 2-alpha (TOP2A) is a nuclear protein that is responsible for the maintenance of the topological state of DNA. TOP2A is highly upregulated in ovarian cancer, and its copy number is an important prognosis factor. A large number of single-nucleotide polymorphism (SNP), insertion, and deletion mutations have been reported in TOP2A. Thus, a structural and functional study of missense SNPs was carried out to screen potentially damaging mutations. The 193 non-synonymous SNPs in the coding region of TOP2A in the dbSNP database were selected for in silico analysis. The deleterious SNPs were screened using sorting intolerant from tolerant (SIFT), PolyPhen-2, SNAP2, and SNPs&Go, and we obtained four possibly damaging SNPs at the end (Y481C, N7741, E922K, and R1514W). Mutants Y481C and E922K were predicted to be highly deleterious and showed decreased protein stability compared with native proteins, as predicted by I-Mutant 3. We used the SWISS-MODEL to model the structure of these two mutants, and the structural attributes of modeled mutants were studied using Hope Project, solvent accessibility-based protein–protein interface identification and recognition (SPPIDER), SRide, and HBAT, which predicted small variations from the native protein. Molecular dynamics simulation demonstrated a decrease in root mean square deviation (RMSD) and the radius of gyration of two mutants, which is relative to the native protein. The molecular docking of TOP2A with etoposide suggests that mutations may lead to resistance to TOP2A-targeted chemotherapy. In addition, the relative expression analysis performed by qRT-PCR also reveals that there is a three-fold increase in the expression levels of the TOP2A protein in ovarian adenoma cancer cell lines. Our analysis reveals that Y481C and E922K are highly damaging variants of TOP2A, which alter the protein dynamics and may be implicated in causing ovarian cancer.
1 Introduction
Ovarian cancer ranks eighth in deaths due to cancer, accounting for more deaths than any other cancers of the female reproductive system, with 238,700 new cases being reported in 2012 [1]. Ovarian cancer is associated with the worst prognosis and has the highest mortality rates among all gynecological cancers [2]. Ovarian cancer is highly aggressive, is often asymptomatic, presents itself at advanced stages, and has a poor prognosis. The aggressiveness of ovarian cancer can be measured by several factors, including the response to treatment, the rate of recurrence, and the overall survival rates. The survival rates of patients diagnosed with ovarian cancer vary greatly, depending on the stage of the disease at the time of diagnosis. Patients diagnosed at early stages (I and II) have a better chance of survival than those diagnosed at later stages (III and IV). Unfortunately, most women are diagnosed with advanced-stage disease, which has a poor prognosis and a low 5-year survival rate. A study conducted in 2018 by Torre et al. suggested that at stages III and IV of serous carcinomas, the survival rate was 42% and 26%, respectively [3]. The American Cancer Society uses the National Cancer Institute’s (NCI) Surveillance, Epidemiology, and End Results (SEER) database, which reported that a 31% 5-year survival rate was seen for distant invasive epithelial ovarian cancer [4].
The current standard treatment for ovarian cancer includes surgery and chemotherapy to remove as much of the tumor as possible and eliminate any remaining cancer cells. However, there are several obstacles to successful ovarian cancer therapy, including the development of drug resistance, the high rate of relapse, and the toxic side effects of chemotherapy. Additionally, ovarian cancer can be difficult to be diagnosed in its early stages due to the absence of specific symptoms, leading to delayed diagnosis and treatment. Newer therapies, such as targeted therapy and immunotherapy, are being investigated to address these challenges and improve the prognosis for ovarian cancer patients. Early detection and personalized treatment approaches are critical to improving the survival rates and quality of life for individuals with ovarian cancer.
Many genes are differentially expressed in ovarian cancer, and topoisomerase 2-alpha (TOP2A) is one of the genes that have been upregulated in ovarian cancer [5, 6]. The concrete variants of TOP2A and the effect of its upregulation is observed in different histological subtypes of ovarian cancer (mainly, the sub types of serous ovarian cancer, mucinous ovarian cancer, endometrioid and clear cell ovarian cancer [7]).
The TOP2A copy number in ovarian cancer is an important prognosis factor and cause of drug resistance [8, 9]. The high TOP2A mRNA levels in ovarian cancer are associated with the overall poor survival of the patient [10, 11]. The TOP2A protein is a nuclear enzyme encoded by the TOP2A gene located on chromosome 17 in the regions q21–22 and is 1,531 amino acids long [10]. The C-terminal domain is considered to mediate the catalytic activity and also interacts with the substrate DNA [11, 12, 13]. TOP2A controls the topological states of DNA during transcription and replication by ATP-dependent transient breakage and the subsequent rejoining of DNA strands [14–16]. Topoisomerase II makes double-strand breaks, which are essential during mitosis and meiosis for the proper segregation of daughter chromosomes and the release of torsional stress produced due to the negative and positive supercoiling of DNA [17–20].
The balance of the topoisomerase network is critical for proper cell functioning. An increase or decrease in the enzyme level will cause topological stress on chromosomes. The expression level of TOP2A in rapidly proliferating cells is very high compared to that in quiescent cells [21]. TOP2A-mediated cell proliferation has been targeted for cancer therapy. The FDA has approved many TOP2A inhibitors, including epirubicin, teniposide, doxorubicin, and etoposide. These drugs are used for a variety of testicular cancers, neuroblastoma, leukemia, lymphomas, breast cancer, and sarcoma. The TOP2A enzyme activity is closely related to the sensitivity of cells to TOP2A-targeting chemotherapy. The tumor cells with a defect in enzyme activity are resistant to TOP2A inhibitors.
Multiple single-nucleotide point mutations in TOP2A are associated with multiple cancer types and chemotherapy resistance [22–26]. SNPs are single-nucleotide variations that exist with more than 1% frequency in the population. SNPs can be found anywhere in the genome, including introns, exons, promoters, and repetitive elements [27]. They can be neutral or lead to a disease-causing phenotype. Non-synonymous single-nucleotide polymorphisms (nsSNPs) present in the coding region lead to a change in amino acid sequence and have an impact on the structure and function of the protein [28, 29]. Interestingly, the non-synonymous variations have the potential to alter the protein structure and function, making them of particular interest in the study of genetic variability. Although missense mutations have the potential to disrupt protein folding and function, the specific outcome depends on various factors, including the position of the mutation, the conservation of the affected amino acid residue, and the protein structure. A single-nucleotide change can alter crucial bonds for protein stability, folding, and activity, and may impact the dynamics of the protein. Thus, the study of SNP is important for early detection and better treatment of cancer.
More than 1,000 SNPs of TOP2A are present in the dbSNP database alone. An SNP present in a crucial protein can bring about large-scale phenotypic changes in a person. Identifying the phenotype and correlating it with the genotype is laborious work. The detection of deleterious variants will help organize genome-level studies and develop biomarkers for the diagnosis of a disease. SNP studies have the potential to treat multiple disorders and also drug resistance. Multiple computational approaches will significantly help in screening deleterious SNPs and predicting the functional impact of a protein. Therefore, keeping the importance of TOP2A and SNPs in mind, this in silico study was undertaken using various bioinformatics tools.
2 Materials and methods
2.1 Data retrieval
The dbSNP database of the National Center of Biotechnology Information (NCBI) was used to retrieve information on SNPs (https://www.ncbi.nlm.nih.gov/snp/). Various search filters were used to obtain validated missense SNPs in the TOP2A gene in humans [30]. Additional information about TOP2A was collected from UniProt, Protein Data Bank (PDB), and NCBI.
2.2 Structure and sequence-based investigation of SNPs
Before beginning the detailed structural analysis of SNP mutants, it is important to screen potentially damaging SNPs. Multiple tools are available to predict damaging SNPs. All these tools rely on different properties of a protein, use different algorithms, and work with varying accuracies. To improve the overall accuracy of deleterious SNP prediction and reduce the number of false negatives from our result, we used a combination of tools.
Sorting intolerant from tolerant (SIFT) (http://siftdna.org/www/SIFT_dbSNP.html) [31–34] is a tool that uses a sequence homology-based approach to classify amino acid substitutions in a protein as tolerated or tolerated. SIFT calculates the probability for all 20 amino acid substitutions at a given position. These probabilities are normalized by the probability of the most frequent amino acid and are called the SIFT score or tolerance index, which ranges from 0.0 to 1.0. If the SIFT score is less than 0.05 for an amino acid substitution, it is predicted as deleterious (intolerant); otherwise, it is predicted as tolerant. The accession IDs of SNPs collected from dbSNPs were used as query, and the analysis was performed with default settings.
Polymorphism Phenotyping v2 (PolyPhen-2) (http://genetics.bwh.harvard.edu/pph2/) [35, 36] predicts the impact of amino acid substitution on protein function and provides the prediction score using information derived from sequence annotation, multiple sequence alignment, and 3D structure (if available). The amino acid substitution is predicted as follows: possibly damaging if the score is > 0.85, probably damaging if the score is > 0.15, and benign for the remaining. PolyPhen also displays the sensitivity and specificity of the prediction. The TOP2A protein sequence accession ID (AAI40792.1) of GenBank and amino acid substitutions that are predicted deleterious by SIFT were used as inputs.
SNAP2 (https://www.rostlab.org/services/SNAP/) [37] is a neural network-based classifier that predicts the impact of all 20 amino acid substitutions on protein and represents it in the form of a heatmap with the prediction score (100 to −100). The prediction is based on predicted structural attributes (secondary structure and solvent accessibility) and evolutionary information obtained from multiple sequence alignments. The substitutions are classified as neutral if the score is < 0; otherwise, it is classified as affect. Possibly and probably damaging substitutions as predicted by PolyPhen2 were validated using SNAP2.
SNPs&GO (http://snps.biofold.org/snps-and-go/snps-and-go.html) [38] is a highly accurate tool that predicts whether a mutation is disease related or not by using evolutionary information, protein sequence, and functional annotation, as extracted from Gene Ontology terms. TOP2A (UniProtKB: P11388) was considered as input as GO terms used for the prediction are automatically retrieved only if the input sequence is a SWISS-PROT code. If not, the user has to manually provide the GO terms. The mutation is predicted as disease-causing if it has probability >0.5.
2.3 Protein stability prediction
An amino acid residue change may alter protein-folding dynamics and may impact its stability. Thus, I-Mutant 3 (http://gpcr2.biocomp.unibo.it/cgi/predictors/I-Mutant3.0/I-Mutant3.0.cgi) [39, 40] was used to predict the change in protein stability due to a single-amino acid substitution. It calculates delta delta G (DDG) (Kcal/mol), which is the change in Gibbs free energy due to the mutation in proteins. A negative DDG value represents that the mutation decreases the stability of the protein, whereas a positive DDG value represents an increase in stability. DDG was calculated at pH 7°C and 37°C.
2.4 Modelling of the mutant protein structure
The protein structure is crucial for its function and stability in a given environment. SNP can significantly alter and affect the 3D structure of protein, and thus to fully understand the impact of a mutation 3D structure, prediction and analysis are crucial steps. The native TOP2A protein structure was used as a template (Protein Data Bank) (https://www.rcsb.org/pdb/home/home.do), with accession ID 5GWK and a resolution of 3.15 A°. The protein structure was validated using PROCHECK (http://www.ebi.ac.uk/thornton- srv/software/PROCHECK/) [41, 42]. The PROCHECK analysis provides an idea of the stereo-chemical quality of all protein chains in a given PDB structure. They highlight regions of the proteins which appear to have unusual geometry and provide an overall assessment of the structure as a whole. The protein structures of mutants were modeled using SWISS-MODEL (https://swissmodel.expasy.org/), which uses the GROMACS algorithm for energy minimization to bring the protein to the most favorable conformation [43, 44].
2.5 Investigation of structural attributes
An SNP can cause major changes in the overall structure of a protein. The structural attributes of a protein, such as solvent accessibility, stabilizing residues, and intra-molecular hydrogen bonds, were investigated to study the structural impact of a substitution on a protein.
The Hope Project (http://www.cmbi.ru.nl/hope/) [45] is an online web service which analyzes the effect of a mutation on the protein 3D structure and function. It collects information about the protein structure from a series of resources and provides a detailed and simple analysis of the mutation. It also provides the 3D structure visualization of the mutated protein. The UniProtKB P11388 of TOP2A and mutations Y481C and E922K were selected for input.
Solvent accessibility-based protein–protein interface identification and recognition (SPPIDER) (http://sppider.cchmc.org/) [46] was used to predict the 3D structure of the protein. The server used POLYVIEW 3D–dictionary of secondary structure protein (DSSP) for the prediction of the secondary structure. Solvent accessibility (SABLE) was used to predict the solvent accessibility of the protein.
SRide (http://sride.enzim.hu/) [47] is a server used to predict stabilizing residues. Stabilizing residues are believed to play a key role in protein 3D-structure stabilization and are highly conserved. SRide uses various interactions between spatial residues. A residue is selected as a stabilizing residue if it has high surrounding hydrophobicity, high long-range order, high conservation score, and if it belongs to a stabilization center. The conservation score, long-range order, and surrounding hydrophobicity threshold were set at 7, 0.010, and 18.0, respectively.
Hydrogen-bond analysis tool (HBAT) [48] automates the analysis of potential hydrogen bonds and a similar type of weak interactions like halogen bonds and non-canonical interactions in the macromolecular structure.
2.6 Molecular dynamics simulation
Molecular dynamics simulation was used to understand the variations in conformational changes with time between the native and the mutants. GROMACS version 2023.1 [49] was used for molecular simulation. The trajectory files were generated for native and mutant protein modals, and OPLS-AA/L all-atom force field [50] was used for energy minimization. The system was solvated using the TIP3P water model in a cubic box with a 1-nm marginal radius. The systems were equilibrated for 100 ps at a constant temperature of 300 K and 1 atm pressure. The simulation was run for 50 ns. The trajectory files of native and mutant proteins were analyzed for the comparative analysis of structural deviations. We used root mean square deviation (RMSD), root mean square fluctuation (RMSF), and radius of gyration (Rg). All the graphs were generated using the Xmgrace tool.
Essential dynamics (ED) is an important tool utilized to study the correlated motion in a protein. We used ED to calculate the eigenvectors and their eigenvalues as well as their projections along the first two principal components. In the process of calculation, a covariance matrix was generated using covar command after the translational and rotational movements were eliminated from the trajectories. The values of eigenvector and corresponding eigenvalues were generated by diagonalizing the covariance matrix. The eigenvectors represent the direction in the conformational space and indicate the collective motion of the group of atoms in these directions. The eigenvalues represent the mean square fluctuation of the atoms along their corresponding eigenvectors. The anaeig command was used for the projection of trajectories onto the eigenvectors. ED is a very power tool utilized to reduce the high-dimensional data into a low-dimensional data to reduce its complexity. It extracts the motions which are presumed to be crucial for the protein biological function [51, 52].
2.7 Molecular docking
We performed the molecular docking study of etoposide with the native and mutant proteins to check any changes in drug protein-binding energy, as decreased affinity with protein may be a cause of drug resistance in TOP2A. The AutoDock1.5.6r-c2 suite was used for docking studies [53, 54]. All the hetero atoms and water molecules were removed. Next, we added polar hydrogens and Kollman charges to the protein and saved the PDBQT files. The SDF files of 3D drug conformers of the etoposide structure with accession ID 36,462 were retrieved from PubChem (http://pubchem.ncbi.nlm.nih.gov/). Open-Babel 2.4.0 was used to convert the drug structures into the PDB format. The grid box of 80 Å × 80 Å × 80 Å with a 0.375-Å spacing centered at the site of the DNA cleavage of the topo–DNA complex was created. Lamarckian genetic search algorithm with an initial population of 150 randomly placed individuals, a maximum number of 27,000 energy evaluations, 0.02 as the gene mutation rate, and 0.8 as the gene crossover rate was used. Grid maps were obtained using AutoGrid. A total of 60 binding conformations were generated for each molecule using the genetic algorithm search.
AutoDock calculates the inhibition constant for a drug–receptor complex. The inhibition constant is a measure of the potency of an inhibitor. It is the concentration of inhibitors required to produce 50% of the maximum inhibition. A lower value implies the high potency of the inhibitor. After docking, conformation with the lowest binding energy was used to prepare the PDBQT file of the protein–ligand complex. The structures were analyzed for interaction with residues using Discovery Studio 4.1 Visualizer.
2.8 Cell culture and RNA extraction
The Pa-1 ovarian adenocarcinoma cell line procured from NCCS, Pune, India, was cultured in high-glucose DMEM with 10% FBS and 1% antibiotics in 5% CO2, 18%–20% O2, and 37°C incubator, and sub-cultured every 3 days at passage 40. For RNA extraction, 0.5 × 10⁶ cells were plated in a 6-well plate, incubated overnight, lysed with TRIzol, and centrifuged. The aqueous phase was separated, mixed with isopropanol, pelleted, and washed with ethanol. The RNA pellet was air-dried and re-suspended in RNase-free water. RNA quality and concentration were assessed at 260 nm and 280 nm using a NanoDrop spectrophotometer, respectively (Thermo Fisher Scientific).
2.9 Reverse transcription and primer validation
Reverse transcription reactions must be conducted in an RNase-free environment using dedicated PCR pipettes and aerosol-resistant barrier tips. RNA templates were thawed, and reagents were kept on ice and gently vortexed. cDNA was synthesized with the iScript cDNA synthesis kit (Bio-Rad) using random hexamer + oligo dT primers. The reaction included 5X iScript mix, nuclease-free water, 2 ug of RNA, and reverse transcriptase enzyme. Tubes were incubated in a PCR cycler with specific temperature and time settings. The resulting first-strand cDNA was stored at −20°C. Primers for gene expression studies were designed and synthesized by Eurofins, Bangalore, based on the literature (Table 1). A gradient PCR was conducted using 50 ng of synthesized cDNA to optimize primer annealing temperature, which was set at 59°C for all primers. TOP2A gene-specific and housekeeping gene primers were validated by PCR with a mixed cDNA pool. Subsequently, primers were further validated via SYBR reactions, showing expected product sizes and no self-annealing or self-dimerization issues.
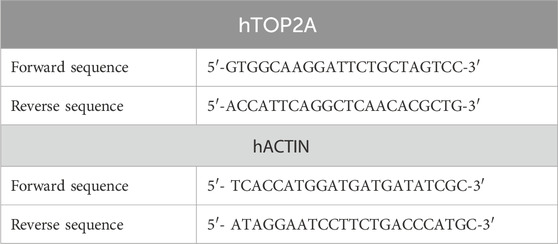
Table 1. Primers of human DNA topoisomerase II alpha (hTOP2A) and human beta-actin (hACTIN) genes for accurate gene expression quantification via RT-qPCR.
2.9.1 Gene expression quantification by qRT-PCR
Gene expression quantification was performed on a QuantStudio 3 system (Thermo Fisher) using SYBR Green chemistry (SensiFASTt SYBR Hi-ROX Kit, Bioline, USA). The 25-µL reaction mixture included first-strand cDNA, SYBR Green Master Mix (2X), 10 µM forward and reverse primers, and nuclease-free water. qRT-PCR comprised 40 cycles, with a primer concentration at 200 nM and a temperature range of 80–90°. Data were collected over 40 cycles, and the ΔΔCt method calculated fold changes, where values > 1 indicated upregulation and <1 indicated downregulation.
3 Results
3.1 Data retrieval
The dbSNP database comprises 3,753 validated and non-validated human SNPs for the TOP2A gene. There were 1,471 validated SNPs; out of them, 193 were missense, 31 in 3′UTR, 10 in 5′UTR, 1,047 in introns, 90 were coding synonymous, and the rest were other kinds of SNPs. The 193 missense mutations were selected for further analysis.
3.2 Structure- and sequence-based investigation of SNP
The 193 entries collected from dbSNP were first analyzed using SIFT. Out of 193 entries, SIFT’s 130 entries were not predicted. In the remaining entries, only 19 SNP IDs were found to be deleterious, and 2 of these were predicted with low confidence. The remaining 17 SNPs were used for analysis by PolyPhen-2. The SIFT results are shown in Table 2.
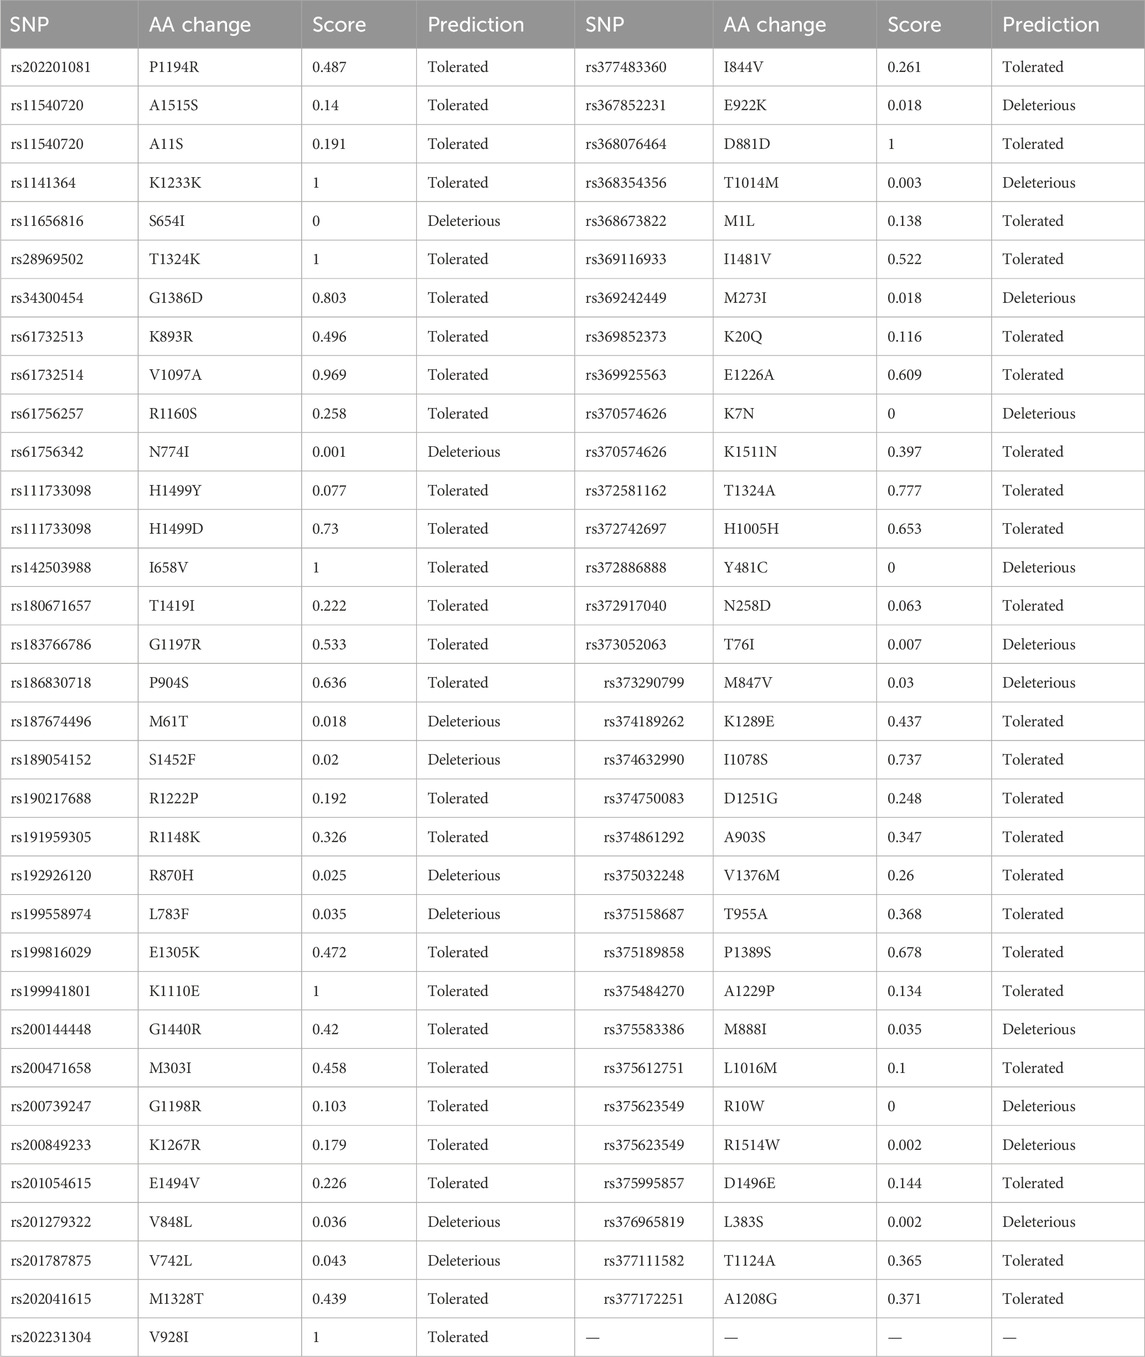
Table 2. SIFT analysis results for variants obtained from the NCBI’s dbSNP database.
PolyPhen-2 was used to filter SNPs found deleterious by SIFT analysis. A total of four IDs were predicted to be probably damaging, seven as possibly damaging, and four as benign. The PolyPhen results are shown in Table 3.
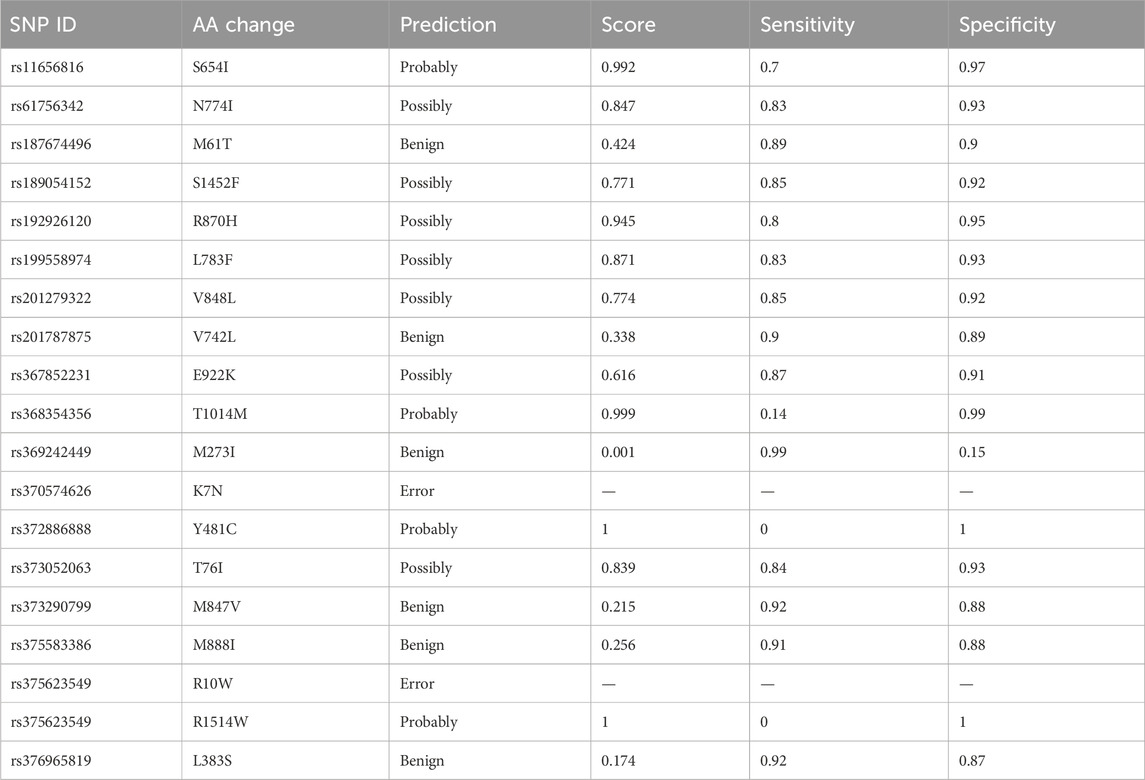
Table 3. Prediction of the functional and structural impacts on the human protein: PolyPhen-2 analysis.
SNPs predicted probably and possibly damaging were further validated by SNAP2. Out of the total 11 SNPs, 7 were predicted as neutral and four with negative effects on the protein, which included N774I (rs61756342), E922K (rs367852231), Y481C (rs372886888), and R1514W (rs375623549). The results are shown in Table 4. The four SNPs obtained from SNAP2 analysis were analyzed by SNPs&GO. All four mutations were predicted to have probability for disease with a reliability index of 1–8. The results are shown in Table 4.
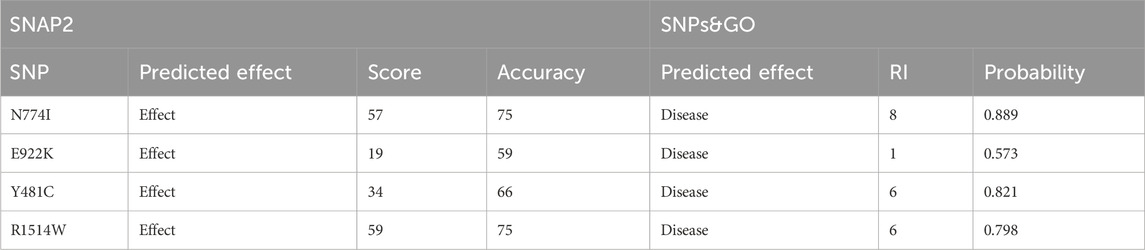
Table 4. Sequence variant analysis: unraveling functional effects with SNAP2 and disease associations using SNPs&GO analysis.
3.3 Protein stability prediction
I-Mutant 3 predicts the change in the stability of mutant protein compared to the native protein. Three of the SNPs, namely, E922K, Y481C, and R1514W, had decreased stability and N774I had increased stability. SNPs with decreased stability had a reliability index of 3–7. SNPs E922K and Y481C were selected for further studies as they had a high negative DDG value (−0.47 Kcal/mol and −1.14 Kcal/mol, respectively) as compared to R1514W (−0.24 Kcal/mol). The results are presented in Table 5.
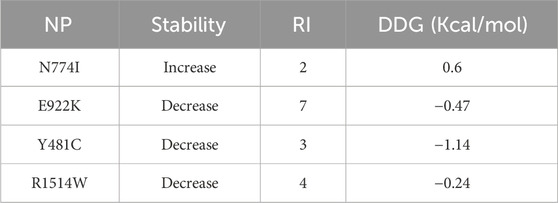
Table 5. Predicting protein stability changes: a comprehensive analysis with I-Mutant3.0.
3.4 Modelling of the mutant protein structure
The PROCHECK analysis of the 5GWK TOP2A structure revealed that most of the residues were in the most favored regions (89.7%) and, additionally, allowed the regions (10.1%) of the Ramachandran plot to show the presence of a higher number of residues in the most favored region. The mutant structure of Y481C and E922K were modeled using SWISS-MODEL. The NOMAD-Ref server was used for energy minimization. The energy-minimized structure was used for structural attribute investigation. The structure of native and mutant protein structures was visualized using PyMOL, and the results are represented in Figure 1 [55].
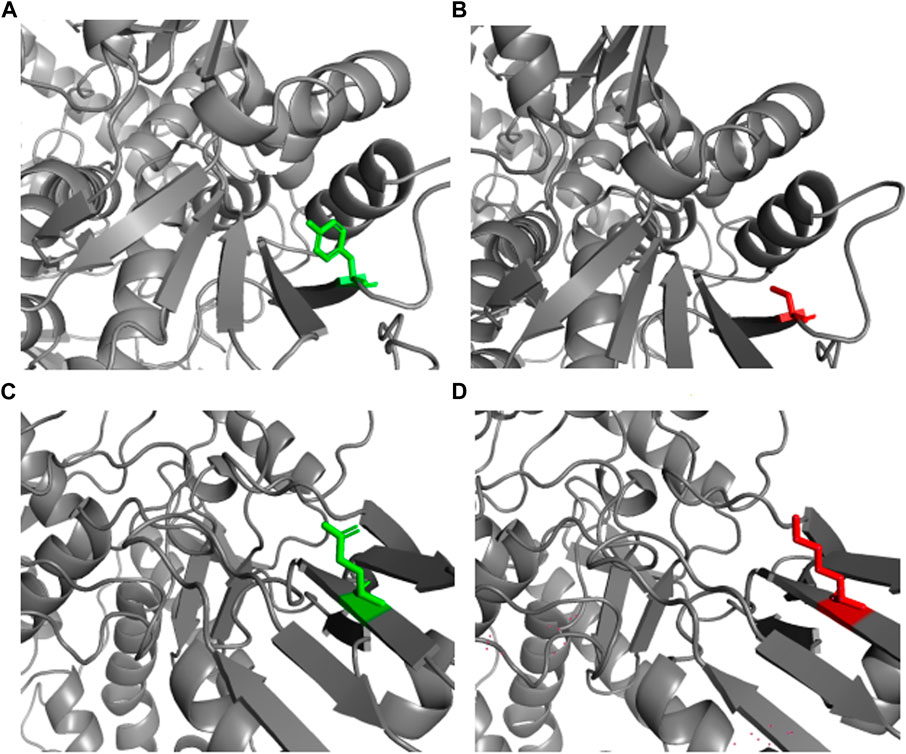
Figure 1. Wild and mutant structures of TOP2A visualized by PyMOL. The wild and mutant residues have been highlighted in green and red, respectively. (A) Native TOP2A with tyrosine at position 481. (B) Mutant TOP2A with cysteine at position 481. (C) Native TOP2A with glutamic acid at position 922. (D) Mutant TOP2A with lysine at position 922.
3.5 Investigation of structural attributes
Hope Project analysis revealed the physiochemical properties of protein mutations. In the Y481C mutant, the tyrosine residue is mutated into cysteine. The wild-type residue, tyrosine, is much conserved in homologous proteins. Cysteine being smaller than tyrosine will lead to an empty space in the core of the protein. Furthermore, the mutated residue is more hydrophobic than the native residue, which may result in reduction in the number of hydrogen bonds in the protein and prevent its proper folding. In order to check if SNPs are lying in the domain region, we subjected the protein to PROSITE analysis. Accordingly, there are two major domains predicted, which are TPORIM domain between residues 455 and 572 and Top-II a-type catalytic domain between residues 715 and 1,171. Both domains possess a deleterious mutation, each at 481 and 922, respectively. It is well understood that SNPs falling on the domain region are always linked with complex diseases or genetic disorders, and hence, the SNPs Y481C and E922K are explored more in this study.
The native residue, glutamic acid, at position 922 is mutated into lysine in the mutation E922K. Glutamic acid is also predicted to be highly conserved at position 922. Mutant residue lysine is larger than the wild-type residue glutamic acid, which is buried in the core of the protein. The larger residue may not fit in and disturb the geometry of the protein. In the native protein, negatively charged glutamic acid forms a salt bridge with lysine at positions 896 and 967. However, the positively charged lysine will not form salt bridges with lysine at positions 896 and 967, and will be repelled by these residues. This may contribute to the extra energy of the protein and may decrease its stability. The result obtained from the Hope Project is shown in Figure 2.
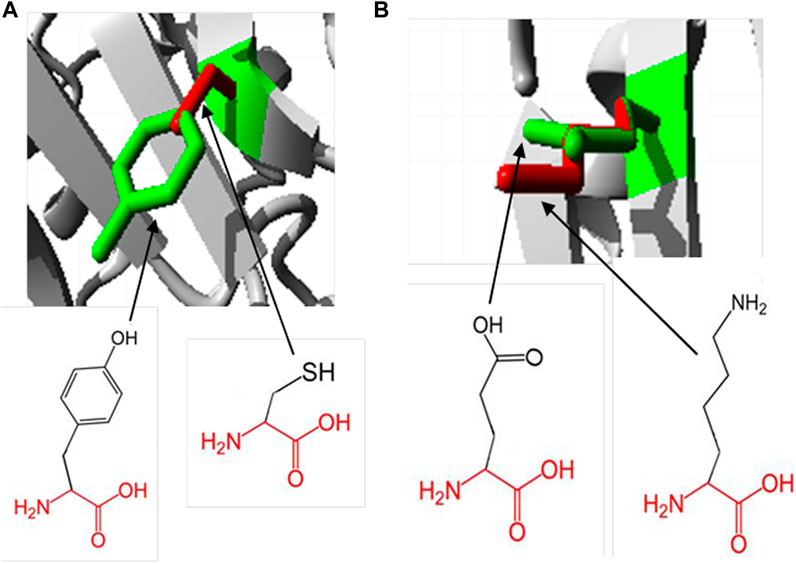
Figure 2. Superimposed structure of wild- and mutant-type residues at positions 481 and 922, respectively, obtained using the Hope Project. The protein core is represented in gray and the wild and mutant residues are represented in green and red, respectively. (A) Tyrosine residue is mutated into cysteine at position 481. (B) Glutamic acid is mutated into lysine at position 922.
The SRide analysis predicted 18 stabilizing residues in the native protein, 17 in E922K, and 15 in the Y481C mutant. In the E922K mutant, residues VAL744 and ILE806 were not stabilizing residues, and residue GLU572 was predicted to be a new stabilizing residue compared to the native. In the mutant Y481C, LYS743, ILE850, and ASN866 were not stabilizing residues. The predicted stabilizing residues are shown in Tables 6, 7.

Table 6. Enhancing protein–protein interaction studies: SPPIDER analysis for predictive site recognition.
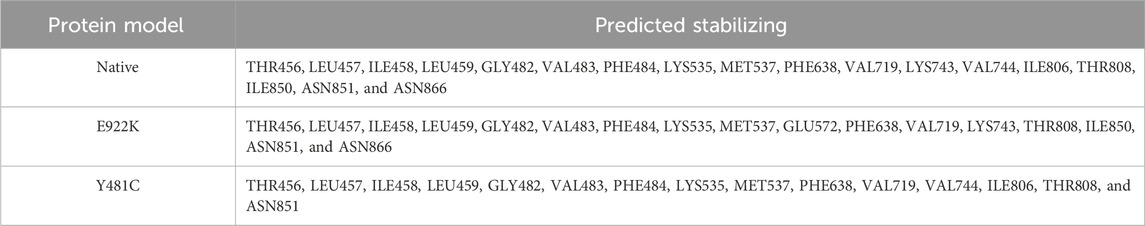
Table 7. Identification of stabilizing residues in the TOP2A protein via the SRide server. *Residue in bold denotes newly formed residue and that with an underscore represents a missing residue in the mutant as compared to the native protein.
According to the HBAT prediction, both mutants had fewer hydrogen bonds than the native protein. The native protein had a total of 4,395 hydrogen bonds, whereas mutant E922K had 4,259 and mutant Y481C had a total of 4,315 hydrogen bonds. The native had a total of 1,902 strong hydrogen bonds, that is,
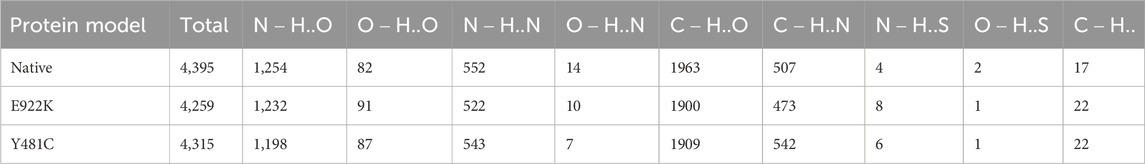
Table 8. Prediction of potential hydrogen bonds using HBAT.
3.6 Molecular dynamics simulation
We performed molecular dynamics simulation to gain better understanding of the conformational changes of the 3D structure. We carried out the simulation of mutants E922K, Y481C, and the native protein for 50 nanoseconds (ns). We analyzed the RMSD of the backbone of all the three protein models. Overall, mutant protein E922K had higher RMSD than the native and mutant Y481C. The RMSD of mutant Y481C fluctuated between 0.07 and 0.65 and that of mutant E922K fluctuated between 0.07 and 0.76, whereas the RMSD of the native showed fluctuations in the range of 0.07 and 0.64. There is a decrease in the dynamic motion of native as compared to the mutant E922K model. The graph of RMSD is shown in Figure 3.
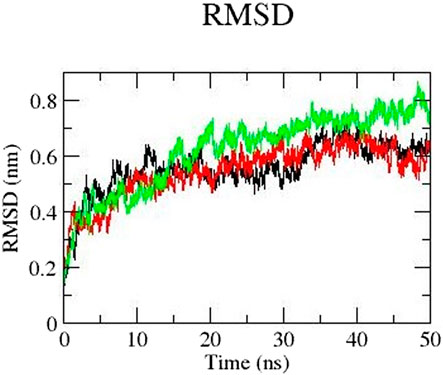
Figure 3. RMSD of the backbone of native (black), mutant Y481C (red), and mutant E922K (green).
Next, the RMSF of all residues was analyzed. The residues of mutant E922K in the range of 400–600 have a higher RMSF than those of the native protein. In addition, residues in the range from 1,000 to 1,150 were observed to show more fluctuation. Although the native residues have an RMSF of approximately 0.6 nm, Y481C residues have an RMSF closer to 1 nm and the E922K residues have an RMSF closer to 0.7 nm. For the native and mutant Y481C, the residues up to 600 fluctuate less than the mutant E922K. Mutant Y481C shows the residues of approximately 1,060 to 1,100 have an RMSF of 0.7 nm–0.6 nm, respectively, which is higher than 0.6–0.5 of the corresponding residues of the native protein. Thus, RMSF analysis reveals that mutations change fluctuations at the residual level. The result is shown in Figure 4.
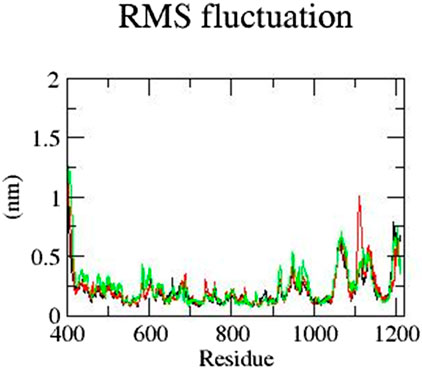
Figure 4. RMSF of the residues of native (black), mutant Y481C (red), and mutant E922K (green).
Rg represents the compactness of a protein and is an important parameter to describe the dynamic nature of the protein. Overall, mutant protein Y481C has a higher Rg value than the native and mutant E922K protein. The Rg value of mutant Y481C is higher than that of the other two proteins in the last 30 ns It fluctuates between 3.3 and 3.5 from 10 to 30 ns and stabilizes at approximately 3.3 in 15 ns–40 ns For the E922K mutant, Rg fluctuated for the first 10 ns and then remained the same at approximately 3.35 for the rest of the simulation. The native protein has an Rg of 3.4 from 0 to 10 ns and then decreases to 3.3. The mutant protein Y481C structure has the highest Rg value, which fluctuates between 3.4 and 3.5 from 30 to 50 ns, respectively. Overall, E922K mutant structures have a more compactly folded structure than the native protein. Rg results are shown in Figure 5.
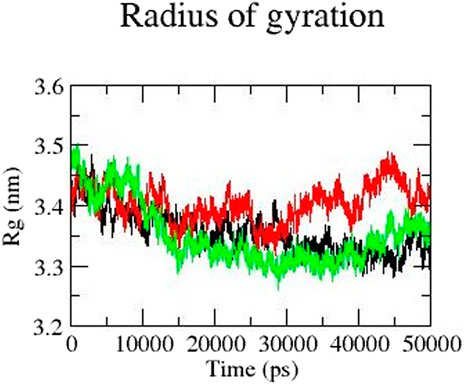
Figure 5. Radius of gyration (Rg) of native (black), mutant Y481C (red), and mutant E922K (green).
Protein flexibility was measured by the trace of the diagonalized covariance matrix of protein backbone positional fluctuations. The native protein had the highest value of 148.95 nm2, followed by mutants E922K and Y481C, with 211.356 nm2 and 183.332 nm2, respectively. The two-dimensional landscape of protein dynamics was projected on the conformational space spanned by the first and second eigenvectors. Protein Y481C and native protein occupy less space on the conformational landscape and have well-defined clusters, whereas E922K protein explores a larger subspace. Both methods indicate larger structural flexibility in the native structure and relatively restricted motion in the mutants. The mutations thus disrupt mutants. Thus, the mutations disrupt the correlated motion of the proteins and may limit its functional dynamics. PCA results are shown in Figure 6.
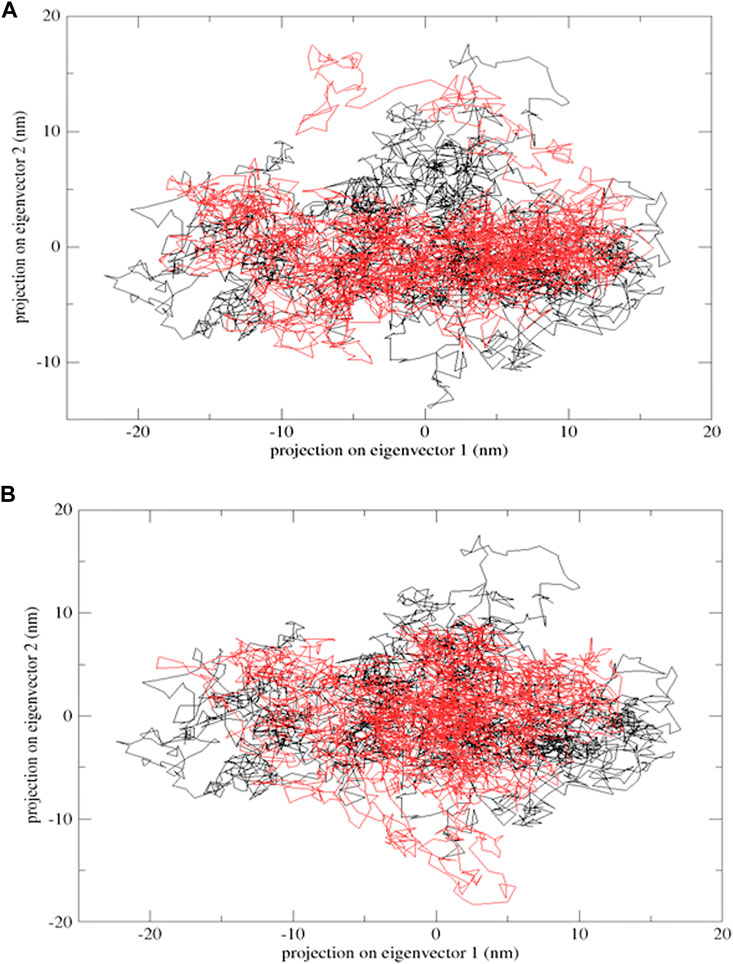
Figure 6. Projection of the motion of proteins in the phase space formed by PC1 and PC2. (A) Native (black) and mutant E922K (red); (B) native (black) and mutant Y481C (red).
Gibbs free-energy landscape plays a vital role in understanding the thermodynamic stability of the protein and was calculated using the first and second eigenvectors as coordinates. There are no large-scale differences between the mutants and native structures in the free-energy landscape. The mutants have a slightly larger region with blue color, indicating higher thermodynamic stability than the native protein. The free-energy landscape is shown in Figure 7.
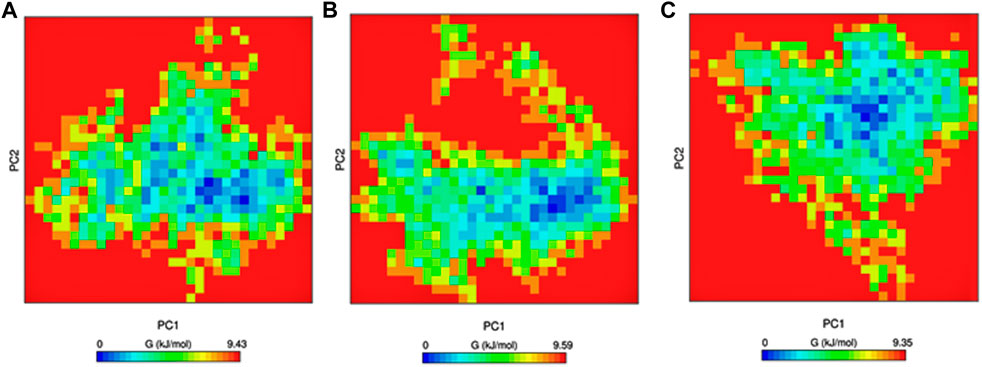
Figure 7. Gibbs free energy calculated for PC1 and PC2. (A) Native, (B) mutant E922K, and (C) mutant Y481C.
3.7 Molecular docking
The native protein had the highest binding affinity with etoposide, with a binding energy of −7.99 Kcal/mol. Mutant E922K had a slightly lower binding energy of −7.94 Kcal/mol and mutant Y481C had the least binding affinity with −7.25 as the binding energy. Residues SER763, HIS759, LYS723, and GLN726 of the native protein formed four conventional hydrogen bonds with ligands. In mutant E922K, residues TYR684, LYS728, HIS758, and GLN544 formed four hydrogen bonds with the ligand. Mutant Y481C formed the maximum number of hydrogen bonds with the ligand, that is, eight. Residues HIS759 and GLU712 formed one hydrogen bond each, residue HIS758 formed two hydrogen bonds, and residue LYS614 formed a total of four hydrogen bonds and pi-cation bond. However, apart from this, only two carbon–hydrogen bonds were observed between the ligand and protein. There were no van der Waals interaction, and large steric hindrances were observed, which might be the reason for the lowest binding affinity of the drug. The residue interaction is shown in Figure 8. The native protein had a minimum inhibition constant of 1.38 μM, followed by E922K and Y481C with 1.51 μM and 4.81 μM, respectively. The results are summarized in Table 9.
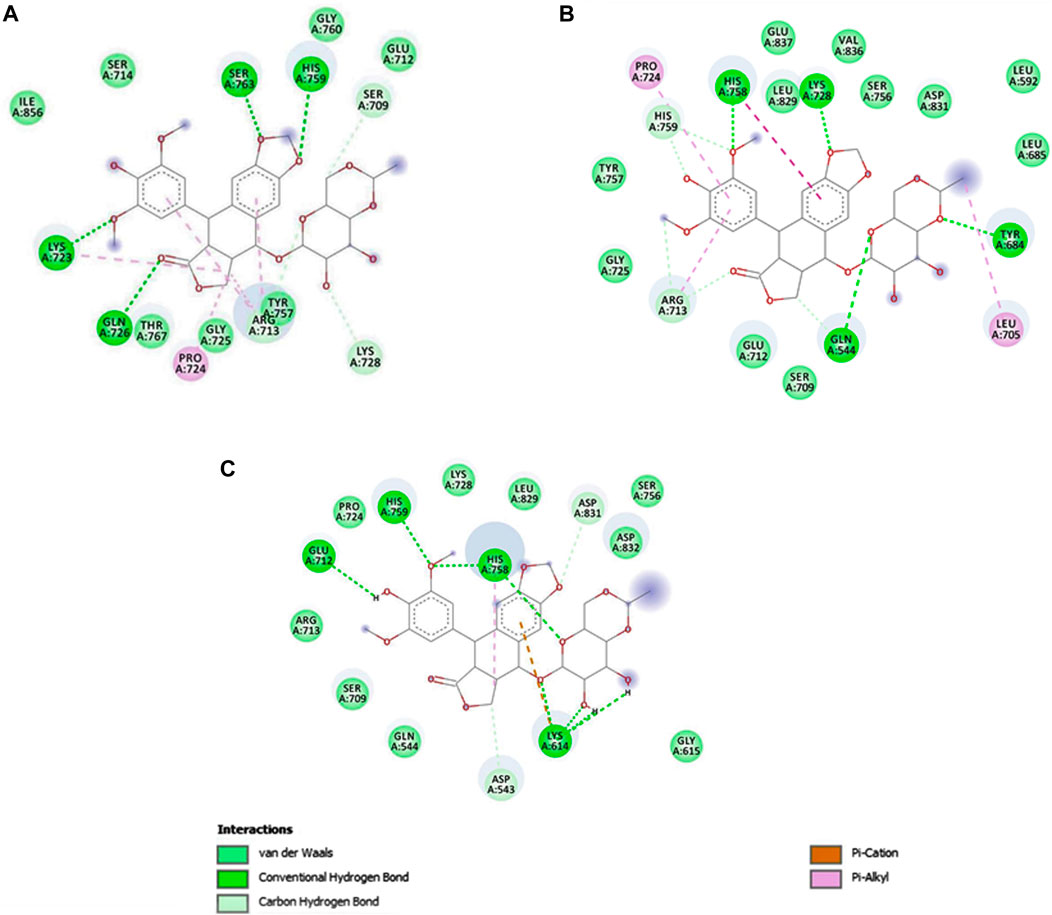
Figure 8. The interactions of etoposide with different amino acid residues are visualized using Discovery Studio. (A) Etoposide–native complex, (B) etoposide–mutant E922K complex, and (C) etoposide–mutant Y481C complex.
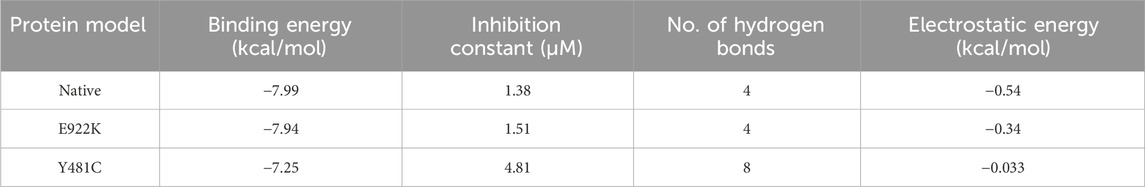
Table 9. Molecular docking studies on etoposide with native and mutant proteins.
3.8 Gene expression analysis
To determine gene expression values accurately and reliably, raw fluorescence data (Ct values) obtained from the real-time PCR instrument (QuantStudio 3) were processed using QuantStudio 3 software. The purpose of this analysis was to scale the raw data to an endogenous control gene (beta-actin), enabling the generation of relative quantities.
Calculation of ∆Ct
∆Ct, representing the difference in threshold cycle values between the target gene and the endogenous control, was calculated using the following formula:
Conversion to a linear form
To facilitate further analysis, ∆Ct values were converted to a linear form using the formula:
where E represents the amplification efficiency of the reaction.
Calculation of ∆∆Ct
The comparative Ct (∆∆Ct) method was used to determine the expression of the target gene (TG) relative to the endogenous control (EC). This method, performed using StepOne software v2.2.2, involves the following equation:
Conversion to a linear form
To simplify the interpretation, ∆∆Ct values were converted to a linear form using the following formula:
3.9 Relative expression analysis
Relative expression measures the variation in gene expression between two samples. The relative quantification (RQ) value is used to determine the fold-change compared to the calibrator, which often represents an untreated sample or time zero. In this context, the calibrator has an RQ value of 1. Genes with RQ values exceeding 1 are considered upregulated, whereas those with values below 1 are considered downregulated. All samples were compared to the calibrator.
Figure 9 illustrates the results of the RT-qPCR analysis, depicting the relative mRNA expression of the TOP2A gene in Pa-1 cells. In this analysis, the untreated culture served as the reference or calibrator, displaying a normalized data value of 1 for beta-actin and 3.91 for TOP2A. These values are based on the average of triplicate experiments, with standard deviation (SD) included for reference. The figure provides a visual representation of the gene expression changes, offering insights into the regulation of the TOP2A gene in the experimental context.
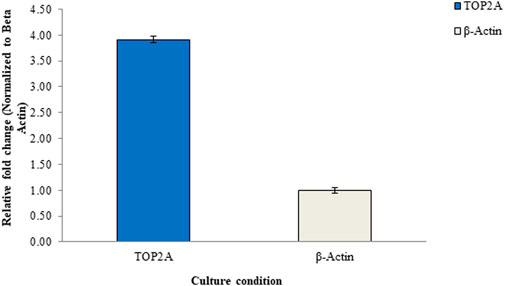
Figure 9. Relative mRNA expression levels of the TOP2A gene in Pa-1 ovarian adenocarcinoma cells determined through the RT-qPCR method.
4 Discussion
Topoisomerase 2A is an important marker for cell proliferation and plays a vital role in malignant tumors. The TOP2A mRNA and protein expression level, enzyme activity, and genetic alterations have been studied in many types of malignancies (mainly DNA replication, transcription, and chromosome segregation) [6, 18, 56–58]. In high-grade and advanced invasive primary ovarian carcinoma, the expression levels of both mRNA and protein were increased. Several SNP mutations in the TOP2A protein have been found to be associated with lung cancer, breast cancer, colorectal cancer, and ovarian cancer [59–62]. FDA-approved drugs targeting TOP2A, such as etoposide and doxorubicin, are widely used to treat different malignancies. Although promising, targeting TOP2A for chemotherapy has its own challenges. First, the point mutations in TOP2A are associated with multi-drug resistance in cancer treatment [63, 64]. These point mutations alter the structure and catalytic properties of the enzyme, making cancerous cells resistant to TOP2A-targeted chemotherapy. Second, the use of TOP2A inhibitors is associated with the development of secondary cancers [65]. Drugs such as etoposide often cause DNA rearrangement involving mixed lineage leukemia genes. It is associated with the development of secondary leukemia. Identifying TOP2A drug-resistant SNP before initiating chemotherapy is essential to avoid unwanted side effects. Therefore, the SNP study is important to identify and characterize TOP2A genotype for the development of novel diagnostic and more potent therapeutic techniques. The process of pointing out SNPs associated with major protein structural and functional changes by using molecular techniques is time consuming and expensive [66]. This gives rise to limitations in studying the genotype–phenotype correlation and their status of association with diseases [67]. Thus, the aim of our study was to use computational tools to predict deleterious SNP, which can be used for further molecular studies for better understanding of the damaging impact of SNP on the structural and functional aspects of TOP2A.
We used multiple tools to sequentially screen SNPs with deleterious mutations as a number of research studies have shown that using multiple bioinformatics tools and algorithms improves the prediction of the result [68–70]. Research in the field of in silico analysis has shown that SIFT and PolyPhen have high performance in identifying damaging SNPs [71, 72]. Two SNPs, namely, E922K and Y481C, are considered highly deleterious as they had a high negative DDG values. The protein structure is essential for its properties, and thus its function and stability. Change in even a single nucleotide can alter the structure to a significant extent. Therefore, to obtain a better idea on the impact of SNP on protein function, we carried out the 3D structure prediction and analysis of mutant proteins. The residue at positions 481 and 922 were predicted to be highly conserved by the Hope Project. During protein folding, the non-covalent interactions and long-range interactions between residues oppose the tendencies of the protein to unfold and provide stability. Some of these residues are part of the crucial interactions for protein stabilization and are known as stabilizing residues. The stabilizing residue prediction using SRide predicted 18 stabilizing residues in native, 17 in E922K, and 15 in Y481C. The decrease in the number of stabilizing residues can be directly related to a decrease in the stability of the protein. The hydrogen bond studied by HBAT revealed a decrease in the number of total and strong hydrogen bonds in mutants. Hydrogen bonds in proteins are important for their secondary and tertiary structures. They help in protein folding and stabilization of the protein. Hydrogen bonds also play a role in a protein’s interaction with its environment, binding to protein, ligand, and its function. The decrease in hydrogen bonds can severely reduce stability and alter the structure and catalytic function of the protein. The decrease in the number of stabilizing residues and hydrogen bonds clearly indicates a decrease in protein stability and will impact its functional activity. These predictions are consistent with I-mutant’s prediction of the reduced stability of mutants. A combination of RMSD and radius of gyration reveals reduced fluctuations in the mutant protein. The slight increase in the number of hydrogen bonds in mutants plays a role in the increased inter-molecular interactions and reduced flexibility. The dynamic motion of a protein is essential for its biological function, and any perturbation in it can significantly alter the activity of the protein. The reduced conformational space explored by the mutants, when compared to the native, also signifies a more rigid geometry of the mutant structures. These results are also supported by Gibbs free-energy landscape, which shows an increased thermodynamic stability in the mutants.
SNP can affect the kinetics of interactions or alter binding specificity. Furthermore, an SNP can alter the binding site of the protein, which can in turn affect interactions with partners like proteins, DNA, and ligands [73]. TOP2A-targeting agents comprise a class of the most active clinical molecules for cancer therapy. They block the catalytic cycle of TOP2A after DNA is cleaved but before it is ligated to form double-stranded DNA breaks [74]. Therefore, they cause cellular DNA damage and inhibit DNA metabolism including replication and transcription, and ultimately kill the cell [75]. Etoposide is a podophyllotoxin derivative and one of the most prescribed TOP2A inhibitors [76]. It is approved by the FDA for the treatment of malignancies, including testicular cancer, small lung cancer, and ovarian cancer in combination with other drugs. It is suggested that the protein–drug interaction plays a crucial role in trapping TOP2A in the enzyme: DNA complex [77, 78]. The altered forms of topoisomerase are found in cancer cell lines resistant to TOP2A-targeting drugs [21, 79]. Therefore, to predict the effects of mutation on drugs and TOP2A binding, we carried out protein–drug docking using AutoDock. The native protein–drug complex had the lowest binding energy of −7.99 kcal/mol and the lowest inhibition constant of 1.38 μM. This indicates that etoposide has the highest binding affinity for the native protein and inhibits it more than the mutants. The decrease in binding affinity with TOP2A has been shown to be a cause of drug resistance [80]. Etoposide may show reduced cytotoxicity toward cancer cell with TOP2A mutants E922K and Y481C. However, the marginal decrease in drug-binding affinity with the mutants using in silico docking cannot be concluded as drug resistance in mutants. Further studies need to be done in this regard to say anything conclusively.
Proteins are dynamic in nature and change their conformations continuously; this dynamics of the protein is essential for its function [81, 82]. At a particular time, proteins take up a conformation that lies on the minimum energy value on its free-energy landscape. The energy fluctuation from one minimum to another in the protein leads to changes in its structural conformations and functional characteristics. The amino acid sequence and intra-molecular and inter-molecule interaction of protein determine these fluctuations. Thus, SNPs can alter the protein dynamics significantly. To study these alterations, molecular dynamics simulation is a widely used and reliable approach [83, 84]. MD simulations provide a detailed insight into protein dynamics at spatial and temporal scales that are otherwise difficult to be accessed. Overall, the molecular dynamics analysis reveals a reduced motion, increased flexibility, and stability in the mutated variants of the protein. qRT-PCR is considered one of the most efficient techniques to quantify gene expression. Our study result shows the variation in gene expression between TOP2A and normalized beta-actin. The relative higher mRNA expression level of TOP2A is 3.91, and this confirms that TOP2A is upregulated. Furthermore, the relative expression and fold-change analysis performed in the ovarian adenocarcinoma cell reveal that in biological systems, even small variations can severely impact a genes’ expression and protein function. In addition, the relative expression and fold-change analysis performed in the ovarian adenocarcinoma cell reveal that there is three-fold increase in the expression of the TOP2A gene, which reveals that in biological systems, even small variations can severely impact genes’ expression and protein function [85]. This analysis strengthens our results and predicts that mutants Y481C and E922K are deleterious SNPs. Therefore, to summarize our studies, SNPs Y481C and E922K of the TOP2A protein have a structural and functional impact on the protein. These mutations may lead to a pathogenic phenotype and may also be a cause of the development of cancer.
5 Conclusion
Our study aimed at screening the most deleterious SNP using bioinformatics tools. By using an array of different tools, we predicted mutants Y481C and E922K to be highly damaging variants of TOP2A. Although mutants Y481C and E922K were predicted to have small variations from the native protein using structural attribute studies, they were predicted to be highly deleterious using the structure- and sequence-based tools and molecular dynamics simulation using GROMACS. This study sets the basis of mutational analysis in TOP2A and paves way for further studies, development of personalized medicine, and overcoming resistance to cancer therapy.
Data availability statement
The datasets presented in this study can be found in online repositories. The names of the repository/repositories and accession number(s) can be found in the manuscript/Supplementary Material.
Author contributions
KK: data curation, formal analysis, investigation, methodology, software, validation, visualization, and writing–original draft. MA: conceptualization, project administration, resources, supervision, and writing–review and editing.
Funding
The authors declare that financial support was received for the research, authorship, and/or publication of this article. The authors acknowledge Vellore Institute of Technology, Vellore, India for providing fund for the publishing this article as open access.
Acknowledgments
The authors thank the management of Vellore Institute of Technology (deemed to be a University) for providing the facilities and “VIT SEED GRANT” for carrying out this research work.
Conflict of interest
The authors declare that the research was conducted in the absence of any commercial or financial relationships that could be construed as a potential conflict of interest.
Publisher’s note
All claims expressed in this article are solely those of the authors and do not necessarily represent those of their affiliated organizations, or those of the publisher, the editors, and the reviewers. Any product that may be evaluated in this article, or claim that may be made by its manufacturer, is not guaranteed or endorsed by the publisher.
Abbreviations
dbSNP, single-nucleotide polymorphism database; DDG, free-energy change value; DNA, deoxyribonucleic acid; ED, essential dynamics; GROMACS, GROningen MAchine for Chemical Simulations; HBAT, hydrogen-bond analysis tool; MD, molecular dynamic; mRNA, messenger RNA; NCBI, The National Center for Biotechnology Information; OC, ovarian cancer; PCA, principal component analysis; PDB, Protein Data Bank; PolyPhen-2, Polymorphism Phenotyping v2; qRTPCR, quantitative reverse transcription polymerase chain reaction; RMSD, root mean square deviation; RNA, ribonucleic acid; SD, standard deviation; SDF, structured data format; SIFT, sorting intolerant from tolerant; SNP, single-nucleotide polymorphism; TOP2A, type IIA topoisomerase; VIT, Vellore Institute of Technology.
References
1. Torre LA, Bray F, Siegel RL, Ferlay J, Lortet-Tieulent J, Jemal A. Global cancer statistics, 2012. CA Cancer J Clin (2015) 65(2):87–108. doi:10.3322/caac.21262
2. Holschneider CH, Berek JS. Ovarian cancer: epidemiology, biology, and prognostic factors. Semin Surg Oncol (2000) 19(1):3–10. doi:10.1002/1098-2388(200007/08)19:1<3::aid-ssu2>3.0.co;2-s
3. Torre LA, Trabert B, DeSantis CE, Miller KD, Samimi G, Runowicz CD, et al. Ovarian cancer statistics, 2018. CA Cancer J Clin (2018) 68(4):284–96. doi:10.3322/caac.21456
4. Ovarian cancer survival rates: Ovarian cancer prognosis. Ovarian cancer survival rates. Ovarian cancer prognosis. American Cancer Society (2023).
5. Helleman J, Jansen MPHM, Span PN, van Staveren IL, Massuger LFAG, Meijer-van Gelder ME, et al. Molecular profiling of platinum resistant ovarian cancer: nine-Gene Set for Platinum Resistance. Int J Cancer (2006) 118(8):1963–71. doi:10.1002/ijc.21599
6. Stone B, Schummer M, Paley PJ, Thompson L, Stewart J, Ford M, et al. Serologic analysis of ovarian tumor antigens reveals a bias toward antigens encoded on 17q. Int J Cancer (2003) 104(1):73–84. doi:10.1002/ijc.10900
7. Wang X, Wang J, Lyu L, Gao X, Cai Y, Tang B. Oncogenic role and potential regulatory mechanism of topoisomerase IIα in a pan-cancer analysis. Sci Rep (2022) 12:11161. doi:10.1038/s41598-022-15205-7
8. Erriquez J, Becco P, Olivero M, Ponzone R, Maggiorotto F, Ferrero A, et al. TOP2A gene copy gain predicts response of epithelial ovarian cancers to pegylated liposomal doxorubicin. Gynecol Oncol (2015) 138(3):627–33. doi:10.1016/j.ygyno.2015.06.025
9. Faggad A, Darb-Esfahani S, Wirtz R, Sinn B, Sehouli J, Könsgen D, et al. Topoisomerase IIα mRNA and protein expression in ovarian carcinoma: correlation with clinicopathological factors and prognosis. Mod Pathol (2009) 22(4):579–88. doi:10.1038/modpathol.2009.14
10. Ferrandina G, Petrillo M, Carbone A, Zannoni G, Martinelli E, Prisco M, et al. Prognostic role of topoisomerase-IIα in advanced ovarian cancer patients. Br J Cancer (2008) 98(12):1910–5. doi:10.1038/sj.bjc.6604410
11. Sherman-Baust CA, Kuhn E, Valle BL, Shih I-M, Kurman RJ, Wang T-L, et al. A genetically engineered ovarian cancer mouse model based on fallopian tube transformation mimics human high-grade serous carcinoma development. J Pathol (2014) 233(3):228–37. doi:10.1002/path.4353
12. Tsai-Pflugfelder M, Liu LF, Liu AA, Tewey KM, Whang-Peng J, Knutsen T, et al. Cloning and sequencing of cDNA encoding human DNA topoisomerase II and localization of the gene to chromosome region 17q21-22. Proc Natl Acad Sci USA (1988) 85(19):7177–81. doi:10.1073/pnas.85.19.7177
13. Dougherty AC, Hawaz MG, Hoang KG, Trac J, Keck JM, Ayes C, et al. Exploration of the role of the C-terminal domain of human DNA topoisomerase IIα in catalytic activity. ACS Omega (2021) 6(40):25892–903. doi:10.1021/acsomega.1c02083
14. Deweese JE, Burch AM, Burgin AB, Osheroff N. Use of divalent metal ions in the DNA cleavage reaction of human type II topoisomerases. Biochemistry (2009) 48(9):1862–9. doi:10.1021/bi8023256
15. Deweese JE, Guengerich FP, Burgin AB, Osheroff N. Metal ion interactions in the DNA cleavage/ligation active site of human topoisomerase IIα. Biochemistry (2009) 48(38):8940–7. doi:10.1021/bi900875c
16. Wendorff TJ, Schmidt BH, Heslop P, Austin CA, Berger JM. The structure of DNA-bound human topoisomerase II alpha: conformational mechanisms for coordinating inter-subunit interactions with DNA cleavage. J Mol Biol (2012) 424(3–4):109–24. doi:10.1016/j.jmb.2012.07.014
17. Zhou K. RNA helicase A interacts with dsDNA and topoisomerase IIalpha. Nucleic Acids Res (2003) 31(9):2253–60. doi:10.1093/nar/gkg328
18. Williamson EA, Rasila KK, Corwin LK, Wray J, Beck BD, Severns V, et al. The SET and transposase domain protein Metnase enhances chromosome decatenation: regulation by automethylation. Nucleic Acids Res (2008) 36(18):5822–31. doi:10.1093/nar/gkn560
19. Lee S, Jung S-R, Heo K, Byl JAW, Deweese JE, Osheroff N, et al. DNA cleavage and opening reactions of human topoisomerase IIα are regulated via Mg 2+ -mediated dynamic bending of gate-DNA. Proc Natl Acad Sci U S A (2012) 109(8):2925–30. doi:10.1073/pnas.1115704109
20. Ramamoorthy M, Tadokoro T, Rybanska I, Ghosh AK, Wersto R, May A, et al. RECQL5 cooperates with Topoisomerase II alpha in DNA decatenation and cell cycle progression. Nucleic Acids Res (2012) 40(4):1621–35. doi:10.1093/nar/gkr844
21. Hande KR. Topoisomerase II inhibitors. Update Cancer Ther (2008) 3(1):13–26. doi:10.1016/j.uct.2008.02.001
22. Chan VTW, Ng S-W, Eder JP, Schnipper LE. Molecular cloning and identification of a point mutation in the topoisomerase II cDNA from an etoposide resistant Chinese hamster ovary cell line. J Biol Chem (1993) 268:2160–5. doi:10.1016/s0021-9258(18)53976-4
23. Hinds M, Deisseroth K, Mayes J, Altschuler E, Jansen R, Ledley FD, et al. Identification of a point mutation in the topoisomerase II gene from a human leukemia cell line containing an amsacrine-resistant form of topoisomerase II. Cancer Res (1991) 51(17):4729–31.
24. Lee M-S, Wang JC, Beran M. Two independent amsacrine-resistant human myeloid leukemia cell lines share an identical point mutation in the 170 kDa form of human topoisomerase II. J Mol Biol (1992) 223(4):837–43. doi:10.1016/0022-2836(92)90245-f
25. Matsumoto Y, Takano H, Kunishio K, Nagao S, Fojo T. Incidence of mutation and deletion in topoisomerase IIα mRNA of etoposide and mAMSA–resistant cell lines. Jpn J Cancer Res (2001) 92(10):1133–7. doi:10.1111/j.1349-7006.2001.tb01069.x
26. Vassetzky YS, Alghisi G-C, Gasser SM. DNA topoisomerase II mutations and resistance to anti-tumor drugs. Bioessays (1995) 17(9):767–74. doi:10.1002/bies.950170906
27. Drazen JM, Yandava CN, Dubé L, Szczerback N, Hippensteel R, Pillari A, et al. Pharmacogenetic association between ALOX5 promoter genotype and the response to anti-asthma treatment. Nat Genet (1999) 22(2):168–70. doi:10.1038/9680
28. Carninci P, Kasukawa T, Katayama S, Gough J, Frith MC, Maeda N, et al. The transcriptional landscape of the mammalian genome. Science (2005) 309(5740):1559–63. doi:10.1126/science.1112014
29. Liu J, Gough J, Rost B. Distinguishing protein-coding from non-coding RNAs through support vector machines. Plos Genet (2006) 2(4):e29. doi:10.1371/journal.pgen.0020029
30. Sherry ST. dbSNP: the NCBI database of genetic variation. Nucleic Acids Res (2001) 29(1):308–11. doi:10.1093/nar/29.1.308
31. Ng PC, Henikoff S. Predicting deleterious amino acid substitutions. Genome Res (2001) 11(5):863–74. doi:10.1101/gr.176601
32. Ng PC, Henikoff S. Accounting for human polymorphisms predicted to affect protein function. Genome Res (2002) 12(3):436–46. doi:10.1101/gr.212802
33. Ng PC. SIFT: predicting amino acid changes that affect protein function. Nucleic Acids Res (2003) 31(13):3812–4. doi:10.1093/nar/gkg509
34. Ng PC, Henikoff S. Predicting the effects of amino acid substitutions on protein function. Annu Rev Genomics Hum Genet (2006) 7(1):61–80. doi:10.1146/annurev.genom.7.080505.115630
35. Adzhubei IA, Schmidt S, Peshkin L, Ramensky VE, Gerasimova A, Bork P, et al. A method and server for predicting damaging missense mutations. Nat Methods (2010) 7(4):248–9. doi:10.1038/nmeth0410-248
36. Adzhubei I, Jordan DM, Sunyaev SR. Predicting functional effect of human missense mutations using PolyPhen-2. Curr Protoc Hum Genet (2013) 76(1):Unit7.20. doi:10.1002/0471142905.hg0720s76
37. Bromberg Y, Overton J, Vaisse C, Leibel RL, Rost B. In silico mutagenesis: a case study of the melanocortin 4 receptor. FASEB J (2009) 23(9):3059–69. doi:10.1096/fj.08-127530
38. Hecht M, Bromberg Y, Rost B. News from the protein mutability landscape. J Mol Biol (2013) 425(21):3937–48. doi:10.1016/j.jmb.2013.07.028
39. Yachdav G, Hecht M, Pasmanik-Chor M, Yeheskel A, Rost B. HeatMapViewer: interactive display of 2D data in biology. F1000Res (2014) 3:48. doi:10.12688/f1000research.3-48.v1
40. Calabrese R, Capriotti E, Fariselli P, Martelli PL, Casadio R. Functional annotations improve the predictive score of human disease-related mutations in proteins. Hum Mutat (2009) 30(8):1237–44. doi:10.1002/humu.21047
41. Capriotti E, Fariselli P, Rossi I, Casadio R. A three-state prediction of single point mutations on protein stability changes. BMC Bioinformatics (2008) 9(S2):S6. doi:10.1186/1471-2105-9-s2-s6
42. Capriotti E, Fariselli P, Casadio R. I-Mutant 2.0: predicting stability changes upon mutation from the protein sequence or structure. Nucleic Acids Res (2005) 33(Web Server):W306–10. doi:10.1093/nar/gki375
43. Laskowski RA, MacArthur MW, Moss DS, Thornton JM. PROCHECK: a program to check the stereochemical quality of protein structures. J Appl Crystallogr (1993) 26(2):283–91. doi:10.1107/s0021889892009944
44. Laskowski R, Rullmann JA, MacArthur M, Kaptein R, Thornton J. AQUA and PROCHECK-NMR: programs for checking the quality of protein structures solved by NMR. J Biomol NMR (1996) 8(4):477–86. doi:10.1007/bf00228148
45. Waterhouse A, Bertoni M, Bienert S, Studer G, Tauriello G, Gumienny R, et al. SWISS-MODEL: homology modelling of protein structures and complexes. Nucleic Acids Res (2018) 46(W1):W296–303. doi:10.1093/nar/gky427
46. Lindahl E, Azuara C, Koehl P, Delarue M. NOMAD-Ref: visualization, deformation and refinement of macromolecular structures based on all-atom normal mode analysis. Nucleic Acids Res (2006) 34:W52–6. doi:10.1093/nar/gkl082
47. Venselaar H, te Beek TAH, Kuipers RKP, Hekkelman ML, Vriend G. Protein structure analysis of mutations causing inheritable diseases. An e-Science approach with life scientist friendly interfaces. BMC Bioinformatics (2010) 11(1):548. doi:10.1186/1471-2105-11-548
48. Porollo A, Meller J. Prediction-based fingerprints of protein–protein interactions. Proteins (2007) 66(3):630–45. doi:10.1002/prot.21248
49. Magyar C, Gromiha MM, Pujadas G, Tusnady GE, Simon I. SRide: a server for identifying stabilizing residues in proteins. Nucleic Acids Res (2005) 33:W303–5. doi:10.1093/nar/gki409
50. Tiwari A, Panigrahi SK. HBAT: a complete package for analysing strong and weak hydrogen bonds in macromolecular crystal structures. Silico Biol (2007) 7(6):651–61.
51. Hess B, Kutzner C, van der Spoel D, Lindahl E. GROMACS 4: algorithms for highly efficient, load-balanced, and scalable molecular simulation. J Chem Theor Comput (2008) 4(3):435–47. doi:10.1021/ct700301q
52. Jorgensen WL, Tirado-Rives J. The OPLS [optimized potentials for liquid simulations] potential functions for proteins, energy minimizations for crystals of cyclic peptides and crambin. J Am Chem Soc (1988) 110(6):1657–66. doi:10.1021/ja00214a001
53. Balsera MA, Wriggers W, Oono Y, Schulten K. Principal component analysis and longtime protein dynamics. J Phys Chem (1996) 100(7):2567–72. doi:10.1021/jp9536920
54. Berendsen H. Collective protein dynamics in relation to function. Curr Opin Struct Biol (2000) 10(2):165–9. doi:10.1016/s0959-440x(00)00061-0
55. Morris GM, Goodsell DS, Halliday RS, Huey R, Hart WE, Belew RK, et al. Automated docking using a Lamarckian genetic algorithm and an empirical binding free energy function. J Comput Chem (1998) 19(14):1639–62. doi:10.1002/(sici)1096-987x(19981115)19:14<1639::aid-jcc10>3.0.co;2-b
57. Meng H, Chen R, Li W, Xu L, Xu L. Correlations of TOP2A gene aberrations and expression of topoisomerase IIα protein and TOP2A mRNA expression in primary breast cancer: a retrospective study of 86 cases using fluorescence in situ hybridization and immunohistochemistry. Pathol Int (2012) 62(6):391–9. doi:10.1111/j.1440-1827.2012.02808.x
58. Mueller RE, Parkes RK, Andrulis I, O’Malley FP. Amplification of the TOP2A gene does not predict high levels of topoisomerase II alpha protein in human breast tumor samples. Genes Chromosomes Cancer (2004) 39(4):288–97. doi:10.1002/gcc.20008
59. Washiro M, Ohtsuka M, Kimura F, Shimizu H, Yoshidome H, Sugimoto T, et al. Upregulation of topoisomerase IIα expression in advanced gallbladder carcinoma: a potential chemotherapeutic target. J Cancer Res Clin Oncol (2008) 134(7):793–801. doi:10.1007/s00432-007-0348-0
60. Hellemans P, van Dam PA, Geyskens M, van Oosterom AT, Buytaert P, Van Marck E. Immunohistochemical study of topoisomerase II-alpha expression in primary ductal carcinoma of the breast. J Clin Pathol (1995) 48(2):147–50. doi:10.1136/jcp.48.2.147
61. Simon R, Atefy R, Wagner U, Forster T, Fijan A, Bruderer J, et al. HER-2 and TOP2A coamplification in urinary bladder cancer. Int J Cancer (2003) 107(5):764–72. doi:10.1002/ijc.11477
62. Withoff S, de Vries EG, Keith WN, Nienhuis EF, van der Graaf WT, Uges DR, et al. Differential expression of DNA topoisomerase II alpha and -beta in P-gp and MRP-negative VM26, mAMSA and mitoxantrone-resistant sublines of the human SCLC cell line GLC4. Br J Cancer (1996) 74(12):1869–76. doi:10.1038/bjc.1996.647
63. van der Zee AGJ, de Vries EGE, Hollema H, Kaye SB, Brown R, Keith WN. Molecular analysis of the topoisomerase II α gene and its expression in human ovarian cancer. Ann Oncol (1994) 5(1):75–81. doi:10.1093/oxfordjournals.annonc.a058700
64. Popęda M, Płuciennik E, Bednarek AK. Proteins in cancer multidrug resistance. Postepy Hig Med Dosw (2014) 68:616–32. doi:10.5604/17322693.1103268
65. Zhang B, Liu M, Tang H-K, Ma H-B, Wang C, Chen X, et al. The expression and significance of MRP1, LRP, TOPOIIβ, and BCL2 in tongue squamous cell carcinoma. J Oral Pathol Med (2012) 41(2):141–8. doi:10.1111/j.1600-0714.2011.01066.x
66. Pendleton M, Lindsey RH, Felix CA, Grimwade D, Osheroff N. Topoisomerase II and leukemia. Ann N Y Acad Sci (2014) 1310(1):98–110. doi:10.1111/nyas.12358
67. Chen X, Sullivan PF. Single nucleotide polymorphism genotyping: biochemistry, protocol, cost and throughput. Pharmacogenomics J (2003) 3(2):77–96. doi:10.1038/sj.tpj.6500167
68. Kumar A, Rajendran V, Sethumadhavan R, Shukla P, Tiwari S, Purohit R. Computational SNP analysis: current approaches and future prospects. Cell Biochem Biophys (2014) 68(2):233–9. doi:10.1007/s12013-013-9705-6
69. Khan I, Ansari IA, Singh P, Dass JFP. Prediction of functionally significant single nucleotide polymorphisms in PTEN tumor suppressor gene: an in silico approach. Biotechnol Appl Biochem (2017) 64(5):657–66. doi:10.1002/bab.1483
70. Sai Ramesh A, Khan I, Farhan M, Thiagarajan P. Profiling deleterious non-synonymous SNPs of smoker’s gene CYP1A1. Cel Biochem Biophys (2013) 67(3):1391–6. doi:10.1007/s12013-013-9671-z
71. Sai Ramesh A, Sethumadhavan R, Thiagarajan P. Structure–function studies on non-synonymous SNPs of chemokine receptor gene implicated in cardiovascular disease: a computational approach. Protein J (2013) 32(8):657–65. doi:10.1007/s10930-013-9529-7
72. Hicks S, Wheeler DA, Plon SE, Kimmel M. Prediction of missense mutation functionality depends on both the algorithm and sequence alignment employed. Hum Mutat (2011) 32(6):661–8. doi:10.1002/humu.21490
73. Bhattacharya R, Rose PW, Burley SK, Prlić A. Impact of genetic variation on three dimensional structure and function of proteins. PLoS ONE (2017) 12(3):e0171355. doi:10.1371/journal.pone.0171355
74. Mohamadi Farsani F, Vallian S, Ganjalikhanv MR, Pourmoshir N. Characterization of Novel non-Synonymous genomic variants altering drug response of DNA topoisomerase II alpha. Int J Cancer Manag (2019) 12(4):e66993. doi:10.5812/ijcm.66993
75. Thusberg J, Vihinen M. Pathogenic or not? And if so, then how? Studying the effects of missense mutations using bioinformatics methods. Hum Mutat (2009) 30(5):703–14. doi:10.1002/humu.20938
76. Burden DA, Osheroff N. Mechanism of action of eukaryotic topoisomerase II and drugs targeted to the enzyme. Biochim Biophys Acta Gene Struct Expr (1998) 1400(1–3):139–54. doi:10.1016/s0167-4781(98)00132-8
77. Hande KR. Etoposide: four decades of development of a topoisomerase II inhibitor. Eur J Cancer (1998) 34(10):1514–21. doi:10.1016/s0959-8049(98)00228-7
78. Bender RP, Jablonksy MJ, Shadid M, Romaine I, Dunlap N, Anklin C, et al. Substituents on etoposide that interact with human topoisomerase IIα in the binary Enzyme−Drug complex: contributions to etoposide binding and activity. Biochemistry (2008) 47(15):4501–9. doi:10.1021/bi702019z
79. Wilstermann AM, Bender RP, Godfrey M, Choi S, Anklin C, Berkowitz DB, et al. Topoisomerase II−Drug interaction domains: identification of substituents on etoposide that interact with the enzyme. Biochemistry (2007) 46(28):8217–25. doi:10.1021/bi700272u
80. Sullivan DM, Latham MD, Rowe TC, Ross WE. Purification and characterization of an altered topoisomerase II from a drug-resistant Chinese hamster ovary cell line. Biochemistry (1989) 28(13):5680–7. doi:10.1021/bi00439a051
81. Kingma PS, Burden DA, Osheroff N. Binding of etoposide to topoisomerase II in the absence of DNA: decreased affinity as a mechanism of drug resistance. Biochemistry (1999) 38(12):3457–61. doi:10.1021/bi982855i
82. Bu Z, Callaway DJE. Proteins MOVE! Protein dynamics and long-range allostery in cell signaling. In: Protein structure and diseases. Elsevier (2011). p. 163–221.
83. Henzler-Wildman K, Kern D. Dynamic personalities of proteins. Nature (2007) 450(7172):964–72. doi:10.1038/nature06522
84. George Priya Doss C, Rajith B, Magesh R, Ashish Kumar A. Influence of the SNPs on the structural stability of CBS protein: insight from molecular dynamics simulations. Front Biol (2014) 9(6):504–18. doi:10.1007/s11515-014-1320-4
Keywords: mutations, molecular dynamics simulation, non-synonymous single-nucleotide polymorphism, principle component analysis, topoisomerase 2-alpha
Citation: Kavitha K and Mohanapriya A (2024) Insights into the structure–function relationship of missense mutations in the human TOP2A protein in ovarian cancer. Front. Phys. 12:1358406. doi: 10.3389/fphy.2024.1358406
Received: 19 December 2023; Accepted: 27 February 2024;
Published: 28 March 2024.
Edited by:
Andrzej Stasiak, Université de Lausanne, SwitzerlandReviewed by:
Nighat Noureen, Texas Tech University Health Sciences Center, United StatesMd Arju Hossain, Student Pugwash USA, United States
Copyright © 2024 Kavitha and Mohanapriya. This is an open-access article distributed under the terms of the Creative Commons Attribution License (CC BY). The use, distribution or reproduction in other forums is permitted, provided the original author(s) and the copyright owner(s) are credited and that the original publication in this journal is cited, in accordance with accepted academic practice. No use, distribution or reproduction is permitted which does not comply with these terms.
*Correspondence: Arumugam Mohanapriya, mohanapriyaa@vit.ac.in