Nanometer refractive index sensor based on water droplet cavity structure with rectangular short rod
 Jin Wang1,2,3
  Shubin Yan2,3* Feng Liu1,2,3 Shuwen Chang1,2,3 Yuhao Cao1,2,3 Yang Cui2,3 Jilai Liu2,3 Yi Zhang2,3 Yifeng Ren1
- 1School of Electrical and Control Engineering, North University of China, Taiyuan, China
- 2School of Electrical Engineering, Zhejiang University of Water Resources and Electric Power, Hangzhou, China
- 3Joint Laboratory of Intelligent Equipment and System for Water Conservancy and Hydropower Safety Monitoring of Zhejiang Province and Belarus, Hangzhou, China
In this paper, a novel nano sensor structure is proposed, which consists of a metal-insulator-metal waveguide (MIM) with rectangular baffles and a water droplet cavity with rectangular stubs (WDCRS). The WDCRS structure optimizes the sensitivity of a single water droplet cavity and makes the transmission curve clearer and smoother. The transmission characteristics of WDCRS structure were simulated using finite element method (FEM). The transmission characteristics of the exported structure were analyzed in detail. In addition, the influence of structural geometric parameters on sensing performance was also studied, and it was found that the size of the water droplet cavity is a key factor in improving sensitivity. When applied to a refractive index sensor, the structure achieves a sensitivity of up to 2,300 nm/RIU with a corresponding figure of merit (FOM) of 60.5. These works provide some ideas for the design of high-performance nanostructures and multiple Fano resonance excitation structures.
1 Introduction
Nowadays, communication technology using light as a carrier shows tremendous potential. Photonic device has faster speed, stronger stability and lower energy consumption compared with electron device. So, it is inevitable that the photonic device become a research hotspot. Surface plasmon polaritons (SPPs) are electromagnetic waves, which are generated by the interference of incident photos and free electrons on metal [1–3]. Because SPPs can overcome the diffraction limit, it can control the photons in the nanoscale [4–6]. There are many carriers of SPPs, such as hybrid Bragg waveguides, Metal slots, plasma nanoclusters, Metal films, metal-media-metal (MIM) and so on. Among them, metal-insulator-metal (MIM) waveguides are regarded as one of the comparatively preferred waveguide in the integrated optical device because of its excellent properties in easy fabrication and strong local enhancement.
A host of researchers designed nanoscale structure based on MIM waveguide, which are applied in optical switches [7, 8], beam splitters [9, 10], filters [11–13], slow-light device [14–18] and nano sensors [19–22]. Thereinto, the research of nano sensor accounts for the majority, mainly focusing on the research and development of refractive index sensor. Common refractive index sensors include photonic crystal sensors and optical fiber sensors. These sensors have been developed for a long time and are comparatively mature. However, these sensors also have many disadvantages, most notably the difficulty in miniaturizing device size. This is seriously inconsistent with the future development direction of integrated optical devices. Compared with common optical sensors, the new device based on SPPs has obvious advantages in simple structure, easy integration, small size and easy machining. It will play an important role in the development of optical device integration and on-chip optical integrated devices. Therefore, many works about the nanostructure of MIM waveguide coupled with resonator are investigated in recent years. In 2015, Zhang et al. [19] designed a nanostructure, consisting of MIM waveguide and double rectangular cavity, which can reach 596 nm/RIU. Its proposed sensor structure, although less sensitive than nanosensors based on Kretschmann geometry, is easier to integrate with various photonic devices and chips. In 2018, Zafar et al. [20] proposed an ultra-compact plasmonic-based sensor with sensitivity of 1,100 nm/RIU and FOM (figure of merit) of 224, which was comprised of The MIM waveguide and a pair of elliptical resonator. The sensor structure was also applied to the detection of hemoglobin concentration in human blood, due to its high FOM value the structure was designed to provide the sensor with a very high stability. In the same year, Zhang et al. [21] presented a refractive index sensor with rectangular and dual side rings resonators based on MIM waveguide system that can maximally reach 1,160 nm/RIU. This sensor structure can be easily extended to other similar compact structures for detection and integrated with other photonic devices at the chip level. In 2020, Zhu et al. [22] designed a nanostructure with a semicircular resonator and a key-shape resonator, which can reach 1,261.67 nm/RIU. This sensor is used to detect the concentration of glucose solution, and the detection effect is achieved by calculating the frequency shift when the Fano resonance line moves towards a longer wavelength. Tathfif et al. [23] proposed a refractive index sensor structure based on a concentric triple ring resonator with a sensitivity as high as 3,639.79 nm/RIU, where in the refractive index range of 1.30–1.40 showing a maximum sensitivity of 7,530.49 nm/RIU.
In our works, a novel nano sensor structure is proposed, which consists of a waveguide with rectangular baffles and a water droplet cavity with rectangular stubs (WDCRS). The WDCRS structure optimizes the sensitivity of a single water droplet cavity and makes the transmission curve clearer and smoother. The transmission characteristics of WDCRS structure were simulated using finite element method. The transmission characteristics of the exported structure were analyzed in detail. Furthermore, the impact of structural geometric parameters on sensing performance was also investigated. By comprehensively considering these parameters, a Fano resonant and refractive index sensor model with ideal performance is designed, which helps to achieve high sensitivity, precision, and wide dynamic range refractive index measurement applications.
2 Research methods
In this study, we use COMSOL Multiphysics software based on the finite element method to analyze the transmission characteristics of the sensor. The finite element method (FEM) is an algorithm that allows the computation of electromagnetic values. The core of this method is to simplify the complex problem, i.e., to divide the continuous whole into several discrete small units, to form a continuous domain by connecting a finite number of subunits through nodes, and finally to calculate the solution of the original problem by solving the conditions that satisfy the whole continuous domain [24, 25].
In this paper, COMSOL software is used to select ultra-fine triangles as discrete units for the discretization analysis of the WDCRS structure and waveguide region, the finer the discretized subunits are, the closer the final result is to the actual solution, and the other regions are slightly coarsened to ensure that an accurate solution is obtained while space can be saved. Compared with other numerical computation methods, the finite element method is simple, highly accurate, and has a wide range of applications, capable of solving electromagnetic field distributions under different complex problem conditions.
3 Geometry model and computational methods
Figure 1 shows a two-dimensional schematic of the designed structure. The structure consists of a waveguide with rectangular baffles and a water droplet cavity with rectangular stubs (WDCRS). R represents the outer radius of the lower ring of the water droplet type cavity, and the corresponding side length of the upper equilateral triangular ring cavity is 2R. Therefore, changing R can achieve amplification or reduction of the entire droplet shaped cavity. L denotes the length of the rectangular short bar, h and l denote the length and distance of the rectangular baffle on the waveguide, respectively. g is the coupling distance between the waveguide and the WDCRS, and P1 and P2 denote the input and output ports, respectively. Setting the width of the dielectric layer ω to 50 nm effectively restricts only one transmission mode to propagate in the waveguide, maintaining its uniformity and symmetry. It also improves the transmission efficiency and stability of the waveguide and reduces the possibility of mode coupling and interference. The sensor is fabricated by depositing a thin layer of silver on a silicon substrate and then etching the silver film. Specifically, a silver film is deposited on the quartz substrate and then a layer of electronic resist (resist) is spin-coated. Customized shapes on the resist can be produced by electron beam lithography. Then, to obtain the desired pattern, wet etching can be used to remove unwanted mercury. Finally, the resist is removed. However, due to the limitations of nanofabrication technology, the performance of the actual fabricated sensors may differ from the simulation results; however, with the development of nanofabrication technology, this difference will gradually decrease.
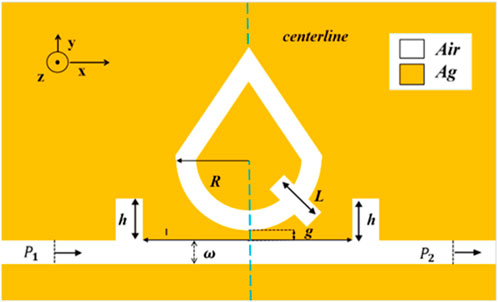
Figure 1. 2D diagram of WDCRS structure.
Resonance would be occurred in this structure when phase-match condition is satisfied. According to the standing wave theory, The resonance wavelength (λr) can be described as in Eq. 1 [26–29]:
In Eq. 1, mode order is m, L is effective length of resonator. In Eq. 2,
To evaluate the sensing performance of the designed structure, two important evaluation indices should be considered, which include the sensitivity (S) and FOM. They can be described as [30]:
In Eq. 5, ∆λ and ∆n are the variation of resonance wavelength and change of refractive indices, respectively. In Eq. 6, FWHM is full width at half maximum of resonant peak.
4 Simulation results and analysis
Firstly, the WDCRS structure is compared with the Water Drop Cavity (WDC) structure to evaluate the influence of the rectangular stub on the whole system. The schematic of WDC structure is shown in Figure 2A. Set the parameters of WDC to the same as those of WDCRS, namely, R = 200 nm, h = 100 nm, l = 500 nm, g = 10 nm. Draw the transmission spectra of the two structures as in Figure 2B. If only a water droplet cavity is used, SPP can only generate localized excitation on the surface of the cavity. Considering only the excitation efficiency of SPP, the structure of a single water droplet cavity is not the optimal choice. After adding a rectangular short rod, the existence of the rectangular short rod can guide the propagation of SPP between the surface of the short rod and the surface of the water droplet cavity, thereby forming stronger localized excitation. The WDCRS structure optimizes the excitation efficiency of SPP, which can improve the sensitivity of detection and sensing. This is reflected in the transmission spectrum of WDCRS and water droplet cavity structure in Figure 2B. In addition, the presence of rectangular short rods can also make the light field uniformly distributed in the water droplet cavity, and this uniform distribution can make the transmission curve show more asymmetric and smooth characteristics, which is conducive to the study of the overall optical properties. It can also be seen from Figure 2B that two troughs appear in the WDCRS structure. According to Eqs 3, 4, different resonant modes will correspond to different trough positions since the relationship between different inclination angles and resonant wavelengths will vary in different resonant modes. Multiple troughs appear in the transmission curves at different resonance modes.
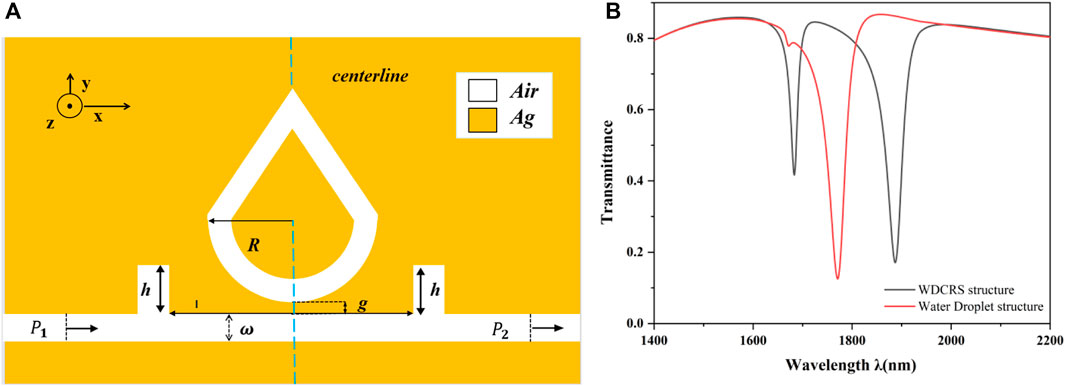
Figure 2. (A) Schematic diagram of WDC structure; (B) Transmission Spectra of WDCRS and WDC Structures.
Based on the above description, analyze the impact of the change in short rod length L on the transmission curve in detail. The transmission spectrum curves of rectangular short rods with lengths of 130 nm, 140 nm, 150 nm, 160 nm, and 170 nm, with other parameters unchanged, are plotted as shown in Figure 3A. From Figure 3A, it can be seen that the transmittance hardly changes as L increases, and the transmission spectral line is slightly red-shifted, which is due to the fact that the increase of L makes the distance between the rectangular short bar and the waveguide decrease, and the convergence to the magnetic field increases, resulting in the shift of the wave peak to a larger wavelength. This is because the length of the rectangular short rod affects the resonance condition of SPP, and a shorter short rod length causes the resonance frequency of SPP to shift towards a higher frequency (lower wavelength) direction. The length of a rectangular short rod has little effect on transmittance. In addition to this, the introduction of short rods may lead to additional mode coupling effects, but since the length of the short rods is much smaller than the wavelength of light, its optical properties are only affected by the optical modes of the SPP. In this case, although changes in the length of the short rod can affect the resonance conditions and intensity of SPP, most of the light is reflected, absorbed, or scattered by the short rod, so the change in transmittance is not very significant. Linear fitting was performed for different short rod lengths L to obtain different sensitivities, as shown in Figure 3B. It can be seen that the slope gradually increases when the short bar length is gradually increased from 130 nm to 170 nm, i.e., the sensor is more sensitive to the change of the short bar length and the sensitivity increases with the increase of the short bar length. In practical applications, the most suitable short stick length can be selected to meet specific needs.
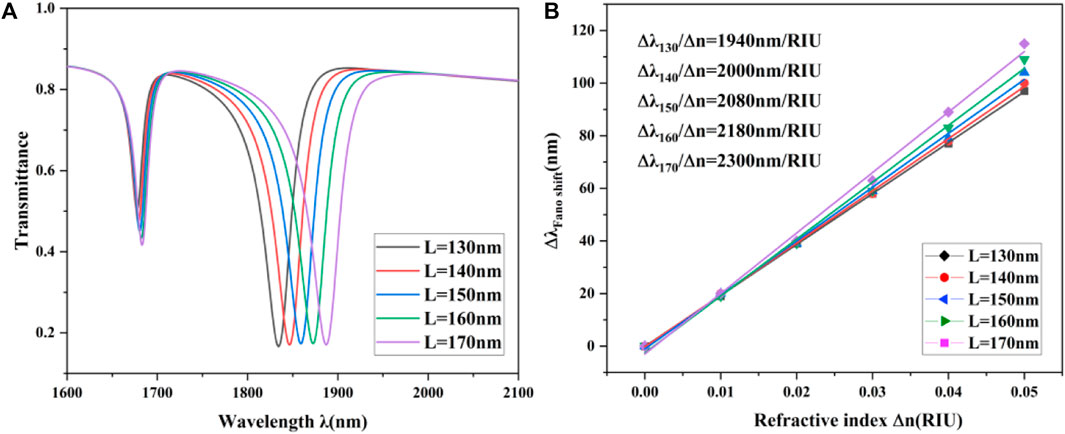
Figure 3. (A) Transmission spectra at different L; (B) Sensitivity fitted straight line with different L.
Adding two rectangular piles to the MIM waveguide can change the transmission characteristics of the waveguide and enhance the generation of resonance effects. Figures 4A, B show the schematic diagrams of the electric field with the addition of the rectangular baffle as well as without the rectangular baffle, respectively. It can be seen that when two rectangular baffles are added to the bus waveguide, the propagation of SPPs in the bus waveguide is hindered, and a magnetic field enhancement region is formed between the two rectangular baffles, which plays a role of converging magnetic fields. The waveguide can better couple the WDCRS structurel in the magnetic field enhancement region, enhance the coupling strength, and provide better performance for the sensor.
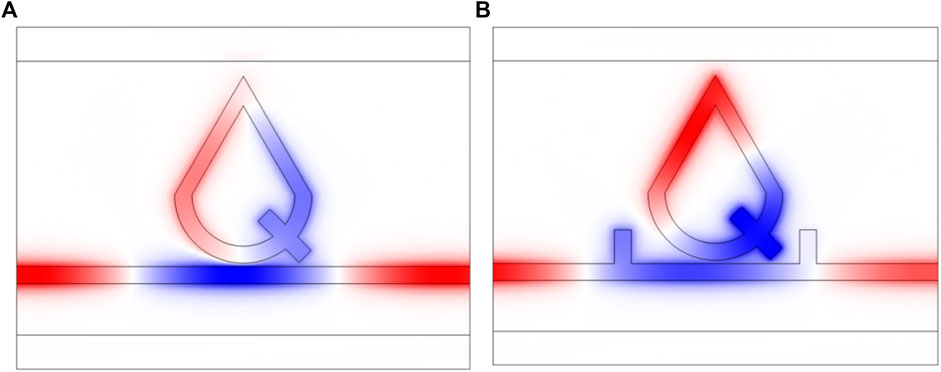
Figure 4. (A) Unadded rectangular baffle electric field diagram; (B) Add rectangular baffle electric field diagram.
By reasonably designing and controlling the size and position of rectangular piles, the regulation and optimization of resonance effects can be achieved. Change the length h and distance l of the rectangular pile to observe its impact. Draw the transmission spectrum curves of only changing h and only changing l, as shown in Figures 5A, B. It can be found that the spacing l between the rectangular baffles has almost no effect on the line shape of the Fano resonance, as well as on the wavelength and transmittance of the trough. While the height h of the rectangular baffle increases the asymmetry of the Fano resonance curve although it also does not affect the wavelength and transmittance of the wave valley, which is conducive to the improvement of the dynamic performance of the sensor, but too large an asymmetry will make the sensor less stable, so the appropriate height h of the rectangular baffle should be selected according to the need.
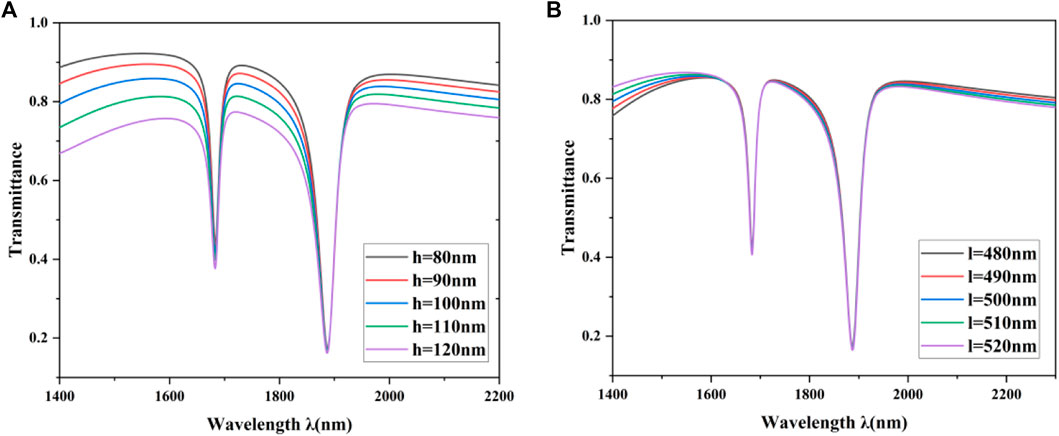
Figure 5. (A) Transmittance spectrums at different h; (B) Transmittance spectrums at different l.
However, as shown in Figure 5A, a change in the length h of the rectangular pile can make the Fano resonance curve more asymmetric. This asymmetry is caused by the introduction of additional resonance states by the rectangular pile that interfere with the continuous states. When the rectangular piles are large in size, multiple resonance states are introduced which interact with the continuum states in the waveguide. This interaction causes the resonance peaks to show asymmetrical features on the spectrogram. The frequencies and intensities of these resonance states vary with the length h of the rectangular pile, resulting in an asymmetric distribution of the intensities and widths of the resonance peaks in the transmission spectrum, with the resonance peaks growing with steeper slopes than decreasing slopes, thus making the Fano resonance curves more asymmetric. In practical applications, the size of the rectangular pile can be adjusted to make the position and shape of the Fano resonance peak more suitable for a specific sensor response curve, thereby improving the sensitivity and selectivity of the sensor.
Next, the effect of the change in R on the transmission curve is analyzed. By changing R, change the size of the water droplet chamber. As R increases from 160 nm to 200 nm, the entire water droplet cavity will achieve equal amplification, and its effective length will also increase accordingly. According to Formula 1, an increase in effective length will cause a redshift in the curve. This has been well verified in the transmission curves under different R conditions in Figure 6A. When the radius is 160 nm, there are multiple peaks in the curve, with the main peak located near 1,539 nm. When the parameter R is gradually increased in 10 nm intervals, the transmission spectrum undergoes a large redshift while the transmittance increases, which implies that the coupling strength between the WDCRS structure and the waveguide is weakened. Since the transmittance at point b has been at a higher position, only the effect of the parameter R change on the sensitivity at point a has been analyzed, and Figure 6B shows the sensitivity fitting line corresponding to the change of R. It can be seen that the sensitivity of the sensor is substantially increased with the increase of R. This suggests that although an increase in R may lead to a weakening of the coupling strength, the sensitivity enhancement of the sensor is significant. The reason for this change is that when the size of the water droplet type cavity is small, the propagation path of light inside the cavity is relatively short due to size limitations. As the size of the cavity increases, the propagation path of light inside the cavity becomes longer, and more light interacts with the interface inside the cavity, resulting in a more sensitive transmittance to changes in cavity size. It should be noted that here the parameter R becomes larger will also affect the cavity area of the tip cone part in the water droplet cavity, because the tip cone part is a straight waveguide, which is conducive to the propagation of light, and the increase in the tip cone area will lead to a more regionalized area of the magnetic field at the tip, and this regionalized strong magnetic field can enhance the interaction between light and the medium, which can serve to improve the sensitivity of the sensor. In addition, the increase in cavity size causes changes in the excitation and propagation paths of the SPP modes at the metal-dielectric interface, and the presence of the SPP modes has an impact on the propagation and transmission behavior of the light, which further enhances the sensitivity of the cavity size to the transmittance, with a consequent large change in the sensitivity. Therefore, parameter R is an important parameter used to adjust the sensitivity index in the structure, and a is the main sensing inclination angle of the structure. In practical applications, the appropriate size of the water droplet cavity can be selected according to needs to achieve the best transmittance and effect.
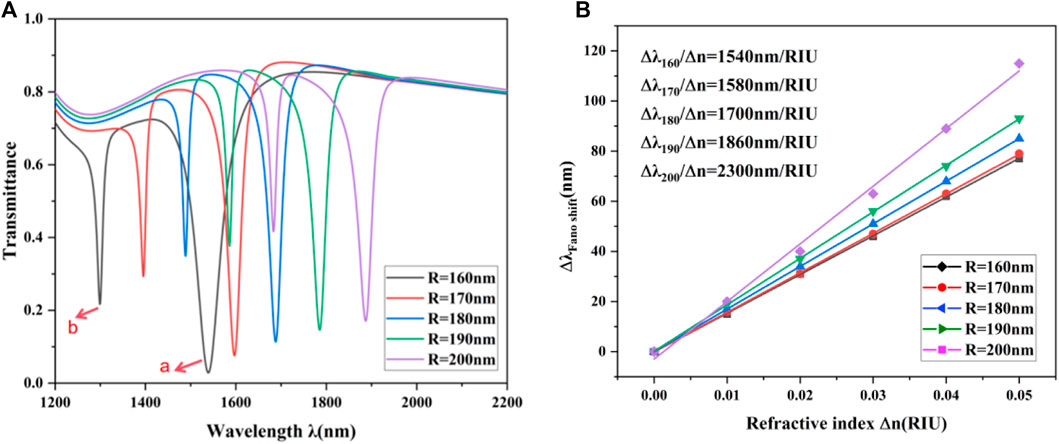
Figure 6. (A) Transmission spectra at different R; (B) Sensitivity fitted straight line with different R.
In order to investigate the effect of coupling distance g on the transmission curves, the transmission curves are plotted for g = 5 nm, 10 nm, 15 nm, 20 nm, and 25 nm, respectively, and the results are shown in Figure 7A. When the coupling distance g is raised from 5 nm to 25 nm, the transmission spectra are blueshifted and the transmittance is reduced significantly. This indicates that the smaller the coupling distance g is, the stronger the coupling strength between the WDCRS structure and the waveguide is. Combined with the sensitivity fitting line corresponding to g, Figure 7B shows that the sensitivity of the sensor increases as g increases. However, when g is 5 nm, the coupling distance is too small to make the energy transfer more scattered and incomplete, which cannot be effectively coupled to the target medium, resulting in a wider half-width of the curve, i.e., the FWHM increases, as shown in Figure 7C. Too large FWHM will make the FOM value of the sensor lower, leading to a reduction in the overall performance of the sensor. Therefore the balance between transmittance and half-width values should be considered when choosing the coupling distance. After comprehensive consideration, g = 10 nm is the most suitable coupling distance for this cavity.
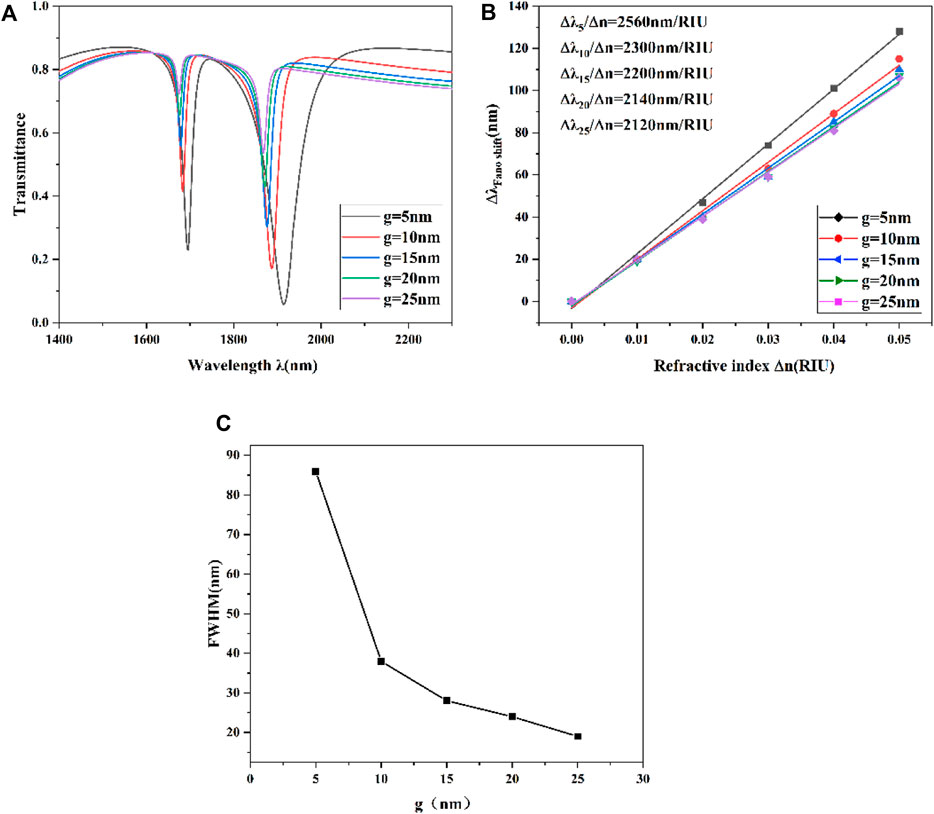
Figure 7. (A) Transmission spectra at different g. (B) Sensitivity fitted straight line with different g. (C) Variation of FWHM values for diferent coupling distances.
Finally, the transmission curves at different refractive indices were studied. Ensuring that the other parameters are constant, the transmission curves are plotted for refractive indices of 1, 1.01, 1.02, 1.03, 1.04, and 1.05, respectively, as shown in Figure 8A. A change in the refractive index will lead to a change in the frequency of the SPP, which will cause a shift in the transmission spectral curve. Based on the different transmission curves generated in Figure 8A, it can be seen that when the refractive index increases, the SPP will be affected by the difference in refractive index between the waveguide and the metal surface, which leads to an increase in the frequency of the SPP, causing the transmission spectral curve to shift towards longer wavelengths; on the contrary, when the refractive index decreases, the frequency of the SPP becomes lower, and the transmission spectral curve shifts blue. In addition, the transmittance decreases slightly when the refractive index changes to 1.05. This is due to the fact that the change in refractive index affects the dissipation process and energy transfer efficiency of SPP. When the refractive index increases, the dissipation process of SPP is enhanced, resulting in a relatively weaker intensity of the transmission spectral profile, which affects the transmittance. In addition, there is a slight increase in the FWHM value of the curve when the SPP frequency becomes higher.
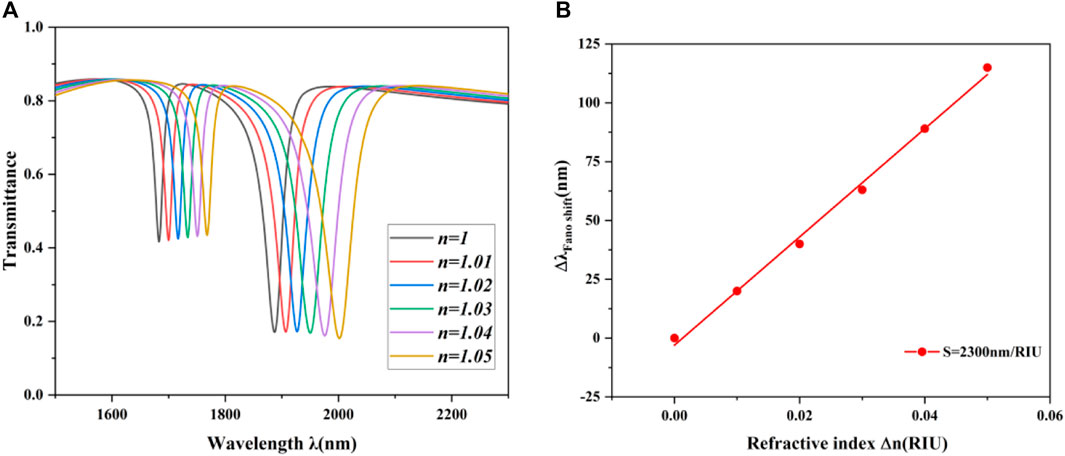
Figure 8. (A) Spectral transmittance under different n; (B) Matching line of inclination wavelength with refractive index change.
It is worth noting that an increase in refractive index does not change the shape of the curve, but only a linear displacement occurs. As shown in Figure 8B, the displacement of the resonance and loss peaks of the transmission spectral line is linearly related to the refractive index of the medium within a certain range. Therefore, within a certain wavelength range, the wavelength shift can be used to accurately measure the change in the refractive index of the medium. Therefore, the designed structure can utilize the change in refractive index to achieve a high-precision refractive index sensor, which is widely used in biosensing, chemical sensing and other fields. Based on the response of the transmission spectral curve to the refractive index, the sensitivity of the sensor can be further evaluated to obtain the best performance of the designed structure. The sensitivity at this point is 2,300 nm/RIU and the value of FOM is 60.5.
In summary, since the refractive index has a good linear relationship with the resonance wavelength, the structure designed in this paper can be used to detect physical quantities related to the refractive index. For example, in the field of temperature sensing, changes in ambient temperature can lead to changes in the refractive index of the medium in the sensor structure, so the designed sensor structure can react to changes in ambient temperature through the shift of the transmission spectrum; in the field of solution concentration detection, changes in the concentration of alcohol solution can lead to changes in the refractive index, and it can also react to the changes in the concentration of alcohol solution through the position of the inclination of the transmission spectrum. Therefore, the sensor structure has a wide range of application prospects, providing a new choice of high-precision sensors for many detection fields.
5 Conclusion
In this paper, a nanostructure consisting of a waveguide with two rectangular baffles and a WDCRS cavity is proposed. The WDCRS structure can generate Fano resonance due to the interaction between the narrow discrete states generated by the WDCRS cavity and the broad continuous states generated by the waveguide with rectangular baffles in different resonant modes. The transmission characteristics of the entire design have been investigated using the finite element method. Several factors affecting the Fano resonance curve are also analyzed, including the length L of the rectangular short bar, the height h and spacing l of the rectangular baffle, the outer radius R of the circle under the teardrop-shaped cavity, the coupling distance g, and the refractive index n. We can draw the following conclusion: with the increase of parameter R, that is, the size of the entire WDCRS increases, the transmission curve will be redshifted, and the sensitivity can be increased from the lowest 1,540 nm/RIU to 2,300 nm/RIU. It can be seen that the parameter R is an important parameter for adjusting the structural sensitivity performance; The introduction of the rectangular short bar optimizes the excitation efficiency of the SPP and can improve the detection and sensing sensitivity. And as the length of the short bar gradually increases, the transmission curve will be red-shifted and the sensitivity will increase; Although the height h and spacing l of the rectangular baffle have little effect on the sensing performance of the structure and will regulate the transmittance of the resonance depression, a change in the length h of the rectangular pile can make the Fano resonance curve more asymmetric; The coupling distance g affects the overall performance of the sensor, and a decrease in g improves the coupling strength, resulting in a lower transmittance of the Fano resonance curve and an increase in the sensitivity of the sensor, while too small a g improves the FWHM, resulting in a decrease in the overall performance of the sensor. After comprehensive consideration, g = 10 nm is the appropriate parameter value of the structure; Finally, the feature that the transmission curve can be equidistant changed by changing n can be used as a refractive index sensor. When the structural parameters are R = 200 nm, L = 170 nm, h = 100 nm, l = 500 nm, g = 10 nm, the sensing performance of the structure reaches the best. The maximum sensitivity of the sensor is 2,300 nm/RIU, and the FOM is 60.5. In practical application, different parameters can be adjusted as needed to achieve the optimal effect.
Data availability statement
The original contributions presented in the study are included in the article/Supplementary material, further inquiries can be directed to the corresponding author.
Author contributions
JW: Conceptualization, Data curation, Writing–original draft. SY: Conceptualization, Funding acquisition, Investigation, Project administration, Resources, Validation, Writing–review and editing. FL: Methodology, Writing–original draft. SC: Data curation, Writing–original draft. YuC: Formal Analysis, Validation, Writing–original draft. YaC: Visualization, Writing–review and editing. JL: Software, Writing–review and editing. YZ: Validation, Writing–review and editing. YR: Supervision, Writing–review and editing.
Funding
The author(s) declare financial support was received for the research, authorship, and/or publication of this article. The work was supported in part by the National Natural Science Foundation of China under Grant No.62374148, in part by the Zhejiang Provincial Natural Science Foundation of China under Grant No. LD21F050001, the Key Research Project by the Department of Water Resources of Zhejiang Province under Grant No. RA2101, the Key Research and Development Project of Zhejiang Province under Grant No. 2021C03019, and the Funds for Special Projects of the Central Government in Guidance of Local Science and Technology Development under Grant No. YDZJSX20231A031.
Acknowledgments
The authors are thankful to other colleagues in their laboratory for their understanding and help. They also appreciate the affiliated institution to provide research platform and the sponsor to provide financial support for them.
Conflict of interest
The authors declare that the research was conducted in the absence of any commercial or financial relationships that could be construed as a potential conflict of interest.
Publisher’s note
All claims expressed in this article are solely those of the authors and do not necessarily represent those of their affiliated organizations, or those of the publisher, the editors and the reviewers. Any product that may be evaluated in this article, or claim that may be made by its manufacturer, is not guaranteed or endorsed by the publisher.
References
1. Barnes WL, Dereux A, Ebbesen TW. Surface plasmon subwavelength optics. Nature (2003) 424:824–30. doi:10.1038/nature01937
2. Gramotnev DK, Bozhevolnyi SI. Plasmonics beyond the diffraction limit. Nat Photon (2010) 4:83–91. doi:10.1038/nphoton.2009.282
3. Yin Y, Qiu T, Li JQ, Chu PK. Plasmonic nano-lasers. Nano Energy (2010) 1:25–41. doi:10.1016/j.nanoen.2011.09.002
5. Han Z, Bozhevolnyi SI. Radiation guiding with surface plasmon polaritons. Rep Prog Phyd (2013) 76:016402. doi:10.1088/0034-4885/76/1/016402
6. Zayats AV, Smolyaninov II, Maradudin AA. Nano-optics of surface plasmon polaritons. Phys.Rep. (2005) 408:131–314. doi:10.1016/j.physrep.2004.11.001
7. Tao J, Wang QJ, Huang XG. All-optical plasmonic switches based on coupled nano-disk cavity structures containing nonlinear material. Plasmonics (2011) 6(4):753–9. doi:10.1007/s11468-011-9260-1
8. Fang M, Shi F, Chen Y. Unidirectional all-optical absorption switch based on optical tamm state in nonlinear plasmonic waveguide. Plasmonics (2016) 11(1):197–203. doi:10.1007/s11468-015-0042-z
9. Veronis G, Fan S. Bends and splitters in metal-dielectric-metal subwavelength plasmonic waveguides. Appl Phys Lett (2005) 87(13):131102. doi:10.1063/1.2056594
10. Tian J, Yang R, Song L, Xue W. Optical properties of a Y-splitter based on hybrid multilayer plasmonic waveguide. Quan Elect IEEE J (2014) 50(11):898–903. doi:10.1109/jqe.2014.2359232
11. Chen P, Liang R, Huang Q, Yu Z, Xu X. Plasmonic filters and optical directional couplers based on wide metal-insulator-metal structure. Opt Express (2011) 19(8):7633. doi:10.1364/oe.19.007633
12. Neutens P, Lagae L, Borghs G, Van Dorpe P. Plasmon filters and resonators in metal-insulator-metal waveguides. Opt Express (2012) 20(4):3408–23. doi:10.1364/oe.20.003408
13. Wang S, Li Y, Xu Q, et al. A MIM filter based on a side-coupled crossbeam square-ring resonator. Plasmonics, 2016, 11(5):1291–6. doi:10.1007/s11468-015-0174-1
14. Huang Y, Min C, Tao S, Veronis G. Design of compact mach–zehnder interferometer-based slow-light-enhanced plasmonic waveguide sensors. J Lightwave Tech (2016) 34(11):2796–803. doi:10.1109/jlt.2016.2546317
15. Chen M, Fan F, Yang L, Wang X, Chang SJ. Tunable terahertz amplifier based on slow light edge mode in graphene plasmonic crystal. IEEE J Quan Elect (2016) 53(1):1–6. doi:10.1109/jqe.2016.2640220
16. Yan S, Zhu X, Frandsen LH, Xiao S, Mortensen NA, Dong J, et al. Slow-light-enhanced energy efficiency for graphene microheaters on silicon photonic crystal waveguides. Nat Commun (2017) 8(1):14411–8. doi:10.1038/ncomms14411
17. Akram MJ, Ghafoor F, Khan MM, Saif F. Control of Fano resonances and slow light using Bose-Einstein condensates in a nanocavity. Phys Rev A (2017) 95(2):023810. doi:10.1103/physreva.95.023810
18. Wei Z, Li X, Zhong N, Tan X, Zhang X, Liu H, et al. Analogue electromagnetically induced transparency based on low-loss metamaterial and its application in nanosensor and slow-light device. Plasmonics (2017) 12(3):641–7. doi:10.1007/s11468-016-0309-z
19. Zhang ZD, Luo L, Xue CY, Zhang WD, Yan SB. Fano resonance based on Metal-Insulator-Metal waveguide-coupled double rectangular cavities for plasmonic nanosensors. Sensors (2016) 16:642. doi:10.3390/s16050642
20. Zafar R, Nawaz S, Singh G, Alessandro A, Salim M. Plasmonics-based refractive index sensor for detection of hemoglobin concentration. IEEE Sensors J (2018) 18:4372–7. doi:10.1109/jsen.2018.2826040
21. Zhang X, Qi Y, Zhou P, Gong H, HuYan BC. Refractive index sensor based on fano resonances in plasmonic waveguide with dual side-coupled ring resonators. Photonic Sens. (2018) 8:367–74. doi:10.1007/s13320-018-0509-6
22. Zhu J, Li N. MIM waveguide structure consisting of a semicircular resonant cavity coupled with a key-shaped resonant cavity. Opt Express (2020) 28:19978–87. doi:10.1364/OE.395696
23. Tathfif I, Hassan MF, Rashid KS, Yaseer AA, Sagor RH. A highly sensitive plasmonic refractive index sensor based on concentric triple ring resonator for cancer biomarker and chemical concentration detection. Opt Commun (2022) 519:128429. doi:10.1016/j.optcom.2022.128429
24. Kong DQ, Isubokawa M. Evaluation of slot-to-slot coupling between dielectric slot waveguides and metal-insulator-metal slot waveguides. Opt Express (2015) 23:19082–91. doi:10.1364/oe.23.019082
25. Nejat M, Nozhat N. Multi-band MIM refractive index biosensor based on Ag-air grating with equivalent circuit and T-matrix methods in near-infrared region. Scientific Rep (2020) 10:6357–12. doi:10.1038/s41598-020-63459-w
26. Chen L, Lu P, Tian M, Liu DM, Zhang JS. A subwavelength MIM waveguide filter with single-cavity and multi-cavity structure. Optik (2013) 124:3701–4. doi:10.1016/j.ijleo.2012.11.025
27. Zhu JH, Wang QJ, Shum P, Huang XG. A simple nanometeric plasmonic narrow-band filter structure based on metal-insulator-metal waveguide. IEEE Trans Nanotechnol (2011) 10:1371–6. doi:10.1109/TNANO.2011.2147330
28. Xie YY, Huang YX, Zhao WL, Xu WH, He C. A novel plasmonic sensor based on metal–insulator–metal waveguide with side-coupled hexagonal cavity. IEEE Photon J (2015) 7:1–12. doi:10.1109/jphot.2015.2419635
29. Zhang Y, Kuang Y, Zhang Z, Tang Y, Han J, Wang R, et al. High-sensitivity refractive index sensors based on Fano resonance in the plasmonic system of splitting ring cavity-coupled MIM waveguide with tooth cavity. Appl Phys (2019) 125:13. doi:10.1007/s00339-018-2283-0
Keywords: metal-insulator-metal, surface plasmon polaritons, refractive index sensor, Fano resonance, water droplet cavity
Citation: Wang J, Yan S, Liu F, Chang S, Cao Y, Cui Y, Liu J, Zhang Y and Ren Y (2024) Nanometer refractive index sensor based on water droplet cavity structure with rectangular short rod. Front. Phys. 12:1364998. doi: 10.3389/fphy.2024.1364998
Received: 03 January 2024; Accepted: 19 March 2024;
Published: 10 April 2024.
Edited by:
Jianming Wen, Kennesaw State University, United StatesReviewed by:
Preeti Gupta, Leibniz Institute for Solid State and Materials Research Dresden (IFW Dresden), GermanyHuibo Fan, Yangzhou University, China
Copyright © 2024 Wang, Yan, Liu, Chang, Cao, Cui, Liu, Zhang and Ren. This is an open-access article distributed under the terms of the Creative Commons Attribution License (CC BY). The use, distribution or reproduction in other forums is permitted, provided the original author(s) and the copyright owner(s) are credited and that the original publication in this journal is cited, in accordance with accepted academic practice. No use, distribution or reproduction is permitted which does not comply with these terms.
*Correspondence: Shubin Yan, yanshb@zjweu.edu.cn