Magnetic properties of Fe intercalation FexTaSe2
 Qian-Qian Feng1† Jun-Jie Guo1† Mian-Zeng Zhong1
  Zi-Yan Luo1
  Bo Li2 Xi-Guang Wang1 Yao-Zhuang Nie1
  Qing-Lin Xia1* Guang-Hua Guo1
- 1School of Physics, State Key Laboratory of Powder Metallurgy, Central South University, Changsha, Hunan, China
- 2College of Semiconductors (College of Integrated Circuits), Hunan University, Changsha, Hunan, China
Intercalation of transition metal dichalcogenides with magnetic elements has been the subject of increasing research interest, aiming to explore novel magnetic materials with anisotropy and spin-orbit coupling. In this paper, two magnetic samples with varying Fe content have been prepared using different growth conditions via the chemical vapor transport method. A comprehensive investigation of the magnetic properties of the materials has been conducted using the Physical Property Measurement System (PPMS, EvercoolⅡ-9T, Quantum Design). The results reveal distinct features in the studied materials. Fe0.12TaSe2 exhibits significant ferromagnetism with a Curie transition temperature of 50 K. However, its in-plane magnetism is weak and no significant hysteresis loop is observed below the Curie temperature. On the other hand, Fe0.25TaSe2 exhibits antiferromagnetism without any hysteresis loop and has a Néel temperature up to 130 K. This finding is quite different from the intercalated iron in FexTaS2, where only an antiferromagnetic state occurs with x larger than 0.4. Our study thus provides updated insights into the magnetic properties of this new system and serves as a reference for future investigations of TaSe2 compounds with varying iron content.
1 Introduction
Transition metal dichalcogenides (TMDCs) are compounds of the type TX2 (T = transition metal, X = S, Se, Te) that exhibit a variety of intriguing characteristics, such as topological semimetals [1], large magnetoresistance [2], superconductivity [3], and charge density wave (CDW) [4], etc. The layered structure of TMDCs consists of an X-T-X sandwich in each layer. Sandwiches come in two varieties: octahedral and triangular. The van der Waals force is used to link the layers. TMDCs often contain multiple polytypes [5], such as 1T, 2Ha, 2Hb, and 3R, due to different interlayer types and stacking arrangements. 2H-TaSe2 is an intriguing TMD with a combination of CDW and superconductivity. It consists of selenium and transition metal-selenium sandwiches with a triatomic structure, and its unit cell can be considered as two layers of Ta-Se with 60-degree rotation, with neighboring layers having van der Waals forces [6]. 2H-TaSe2 undergoes a second-order transition from the normal phase to the disproportional ordered phase at
To find new magnetic materials, transition metal diselenides are an ideal alternative because of their weaker van der Waals forces between layers and easy intercalation of transition metals [17–19]. We can try to obtain new magnetic materials by intercalating magnetic elements between the 2H-TaSe2 layers. In this study, we use chemical vapor phase transport to prepare the samples. Using the chemical vapor transport method (CVT) [20], we prepared two Fe samples with different Fe contents and determined their crystal orientation and elemental composition through XRD and SEM energy spectroscopy analyses. In addition, the magnetic properties of FexTaSe2 were investigated using a PPMS setup, providing experimental measurements. We have found that the two samples with varying Fe content constitute distinct ferromagnetic phases. Specifically, one phase exhibits ferromagnetism, while the other phase exhibits antiferromagnetism. These results indicate that FexTaSe2 single crystals have a rich potential for applications in magnetism and deserve further theoretical and experimental studies.
2 Experimental section
The CVT method, which involves using a carrier gas to transport the sample in the vapor phase to a cooler location where it is deposited as a solid, was used to prepare the sample. A small amount of iodine was added to the starting materials in a sealed tube to act as a transport agent, and the tube was heated to a temperature high enough to evaporate both the sample and the iodine [21].
Sample 1: A mixture of pure Fe (51.6 mg, 99.9%), Ta (506.4mg, 99.9%), and Se (442.0mg, 99.5%) powders with a stoichiometric molar ratio of 1:3:6 was loaded into a quartz tube. Vacuum-sealed in quartz tubes with I2 (93.9mg, 99.99%) as a transport carrier. The evacuated quartz tube’s source zone was heated to 900 °C, while the crystal growth zone was warmed to 700 °C. The whole system was kept at a set temperature for 5 days and then cooled to room temperature naturally [22].
Sample 2: Similarly, pure Fe (76.4 mg, 99.9%), Ta (493.7 mg, 99.9%), and Se (430.8 mg, 99.5%) powders were loaded into a quartz tube in a stoichiometric molar ratio of 1:3:6. The quartz tube was then vacuum-sealed, and I2 (133.9 mg, 99.99%) was used as the transport carrier. The quartz tubes were evacuated and sealed before being placed in a tube furnace equipped with a two-temperature zone. The high-temperature end was set at 830°C while the low-temperature end was set at 730 C. The tubes were initially heated to the desired temperature and held at that temperature for 12 h. Subsequently, they were maintained at this temperature for 12 days before being allowed to cool down naturally to room temperature.
3 Results and discussion
Sample 1: Figure 1A shows the schematic principle of CVT, where the feedstock is located at the high-temperature end and the sample in the gas phase is transported by iodine vapor to the low-temperature end for solid-phase deposition. To further characterize the crystal quality, the structure of Fe0.12TaSe2 single crystal was characterized by X-ray diffractometry (XRD) [23]. Figure 1B illustrates the XRD diffraction data analysis of the single crystals. Strong and prominent diffraction peaks in each crystal direction are observed for single crystals with excellent crystalline quality. The inset shows the optical image of the Fe0.12TaSe2 single crystal, which exhibits a regular polygonal shape and metallic luster. The elemental composition of Fe0.12TaSe2 crystals was characterized using scanning electron microscopy (SEM) and energy spectrometry (EDS). The morphology and dimensions of the samples were examined by SEM. Figure 1C displays the EDS energy spectrum obtained by comparing the ratio of integrated intensities of each element’s peaks. The estimated composition of this data is Fe0.12TaSe2. The Fe0.12TaSe2 bulk was verified in polytype using Micro-Raman spectroscopy, and the test results are shown in Figure 1D. The experiments were performed in a backscattering configuration with an excitation laser wavelength of 532 nm. Figure 1D shows the information bands at 208 cm-1 (E2g) and 234 cm-1 (A1g), which are consistent with the previous reports on 2H-TaSe2 [24].
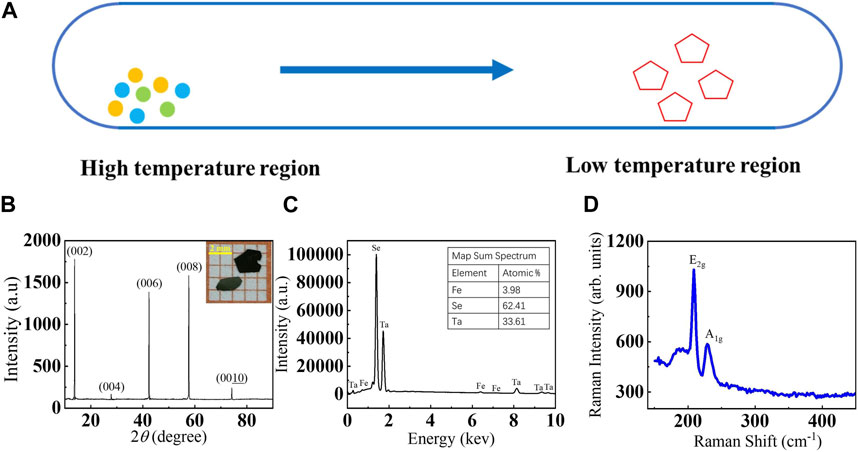
FIGURE 1. (A) Schematic diagram of the principle of CVT. (B) XRD spectra of Fe0.12TaSe2. The inset is the optical image of the Fe0.12TaSe2 single crystal. (C) EDS spectrum of Fe0.12TaSe2, inset shows actual atomic ratio. (D) Raman spectra of Fe0.12TaSe2 single crystals.
Figure 2 exhibits the magnetic measurements associated with Fe0.12TaSe2. Figures 2A, B depict the magnetization intensity versus temperature measured under zero-field cooling (ZFC) and field cooling (FC) with an applied magnetic field of 0.1T parallel to the c-axis (Mc) and along the ab-plane (Mab) direction, respectively [25]. Due to the strong magnetic crystal anisotropy of Fe0.12TaSe2 (with the c-axis serving as the easy magnetization axis), the measured M-T is different between the two directions [26]. The bifurcation of the two curves in the low-temperature part originates from the characteristics of the spin glass [27]. As the temperature increases, the Fe0.12TaSe2 single crystal becomes paramagnetic, and the zero-field cooling curve coincides with the field cooling curve. The inset of Figure 2A shows the dM/dT curve of ZFC, where the minimum point of the derivative is the Curie temperature. By deriving the data, we can deduce that the Curie temperature of Fe0.12TaSe2 is 50 K. Figure 2C shows the magnetization curves at different temperatures when the magnetic field is perpendicular to the ab-plane, the maximum value of the scanning magnetic field is 7 T, and obvious rectangular hysteresis loops can be observed below the Curie transition temperature. The rectangular hysteresis loop is most obvious when the temperature is
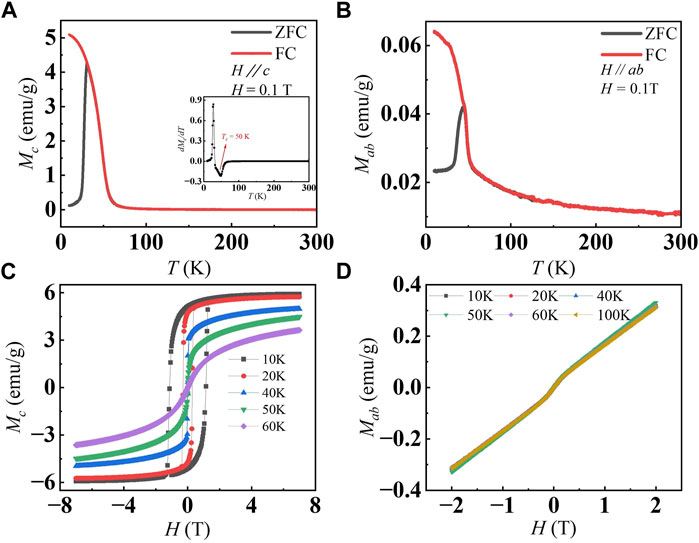
FIGURE 2. (A) Temperature-dependent magnetization measured of zero-field cooling (red) and field-cooling (black) with
Sample 2: Figure 3A illustrates the X-ray diffraction (XRD) pattern of sample 2. The crystalline orientation is prominent and robust, suggesting that the single crystal exhibits high crystalline quality. The inset is an optical image of a single crystal of Fe0.25TaSe2, showing a regular polygonal shape and metallic luster. The elemental composition of the samples was determined using scanning electron microscopy (SEM), as depicted in Figure 3B. The inset shows the atomic proportions of the elements. The scanning electron microscopy (SEM) results reveal that the Fe content in this single crystal is 0.25, indicating its chemical formula as Fe0.25TaSe2. Similarly, the polytype of the Fe0.25TaSe2 block was confirmed using micro-Raman spectroscopy. The test results are presented in Figure 3C. The experimental pattern using the 532 nm wavelength laser is consistent with that of Sample 1. Figure 3C displays the characteristic bands observed at 212 cm-1 (E2g) and 234.27 cm-1 (A1g), which confirm that Sample 2 corresponds to the 2H-TaSe2 polytype [24]. We obtained two samples with varying Fe content, allowing us to proceed with individual measurements of the magnetic properties of each sample for a comprehensive investigation of their respective characteristics.
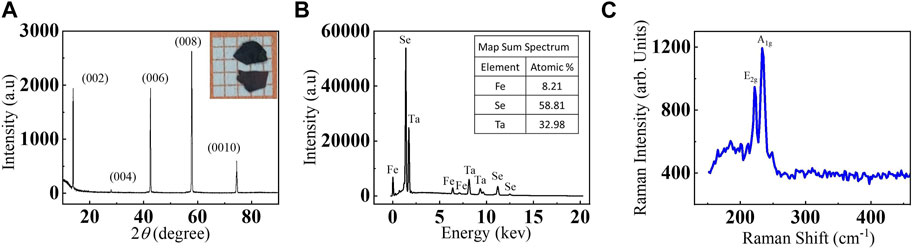
FIGURE 3. (A) XRD spectra of Fe0.25TaSe2. The inset is the optical image of the Fe0.25TaSe2 single crystal. (B) EDS spectrum of Fe0.25TaSe2, inset shows actual atomic ratio. (C) Raman spectra of Fe0.25TaSe2 single crystals.
Figures 4A–D shows the magnetic measurements associated with Fe0.25TaSe2. Figures 4A, B show the zero-field cooling (ZFC) and field cooling (FC) curves at 0.1 T magnetic field parallel to the c-axis (Mc) and along the ab-plane (Mab) direction, respectively. Antiferromagnetic behavior is observed in Figures 4A, B, suggesting that Fe0.25TaSe2 exhibits the characteristics of an antiferromagnetic material [31, 32]. The inset in Figure 4A displays the derived curve of the zero-field cooling (ZFC) magnetization versus temperature, with the lowest point serving as the critical temperature for the antiferromagnetic to paramagnetic transition, known as the Néel temperature (TN) [33, 34]. Based on the inset, the Néel temperature (TN) of Fe0.25TaSe2 is determined to be 130 K. Figures 4C, D present the magnetization curves for in-plane and out-of-plane orientations at various temperatures, exhibiting a linear trend that is indicative of antiferromagnetism. This behavior is characterized by the absence of saturation, making it challenging to reach a maximum magnetization value.
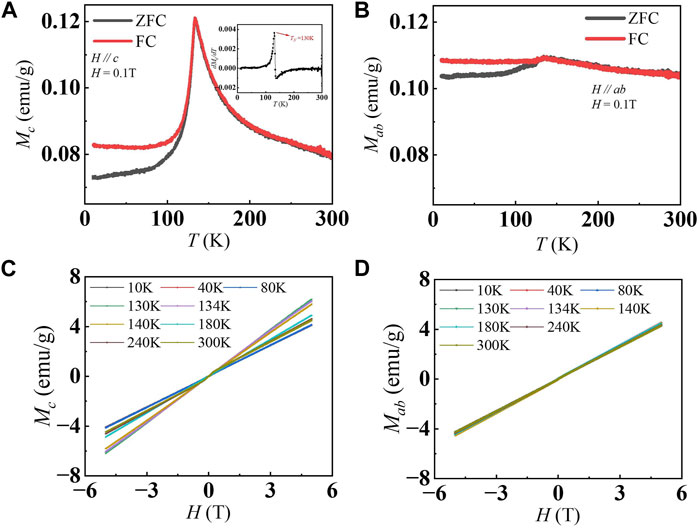
FIGURE 4. (A) Temperature-dependent magnetization measured of zero-field cooling (red) and field-cooling (black) with
The inset of Supplementary Figure S1A illustrates the schematic diagram of the device configuration after the mechanical stripping of the sample into a thin film. The four-terminal method was used to pass a constant current under zero-field conditions by integrating the setups of Keithley 2400 and Keithley 2182. The variation curve of longitudinal resistance from 10K to 300K is obtained by this method. Supplementary Figure S1B shows the temperature dependence of the resistance of the Fe0.12TaSe2 sample in the presence of zero field. The resistance decreases with decreasing temperature and exhibits metallic behavior. In the vicinity of the ferromagnetic and paramagnetic transition temperatures, the resistance varies significantly with the temperature slope. At higher temperatures, the linearity of Rxx (T) weakens, suggesting a decline in the metal’s properties. Conversely, below 50 K, it maintains consistency with the loss of spin-disorder scattering in the FM state. This corresponds to the Curie temperature of the magnetic measurement data, indicating that Fe0.12TaSe2 has a Curie temperature of 50 K [35]. Supplementary Figure S1C shows the temperature dependence of the resistance of the Fe0.25TaSe2 sample in the presence of zero field. The longitudinal resistance RXX also exhibits metallic properties. The resistance exhibits a reduction as the temperature decreases, with a notable alteration in the slope of resistance observed near
4 Conclusion
We prepared two samples of FexTaSe2 with different Fe contents using the CVT technique. By measuring their magnetic properties, we determined that the two samples exhibit ferromagnetism and antiferromagnetism, respectively. Fe0.12TaSe2 is ferromagnetic with a Curie temperature of 50 K. At low temperatures, there is a well-defined rectangular saturation magnetization curve outside the surface. As the temperature increases, the opening of the magnetization curve becomes smaller, and it gradually transforms into a linear magnetization curve at the Curie temperature. The magnetic properties within the ab-plane are weak and there is no obvious rectangular magnetization curve, which is linear. Significantly, FexTaSe2 exhibits an intriguing antiferromagnetic behavior when x is equal to 0.25, which is in contrast to the phase diagram of FexTaS2. Remarkably, the Néel temperature associated with the antiferromagnetic phase of Fe0.25TaSe2 can reach an impressive value of 130 K. The magnetization curves of Fe0.25TaSe2 are all linear curves and difficult to saturate. Finally, the temperature dependence of the sample resistance was investigated and the results verified that the magnetic transition temperature corresponds to the magnetic measurements for both samples. This finding holds significant value for future investigations focused on elucidating the phase diagram of FexTaSe2 and determining the critical ferromagnetic-antiferromagnetic threshold of this material.
Data availability statement
The original contributions presented in the study are included in the article/Supplementary Material, further inquiries can be directed to the corresponding author.
Author contributions
Q-QF: Investigation, Methodology, Validation, Conceptualization, Data curation, Visualization, Writing–original draft. J-JG: Investigation, Data curation, Writing–original draft. M-ZZ: Conceptualization, Funding acquisition, Project administration, Writing–review and editing. Z-YL: Conceptualization, Funding acquisition, Project administration, Writing–review and editing, Formal Analysis. BL: Project administration, Writing–review and editing, Supervision. X-GW: Project administration, Supervision, Writing–review and editing, Conceptualization, Funding acquisition. Y-ZN: Conceptualization, Project administration, Writing–review and editing, Methodology. Q-LX: Methodology, Project administration, Writing–review and editing, Funding acquisition, Investigation, Validation. G-HG: Conceptualization, Data curation, Funding acquisition, Project administration, Writing–review and editing.
Funding
The author(s) declare financial support was received for the research, authorship, and/or publication of this article. This work was supported by the National Natural Science Foundation of China (Nos. 12274467, 12274469, and 12204549), and the Fundamental Research Funds for the Central Universities of Central South University (No. 2023ZZTS0700). The project was also supported by the State Key Laboratory of Powder Metallurgy, Central South University, Changsha, China.
Conflict of interest
The authors declare that the research was conducted in the absence of any commercial or financial relationships that could be construed as a potential conflict of interest.
Publisher’s note
All claims expressed in this article are solely those of the authors and do not necessarily represent those of their affiliated organizations, or those of the publisher, the editors and the reviewers. Any product that may be evaluated in this article, or claim that may be made by its manufacturer, is not guaranteed or endorsed by the publisher.
Supplementary material
The Supplementary Material for this article can be found online at: https://www.frontiersin.org/articles/10.3389/fphy.2024.1371171/full#supplementary-material
References
1. Ali MN, Xiong J, Flynn S, Tao J, Gibson QD, Schoop LM, et al. Large, non-saturating magnetoresistance in WTe2. Nature (2014) 514:205–8. doi:10.1038/nature13763
2. Chen CW, Chikara S, Zapf VS, Morosan E. Correlations of crystallographic defects and anisotropy with magnetotransport properties in FexTaS2 single crystals (0.23 ≤ x ≤ 0.35). Phys Rev B (2016) 94:054406. doi:10.1103/PhysRevB.94.054406
3. Sugawara K, Yokota K, Takemoto J, Tanokura Y, Sekine T. Anderson localization and layered superconductor 2H-NbSe2-xSx. J Low Temp Phys (1993) 93:39–47. doi:10.1007/BF00132088
4. Yasuzuka S, Uji S, Sugiura S, Terashima T, Nogami Y, Ichimura K, et al. Highly isotropic in-plane upper critical field in the anisotropic s-wave superconductor 2H-NbSe2. J Supercond Novel Magn (2020) 33:953–8. doi:10.1007/s10948-019-05333-z
5. Katzke H, Tolédano P, Depmeier W. Phase transitions between polytypes and intralayer superstructures in transition metal dichalcogenides. Phys Rev B (2004) 69:134111. doi:10.1103/PhysRevB.69.134111
6. Li M, Xu N, Zhang JF, Lou R, Shi M, Li LJ, et al. Quantization of the band at the surface of charge density wave material 2H-TaSe2*. Chin Phys B (2021) 30:047305. doi:10.1088/1674-1056/abe9a8
7. Song CY, Yuan X, Huang C, Huang SY, Xing QX, Wang C, et al. Plasmons in the van der Waals charge-density-wave material 2H-TaSe2. Nat Commun (2021) 12:386. doi:10.1038/s41467-020-20720-0
8. Moncton DE, Axe JD, DiSalvo FJ. Study of superlattice formation in 2H-NbSe2 and 2H-TaSe2 by neutron scattering. Phys Rev Lett (1975) 34:734–7. doi:10.1103/PhysRevLett.34.734
9. Freitas DC, Rodière P, Osorio MR, Navarro-Moratalla E, Nemes NM, Tissen VG, et al. Strong enhancement of superconductivity at high pressures within the charge-density-wave states of 2H-TaS2 and 2H-TaSe2. Phys Rev B (2016) 93:184512. doi:10.1103/PhysRevB.93.184512
10. Si JG, Wei MJ, Wu HY, Xiao RC, Lu WJ. Charge-density-wave tuning in monolayer 1H-TaSe2 by biaxial strain and charge doping. Europhys Lett (2019) 127:37001. doi:10.1209/0295-5075/127/37001
11. Baek S, Sur Y, Kim K, Vojta M, Büchner B. Interplay of charge density waves, disorder, and superconductivity in 2H-TaSe2 elucidated by NMR. New J Phys (2022) 24:043008. doi:10.1088/1367-2630/ac5eec
12. Seifarth O, Gliemann S, Skibowski A, Kipp L. On the charge-density-wave mechanism of layered 2H-TaSe2: photoemission results. J Electron Spectrosc Relat Phenom (2004) 137:675–9. doi:10.1016/j.elspec.2004.02.003
13. Hardy WJ, Chen CW, Marcinkova A, Ji H, Sinova J, Natelson D, et al. Very large magnetoresistance in Fe0.28TaS2 single crystals. Phys Rev B (2015) 91:054426. doi:10.1103/PhysRevB.91.054426
14. Morosan E, Zandbergen HW, Li L, Lee M, Checkelsky JG, Heinrich M, et al. Sharp switching of the magnetization in Fe1/4TaS2. Phys Rev B (2007) 75:104401. doi:10.1103/PhysRevB.75.104401
15. Rahman A, Rehman MU, Kiani M, Zhao HZ, Wang JL, Lu YL, et al. Critical behavior and phase diagram of layered ferromagnetic FeTa3S6 single crystals. Phys Rev B (2022) 105:144413. doi:10.1103/PhysRevB.105.144413
16. Sharma R, Karmakar S, Rawat R. Study of magnetoresistance in polycrystalline Fe intercalated TaS2. AIP Conf Proc (2020) 2220:030001. doi:10.1063/5.0001191
17. Gong C, Li L, Li ZL, Ji HW, Stern A, Xia Y, et al. Discovery of intrinsic ferromagnetism in two-dimensional van der Waals crystals. Nature (2017) 546:265–9. doi:10.1038/nature22060
18. Qi BT, Guo JJ, Miao YQ, Zhong MZ, Li B, Luo ZY, et al. Abnormal magnetoresistance transport properties of van der Waals antiferromagnetic FeNbTe2. Front Phys (2022) 10:851838. doi:10.3389/fphy.2022.851838
19. Miao YQ, Guo JJ, Luo ZY, Zhong MZ, Li B, Wang XG, et al. Anisotropic magnetoresistance effect of intercalated ferromagnet FeTa3S6. Front Phys (2022) 10:847402. doi:10.3389/fphy.2022.847402
20. Ubaldini A, Giannini E. Improved chemical vapor transport growth of transition metal dichalcogenides. J Cryst Growth (2014) 401:878–82. doi:10.1016/j.jcrysgro.2013.12.070
21. Wang M, Zhang L, Huang MR, Liu Y, Zhong YJ, Pan JL, et al. Morphology-controlled tantalum diselenide structures as self-optimizing hydrogen evolution catalysts. EEM (2020) 3:12–8. doi:10.1002/eem2.12052
22. Yan Z, Jiang C, Pope TR, Tsang CF, Stickney JL, Goli P, et al. Phonon and thermal properties of exfoliated TaSe2 thin films. J Appl Phys (2013) 114:204301. doi:10.1063/1.4833250
23. Shi JP, Chen XX, Zhao LY, Gong Y, Hong M, Huan YH, et al. Chemical vapor deposition grown wafer-scale 2D tantalum diselenide with robust charge-density-wave order. Adv Mater (2018) 30:1804616. doi:10.1002/adma.201804616
24. Renteria J, Samnakay R, Jiang C, Pope TR, Goli P, Yan Z, et al. All-metallic electrically-gated 2H-TaSe2 switches and logic circuits. J Appl Phys (2013) 115:034305. doi:10.1063/1.4862336
25. Kim K, Seo J, Lee E, Ko KT, Kim BS, Jang BG, et al. Large anomalous Hall current induced by topological nodal lines in a ferromagnetic van der Waals semimetal. Nat Mater (2018) 17:794–9. doi:10.1038/s41563-018-0132-3
26. Yamasaki Y, Miyasaka S, Kaneko Y, He J-P, Arima T, Tokura Y. Magnetic reversal of the ferroelectric polarization in a multiferroic spinel oxide. Phys Rev Lett (2006) 96:207204. doi:10.1103/PhysRevLett.96.207204
27. Luo JH, Li B, Zhang JM, Zhong MZ, Xia QL, Nie YZ, et al. Bi doping-induced ferromagnetism of layered material SnSe2 with extremely large coercivity. J Magn Magn Mater (2019) 486:165269. doi:10.1016/j.jmmm.2019.165269
28. Bedanta S, Kleemann W. Supermagnetism. J Phys D (2009) 42:013001. doi:10.1088/0022-3727/42/1/013001
29. Huang B, Clark G, Navarro-Moratalla E, Klein DR, Cheng R, Seyler KL, et al. Layer-dependent ferromagnetism in a van der Waals crystal down to the monolayer limit. Nature (2017) 546:270–3. doi:10.1038/nature22391
30. Bonilla M, Kolekar S, Ma YJ, Diaz HC, Kalappattil V, Das R, et al. Strong room-temperature ferromagnetism in VSe2 monolayers on van der Waals substrates. Nat Nanotechnol (2018) 13:289–93. doi:10.1038/s41565-018-0063-9
31. Makhlouf SA. Magnetic properties of Co3O4 nanoparticles. J Magn Magn Mater (2002) 246:184–90. doi:10.1016/S0304-8853(02)00050-1
32. Berkowitz AE, Rodriguez GF, Hong JI, An K, Hyeon T, Agarwal N, et al. Antiferromagnetic MnO nanoparticles with ferrimagnetic Mn3O4 shells: doubly inverted core-shell system. Phys Rev B (2008) 77:024403. doi:10.1103/PhysRevB.77.024403
33. Tadic M, Nikolic D, Panjan M, Blake GR. Magnetic properties of NiO (nickel oxide) nanoparticles: blocking temperature and Neel temperature. J Alloys Compd (2015) 647:1061–8. doi:10.1016/j.jallcom.2015.06.027
34. Murthy JK, Venimadhav A. Giant zero field cooled spontaneous exchange bias effect in phase separated La1.5Sr0.5CoMnO6. Appl Phys Lett (2014) 103:252410. doi:10.1063/1.4855135
35. Tang W, Zhou ZW, Nie YZ, Xia QL, Zeng ZM, Guo GH. Spin wave modes of width modulated Ni80Fe20/Pt nanostrip detected by spin-orbit torque induced ferromagnetic resonance. Appl Phys Lett (2017) 111:172407. doi:10.1063/1.4999818
Keywords: FexTaSe2, magnetic property, ferromagnetism, antiferromagnetism, CVT
Citation: Feng Q-Q, Guo J-J, Zhong M-Z, Luo Z-Y, Li B, Wang X-G, Nie Y-Z, Xia Q-L and Guo G-H (2024) Magnetic properties of Fe intercalation FexTaSe2. Front. Phys. 12:1371171. doi: 10.3389/fphy.2024.1371171
Received: 16 January 2024; Accepted: 06 February 2024;
Published: 14 February 2024.
Edited by:
Shiyun Xiong, Guangdong University of Technology, ChinaReviewed by:
Yingying Zhang, Intel, United StatesElie Albert Moujaess, Federal University of Rondonia, Brazil
Copyright © 2024 Feng, Guo, Zhong, Luo, Li, Wang, Nie, Xia and Guo. This is an open-access article distributed under the terms of the Creative Commons Attribution License (CC BY). The use, distribution or reproduction in other forums is permitted, provided the original author(s) and the copyright owner(s) are credited and that the original publication in this journal is cited, in accordance with accepted academic practice. No use, distribution or reproduction is permitted which does not comply with these terms.
*Correspondence: Qing-Lin Xia, qlxia@csu.edu.cn
†These authors have contributed equally to this work