A driving method for gray scale multiplication of electrowetting display based on hybrid modulation
 Ting Mei1,2
  Zhixian Lin1,2,3*
  Ziyu Xie1,2 Shanling Lin2,3 Bipeng Cai1,2
  Mingzhen Chen1,2 Tailiang Guo1,2
- 1School of Physics and Information Engineering, Fuzhou University, Fuzhou, China
- 2China Fujian Optoelectronic Information Science and Technology Innovation Laboratory, Fuzhou, China
- 3School of Advanced Manufacturing, Fuzhou University, Quanzhou, China
In order to solve the problem of low gray level due to the few driving chips developed based on the photoelectric characteristics of electrowetting display, a driving method based on modulation is proposed to double the gray level of electrowetting display. In this method, the driving waveform based on pulse amplitude modulation and pulse width modulation hybrid modulation is designed, and the gray level–luminance curve of the electrowetting display is measured and analyzed. On this basis, the luminance nonlinear correction is carried out, and the improvement of 64 Gy levels to 127 Gy levels is realized by the principle of human visual persistence phenomenon. The experimental results show that the proposed driving scheme can break through the limitation of the driving chip and realize the multiplication of gray levels, in which 96% gray levels increase steadily with an average luminance difference of 0.07, and at the same time enhance the contrast and improve the display effect.
1 Introduction
In today’s era, displays are widely used in commercial, medical, science and technology, people’s livelihood and other major fields. Mainstream displays can be divided into active light emitting displays and passive light emitting displays according to their luminous characteristics. Active light emitting displays on the market mainly include LED, LCD, OLED, QLED, Micro-LED [1, 2], etc. At present, these displays display luminance through backlight or self-lighting, which has a good display effect indoors. But in the outdoor high-intensity natural ambient light, the visibility and visual range of the display are greatly reduced and display quality is affected. As a result, passive light emitting displays have come into being, and e-paper displays have gradually entered people’s field of vision, and reflective displays have attracted greater attention with the beginning of electrophoretic Display (EPD) [3]. With the proposal of Royal Philips of the Netherlands in 2003 [4], the Electrowetting Display (EWD) technology, which also relies on reflective light emitting technology, began to gradually develop and occupy a place in the display field.
EWDs emit light through the reflection of external ambient light, which has the advantages of wide viewing Angle, fast response speed, video playback [4], colorization [6–9], and human eye friendly [10, 11]. However, there are still some problems. When the driving voltage is applied to the display screen [12–14], the hydrophobic insulator layer will capture some charges, resulting in the change of the nearby electric field, affecting the balance between Laplace pressure and Maxwell pressure, and causing oil backflow. At the same time, when the driving voltage is changed to a certain extent, the electric field mutation caused by it will produce the phenomenon of oil splitting, leading to the mutation of the aperture ratio. Although the research on EWD technology has achieved great results in recent years, most scholars mainly improved and optimized the problems such as oil backflow, charge trapping, and oil splitting [15–18]. Zichuan Yi et al. [19] not only designed a driving waveform with reverse electrode pulse and optimized voltage slope to improve the aperture ratio of the device. A vibration-frequency hybrid modulation driving system [20] was also proposed to improve the response speed of driving gray scale and improve the stability of oil during gray scale display. Yi Z et al. [21] proposed a driving waveform based on exponential function to reduce response time. Taiyuan Zhang et al. [22] put forward a driving waveform consisting of driving signal and periodic reset signal, which can effectively suppress charge trapping and oil backflow. It has been proved that the higher the luminance of the target gray level, the more serious charge trapping [23]. Therefore, Qian Mingyong et al. [5] proposed multi-gray dynamic symmetric driving waveform and molecular frame to increase gray level and inhibit charge trapping at the same time. In spite of this, there were still few scholars to study the gray display technology. In the early stage of development, EWD was mainly used for text display, and the requirements for gray level were not high. There are few driving chips dedicated to electrowetting display. The manufacturer (ULTRACHIP) has developed a UC8420 source driving IC and a UC8430 gate driving IC, and the driving chip only has 6-bit analog gray-scaling. Nowadays, EWD can be expanded to be used for picture and video display, and the level requirements for the display gray scale continue to increase. But EWD has not been commercialized, and the manufacturer has not developed a better driving chip, which can not achieve high gray level output.
At this stage, in order to improve the gray display effect, this paper proposed a driving method for gray scale multiplication of electrowetting display based on hybrid modulation. The scheme can display 7-bit binary RGB image data on the EWD through the ARM + FPGA driving system, which can increase the gray level limit from 64 to 127. It not only increases the contrast to a certain extent, but also improves the display quality.
2 Basic characteristics of electrowetting display
2.1 Basic principle of electrowetting display
The basic principle and pixel unit structure of EWDs are shown in Figure 1. Figure 1B shows the cross section of the pixel unit of EWDs. From the bottom layer to the top layer, the structure is composed of indium tin oxide (ITO), the hydrophobic insulator layer, the hydrophilic pixel wall, the colored oil layer and the water layer. When there is no potential difference between the two ends of the pixel, that is, no voltage is applied, the pixel crosscutting diagram is shown in Figure 1B, and the top view is shown in Figure 1A. The colored oil is laid on the hydrophobic insulator layer. When external light enters, the light is absorbed by the oil, the reflection layer is covered by the oil, and the pixel shows the oil color and is in a dark state. When a voltage is applied, the oil shrinks. The greater the voltage is applied, the greater the degree of shrinkage. The oil shrinks to expose the reflection layer, the incident light shines on the reflection layer and reflects back. The pixel shows the substrate color, which is in a bright state.
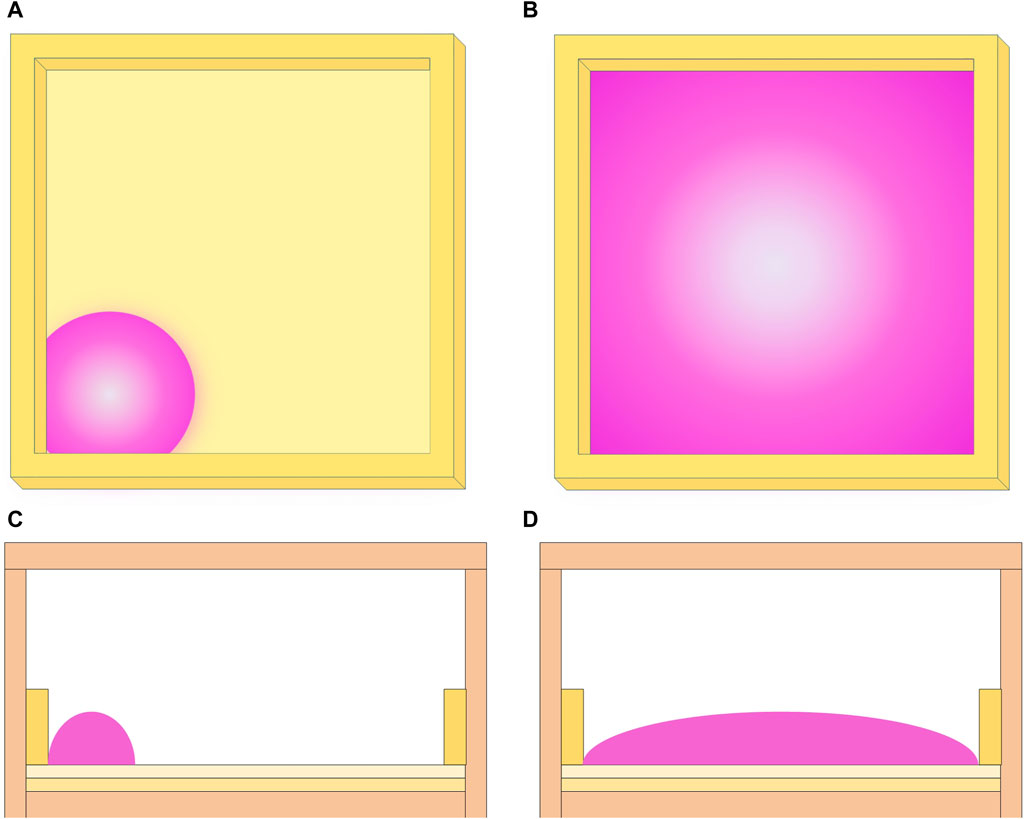
Figure 1. Structure of the EWDs. (A) Top view of oil shrinkage. (B) Top view of oil tiling. (C) Side view of oil shrinkage. (D) Side view of oil tiling.
The light and dark degree of EWDs is mapped to the gray level of the display image, and the greater the degree of oil shrinkage, the brighter the luminance. Applying different driving voltage will lead to different degrees of oil shrinkage, showing different bright and dark states. When the driving voltage is lower than the opening threshold voltage, the oil is completely laid on the hydrophobic insulator layer. When the driving voltage is higher than the opening threshold voltage, the oil begins to shrink until the driving voltage increases beyond the maximum threshold voltage, resulting in the oil may over-shrink over the pixel wall. As shown in Figure 2A, the mode of Pulse Amplitude Modulation (PAM) can effectively control the degree of oil shrinkage by applying voltages of different amplitudes to the pixels during the unit display period. Because the display gray scale is limited by the driving chip and response time, the maximum can be achieved in the effective driving voltage range to display 64 Gy scales. Under the existing conditions, it is temporarily unable to achieve a higher gray scale through PAM modulation. As shown in Figure 2B, Pulse Width Modulation (PWM) achieves different grayscale display under human visual temporary effect by changing the duty cycle of the pulse during the display period. However, the display effect will be greatly reduced due to the narrowness of the pulse at low grayscale. Therefore, it is not suitable to use PWM modulation when the gray scale exceeds a certain amount.
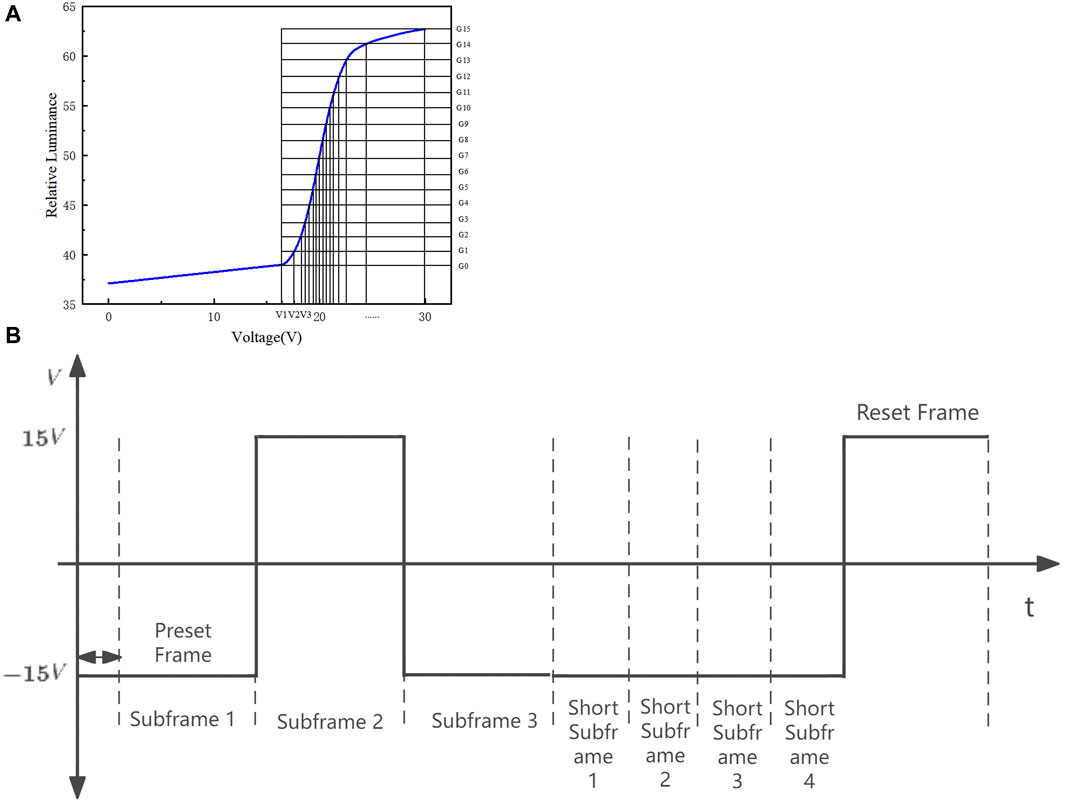
Figure 2. Waveforms of different modulation modes of EWDs. (A) PAM waveform. (B) PAM waveform.
In this paper, a hybrid modulation method of PWM and PAM is proposed to improve the gray scale. PAM has the advantage of low response speed of the driving circuit and the display device, which improves the display quality that the display device cannot respond to too narrow pulse when the PWM modulation is only used for EWDs. At the same time, using the advantages of PWM modulation driving circuit is easy to realize, reduce the complexity of the circuit under using PAM modulation. Finally, the nonlinear correction of the gray scale of EWDs is realized.
2.2 Human visual retention phenomenon
When the image changes rapidly, the image seen by the human eye will not disappear immediately, but will continue to retain the image for 0.1–0.4 s. That is, once the light image is formed in the retina, vision will maintain a limited time for the perception of this light image, which is the phenomenon of human visual retention. When the frame rate of EWDs is between 20Hz and 60Hz, the images can be displayed stably. Therefore, the image displayed by the two sub-frames can achieve the overlap with the human visual retention phenomenon, to improve the gray level of EWDs.
As shown in Figure 3, taking two 4-Gy scale pictures as an example, Figure 3A is a 4-Gy scale picture with uniform and equal division. Figure 3A is shifted to the left by 1/8 to form Figure 3B, and the two scattered 4-Gy scale pictures are alternately refreshed to form a 60Hz video. The processed video is transmitted to the EWD through the driving system. Due to the persistence of human vision, a new gray level will be formed by the superposition of different gray levels at the same position of two pictures. The experimental results are shown in Figure 3C, and the 4-Gy level pictures can be superimposed to form a 7-Gy level effect. It can be clearly seen that the human visual persistence phenomenon can be presented on the EWD.
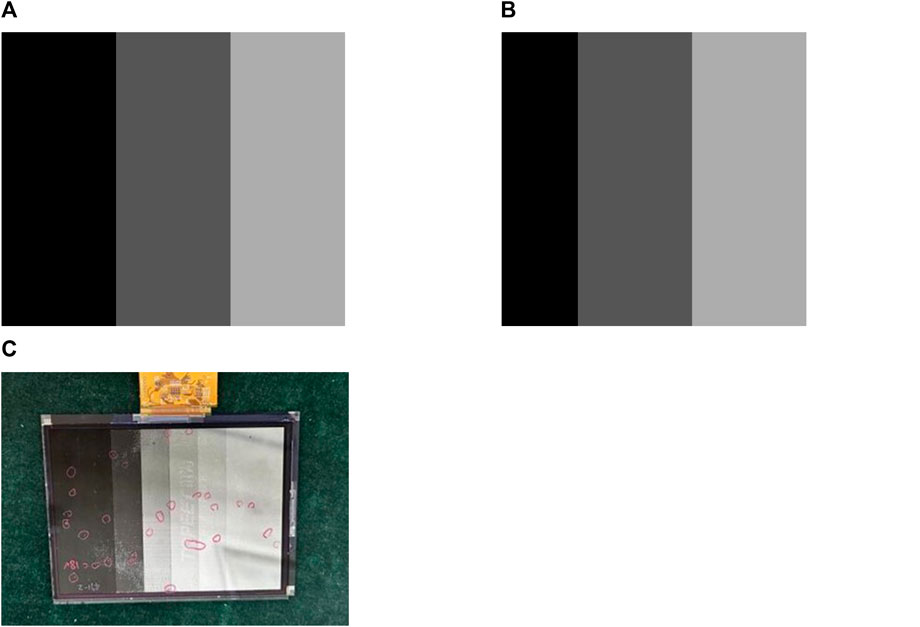
Figure 3. On-screen verification of human visual retention phenomenon. (A) Even four-gray scale image. (B) Four gray scale images after translation. (C) The effect of two images superimposed on the screen.
2.3 Driving waveform design
Because EWD is a voltage type device, the degree of oil shrinkage is determined by the voltage, so EWD can be mainly driven by PWM or PAM. However, with the research and development of EWDs, the display effect, gray level, resolution and other requirements continue to improve. Using only PWM or PAM to drive no longer meets the display requirements. Therefore, in order to adapt to the high resolution and high size screen to achieve higher gray display, this paper proposes a hybrid modulation mode of PWM and PAM. According to the photoelectric response characteristics of EWDs and the visual retention characteristics of human eyes, this paper designs a driving waveform to improve the gray scale of EWDs.
As shown in Figure 4, the waveform design principle of this paper is as follows: a picture display time is divided into two sub-frames, the horizontal coordinate is the frame and the vertical coordinate is the driving voltage amplitude. The voltage Vm in the first subframe and the voltage Vn in the second subframe both have 64 different amplitudes to choose from. Except for the voltage V0 in the off state, the remaining 63 voltages of the subframe are Vlim = Von ∼ Vmax, that is, the opening threshold voltage to the maximum threshold voltage of EWDs, and the Vlim is divided into 63 parts. The driving chip can output a maximum 6-bit analog voltage, which corresponds to 64 kinds of voltage output by the driving chip under the modulation.
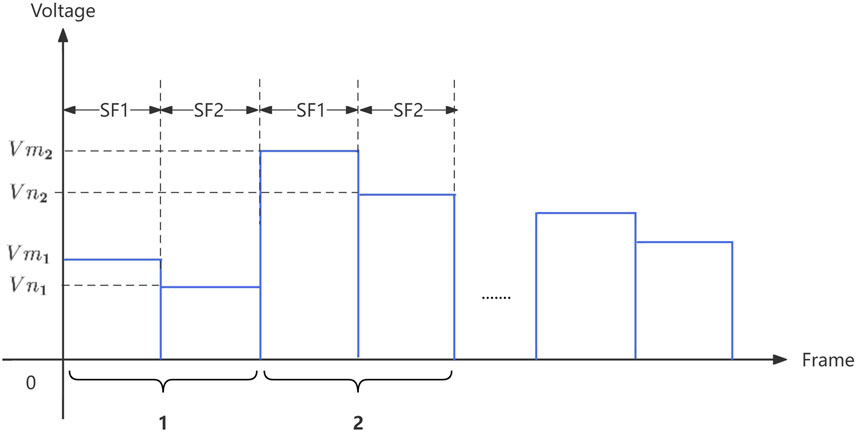
Figure 4. Driving waveform diagram designed in this paper.
Therefore, in order to achieve the gray scale of picture display up to 127, the image data is input after the following processing. Most of the image data is 8-bit RGB binary data, and the EWD used in this paper is a black-and-white monochrome display (this method is not limited to monochrome EWDs). Therefore, according to Eq. 1, the color image is converted into gray image and compressed into 7-bit binary data. Then, according to Equation 2 and (3), the processed image data can be calculated to correspond to Vm and Vn voltage levels of the subframe driving waveform. Finally, the driving chip outputs the corresponding driving waveform according to the voltage level. In order to avoid the screen flicker caused by the large difference in output luminance between the two subframes, the voltage difference between Vm and Vn is only one voltage level.
The driving waveforms of different gray levels designed in this paper are shown in Figure 5. Four gray waveforms of grayscale 1, grayscale 2, grayscale 125 and grayscale 126 are given as examples in the figure. Grayscale 0 is the off state of EWDs, which represent the all-black state.
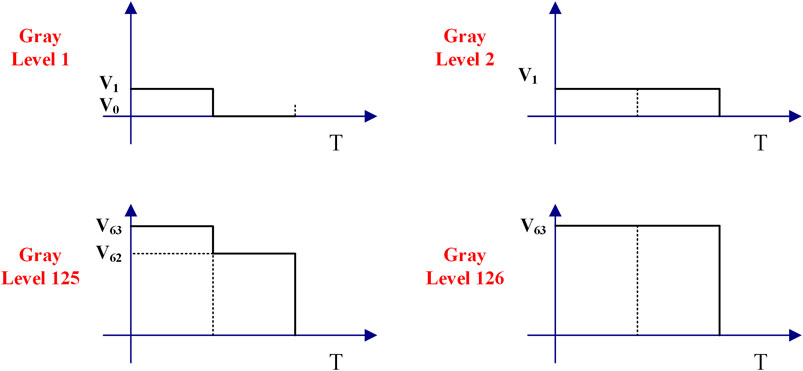
Figure 5. Example of grayscale waveform designed in this paper.
Due to the phenomenon of human vision retention, when the refresh rate of two sub-frames is greater than 24Hz, which can be distinguished by human eyes, the luminance of the picture seen by human eyes lags behind the actual luminance change. So the luminance of two sub-frames will superposition to form a new gray scale. The current driving chip UC8420 can only output 64 kinds of driving voltage amplitude, and 127 kinds of gray level can be seen in human visual effect through the driving waveform in this paper.
3 Experimental results and discussion
3.1 Test platform and hardware system
In order to verify the gray display performance of the proposed driving waveform, an optical experimental platform is established to test the image display effect. As shown in Figure 5, a microscope equipped with a high-speed camera record the EWD oil shrinkage under driving waveform, and synchronously sending the data back to the computer. The computer is responsible for processing the received images data through self-designed software to calculate the aperture ratio, response time and so on, while observing the oil movement and the final display effect. The experimental platform uses a color EWD, the main colors are cyan (C), magenta (M), yellow (Y) and three-layer superimposed color (CMY). As shown in Figure 6, the precision measuring instruments used in this paper include CS-200 luminance meter and microscope equipped with high-speed camera. The luminance meter is mainly responsible for measuring luminance of different gray scales. We built a dark room and used 4000K artificial light source to illuminate the screen at a fixed 45-degree Angle to ensure the environment remained unchanged before and after measurement. The high-speed camera is mainly to capture the state and the aperture ratio of ink shrinkage under the drive of electrowetting pixels. At the beginning of the experiment, because the human eye can not accurately determine whether the oil is shrunk, the oil movement can be visually observed through the camera, and it is known that the electrowetting driving voltage exceeds 18V will produce oil breakage, so the voltage range suitable for driving electrowetting is determined. Since both the aperture ratio and the luminance can represent the gray level, in order to avoid the inaccurate measurement results caused by different ambient light, the high-speed camera was replaced with a luminance meter, and the luminance was used to prove the difference of gray level in the dark room.
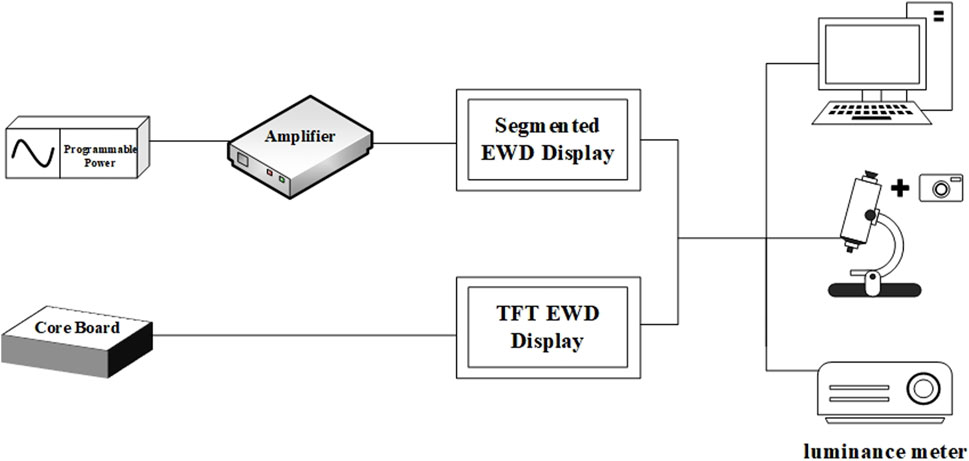
Figure 6. Architecture of the test platform for electrowetting display.
In order to meet the needs of screen size change and resolution improvement, this paper designs a driving system board suitable for EWDs. As shown in Figure 7, the system board is composed of FPGA core board, ARM core board, video codec, power module, screen interface, video signal interface, peripheral interface, debugging module and TF flash module.
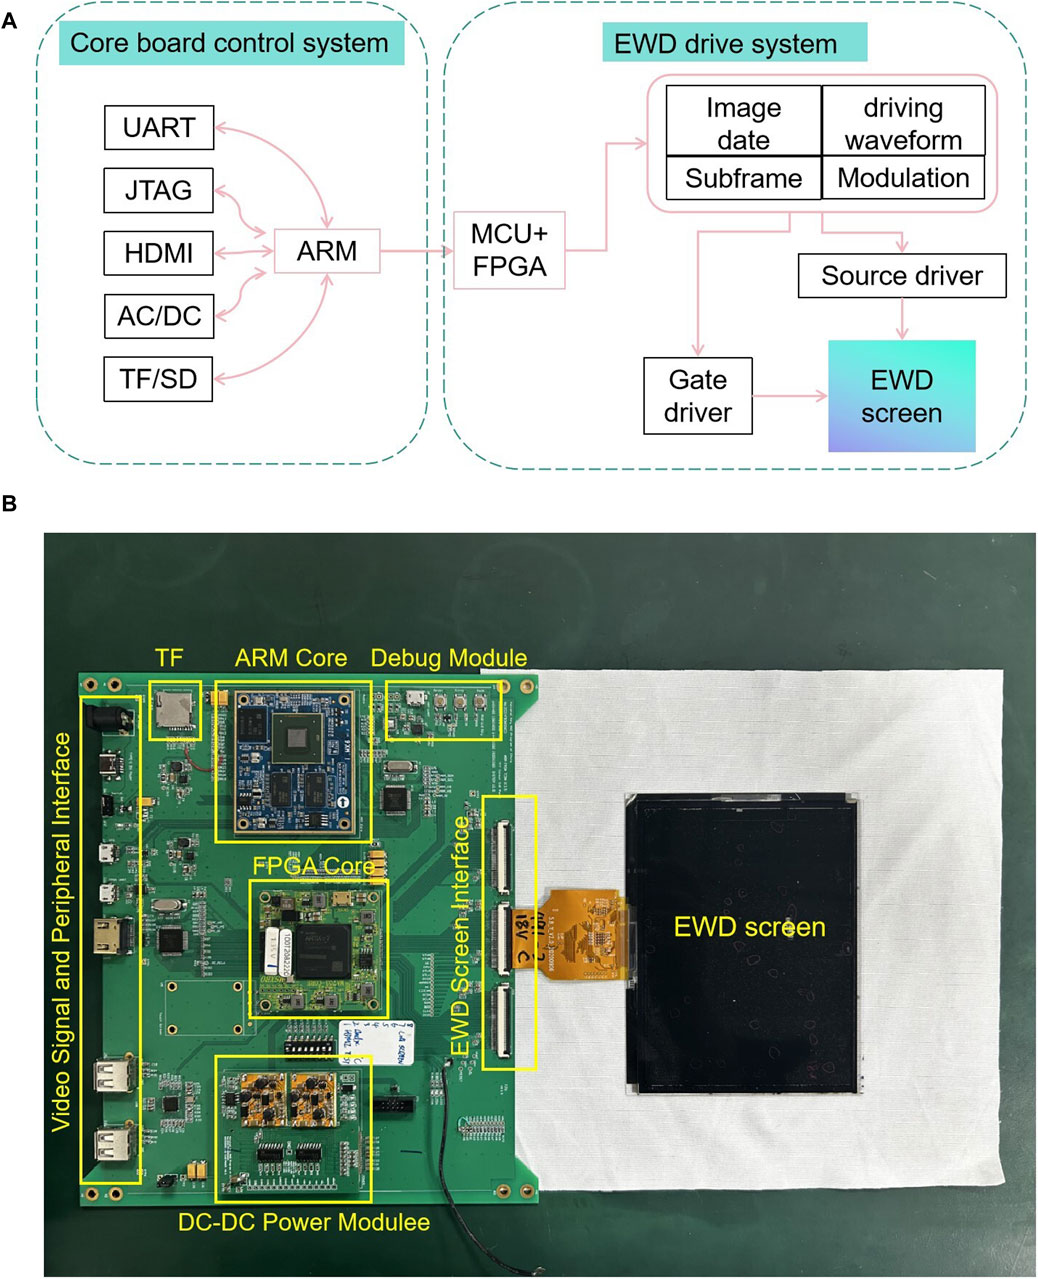
Figure 7. Electrowetting display driving system module distribution diagram. (A) Block diagram of the EWD driving system. (B) The figure of the EWD driving system.
ARM and FPGA cooperate to relieve data pressure. FPGA is responsible for parallel processing of image and video data and control of driving waveform. ARM is responsible for multi-threaded data processing, which is also responsible for video encoding and decoding, running the operating system and executing instructions. The two video codec modules interact with the FPGA and ARM respectively and are responsible for different data input modes. In addition to providing power to the core board, the power module provides variable driving voltage for the EWD screen. Because the color EWDs adopt CMY color mode, the peripheral interfaces of the main board correspond to three layers of C, M, and Y color screens respectively. HDMI data input interface and USB are added to the video signal interface and peripheral interface. Debugging module can be used to test the correctness of code instruction function. TF flash memory module can read video image data stored in SD card.
3.2 Luminance nonlinear correction
The driving waveform proposed in this paper is applied to the EWD system. The hardware of the driving system used is developed and manufactured by the team, and the EWD screen used is provided by South China Normal University. We have segmented electrowetting and TFT electrowetting. Segmented electrowetting has no driving chip, and each pixel is connected. Its interface can be directly connected to the function generator signal amplified by the power amplifier. We use the function generator instead of the driving chip output driving waveform. When the luminance meter is used to measure the luminance of the segmented electrowetting, the measurement will not be inaccurate because of the slight vibration of the luminance meter or the electrowetting pixel. When we want to display pictures and videos, we use the system board to drive the TFT display with the driving chip. The specific parameters are shown in Table 1. Test the luminance of EWDs under different gray levels driven by the driving scheme in this paper, and the specific test method is as follows. Firstly, 127 kinds of driving waveforms designed in this paper are output by function signal generator, and voltage amplifier is used to amplify the output waveform amplitude to the effective driving voltage of EWDs. The output voltage is connected to the EWD, and the luminance displayed under each driving waveform is measured with the CS-200 luminance meter. Table 1 shows the parameters of EWDs and the model of the experimental equipment used in the experiment, and the actual picture of the experiment is shown in Figure 8.

Table 1. Parameters of the EWD used in the experiment and the model of the experimental equipment.
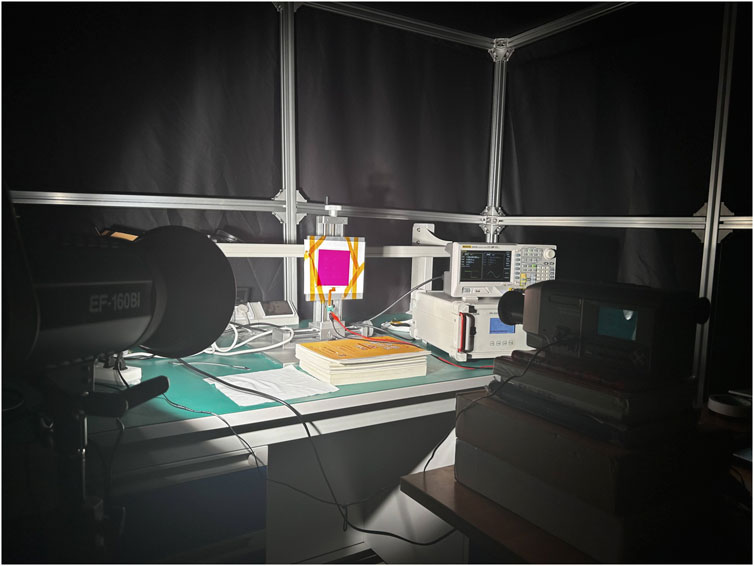
Figure 8. Physical image of luminance measurement.
The relationship between luminance and gray level after test is shown in Figure 9. As shown in Figure 9A, due to the influence of the mechanism of EWDs, the luminance of EWDs basically remains unchanged between 0 Gy and 50 Gy. It can be explained that EWD effect is less distinguishable for black, that is, when the aperture ratio reaches a certain size, even if the driving voltage is increased, the change rate of the aperture ratio gradually decreases until it becomes stable. The display luminance of the electrowetting display tends to be consistent in the low gray scale when it is not corrected, and the luminance span of the high gray scale is too large. As a result, the effect displayed to the human eye does not reach 127 Gy levels, and the overall image effect is dark.
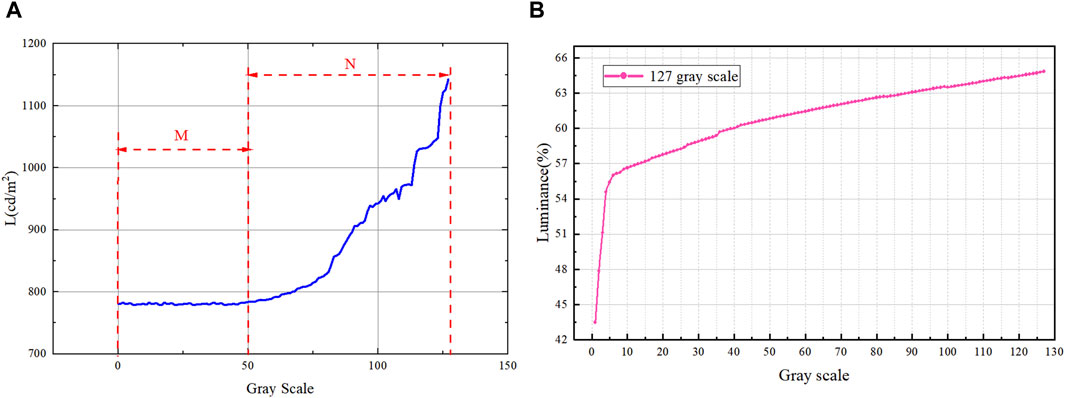
Figure 9. Photoelectric response characteristics of the electrowetting display before and after correction. (A) A gray-luminance curve before correction. (B) A corrected gray-luminance curve of 127 gray-scales.
The driving voltage difference between adjacent gray levels before correction is consistent, which can be obtained by dividing the effective driving voltage interval of EWDs by the total number of gray levels. To improve the visualization effect of the grayscale display, we perform nonlinear correction on the input voltage drive. As shown in Figure 8, we increase the driving voltage interval of the corresponding grayscale in the relatively flat luminance interval M (that is, between 0–50 grayscale), and reduce the driving voltage interval of the corresponding grayscale in the relatively steep luminance interval N (51–127 grayscale interval).
Figure 9B shows the relationship between luminance and gray scale at 127 Gy level measured. In order to determine the effective voltage range of electrowetting, we use a DC voltage source to increase from 0V to drive the screen, observe the shrinking state of the oil in the pixel through a microscope, it can be seen that the oil shrinks when the electrowetting driving voltage is greater than 10V. When the voltage is greater than 18V, the mutation voltage is too large, which will cause the oil to split. So the effective driving voltage range of this experiment is selected in 10–18V. It can be seen from the figure that the slope of the curve in linear region A is larger, that is, the first 5 Gy levels. In linear region B, it can be seen that after correction, the last 120 Gy levels have a near linear growth trend and a steady increase.
In order to verify whether all gray levels under the driving scheme in this paper reach the luminance of 127, we use an optical measuring device to measure the luminance corresponding to each gray level. As shown in Figure 10A, the experiment was repeated 5 times for each gray level and measured every 1s 15 groups of gray levels were selected from 127 Gy levels for presentation. Within 5 seconds, each grayscale luminance is basically stable. Moreover, the luminance of each gray levels increases continuously compared with that of the previous grayscale, which proves that 127 Gy levels can be achieved under the driving waveform in this paper, and there is no obvious oil backflow phenomenon. As shown in Figure 10B, we compare the luminance of the latter gray level with that of the previous gray level. It can be seen from the figure that the luminance of each gray level increases. And excluding the 5 Gy levels near the opening voltage of the electrowetting display, the luminance increase range of 96% gray level is 0.07 on average.
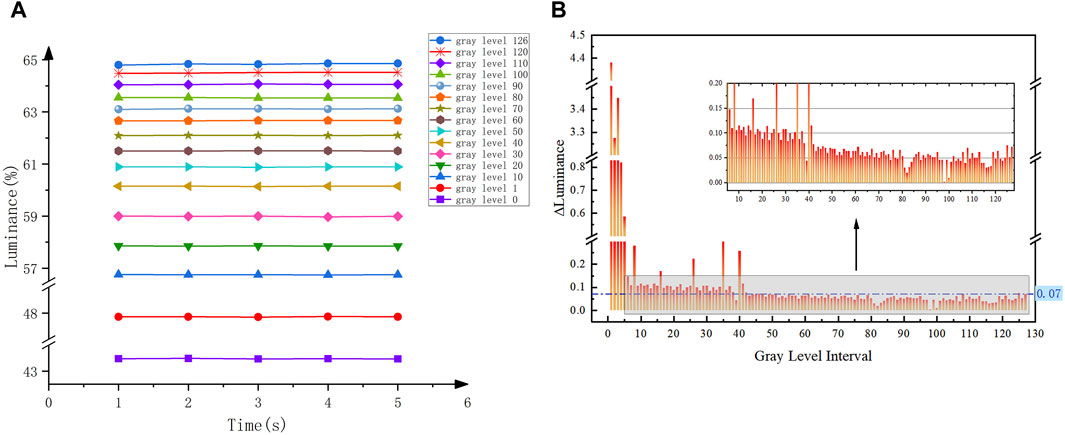
Figure 10. Luminance relationship of gray scale after correction. (A) Luminance of some gray scales after correction. (B) Luminance difference between adjacent gray scales after correction.
3.3 Display effect of driving waveform on screen verification
In this paper, a 648 × 480 resolution black and white EWD driving system is used to verify the display effect of the waveform and correction method proposed in this paper. The specific parameters are shown in Table 2.

Table 2. Related parameters of the EWD panel used for testing.
The picture is processed and displayed by the driving system to verify the display effect, as shown in Figure 11. Figure 11A is the original image on the PC, and Figure 11B is the display effect of the orangutan image on the screen before processing. The unimproved driving system is theoretically limited by the driving chip and can only output 64 Gy scales at the highest, and the actual display effect is not good. The overall brightness of the picture is dark. The luminance of the orangutan’s nose is black, and it is not recognizable. The pupil of the eye tends to be the same color and the boundary is blurred. However, the orangutan picture after the designed driving waveform driving and nonlinear correction is shown in Figure 11C. Compared with Figure 11B, the number of low gray scales is significantly reduced, and the display of medium gray scales is more obvious and uniform. Compared with Figure 11A, the display of low gray scale is not lost, and it is more similar to the original image. The outline of the orangutan’s nostrils is clear, and the luster is obvious, making the orangutan more three-dimensional. The pupil of the eye alternates between light and dark, and the boundary is clear. The fine lines around the eyes are clearer. The whole picture is clearly detailed. The grayscale is increased and the display is better. Through verification, the driving method in this paper is suitable for the EWD system. The algorithm not only improves the gray level, but also enhances the detail information and improves the display effect.
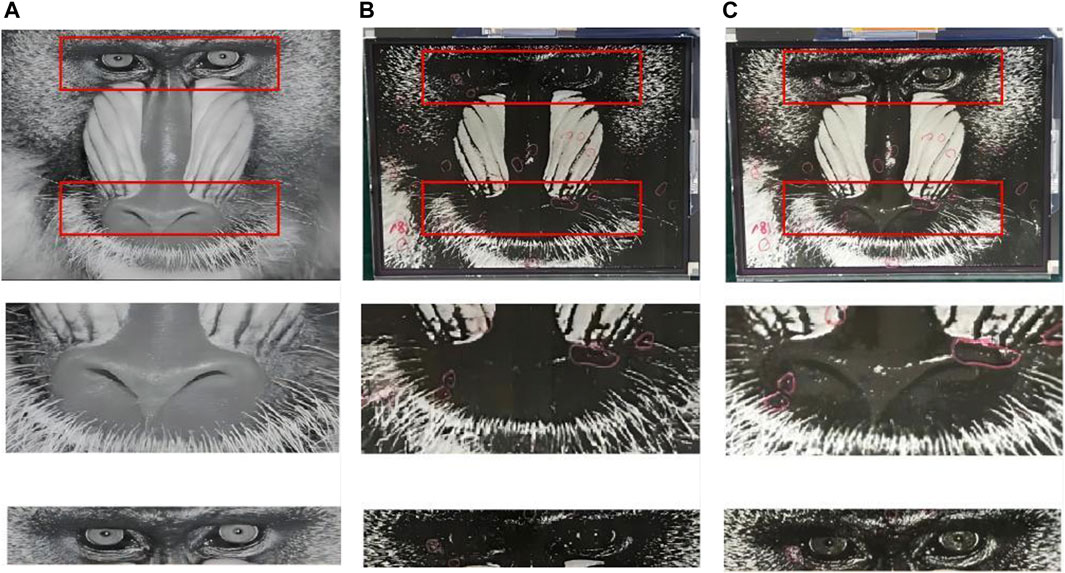
Figure 11. Comparison of the chimpanzee picture display effect of black and white electrowetting display. (Small red circle is bad spot on the screen.) (A) Original image on PC. (B) Figure on the EWD before correction. (C) Figure on the EWD after correction.
4 Summary
In this paper, a driving method for gray scale multiplication of electrowetting display based on hybrid modulation was proposed. A hybrid modulation scheme of PAM and PWM was proposed, and a driving waveform which is suitable for EWDs and can improve the gray level was designed by using human visual phenomenon. In this paper, firstly, we analyzed the luminance of EWDs driven by the driving waveform proposed and obtained the nonlinear curve. Secondly, in view of the shortcomings of EWDs nonlinear luminance, the display effect of 127 Gy scale was achieved by adjusting the driving voltage for correction. Through the luminance test of each gray scale, the average luminance difference is 0.07. The enhancement of gray scale makes the image more exquisite, and the gray scale of the image is more uniform after nonlinear correction. In the future, whether the driving chip changes or not, the driving waveform proposed in this paper can be applied to EWDs. At the same time, the nonlinear causes of EWDs can be deeply explored in the future to provide guidance for more accurate drive of EWDs.
Data availability statement
The original contributions presented in the study are included in the article, further inquiries can be directed to the corresponding author.
Author contributions
TM: Writing–original draft, Writing–review and editing. ZL: Writing–review and editing. ZX: Writing–review and editing. SL: Writing–review and editing. BC: Writing–review and editing. MC: Writing–review and editing. TG: Writing–review and editing.
Funding
The author(s) declare that financial support was received for the research, authorship, and/or publication of this article. This work is supported by the National Key R&D Program of China (2021YFB3600603), the Natural Science Foundation of Fujian Province (2020J01468), and National Natural Science Foundation of China Youth Foundation (No. 62101132).
Conflict of interest
The authors declare that the research was conducted in the absence of any commercial or financial relationships that could be construed as a potential conflict of interest.
Publisher’s note
All claims expressed in this article are solely those of the authors and do not necessarily represent those of their affiliated organizations, or those of the publisher, the editors and the reviewers. Any product that may be evaluated in this article, or claim that may be made by its manufacturer, is not guaranteed or endorsed by the publisher.
References
1. Lee S-M, Kwon JH, Kwon S, Choi KC. A Review of flexible OLEDs toward highly durable unusual displays. IEEE Trans Electron Devices (2017) 64(5):1922–31. doi:10.1109/TED.2017.2647964
2. Han J-W, Hwang M-C, Kim S-G, You T-H, Ko S-J. Vector quantizer based block truncation coding for color image compression in LCD overdrive. IEEE Trans Consumer Electron (2008) 54(4):1839–45. doi:10.1109/TCE.2008.4711243
3. Bai P, Hayes R, Jin M, Shui L, Yi Z, Wang L, et al. REVIEW of PAPER-LIKE display technologies (invited review). Progr Electromagn Res (2014) 147:95–116. doi:10.2528/PIER13120405
4. Hayes RA, Feenstra BJ. Video-speed electronic paper based on electrowetting. Nature (2003) 425(6956):383–5. PMID: 14508484. doi:10.1038/nature01988
5. Qian M, Lin S, Zeng S, Lin Z, Guo T, Tang B. Real-time dynamic driving system implementation of electrowetting display. Opto-electronic Eng (2019) 46(6):180623. doi:10.12086/oee.2019.180623
6. Heikenfeld J, Zhou K, Kreit E, Raj B, Yang S, Sun B, et al. Electrofluidic displays using Young-Laplace transposition of brilliant pigment dispersions. Nat Photon (2009) 3(5):292–6. doi:10.1038/nphoton.2009.68
7. You H, Steckl AJ. Three-color electrowetting display device for electronic paper. Appl Phys Lett (2010) 97(2):023514. doi:10.1063/1.3464963
8. Hayes RA, Feenstra BJ, Camps IGJ, Hage LM, Roques-Carmes T, Schlangen LJM, et al. 52.1: a high brightness colour 160 PPI Reflective display technology based on electrowetting. SID Symp Dig (2004) 35(1):1412–5. doi:10.1889/1.1825770
9. Massard R, Mans J, Adityaputra A, Leguijt R, Staats C, Giraldo A. Colored oil for electrowetting displays. J Inf Display (2013) 14(1):1–6. doi:10.1080/15980316.2012.751939
10. Heikenfeld J, Drzaic P, Yeo J-S, Koch T. Review Paper: a critical Review of the present and future prospects for electronic paper. J Soc Inf Display (2011) 19(2):129–56. doi:10.1889/JSID19.2.129
11. Giraldo A, Aubert J, Bergeron N, Li F, Slack A, Weijer M. Transmissive electrowetting-based displays for portable multi-media devices. Sid Sympos Dig Techn Pap (2012) 40:479–82. doi:10.1889/1.3256820
12. Beni G, Hackwood S. Electro-wetting displays. Appl Phys Lett (1981) 38:207–9. doi:10.1063/1.92322
13. Xie N, Zhang N, Xu R. Effect of driving voltage polarity on dynamic response characteristics of electrowetting liquid lens. Jpn J Appl Phys (2018) 57:052201. doi:10.7567/JJAP.57.052201
14. Yi Z, Feng H, Zhou X, Shui M. Design of an open electrowetting on dielectric device based on printed circuit board by using a parafilm M. Front Phys (2020) 8:193. doi:10.3389/fphy.2020.00193
15. Liu L, Wu Z, Wang L, Zhang T, Li W, Lai S, et al. Design of an AC driving waveform based on characteristics of electrowetting stability for electrowetting displays. Front Phys (2020) 8:618752. doi:10.3389/fphy.2020.618752
16. Lai S, Zhong Q, Sun H. Driving waveform optimization by simulation and numerical analysis for suppressing oil-splitting in electrowetting displays. Front Phys (2021) 9:720515. doi:10.3389/fphy.2021.720515
17. Tian L, Bai P. A combined pulse driving waveform with rising gradient for improving the aperture ratio of electrowetting displays. Front Phys (2021) 9:709151. doi:10.3389/fphy.2021.709151
18. Zeng W, Yi Z, Zhao Y, Wang L, Zhang J, Zhou X, et al. A driving method for reducing oil film splitting in electrowetting displays. Membranes (2021) 11(12):920. doi:10.3390/membranes11120920
19. Yi Z, Feng W, Wang L, Liu L, Lin Y, He W, et al. Aperture Ratio improvement by optimizing the voltage slope and Reverse pulse in the driving waveform for electrowetting displays. Micromachines (2019) 10(12):862. doi:10.3390/mi10120862
20. Yi Z, Liu L, Wang L, Li W, Shui L, Zhou G. A driving system for fast and precise gray-scale response based on amplitude-frequency mixed modulation in TFT electrowetting displays. Micromachines (2019) 10(11):732. doi:10.3390/mi10110732
21. Yi Z, Huang Z, Lai S, He W, Wang L, Chi F, et al. Driving waveform design of electrowetting displays based on an exponential function for a stable grayscale and a short driving time. Micromachines (2020) 11(3):313. doi:10.3390/mi11030313
22. Zhang T, Deng Y. Driving waveform design of electrowetting displays based on a reset signal for suppressing charge trapping effect. Front Phys (2021) 9:672541. doi:10.3389/fphy.2021.672541
Keywords: electrowetting display, driving waveform, gray scale, PWM, PAM, hybrid modulation, nonlinearity
Citation: Mei T, Lin Z, Xie Z, Lin S, Cai B, Chen M and Guo T (2024) A driving method for gray scale multiplication of electrowetting display based on hybrid modulation. Front. Phys. 12:1386889. doi: 10.3389/fphy.2024.1386889
Received: 16 February 2024; Accepted: 08 April 2024;
Published: 22 April 2024.
Edited by:
Xinzhong Li, Henan University of Science and Technology, ChinaReviewed by:
Preeti Gupta, Leibniz Institute for Solid State and Materials Research Dresden (IFW Dresden), GermanyZichuan Yi, University of Electronic Science and Technology of China, China
Copyright © 2024 Mei, Lin, Xie, Lin, Cai, Chen and Guo. This is an open-access article distributed under the terms of the Creative Commons Attribution License (CC BY). The use, distribution or reproduction in other forums is permitted, provided the original author(s) and the copyright owner(s) are credited and that the original publication in this journal is cited, in accordance with accepted academic practice. No use, distribution or reproduction is permitted which does not comply with these terms.
*Correspondence: Zhixian Lin, lzx2005000@163.com