Terawatt-class femtosecond long-wave infrared laser
 Igor. V. Pogorelsky
 Mikhail N. Polyanskiy
 Marcus Babzien
  Mark A. Palmer
- Accelerator Test Facility, Accelerator Technology Research Office, Brookhaven National Laboratory, Upton, NY, United States
We utilized a nonlinear post-compression technique to generate 675-fs, 9.2-μm CO2 laser pulses with a peak power of 1.6 TW. This achievement represents the highest peak power ever attained in the femtosecond pulse format within the long-wave infrared (LWIR) spectral range. The successful implementation of this post-compression technique opens avenues for the development of few-cycle, multi-terawatt 9–10 μm lasers, crucial for applications currently relying on near-infrared solid-state lasers, and which stand to benefit from the scaling of laser wavelengths into the long-wave infrared region.
1 Introduction
The favorable wavelength scaling makes high-peak-power lasers operating in the long-wave infrared (LWIR) spectral range (8–15 µm) attractive for numerous strong-field applications, including various promising schemes for laser-driven electron and ion acceleration [1–3], high-brilliance x-ray sources [4], energy transport through the atmosphere [5] and terahertz sources [6]. Carbon Dioxide (CO2) gas lasers currently stand as the sole sources capable of providing LWIR pulses exceeding terawatt peak powers.
The highest reported peak power with single-beam CO2 lasers is 15 TW, achieved with 3-ps pulses emitted at a 10.6 µm wavelength in a multi-pulse train format shaped by rotational modulation of the gain spectrum [7]. By suppressing such modulation through the utilization of high-pressure, multi-isotope laser mediums in conjunction with the implementation of chirped pulse amplification (CPA) techniques, we previously attained a peak power of 5 TW in a single 2 ps pulse at λ = 9.2 µm, marking the highest peak power for LWIR lasers operating in a single-pulse format. This innovative approach was pioneered in a more compact laser system operated at the BNL Accelerator Test Facility (ATF) for multi-disciplinary user experiments [8]. However, achieving strongly relativistic regimes of laser-matter interaction, including laser wakefield acceleration of electrons, necessitates reducing the laser pulse duration to 500 fs or shorter and increasing the peak power beyond 10 TW [4].
Paul Corkum first observed the compression of millijoule, picosecond, LWIR pulses to approximately 600 fs in a high-pressure CO2 regenerative laser amplifier [9]. This phenomenon has been attributed to the spectral broadening of the pulse through self-phase modulation (SPM) in the amplifier’s discharge plasma, followed by its compression due to negative group velocity dispersion (GVD) in the NaCl windows of the amplifier. However, this approach is not compatible with the CPA method, which is essential for amplifying CO2 laser pulses to the joule level and beyond.
Well-established for NIR CPA lasers, post-compression methods are based on utilizing the SPM approach by the Kerr effect in an optical material or a gas-filled capillary [10–12]. Positioned along the path of a laser beam, such a nonlinear optical component serves as a bandwidth expander, imposing quasi-linear frequency modulation across the pulse’s temporal envelope. The resulting, usually positive, frequency chirp allows for further pulse compression by a diffraction grating, a chirped mirror, or simply by using an optical material with negative GVD. Following this approach, controllable sub-picosecond post-compression has been experimentally explored in the mid-wave infrared at λ = 3.1 µm [13] and λ = 3.9 µm [14], and theoretically in the LWIR at λ = 10 µm [15–17].
Numerical simulations have suggested the possibility of compressing 2.5 ps, 500 GW CO2 laser pulses down to 250 fs, with the peak power raised up to 2.2 TW using the nonlinear and dispersive properties of bulk NaCl crystals [15]. This proposed regime has been experimentally explored at the ATF, where spikes as short as 130 fs were recorded after the propagation of a 1-TW, 2-ps, λ = 9.2 µm CO2 laser beam through a 10-cm thick NaCl slab. In this experiment, we validated our simulation model that predicts such behavior [18], but also discovered micro-filamentation within the NaCl slab that disrupts the output beam uniformity. This prompted us to search for a better combination of materials that would allow us to improve pulse compression by partly separating the post-compression process into two consecutive SPM and dispersive compression (DC) steps.
Such implementation required detailed knowledge of the response of a broad class of optical materials to high laser power at LWIR wavelengths, which remained largely unknown at the time. Our search for candidate materials included measurements of a nonlinear refractive index,
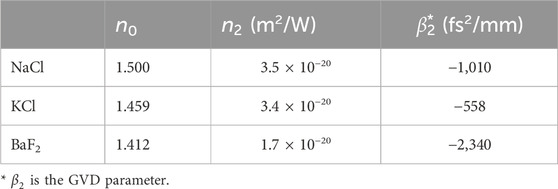
Table 1. Optical material properties at λ = 9.2 µm.
By selecting KCl as a material with high
In the reported experiment, we employ a similar two-component post-compression technique to the entire several-joule, 2-ps CO2 laser beam. Autocorrelation measurements at the output of the post-compressor reveal gradual pulse compression with increasing input laser energy, with the shortest measured pulse reaching 675 fs. This separated short spike contains 1.3 J of energy, resulting in a peak power of 1.6 TW, marking the advent of the next-generation of high-power femtosecond laser sources in the long-wave infrared (LWIR) spectral domain. A simulation model [20], benchmarked to our observations, predicts the capability of further optimizing this compression scheme to achieve 4.5 TW in 500 fs.
The remainder of this paper is organized as follows: We describe our experimental setup in Section 2, present results in Section 3, discuss them in Section 4, and conclude in Section 5.
2 Experimental setup
In the reported experiment, we utilized the ATF’s multi-terawatt picosecond CO2 laser setup, which comprises an optical parametric amplifier front end, a diffraction grating stretcher, a multi-pass regenerative laser amplifier, and a six-pass booster amplifier, along with a diffraction grating compressor [8]. Both laser amplifiers utilize a high-pressure isotopic CO2 gas active medium pumped by high-voltage electric discharge. The output beam, limited by the 10-cm diameter amplifier’s output window, is further expanded and collimated to fit the 16-cm vertical aperture of diffraction gratings in the compressor. The laser produces a 2-ps full-width-half-maximum (FWHM) pulse with variable energy of up to 10 J, centered at the 9.2 µm wavelength.
We build this experiment upon our preliminary analysis and modeling, which predicted that a 3-TW, 2-ps CO2 laser pulse could be compressed to approximately 500 fs at close to 5 TW peak power after passing through an optical setup depicted in Figure 1. As demonstrated in our earlier studies [18, 19], eliminating small-scale intensity modulations across the laser beam profile is crucial for controlling the post-compression process. To achieve this, a BaF2 lens and a pinhole constitute a spatial filter. The selection of KCl and BaF2 as the SPM and DC components, respectively, is based on their combination of the nonlinear refractive index (

Figure 1. Optimum configuration for a CO2 laser pulse compression from 2 ps to 500 fs.
Efforts have been made to construct our experimental setup according to this model. However, real-life restrictions, such as manufacturer’s capabilities and space limitations within an in-vacuum transport line primarily purposed for delivering a 2-ps LWIR laser beam to user experiments, prompted certain alterations from the intended design. These alterations are visible when comparing Figure 1 with Figure 2, which represents our actual experimental setup.
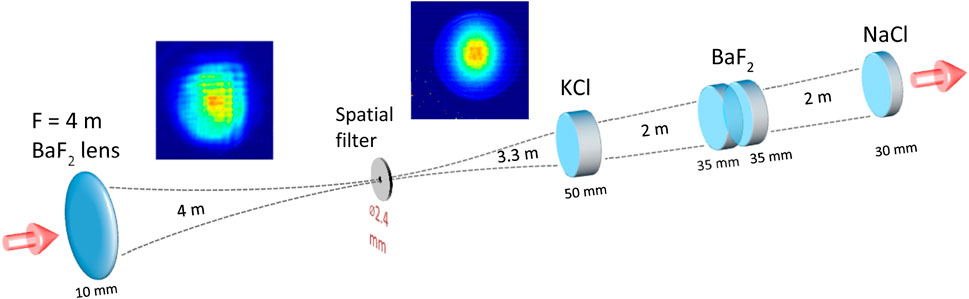
Figure 2. Actual post-compressor setup: inserted images illustrate the LWIR beam profiles before and after a spatial filter.
A 2-ps, λ = 9.2 µm beam with a variable input energy,
The laser beam, expanding over 3.3 m after passing through the pinhole, traverses a 50-mm-thick KCl slab serving as the SPM component. After further expansion over 2 m, the beam encounters two 35-mm-thick BaF2 slabs serving as primary in-line DC elements. Not depicted in the scheme is a wedged NaCl Fresnel reflector redirecting a small percentage of the beam through a 30-mm-thick NaCl window, extracting it from the vacuum transport line for diagnostics. The remaining beam energy is terminated behind the Fresnel reflector.
An imaging lens with a 100 mm optical aperture in the beam diagnostics setup restricts the acceptance of the laser beam, which continues to expand after the spatial filter. This is one of the limiting factors considered when processing our experimental results.
In the experiment, the following laser characteristics were monitored: laser energy, measured with a pyroelectric joulemeter (Gentec-EO QE95); pulse duration, measured with a single-shot autocorrelator; spectrum bandwidth, measured with a grating spectrometer; and beam profile, observed with a pyroelectric array beam profiler (Ophir Spiricon Pyrocam IV). The same pyroelectric array was used for obtaining images from the autocorrelator and spectrometer. The designs of the home-made autocorrelator and spectrometer have been described elsewhere [20].
3 Experimental results
3.1 Beam profiles
As previously emphasized, spatial filtering of a laser beam is crucial for controlling the post-compression process. Beam profile images in Figure 2, obtained with a pyroelectric camera, illustrate the effect of spatial filtering. A larger collection of beam profile images in Figure 3, registered after the post-compressor, demonstrates the effect of beam diameter expansion as
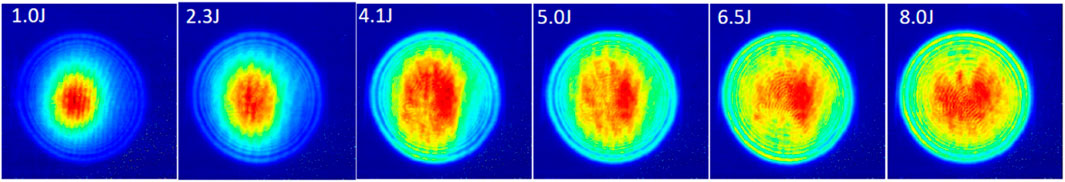
Figure 3. Individually normalized beam profiles at the output of the post-compression setup registered by a pyroelectric camera. Energy labels correspond to
This behavior is further explored in Figure 4, which shows azimuthally averaged beam profiles imaged from the plane 1 m behind the BaF2 slabs, with the radial scale geometrically interpolated to the location of the KCl slab. We observe the evolution from Gaussian to super-Gaussian beam profiles as laser energy increases. At high laser energies, the peak intensity reaches saturation while the beam profiles continue to expand in their cross-section. The limited aperture of the collection optics, which included the 100 mm diameter imaging lens, prevents us from observing peripheral portions of these beams, explaining the sharp edges on the beam profiles in Figure 3 and Figure 4.
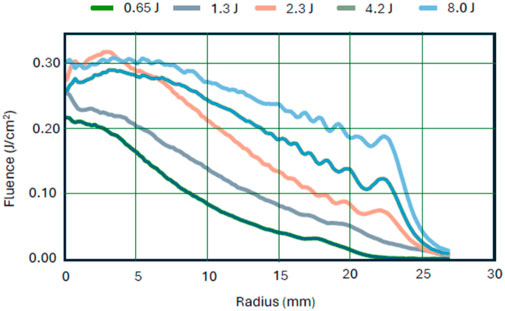
Figure 4. Azimuthally averaged radial intensity distributions at the location of the KCl SPM component. Energy labels indicate
The fluence calibration was initially performed for low-energy beams, which fit into the acceptance aperture, by comparing the integrated signal on a pyro-camera with the
To estimate the collection efficiency of the imaging system for high-energy beams that do not fit into the observation field, we plot the dependence of the integrated signal (energy equivalent) collected by the pyroelectric camera on the input laser energy,
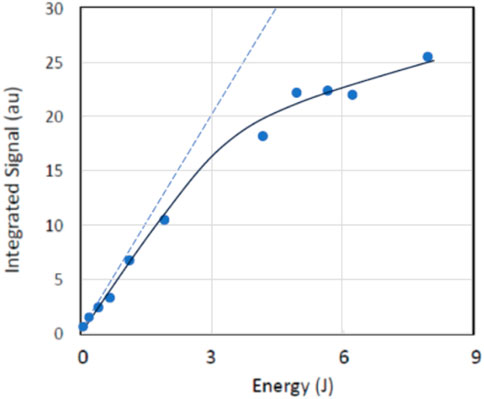
Figure 5. Experimental dependance of the integrated signal (energy collected after the post-compressor) upon the input energy,
3.2 Spectral broadening
Laser spectra before and after post-compression have been measured with an 8 nm resolution using a single-shot, slit-less spectrometer [21]. Typical spectra observed at low and high laser energies are shown in Figure 6.
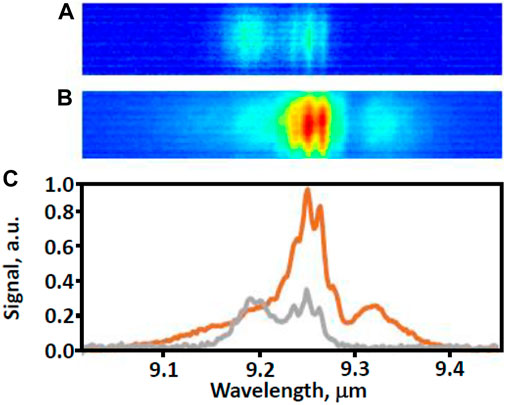
Figure 6. Spectra recorded at (A) low laser energy (
The fine structure in the spectra is attributed to rotational modulation of the gain spectrum in the CO2 laser amplifiers [21]. Spectral broadening observed at high laser energy is primarily due to frequency chirping induced by the KCl slab and partly by the BaF2. Because of the limited acceptance aperture of the spectrometer, spectra measured at
3.3 Pulse duration
In a single-shot autocorrelator utilizing a 10 mm diameter, 1 mm-thick AgGaSe2 crystal [21], a relative tilt introduced between the wave fronts of two split beams results in a linear variation in their relative time delay across the crystal. Consequently, a transverse profile of the λ = 4.6 µm sum-frequency signal reflects the temporal autocorrelation of the laser pulse intensity. The time resolution is contingent upon the angle between the beams, optical magnification, and the pixel size of the pyroelectric array. In our setup, the time resolution of the autocorrelation measurements was approximately 100 fs.
The autocorrelation measurements illustrated by Figure 7 reveal that the pulse duration decreases with an increase in
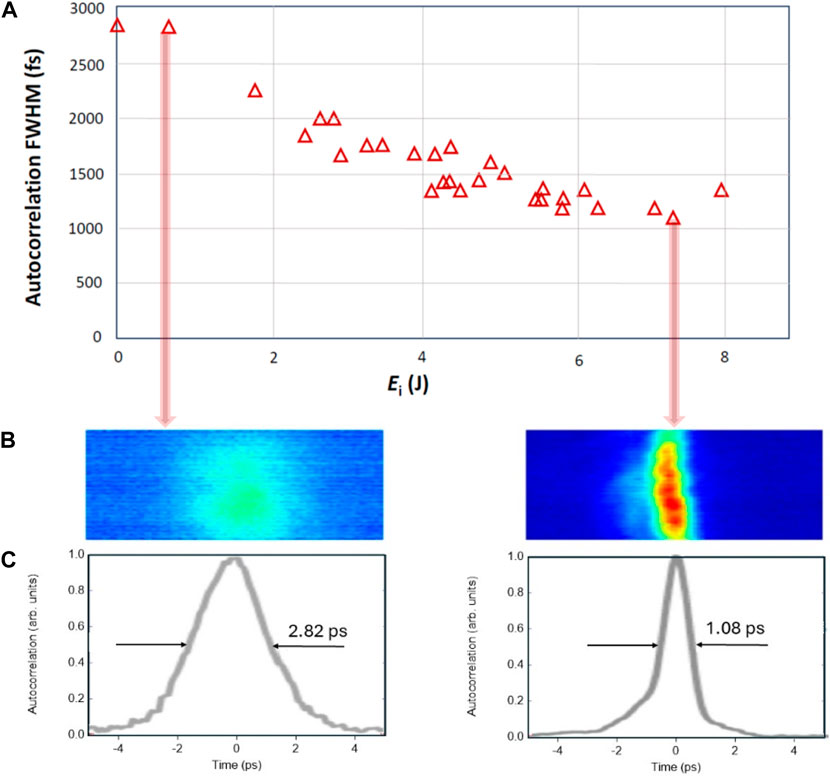
Figure 7. The dependence of the autocorrelation full-width-half-maximum (FWHM) on
Note, however, that due to the limited aperture of the AgGaSe2 crystal, the autocorrelator accepted only a central portion of the beam profiles presented in Figure 4, within a circle of 30 mm diameter.
4 Discussion
Let’s begin by comparing our experimental results with dedicated modeling simulations conducted for the actual configuration of the experiment. Firstly, we observe a close agreement between the experimental data (Figure 7) and simulated results (Figure 8A) for the autocorrelation curves. In contrast to the experiment, where we deduce the laser pulse duration from its measured autocorrelation function, in simulations, we perform this process in reverse order. Initially, we model the pulse evolution through a post-compressor. Subsequently, we extract from simulations the temporal profile and its autocorrelation function for a portion of the beam propagating through the 30 mm aperture (the autocorrelator acceptance). This operation yielded the aforementioned coefficient
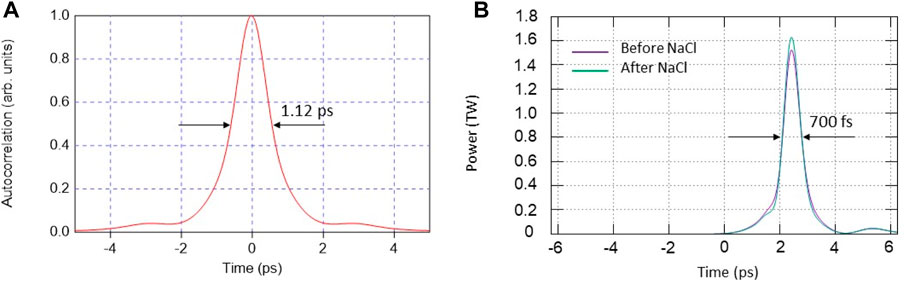
Figure 8. Autocorrelation function (A) and the compressed pulse shape (B) at
To calculate the energy in the compressed laser pulse, we account for 40% losses of the laser beam energy as it propagates through the post-compressor’s optical components due to Fresnel reflection on optical surfaces and absorption (in BaF2). The transmitted 60% of
For a Gaussian pulse, the peak power would be
Thus far, we have verified the agreement between our measurements and simulations for a portion of the beam within the 30 mm aperture. Such benchmarking enhances our confidence in using our model for simulating the entire beam evolution. Figure 9A presents the results of these simulations, demonstrating the entire laser pulse compression to 1.2 ps at 2.5 TW peak power. This outcome appears to be less impressive than our earlier prediction illustrated by Figure 9B, where the same simulation program was applied to the post-compressor configuration shown in Figure 1.
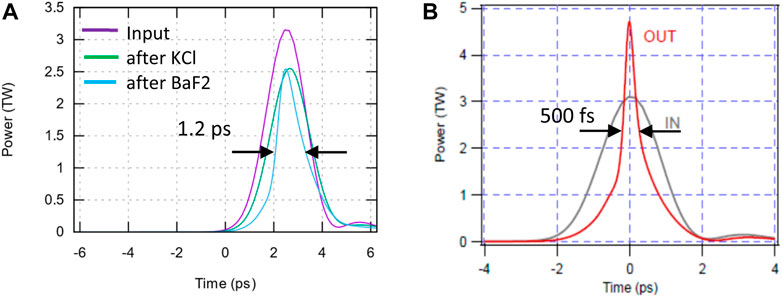
Figure 9. Simulated 2-ps pulse compression at
To understand the difference in performance, let’s estimate the stretching and compression capabilities for two cases: one shown in Figure 1 (ideal setup) and the other in Figure 2 (actual setup).
The self-induced phase shift across a collimated laser beam with intensity
Then, the induced frequency sweep over the laser pulse envelope is given by:
Approximating the top portion of a Gaussian pulse with a parabola, we obtain a linear chirp with the maximum frequency excursion:
Comparing this with the expression for B-integral:
For the actual case and an input laser energy of 7.2 J, precise simulations accounting for pulse evolution over the optical components of the post-compressor reveal laser peak intensities of 1.82 × 10¹⁵ W/cm2 on the KCl slab, 7.18 × 10¹⁴ W/cm2 on the first BaF2 slab, and 9.74 × 10¹⁴ W/cm2 on the second BaF2 slab. In this setup, KCl emerges as the primary contributor to the aggregate B-integral, reaching B = 3.16. Meanwhile, in the ideal case, simulated laser intensities peak at 2.59 × 10¹⁵ W/cm2 on KCl and 2.65 × 10¹⁵ W/cm2 on BaF2. Notably, pulse compression in BaF2 results in this element contributing nearly equally to the cumulative B-integral, which reaches B = 6.19. Correspondingly, simulated compressed pulse spectra appear wider for the ideal case, as is illustrated in Figure 10A. Furthermore, there is a notable alignment between the experimental and simulated spectra for the actual scenario, as depicted in Figure 10B, although fine structure is somewhat obscured due to the limited resolution of the spectrometer.
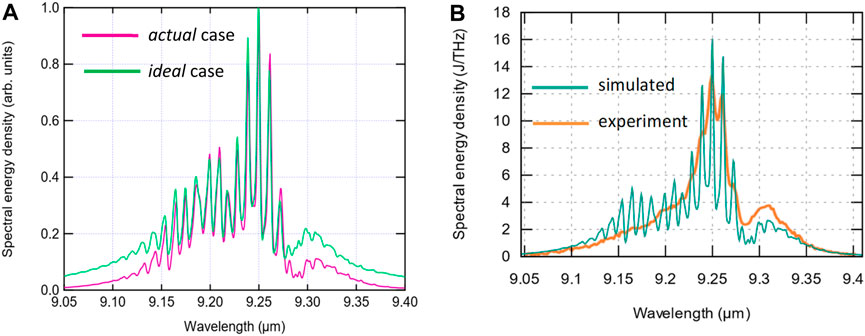
Figure 10. Simulated and experimental spectral broadening of the laser pulse due to post-compressor action: (A) Simulated spectra for actual and ideal cases integrated over the entire beam; (B) Experimental spectrum compared to the simulated spectrum integrated over the acceptance aperture of the spectrometer.
As for dispersive compression, we shall consider values of
For an ideal simulated case, the
Notably, the maximum compression of a spectrally broadened, frequency-chirped pulse will be achieved when we introduce a relative delay to the leading portion of the chirped pulse such that the tail of the pulse catches up the head. This is achieved when
Note that in all our analytical estimates and simulations, we used the material data listed in Table 1.
5 Conclusion
In this study, we delve into the application of nonlinear post-compression techniques to CO2 laser pulses, aiming to achieve high peak powers within the LWIR range. Our innovative methodology involves leveraging KCl for self-modulation and BaF2 for dispersive compression, coupled with spatial filtering, ensuring consistent and reliable pulse compression across a wide spectrum of input laser energies. In our post-compression experiment, we achieved a significant breakthrough of high-power LWIR laser technology into sub-picosecond time domain by demonstrating 675 fs laser pulses at λ = 9.2 µm with supra-TW (1.6 TW) peak power for the first time.
The striking agreement between measured and simulated parameters allows us to utilize our model to extract crucial pulse characteristics, such as pulse duration and peak power, integrated over the entire beam. These parameters, though not directly measurable, are pivotal for comprehending and optimizing laser performance. Moreover, the comparison between experimental results and simulations, augmented by analytical insights, underscores the potential for substantial improvement in post-compression beyond the achieved results. By strategically repositioning our optical components, we envision further enhancing the compression process to attain even higher peak powers and shorter pulse durations, ushering in new horizons in LWIR laser technology.
With our validated model, we can confidently apply it to design subsequent iterations of the nonlinear post-compressor, customized to specific requirements. An illustrative example of such advancement is depicted in Figure 11, where we propose a scheme for compressing 2-ps, 9.2-μm laser pulses down to 150 fs. Our findings confirm that the post-compression method represents a viable approach for generating multi-terawatt LWIR pulses with only a few optical cycles.
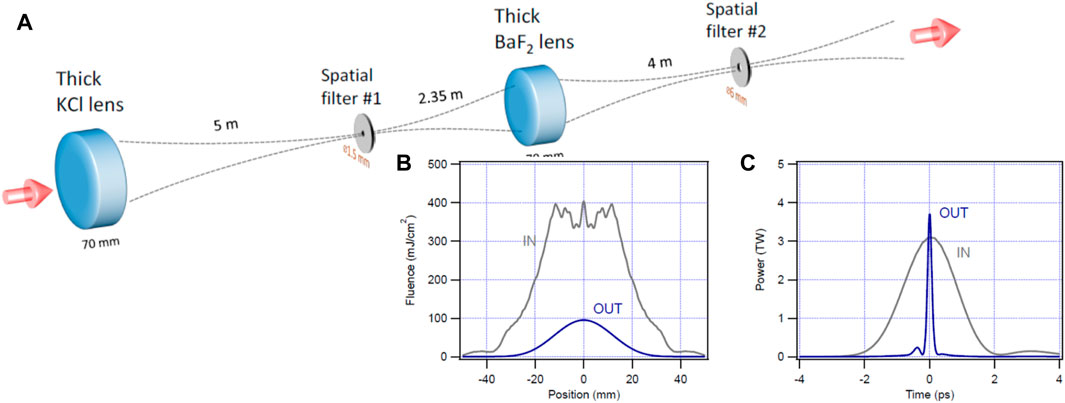
Figure 11. Proposed scheme for LWIR pulse post-compression to 150 fs (A); simulated fluence before and after the post-compressor (B); simulated pulse before and after the post-compressor (C).
In conclusion, we have successfully implemented a nonlinear post-compression technique to achieve high-peak-power femtosecond laser pulses in the LWIR spectral range. Through our experimental and simulated analyses, we gained valuable insights into the pulse compression mechanism, emphasizing the importance of accurate modeling in optimizing laser performance. These findings contribute significantly to the development of high-power ultra-fast LWIR lasers across various applications, promising advancements in fields such as laser-driven particle acceleration and atmospheric remote sensing.
Data availability statement
The original contributions presented in the study are included in the article/Supplementary material, further inquiries can be directed to the corresponding author.
Author contributions
IP: Conceptualization, Data curation, Formal Analysis, Investigation, Methodology, Writing–original draft, Writing–review and editing. MB: Methodology, Resources, Writing–review and editing. AS: Methodology, Resources, Writing–review and editing. MP: Funding acquisition, Project administration, Supervision, Validation, Writing–review and editing. MNP: Conceptualization, Formal Analysis, Methodology, Software, Validation, Writing–review and editing.
Funding
The author(s) declare that financial support was received for the research, authorship, and/or publication of this article. This work is funded by the U.S. Department of Energy under contract DE-SC0012704, BNL Laboratory Directed Research and Development grant #20-010, and DOE Program grant B&R #KA2601020.
Conflict of interest
The authors declare that the research was conducted in the absence of any commercial or financial relationships that could be construed as a potential conflict of interest.
The author(s) declared that they were an editorial board member of Frontiers, at the time of submission. This had no impact on the peer review process and the final decision.
Publisher’s note
All claims expressed in this article are solely those of the authors and do not necessarily represent those of their affiliated organizations, or those of the publisher, the editors and the reviewers. Any product that may be evaluated in this article, or claim that may be made by its manufacturer, is not guaranteed or endorsed by the publisher.
References
1. Yu LL, Esarey E, Schroeder CB, Vay JL, Benedetti C, Geddes CGR, et al. Two-color laser-ionization injection. Phys Rev Lett (2014) 112:125001. doi:10.1103/PhysRevLett.112.125001
2. Haberberger D, Tochitsky S, Fiuza F, Gong C, Fonseca RA, Silva LO, et al. Collisionless shocks in laser-produced plasma generate monoenergetic high-energy proton beams. Nat Phys (2012) 8:95–9. doi:10.1038/NPHYS2130
3. Palmer CAJ, Dover NP, Pogorelsky I, Babzien M, Dudnikova GI, Ispiriyan M, et al. Monoenergetic proton beams accelerated by a radiation pressure driven shock. Phys Rev Lett (2011) 106:014801. doi:10.1103/PhysRevLett.106.014801
4. Pogorelsky IV, Polyanskiy MN, Kimura WD. Mid-infrared lasers for energy frontier plasma accelerators. Phys Rev Acc Beams (2016) 19:091001. doi:10.1103/PhysRevAccelBeams.19.091001
5. Tochitsky S, Welch E, Polyanskiy M, Pogorelsky I, Panagiotopoulos P, Kolesik M, et al. Megafilament in air formed by self-guided terawatt long-wavelength infrared laser. Nat Photon (2019) 13:41–6. doi:10.1038/s41566-018-0315-0
6. Toth G, Illes G, Nazymbekov G, Mbithi N, Almasi G, Hebling J. Possibility of CO2 laser-pumped multi-millijoule-level ultrafast pulse terahertz sources. Scientific Rep (2022) 14:999. doi:10.1038/s41598-023-51139-4
7. Haberberger D, Tochitsky S, Joshi C. Fifteen terawatt picosecond CO2 laser system. Opt Express (2010) 18(17):17865–75. doi:10.1364/OE.18.017865
8. Polyanskiy MN, Pogorelsky IV, Babzien M, Palmer MA. Demonstration of a 2 ps, 5 TW peak power, long-wave infrared laser based on chirped-pulse amplification with mixed-isotope CO2 amplifiers. OSA Continuum (2020) 3(3):459–72. doi:10.1364/OSAC.381467
9. Corkum P. Amplification of picosecond 10 µm pulses in multiatmosphere CO2 lasers. IEEE J Quan Electron. (1985) 21(3):216–32. doi:10.1109/JQE.1985.1072638
10. Gustafson T, Kelley P, Fisher R. Subpicosecond pulse generation using the optical Kerr effect. IEEE J Quan Electron. (1969) 5(6):325. doi:10.1109/JQE.1969.1081928
11. Voronin AA, Zheltikov AM, Ditmire T, Rus B, Korn G. Subexawatt few-cycle lightwave generation via multipetawatt pulse compression. Opt Commun (2013) 291:299–303. doi:10.1016/j.optcom.2012.10.057
12. Hädrich S, Kienel M, Müller M, Klenke A, Rothhardt J, Klas R, et al. Energetic sub-2-cycle laser with 216 W average power. Opt Lett (2016) 41:4332–5. doi:10.1364/OL.41.004332
13. Hemmer M, Baudisch M, Thai A, Couairon A, Biegert J Self-compression to sub-3-cycle duration of mid-infrared optical pulses in dielectrics. Opt Express (2013) 21(23): 28095–102. doi:10.1364/OE.21.028095
14. Shumakova V, Malevich P, Ališauskas S, Voronin A, Zheltikov AM, Faccio D, et al. Multi-millijoule few-cycle mid-infrared pulses through nonlinear self-compression in bulk. Nat Commun (2016) 13:12877. doi:10.1038/ncomms12877
15. Bravy BG, Gordienko VM, Platonenko VT. Self-compression of terawatt level picosecond 10 μm laser pulses in NaCl. Laser Phys Lett (2014) 11:065401. doi:10.1088/1612-2011/11/6/065401
16. Pigeon J, Tochitsky S, Joshi C. Generation of high power, sub-picosecond, 10 µm pulses via self-phase modulation followed by compression. AIP Conf Proc (2016) 1777:110005. doi:10.1063/1.4965694
17. Bravy BG, Gordienko VM, Platonenko VT. Kerr-assisted self-compression of mid-IR femtosecond laser pulse in dielectrics: nonlinear medium choice. J Russ Laser Res (2016) 37(5):465–72. doi:10.1007/s10946-016-9598-0
18. Pogorelsky I, Polyanskiy M, Babzien M, Palmer M. Experiment on long-wave IR terawatt laser pulse compression to sub-picoseconds. In: OSA High-brightness Sources and Light-driven Interactions Congress; November, 2020; Washington, DC United States (2020). doi:10.1364/MICS.2020.MF2C.1
19. Polyanskiy MN, Pogorelsky IV, Babzien M, Kupfer R, Vodopyanov KL, Palmer MA. Post-compression of long-wave infrared 2 picosecond sub-terawatt pulses in bulk materials. Opt Express (2021) 29(20):31714–25. doi:10.1364/OE.434238
20. Polyanskiy MN. co2amp: a software program for modeling the dynamics of ultrashort pulses in optical systems with CO2 amplifiers. Appl Opt (2015) 54(16):5136–42. doi:10.1364/AO.54.005136
Keywords: gas lasers, long wave infrared radiation, chirped pulse amplification, postcompression, femtosecond pulses
Citation: Pogorelsky IV, Polyanskiy MN, Babzien M, Simmonds A and Palmer MA (2024) Terawatt-class femtosecond long-wave infrared laser. Front. Phys. 12:1390225. doi: 10.3389/fphy.2024.1390225
Received: 22 February 2024; Accepted: 25 March 2024;
Published: 11 April 2024.
Edited by:
Xiaoming Duan, Harbin Institute of Technology, ChinaCopyright © 2024 Pogorelsky, Polyanskiy, Babzien, Simmonds and Palmer. This is an open-access article distributed under the terms of the Creative Commons Attribution License (CC BY). The use, distribution or reproduction in other forums is permitted, provided the original author(s) and the copyright owner(s) are credited and that the original publication in this journal is cited, in accordance with accepted academic practice. No use, distribution or reproduction is permitted which does not comply with these terms.
*Correspondence: Igor. V. Pogorelsky, igor@bnl.gov