Brain functional magnetic resonance imaging in ICU patients who developed delirium
 Ren-Jie Song1†
  Tian-Xi Zhang
- 1Emergency Department, Affiliated Hospital of Zunyi Medical University, Zunyi, China
- 2Renhuai People’s Hospital, Zunyi, China
Objective: To detect brain alterations in intensive care unit (ICU) patients who develop delirium using functional magnetic resonance imaging (fMRI) and diffusion tensor imaging (DTI) and to determine their predictive value.
Methods: Fifty-two patients who were admitted to the ICU of the Affiliated Hospital of Zunyi Medical University between June 2021 and June 2022 were enrolled. Fifteen patients who were diagnosed with delirium by the Intensive Care Delirium Screening Checklist (ICDSC) after MRI were selected as the delirium group, and 15 healthy volunteers who were examined during the same period served as the control group. Both groups underwent fMRI and DTI. Quantitative fMRI and DTI data were compared between the two groups to detect abnormal structural and functional brain damage. The relationships between MRI outliers and clinical indicators in the delirium group were also assessed.
Results: Demographic characteristics and imaging indicators before delirium were not correlated with ICDSC scores after delirium. Compared with the healthy control group, the delirium group had significantly lower regional homogeneity (ReHo) values in the left caudate nucleus and frontal lobe on fMRI. The amplitude of the low-frequency fluctuations (ALFF) values of the delirium group were significantly increased in the hippocampus but significantly decreased in the frontal lobe. Compared with the healthy control group, the delirium group showed reduced mean diffusivity (MD) values, mainly in the right cerebellum and right middle temporal gyrus; reduced radial diffusivity (RD) values, mainly in the anterior cerebellum and right middle temporal gyrus; reduced fractional anisotropy (FA) values, only in the corpus callosum; and reduced axial diffusivity (AD) values, mainly in the anterior cerebellar lobe, right middle temporal gyrus, and left middle frontal gyrus on DTI. The statistical thresholds for quantitative DTI measurements were p < 0.005 at the voxel level and a cluster size > 5.
Conclusion: Abnormal resting-state brain activity in the left superior frontal gyrus and structural changes in the frontal lobe, temporal lobe, corpus callosum, hippocampus, and cerebellum were observed in ICU patients who developed delirium during hospitalization. Early-brain fMRI and DTI examinations are recommended for the prediction of delirium according to unique quantitative indicators to facilitate early intervention for critically ill patients, reduce the length of hospital stay, and improve patient prognosis.
1 Introduction
Delirium is a form of acute organic brain dysfunction that occurs most often in ICU patients. Patients in the ICU are exposed to numerous risk factors for delirium during treatment of the primary illness. Approximately one-third of critically ill patients in the ICU exhibit delirium, and a much greater prevalence of delirium is found in patients receiving mechanical ventilation [1, 2]. Moreover, the incidence of delirium in hospitalized patients aged over 65 years is approximately 48%, and the postoperative incidence is 15%–50% [3]. To date, several studies have shown that delirium is associated with increased mortality, length of hospital stay (LOS), and cost. In addition, when high-risk groups are considered, such as older individuals and patients on mechanical ventilation, delirium can occur in up to 80% of ICU patients [4]. Fluctuations in attention and cognition are observed in patients with delirium [5], and the clinical manifestations, including delusions, hallucinations, or disorientation due to different causes of injury [6], vary and have long-term effects on the quality of life of patients. Despite the high incidence of delirium, it is often underrecognized clinically. Currently, the clinical diagnosis of delirium is usually verified by delirium assessment tools, including the ICU Delirium Assessment Scale, the Intensive Care Delirium Screening Checklist (ICDSC), and the Delirium Screening Checklist [7]. However, these diagnostic tools are highly subjective, time-consuming, and limited by the patient’s speech, which poses substantial barriers to the early diagnosis of delirium by clinicians and affects the early treatment and prognosis of patients with delirium.
Previous neuroimaging studies of delirium have shown that patients with cortical atrophy, white matter lesions, and ventricle enlargement are at increased risk of delirium [8]. However, the pathophysiological mechanisms of delirium are still poorly understood. Neuroimaging offers a noninvasive method to advance our understanding of the mechanisms of delirium [9]. Delirium can generally be divided into three types: excitatory, inhibited, and mixed [10]. Excitatory delirium is clinically characterized by excitement and mania, and it is easy to identify clinically. However, inhibited delirium is more common than excitatory delirium. Studies have reported that the proportion of patients with inhibited delirium in the ICU is the highest, followed by patients with mixed delirium and patients with excitatory delirium [11]. Inhibited delirium often leads ICU doctors to misjudge the mental state of patients. Usually, these patients are relatively calm, but patients with severe anxiety and hallucinations are unable to properly express their thoughts. As a result, inhibited delirium is often missed; targeted treatment is often delayed or even absent, and the prognosis of patients with inhibited delirium is often worse.
Delirium has been reported to be correlated with the prognosis of ICU patients, and early intervention is effective in reducing pain [6], disability, mortality, and medical costs. Therefore, there is an urgent need for objective auxiliary tools to assist clinicians in the quick and accurate detection of delirium in patients. Functional magnetic resonance imaging (fMRI) and diffusion tensor imaging (DTI) are newly developed imaging techniques that can measure brain function. These techniques have been widely used to study neurological diseases but have rarely been used to examine individuals with delirium. Previous studies have shown abnormal resting-state activity in several brain regions in patients with delirium. To this end, we conducted resting-state fMRI and DTI examinations of ICU patients in our hospital in this single-center, prospective, cohort study and analyzed patients who developed delirium in the middle and late stages of an ICU admission to further explore the changes in patient-specific brain function in regions before delirium occurred. We hoped to provide a theoretical basis for the use of imaging to facilitate the clinical prediction of delirium, increase early diagnosis and treatment, and reduce the impact of delirium on the quality of life of patients.
2 Data and methods
2.1 Ethics
This study complied with medical ethics standards and was approved by the ethics committee of the Affiliated Hospital of Zunyi Medical University (approval number: KLL-2020-133). All the scanned patients and healthy volunteers were fully informed about the study and volunteered to participate in the present study.
2.2 Study conditions
All imaging scans were performed using the same MRI device (HDxT 3.0 T, GE, USA) at the imaging center of the Affiliated Hospital of Zunyi Medical University under the guidance of specialized technicians.
2.3 Study subjects
From 21 June 2021 to 30 June 2022, 52 patients admitted to the ICU of the Affiliated Hospital of Zunyi Medical University were selected as the study population. All patients underwent fMRI within 72 h after admission to the ICU. Delirium was diagnosed using the ICDSC, which has a total score range of 0–8; scores equal to or greater than 4 indicate clinical delirium. The diagnosis was made by two experienced ICU attending physicians with extensive clinical expertise. All patients included in this study were right-handed based on the Chinese handedness assessment criteria. Healthy volunteers from our hospital during the same period who were matched for age, sex, and educational level with the patients and provided signed informed consent forms indicating their willingness to participate in the study were selected as controls.
2.3.1 Inclusion criteria
The inclusion criteria were as follows: Aged 14–70 years, underwent MRI within 72 h after ICU admission, and had an education level above primary school.
2.3.2 Exclusion criteria
The exclusion criteria were as follows: preexisting neurological and psychiatric disorders or genetic disorders, history of severe hepatorenal or cardiac disorders, presence of metallic medical implants, or deafness or blindness that may affect the outcome of delirium.
2.3.3 Elimination criteria
The elimination criteria were as follows: unwillingness to cooperate with scanning, the use of sedatives, or excessive scan artifacts.
2.4 Data collection
Patient sex, age, education level, and ICDSC score after the occurrence of delirium in the ICU were recorded.
2.5 Image acquisition
A USA (United States) superconducting MRI scanner and skull coil were used. During the scanning process, the subjects were instructed to lie quietly in the supine position, close their eyes, and avoid thinking of anything in particular. Axial T2 fluid-attenuated inversion recovery (FLAIR) images were obtained to rule out organic brain lesions and obvious degradation of white matter. The fMRI parameters were as follows: repetition time (TR) = 2000 m, echo time (TE) = 40 m, slice thickness = 4 mm, slice interval = 0, slice layer = 33, number of slices = 210, field of view (FOV) = 24 cm × 24 cm, number of excitations (NEX) = 1, matrix = 64 × 64, and flip angle = 90°. A total of 6930 images were acquired. The DTI parameters were as follows: TR = 8500 m, TE = 40 m, slice thickness = 4 mm, slice interval = 0, number of slices = 35, FOV = 24 cm × 24 cm, diffusion sensitive gradient (b value) = 0 to 1 000 s/mm2, diffusion sensitive gradient direction = 25, NEX = 1, matrix = 128 × 128, and flip angle = 90°.
2.6 Data processing
2.6.1 Resting-state fMRI data analysis
Slice timing correction: The time information about each layer of each subject’s whole brain (volume) was corrected to eliminate the phase difference of each layer of the time series of each subject. Head motion correction: There was a small amount of head motion caused by the subjects’ breathing and heartbeats during data acquisition. Therefore, using the first volume of each subject as the reference standard, the remaining volume was spatially transformed using a six-parameter rigid body transformation to eliminate any head motion. Average images were generated after head motion correction. Spatial normalization: To conduct item-by-item statistical analysis of one or more datasets, voxelwise alignment was performed on all subjects considering the variations in brain shape and size. The average image obtained after head motion correction served as the source image for estimating registration parameters, using the blood oxygen level-dependent (BOLD) brain template in the Montreal Neurological Institute (MNI) space as the reference standard. Subsequently, spatial transformation employing a 12-parameter affine transformation and nonlinear deformation was applied to align the images after head motion correction with normalization to eliminate intersubject differences. Gaussian smoothing: Following spatial normalization, the data were smoothed using an 8-mm full-width at half-maximum Gaussian kernel to further reduce noise. Statistical analysis involved transforming the data to adhere to a normal distribution. Linear drift elimination: Linear drift during data acquisition was removed. Regression: Signals originating from white matter and cerebrospinal fluid were regressed out to mitigate their influence on gray matter signals. Friston’s 24-motion parameter model regression was performed to eliminate the influence of head motion on the data. Low-frequency filtering: As the signals related to physiological activity were concentrated in the low-frequency band, the data were bandpass filtered at a frequency range of 0.01–0.1 Hz before statistical analysis. Quantitative calculation: Quantitative indicators such as the amplitude of low-frequency fluctuations (ALFF) and regional homogeneity (ReHo) in all subjects were calculated using DPABI software. Quantitative indicator smoothing: Quantitative indicators were smoothed using a 4-mm full-width at half-maximum Gaussian kernel before statistical analysis. Voxel-by-voxel statistical analysis of quantitative indicators: Based on the generalized linear model, statistical analysis models were constructed to analyze the smoothed quantitative data, and voxel-by-voxel statistical analysis was carried out to establish a model for paired-sample t-tests. Correlation analysis of quantitative indicators: The average value of all quantitative indicators in each brain region was extracted according to the 90 ROIs (including the left and right sides) of the Automated Anatomical Labeling (AAL) brain atlas in the MNI space. Correlation analysis was performed with clinical indicators.
2.6.2 DTI data analysis: data transfer
The DICOM data collected by the device were converted to NIFTI format. Data inspection: The quality of the images was checked individually, mainly to ensure the completeness of the data acquisition and the absence of substantial artifacts. Eddy-current correction and head motion correction: the FMRIB Software Library (FSL) was used to correct for eddy-current effects in the acquired DTI data, as well as for the small amount of head motion caused by the subjects’ breathing and heartbeats. Gradient correction: After eddy-current correction, the FSL was used to correct the tensor data. Quantitative calculation: ExploreDTI was applied to calculate quantitative indicators, including mean diffusivity (MD), fractional anisotropy (FA), axial diffusivity (AD), and radial diffusivity (RD). Spatial normalization: To perform item-by-item statistical analysis of one or more sets of data, voxel-by-voxel alignment of all subjects was required, given that the brain shape and size of each subject were different.
With the T2-weighted brain template in the MNI space as the reference standard, the registration parameters were estimated by using the b0 image as the source image after eddy-current correction and head motion correction. Then, spatial transformation of the quantitative indicators of the image was conducted with 12-parameter affine transformation and nonlinear deformation, and the brain images of all subjects were normalized to the template space to eliminate individual differences. Gaussian smoothing: The data were smoothed with an 8-mm full-width at half-maximum Gaussian kernel after spatial normalization to further remove noise. The data were then transformed to follow a normal distribution. Extraction of quantitative indicators: The average values of all quantitative indicators in each brain region were extracted according to the 90 ROIs of the AAL brain atlas in MNI space and the JHU white matter atlas (including the left and right sides) and stored as an MS Excel worksheet. Voxel-by-voxel statistical analysis: Based on the generalized linear model, all quantitative indicators were compared between groups, and the regions with significant differences between groups were identified and stored according to heatmaps and positioning documents. Correlation analysis: A pairwise correlation analysis was performed between all brain regions of all quantitative indicators in the delirium group before and after treatment, and clinical information and p values indicating significant correlations were obtained.
3 Results
3.1 General information and clinical data
Overall, 15 patients were included in the delirium group after scanning. There were eight men and seven women, with an age of 43.40 ± 10.12 years. Fifteen healthy volunteers, including eight men and seven women aged 41.53 ± 4.11 years, composed the control group. There were no statistically significant differences in the numbers of men and women or in the ICDSC scores between the two groups (p > 0.05) (Table 1).
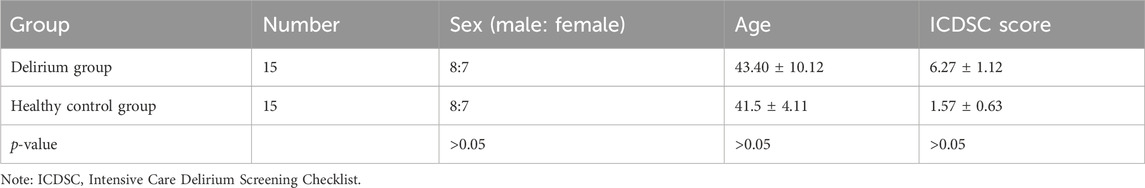
Table 1. Comparison of demographic characteristics and ICDSC scores between patients who developed delirium and healthy volunteers.
3.2 Comparison of ALFF values
ALFF values were analyzed to determine the intensity of spontaneous activity in the voxels identified in the delirium group. Compared with the healthy control group, the delirium group exhibited a significant increase in ALFF values on both sides of the hippocampus (all p < 0.05, Gaussian random field [GRF] corrected) and a significant decrease in ALFF values in the frontal lobe (all p < 0.05, GRF corrected) (Figure 1; Tables 2, 3).
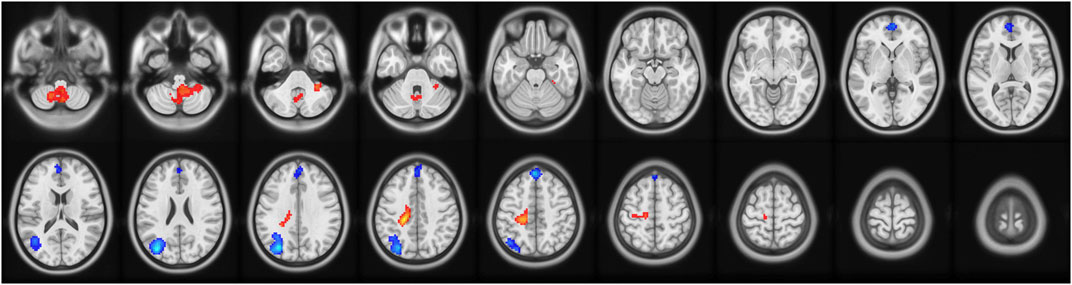
Figure 1. Brain regions with abnormal ALFF values in the delirium group. Note: ALFF, amplitude of low-frequency fluctuations; GRF, Gaussian random field. Red indicates brain regions with increased ALFF. Blue indicates brain regions with decreased ALFF.

Table 2. Brain regions with increased ALFF values in patients who developed delirium compared with healthy controls according to resting-state fMRI.

Table 3. Brain regions with decreased ALFF values in patients who developed delirium compared with healthy controls according to resting-state fMRI.
3.3 Comparison of ReHo values
ReHo values were analyzed to determine the temporal synchronization of local neural activity in the delirium group. Compared with the healthy control group, the delirium group had significantly increased ReHo values in the left brainstem and left medial superior frontal gyrus but significantly decreased ReHo values in the left caudate nucleus and left medial superior frontal gyrus (all p < 0.05, GRF corrected) (Figure 2; Tables 4, 5).
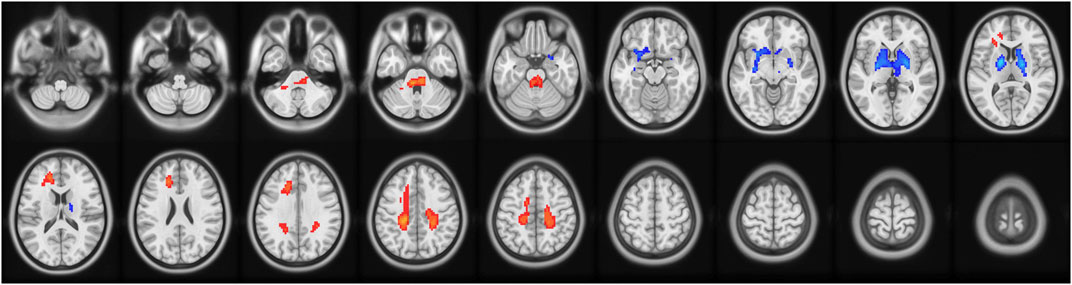
Figure 2. Brain regions with abnormal ReHo values in the delirium group. Note: ReHo, regional homogeneity; GRF, Gaussian random field. Red indicates brain regions with increased ReHo. Blue indicates brain regions with decreased ReHo.
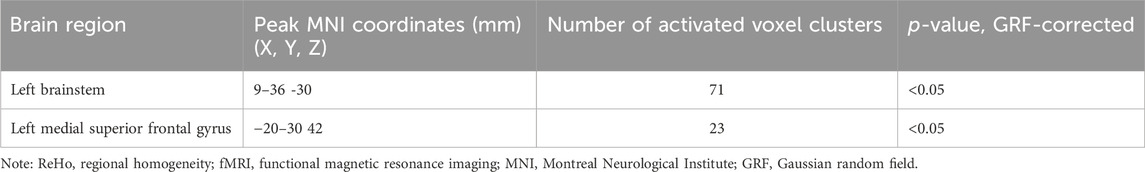
Table 4. Brain regions with increased ReHo values in patients who developed delirium compared with healthy controls according to resting-state fMRI.
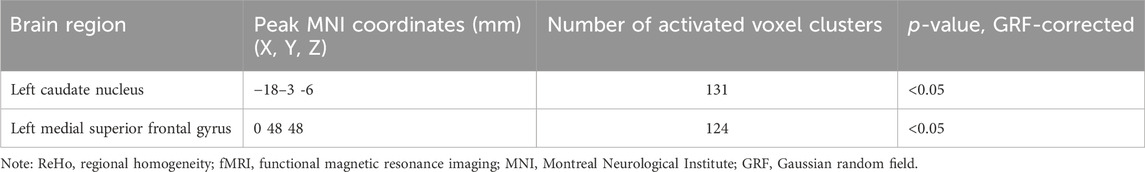
Table 5. Brain regions with decreased ReHo values in patients who developed delirium compared with healthy controls according to resting-state fMRI.
3.4 Comparison of MD
MD values were analyzed to determine the changes in regional brain water content and the regional integrity of the myelin sheath in the delirium group. Compared with the healthy control group, the delirium group had decreased MD values in the right cerebellum and right middle temporal gyrus (all p < 0.05, GRF corrected) (Figure 3; Table 6).
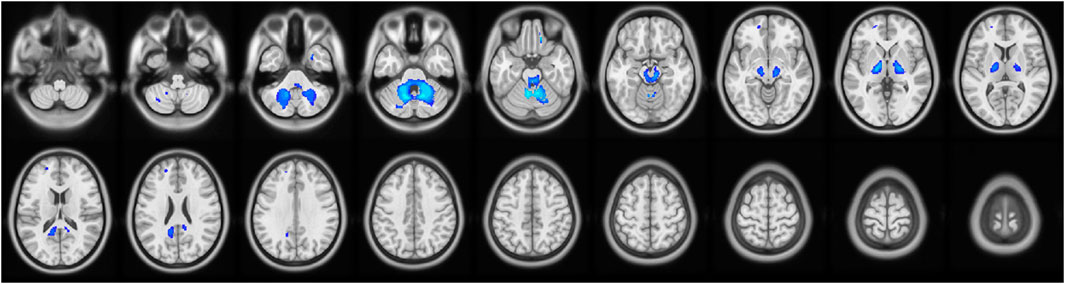
Figure 3. Brain regions with abnormal MD values in the delirium group. Note: MD, mean diffusivity. Blue indicates brain regions with decreased MD.
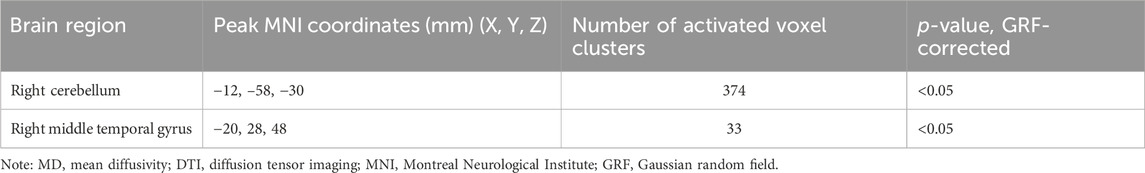
Table 6. Brain regions with decreased MD values in patients who developed delirium compared with healthy controls according to DTI.
3.5 Comparison of RD
RD values were analyzed to determine the regional integrity of the myelin sheaths in the delirium group. Compared with the healthy control group, the delirium group had reduced RD values in the anterior cerebellar lobe and right middle temporal gyrus and did not exhibit any regions with increased RD values (Figure 4; Table 7).
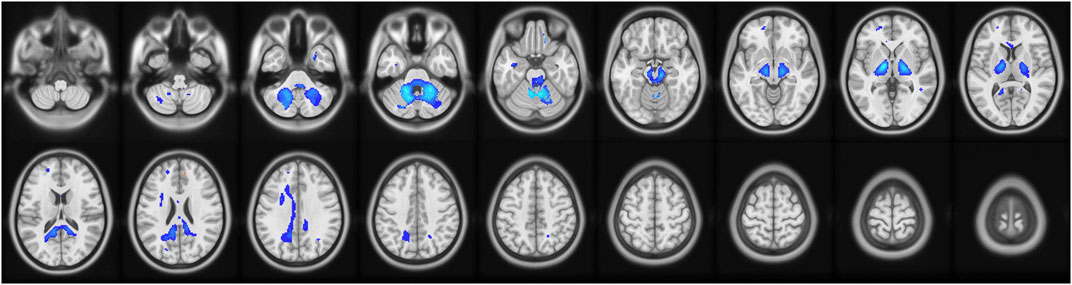
Figure 4. Brain regions with abnormal RD values in the delirium group. Note: RD, radial diffusivity. Blue indicates brain regions with decreased RD.
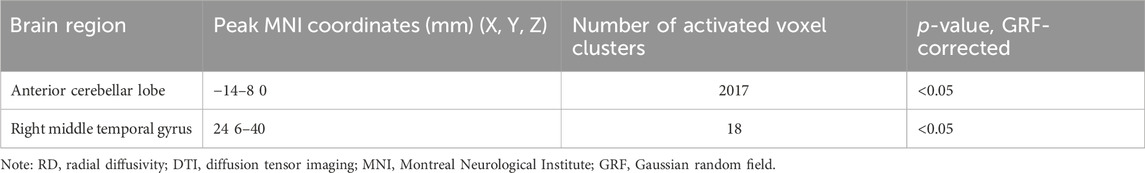
Table 7. Brain regions with decreased RD values in patients who developed delirium compared with healthy controls according to DTI.
3.6 Comparison of FA
Compared with the healthy control group, the delirium group had reduced FA values in the corpus callosum and no areas with no increased FA values (Figure 5; Table 8).
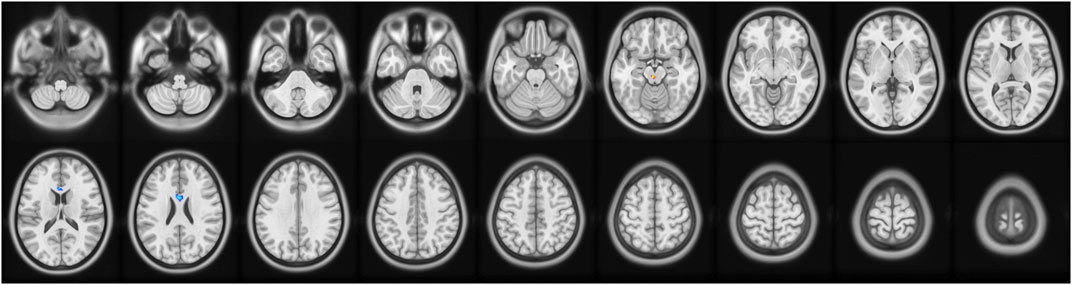
Figure 5. Brain regions with abnormal FA values in the delirium group. Note: FA, fractional anisotropy. Blue indicates brain regions with decreased FA.

Table 8. Brain regions with decreased FA values in patients who developed delirium compared with healthy controls according to DTI.
3.7 Comparison of AD
Compared with the healthy control group, the delirium group had reduced AD values in the anterior cerebellar lobe and the left middle frontal gyrus and no regions with no increased AD values (Figure 6; Table 9).
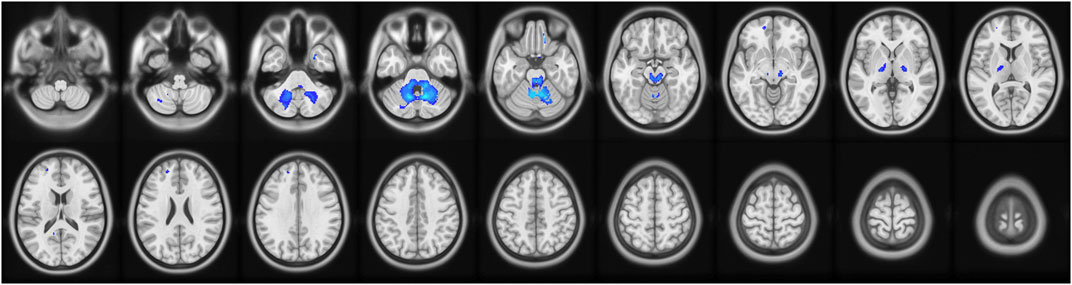
Figure 6. Brain regions with abnormal AD values in the delirium group. Note: AD, axial diffusivity. Blue indicates brain regions with decreased AD.
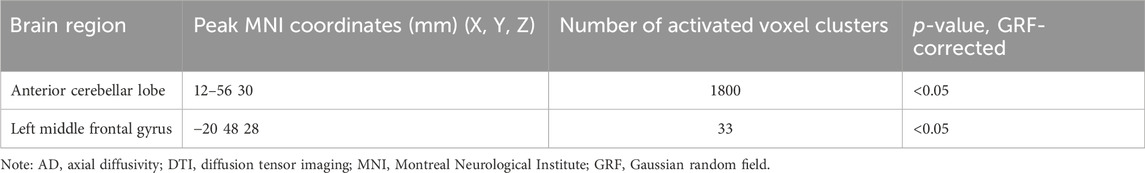
Table 9. Brain regions with decreased AD values in patients who developed delirium compared with healthy controls according to DTI.
4 Discussion
fMRI can provide a visualization of brain structure and function. Unique quantitative indicators widely used to predict clinical disorders, especially delirium-like disorders, can facilitate early diagnosis and intervention, reduce the length of hospital stay, improve patient prognosis, and decrease mortality. Data, including sex, age, and ICDSC score after the onset of delirium, were collected from patients admitted to the ICU; these variables were not correlated with the imaging indicators before the onset of delirium and thus could not predict whether delirium would occur later. Accordingly, objective variables that can be used to predict delirium are urgently needed. With advances in pathophysiological research on clinical diseases and improvements in DTI and fMRI in recent years, delirium has been studied in depth in the medical field, making it possible to predict the occurrence of delirium.
fMRI analysis methods largely focus on describing the synchrony and spontaneity of brain activity. For instance, ReHo has been utilized to detect similarities in activity between adjacent voxels. ReHo is a whole-brain data analysis method based on Kendall’s coefficient of concordance (KCC). The hypothesis proposed by the ReHo method is that brain activity is not shown in a single voxel unit but rather in the form of multivoxel clusters or brain regions. This method uses KCC to measure the synchronization of a particular voxel and its 26 adjacent voxel time series to obtain the KCC map of the whole brain. ALFF can indirectly reflect neuronal activity and describe the intensity of spontaneous voxel activity by calculating the average value of the amplitude at all frequency points within 0.01–0.08 Hz. These two characteristics are the main features of resting-state imaging. In this study, the ALFF and ReHo values in the delirium group were lower than those in the healthy control group prior to the onset of delirium. A previous study showed that the frontal lobe is highly correlated with higher-order functions, such as emotion regulation, cognition, decision making, and executive function [12]. The human prefrontal cortex supports cognitive control, the ability to generate behavioral strategies to coordinate actions and thoughts to achieve internal goals [13]. Lower BOLD signals in the frontal lobe during spontaneous activity and reduced ReHo may impair human emotion regulation, leading to thought disturbances and calculation errors. The results of this study suggest that patients who develop delirium have substantially decreased spontaneous neuronal activity in the frontal lobe compared with healthy volunteers, which is consistent with the findings from the above study. Damage to the left caudate nucleus might be implicated in delirium, as confirmed in our previous study, and thus could lead to the subsequent occurrence of delirium [14]. In this study, the synchronization of neural activity in the left caudate nucleus started to decrease prior to the occurrence of delirium, and activity in brainstem regions was not coordinated, which suggests that this variable may predict the risk of delirium. It was also found that ReHo was increased in the brainstem and that brain connectivity was reduced before the occurrence of delirium, which suggests that these changes may be neural correlates of delirium [15]. Moreover, the ALFF values of the bilateral hippocampus in the delirium group were greater than those in the healthy control group, indicating the involvement of impaired hippocampal function in the occurrence of delirium from an imaging perspective. In addition, animal experiments have demonstrated that the loss of E4bp4 in the hippocampus, which leads to circadian rhythm disturbance, is the basis of the cognitive decline associated with delirium. Pharmacological intervention was shown to affect neuronal activity in the hippocampus and, in turn, cause memory and attention deficits [16]. Taken together, the above findings suggest that impaired hippocampal function is the pathophysiological basis of delirium.
The hippocampus is thought to be strongly associated with consciousness and memory formation [17]. This belief is consistent with our present findings that impaired hippocampal function is involved in the development of delirium. Additionally, we revealed a significant difference in the intensity of spontaneous activity in the hippocampus between the delirium group and the healthy control group, which may provide a foundation for future research on delirium.
The concept of DTI was proposed by Basser et al. in the mid-1990s and has become an important technique in functional magnetic resonance imaging. DTI can further reflect tissue integrity by providing information on the spatial composition of living tissues and water exchange among tissue components under pathological conditions [18]. The MD value is obtained by summing and averaging the three dispersion directions along and perpendicular to the fiber. When a lesion affects brain structure, the integrity of the brain tissue is disrupted, as evidenced by MD, which reflects brain water content and myelin integrity [19]; AD, which reflects axonal integrity; and RD, which reflects myelin integrity. In our study, MD values in the right cerebellum and RD and AD values in the anterior cerebellar lobe were lower in the delirium group before the occurrence of delirium than in the healthy control group, suggesting that the integrity of cerebellar myelination and axons was impaired. This result is consistent with that of another study that identified a strong correlation between dyskinesia and disrupted integrity of cerebellar myelination and axons in patients with delirium [20]. Moreover, neuropsychological and neuroimaging studies have shown that greater cortical function is generally impaired in patients with delirium, particularly in the nondominant prefrontal cortex, frontal cortex, and temporoparietal cortex [21]. Neuronal degeneration and damage to the fiber tract were also observed in the present study; specifically, MD values in the right middle frontal gyrus of the nondominant hemisphere were decreased in the delirium group. FA mainly describes the longitudinal dispersion characteristics of a specific brain region along the direction of the fibers, and a decrease in FA reflects damage to white matter fiber integrity. In our study, FA values in the corpus callosum before the occurrence of delirium were significantly lower in the delirium group than in the healthy control group. Considering that the corpus callosum is the largest commissural fiber network in the brain, disrupted integrity of nerve fibers in the corpus callosum may be the structural basis for subsequent cognitive impairments and personality changes in patients. The corpus callosum is considered the control center for personality abnormalities and cognitive dysfunction; one possible reason is that microstructural changes occur in the upper longitudinal tract following cortical degeneration in patients with delirium, which further leads to various degrees of acute personality abnormalities and cognitive dysfunction [22]. Therefore, the altered FA values of the corpus callosum in the patients who developed delirium observed in our study are consistent with the above studies. Overall, DTI can predict the occurrence of delirium by allowing the direct measurement of the number and integrity of nerve fibers and can reveal the severity of the disease according to patient imaging parameters. Regarding DTI parameters, FA and MD values indicated microstructural damage in multiple brain regions of patients who later developed delirium, and there appeared to be correlations between microstructural damage in different brain regions and the occurrence of delirium. In particular, structural damage to the cerebellum in the same brain region with reduced MD, RD, and AD values seemed to be more closely correlated with the occurrence of delirium.
The main limitation to this study was its relatively small sample size. Further studies with larger sample sizes are required to perform subgroup analyses according to delirium type, such as hyperactive, hypoactive, and mixed types. In addition, the current design of this study does not allow us to establish a true “cause/effect” relationship between delirium and a particular factor.
5 Conclusion
In summary, the abnormal resting-state activity of the left superior frontal gyrus in ICU patients was strongly associated with the subsequent occurrence of delirium. Structural changes and functional abnormalities in the frontal lobe, temporal lobe, corpus callosum, hippocampus, and cerebellum may be preliminary imaging indicators for the prediction of delirium. For patients with delirium, early identification and intervention are recommended to avoid loss of independence and decrease medical costs and mortality risks.
Data availability statement
The original contributions presented in the study are included in the article/supplementary material; further inquiries can be directed to the corresponding authors.
Ethics statement
The studies involving humans were approved by the ethics committee of the Affiliated Hospital of Zunyi Medical University (approval number: KLL-2020-133). The studies were conducted in accordance with the local legislation and institutional requirements. The participants provided their written informed consent to participate in this study.
Author contributions
R-JS: methodology and writing–original draft. F-JG: resources, software, and writing–original draft. X-FH: investigation, methodology, software, and writing–original draft. ML: investigation, methodology, and writing–review and editing. Y-YS: methodology and writing–review and editing. A-YY: funding acquisition, methodology, resources, and writing–review and editing. TZ: conceptualization, data curation, and writing–review and editing.
Funding
The author(s) declare that financial support was received for the research, authorship, and/or publication of this article. This study is part of the “Brain imaging study with functional magnetic resonance imaging in patients with organophosphorus poisoning” project funded by the Science and Technology Support Program of Guizhou Province (registry number: [2021] 047), the National Natural Science Foundation of China (no. 82260385), the Science and Technology Project of Guizhou Province (no. 2021044), the Health Commission of Guizhou Province (gzwkj2022-103), and the Science and Technology Talent Platform of Zunyi [2021] No. 4.
Conflict of interest
The authors declare that the research was conducted in the absence of any commercial or financial relationships that could be construed as a potential conflict of interest.
Publisher’s note
All claims expressed in this article are solely those of the authors and do not necessarily represent those of their affiliated organizations, or those of the publisher, the editors, and the reviewers. Any product that may be evaluated in this article, or claim that may be made by its manufacturer, is not guaranteed or endorsed by the publisher.
References
1. Ely EW. Delirium as a predictor of mortality in mechanically ventilated patients in the intensive care unit. JAMA (2004) 291(14):1753. doi:10.1001/jama.291.14.1753
2. Girard TD, Exline MC, Carson SS, Hough CL, Rock P, Gong MN, et al. Haloperidol and ziprasidone for treatment of delirium in critical illness[J/OL]. New Engl J Med (2018) 379(26):2506–16. doi:10.1056/NEJMoa1808217
3. Salluh JI, Soares M, Teles JM, Ceraso D, Raimondi N, Nava VS, et al. Delirium epidemiology in critical care (DECCA): an international study. Crit Care (2010) 14(6):R210. doi:10.1186/cc9333
4. Devlin JW, Fong JJ, Howard EP, Skrobik Y, McCoy N, Yasuda C, et al. Assessment of delirium in the intensive care unit: nursing practices and perceptions. Am J Crit Care (2008) 17:555–65. quiz 566. doi:10.4037/ajcc2008.17.6.555
5. American Psychiatric Association (APA). Washington (2020) Diagnostic and statistical manual of mental disorders. 5th ed. APA.
6. Prendergast NT, Tiberio PJ, Girard TD. Treatment of delirium during critical illness[J/OL]. Annu Rev Med (2022) 73(1):407–21. doi:10.1146/annurev-med-042220-013015
7. Devlin JW, Marquis F, Riker RR, Robbins T, Garpestad E, Fong JJ, et al. Combined didactic and scenario-based education improves the ability of intensive care unit staff to recognize delirium at the bedside. Crit Care (2008) 12(1):R19. doi:10.1186/cc6793
8. Soiza RL, Sharma V, Ferguson K, Shenkin SD, Seymour DG, Maclullich AM. Neuroimaging studies of delirium: a systematic review[J/OL]. J Psychosomatic Res (2008) 65(3):239–48. doi:10.1016/j.jpsychores.2008.05.021
9. Nitchingham A, Kumar V, Shenkin S, Ferguson KJ, Caplan GA. A systematic review of neuroimaging in delirium: predictors, correlates and consequences[J/OL]. Int J Geriatr Psychiatry (2018) 33(11):1458–78. doi:10.1002/gps.4724
10. Grover S, Sharma A, Aggarwal M, Mattoo SK, Chakrabarti S, Malhotra S, et al. Comparison of symptoms of delirium across various motoric subtypes[J]. Psychiatry Clin neurosciences. 2014,68(4):283–91. doi:10.1111/pcn.12131
11. Bellelli G, Morandi A, Di Santo SG, Mazzone A, Cherubini A, Mossello E, et al. Delirium Day": a nationwide point prevalence study of delirium in older hospitalized patients using an easy standardized diagnostic tool[J]. BMC Med. 2016,14:106. doi:10.1186/s12916-016-0649-8
12. Shamay-Tsoory SG, Aharon-Peretz J. Dissociable prefrontal networks for cognitive and affective theory of mind: a lesion study[J/OL]. Neuropsychologia (2007) 45(13):3054–67. doi:10.1016/j.neuropsychologia.2007.05.021
13. Duverne S, Koechlin E. Rewards and cognitive control in the human prefrontal cortex[J/OL]. Cereb Cortex (2017) 27(10):5024–39. doi:10.1093/cercor/bhx210
14. Song R, Song G, Xie P, Duan H, Zhang T, Lu Y, et al. Diffusion tensor imaging and resting-state functional magnetic resonance imaging in patients with delirium in intensive care unit. Zhonghua Wei Zhong Bing Ji Jiu Yi Xue (2020) 32(1):88–93. doi:10.3760/cma.j.cn121430-20190905-00016
15. Boukrina O, Kowalczyk M, Koush Y, Kong Y, Barrett AM. Brain network dysfunction in poststroke delirium and spatial neglect: an fMRI study[J/OL]. Stroke (2022) 53(3):930–8. doi:10.1161/STROKEAHA.121.035733
16. Ferrier J, Tiran E, Deffieux T, Tanter M, Lenkei Z. Functional imaging evidence for task-induced deactivation and disconnection of a major default mode network hub in the mouse brain[J/OL]. Proc Natl Acad Sci (2020) 117(26):15270–80. doi:10.1073/pnas.1920475117
17. Wang Q, Zhang X, Guo YJ, Pang YY, Li JJ, Zhao YL, et al. Scopolamine causes delirium-like brain network dysfunction and reversible cognitive impairment without neuronal loss[J/OL]. Zoolog Res (2023) 44(4):712–24. doi:10.24272/j.issn.2095-8137.2022.473
18. Huang J, Friedland RP, Auchus AP. Diffusion tensor imaging of normal-appearing white matter in mild cognitive impairment and early alzheimer disease: preliminary evidence of axonal degeneration in the temporal lobe[J/OL]. Am J Neuroradiology (2007) 28(10):1943–8. doi:10.3174/ajnr.A0700
19. Westman E, Cavallin L, Muehlboeck JS, Zhang Y, Mecocci P, Vellas B, et al. Sensitivity and specificity of medial temporal lobe visual ratings and multivariate regional MRI classification in alzheimer's disease. PLoS ONE (2011) 6(7):e22506. doi:10.1371/journal.pone.0022506
20. Machado AS, Darmohray DM, Fayad J, Marques HG, Carey MR. A quantitative framework for whole-body coordination reveals specific deficits in freely walking ataxic mice. eLife (2015) 4:e07892. doi:10.7554/eLife.07892
21. Burns A. Delirium[J/OL]. J Neurol Neurosurg Psychiatry (2004) 75(3):362–7. doi:10.1136/jnnp.2003.023366
Keywords: delirium, functional magnetic resonance imaging, diffusion tensor imaging, predictive value, brain imaging
Citation: Song R-J, Guo F-J, Huang X-F, Li M, Sun Y-Y, Yu A-Y and Zhang T-X (2024) Brain functional magnetic resonance imaging in ICU patients who developed delirium. Front. Phys. 12:1391104. doi: 10.3389/fphy.2024.1391104
Received: 25 February 2024; Accepted: 27 March 2024;
Published: 26 April 2024.
Edited by:
Huafeng Li, Kunming University of Science and Technology, ChinaReviewed by:
Jun Zhang, Sixth Medical Center of PLA General Hospital, ChinaDongze Li, Sichuan University, China
Dongfeng Pan, University of Virginia, United States
Copyright © 2024 Song, Guo, Huang, Li, Sun, Yu and Zhang. This is an open-access article distributed under the terms of the Creative Commons Attribution License (CC BY). The use, distribution or reproduction in other forums is permitted, provided the original author(s) and the copyright owner(s) are credited and that the original publication in this journal is cited, in accordance with accepted academic practice. No use, distribution or reproduction is permitted which does not comply with these terms.
*Correspondence: An-Yong Yu, anyongyu@163.com; Tian-Xi Zhang, 92150@sina.com
†These authors share first authorship