Design, analysis and validation of a microstrip patch antenna with enhanced coupling for leaf moisture sensing: an IoT approach
 Muhammad Talha Khan
 Xian Qi Lin1*
  Chen Zhe
 Abdus Saboor
- 1School of Electronic Science and Engineering, University of Electronic Science and Technology (UESTC), Chengdu, China
- 2School of Computer Science and Engineering, University of Electronic Science and Technology (UESTC), Chengdu, China
An innovative IoT-based system utilizing a modified slotted microstrip patch antenna with enhanced coupling is presented for precise measurement of leaf moisture content. The antenna employs a rectangular slot above the feed point with an advanced coupling technique to enhance sensitivity. The antenna, fabricated on a 0.8 mm F4B substrate, is designed to resonate within the 2.40 to 3.0 GHz range under unloaded conditions. A parametric analysis focusing on leaf permittivity ranging from 20 to 30 is conducted to determine the antennas’ sensitivity. Experimental measurements of the reflection coefficient (S11) with respect to resonant frequency shift are performed with leaf samples as the samples under test (SUT). Experimental results reveal that the proposed patch antenna’s sensitivity is significantly enhanced, ranging from 0.57 to 1.67 times greater than that of traditional patch antennas for the five leaf samples tested. The antenna exhibits a sensitivity of 0.06 GHz and 0.02 GHz for the modified and enhanced coupling designs, respectively. The mean relative error between predicted and measured moisture content values is low at 0.038. The findings highlight the antenna’s increased sensitivity in detecting leaf moisture content and illustrate the potential of the proposed IoT-based system for real-time agricultural monitoring, marking an advancement in precision farming practices. The study validates the microstrip patch antenna’s capability as a moisture sensor through detailed sensitivity analysis, frequency shift measurements, and regression modeling.
1 Introduction
In recent years, research has demonstrated that antennas can also serve effectively as sensors in various industrial applications. This emerging field takes advantage of the fact that antennas interact with their surrounding environment, with factors like nearby objects, humidity, moisture [1,2], temperature, etc. impacting the antenna’s impedance and resonance characteristics. By monitoring the variation in antenna parameters, valuable sensor data can be obtained. Implementing antennas as sensors offers notable advantages in industry. Antenna sensors are typically inexpensive compared to traditional sensor modalities, given the mass production of antennas for communication purposes. Additionally, it enables wireless sensing in contexts where wired sensors may be impractical or impossible to implement. The dual use of antennas for both communication and sensing furthermore maximizes efficiency and value. Hence, electromagnetic (EM) resonant sensors demonstrates a type of sensors capable of providing distributed sensing. An example of an electromagnetic (EM) resonant sensor that enables distributed sensing is the microwave patch antenna (MPA) sensor [3,4].
In recent times, there has been immense interest in strengthening the sensing capabilities of microstrip patch antennas. Various ideas and technologies have been employed to design antennas with sensing capabilities. In the design process of a microstrip patch antenna, a broadband electromagnetic (EM) signal is delivered to the radiation patch via a microstrip transmission line. The radiation patch transmits the portion of the signal that resonates along the antenna’s resonant frequency, while the remaining signal is reflected back. Consequently, the frequency spectrum of the reflected signal demonstrates considerable losses close to the antenna’s resonant frequencies. Therefore, precise determination of a material’s permittivity has emerged as a critical factor in microwave antenna design, owing to its straightforwardness and non-destructive nature of application [5].
The need of accurate measurement of permittivity of a material has become an important parameter in the design of microwave antennas due to their simplicity of design and non-destructive applications [5]. Planar resonators designs such as split ring resonators have become increasingly prevalent among various techniques used for determining permittivity. Such strategies are preferred due to their cost-effectiveness, low size, simplistic shape, and relatively simple fabrication [6–8]. In such experiments, the sample under test (SUT) is taken as part of the resonator and the permittivity is determined by analyzing the shift in resonant frequency. Such methods involve addressing the sample under test (SUT) as a component of the resonator and the permittivity is calculated by studying the variation in resonant frequency. Microstrip patch antennas, resembling resonators, have been researched as sensors for measuring the permittivity of liquid or solid substances [9]. In literature, a method is suggested for determining the resonant frequency of a patch antenna clad with a dielectric substrate. The technique relies on the efficient dielectric constant of complete design that is proposed to be determined by use of the variational approach [10].
Subsequently, monitoring the moisture content (MC) is crucial in precision farming and the food industry as an indicator of the quality of [11], assessment of numerous quality parameters of animal food [12], granular materials in containers [13], wheat [14], grain [15], rice [16], corn kernel [17] and various crops [18–21]. Accurate and timely measurement of leaf moisture is essential for optimizing water usage, ensuring plant health, and improving crop yield [22]. While utilizing a coaxial probe is a method that can potentially damage the sample, employing antennas is a preferred non-contact approach for MC monitoring. Moreover, the need for leaf moisture sensing in precision agriculture, environmental monitoring, and sustainable resource management is underscored by its critical role in optimizing water usage, ensuring plant health, and improving crop yield [23]. Leaf wetness sensors, as described in the sources, offer a technological solution to accurately and timely gather data on leaf moisture, which is essential for several reasons. In agricultural production, precise and real-time monitoring of plant physiological data is crucial. One such piece of information is leaf wetness, which is correlated with plant capacitance. Nevertheless, plants are susceptible to damage by the methods used currently to measure leaf capacitance, which would compromise the monitoring’s accuracy. As a result, it is advisable to avoid frequency bands where the dielectric constant of water experiences abrupt changes with temperature.
Therefore, the proposed study introduces a study of microstrip patch sensor antenna designed for sensitivity enhancement in permittivity measurement for moisture content. The antenna employs a few rectangular slots that are loaded above the microstrip feed line that has an enhanced coupling. The designed antenna is simulated and fabricated on a F4B substrate with 0.8 mm thickness. The variation in resonant frequency with respect to reflection coefficient (S11) is analyzed to verify the sensing capability of the proposed antenna. The proposed antenna design with enhanced coupling provides higher sensitivity compared to traditional patch antenna designs. Hence, the antenna achieves resonances at lower frequencies while maintaining a compact size. Moreover, the proposed antenna design achieves a sensitivity enhancement ranging from 0.57 to 1.67 times higher than traditional patch antennas for permittivity values between 20 and 30 while maintaining a lower mean relative error (MRE) between the actual and predicted values of moisture content. Furthermore, the proposed integration of the antenna sensor into an IoT-based system for real-time monitoring of leaf moisture content in agricultural applications marks an advancement in precision farming practices. Full-wave simulations using ANSYS EM Suite 2022 are performed and the sensors’ performance is verified through mathematical calculations and experimental processes.
2 Design idea
Research indicates that the resonant frequency of a MPA, intended for integrated sensing capabilities, is impacted by the dielectric properties of the substrate material and the dimensions of its radiating component. These radiation characteristics of the microstrip patch antenna are inherently frequency-dependent [24]. The design of such an antenna encompasses three crucial elements: a radiating surface, a microstrip feed line, and a dielectric substrate. The traditional rectangular microstrip patch antenna’s structure is depicted in Figure 1A.
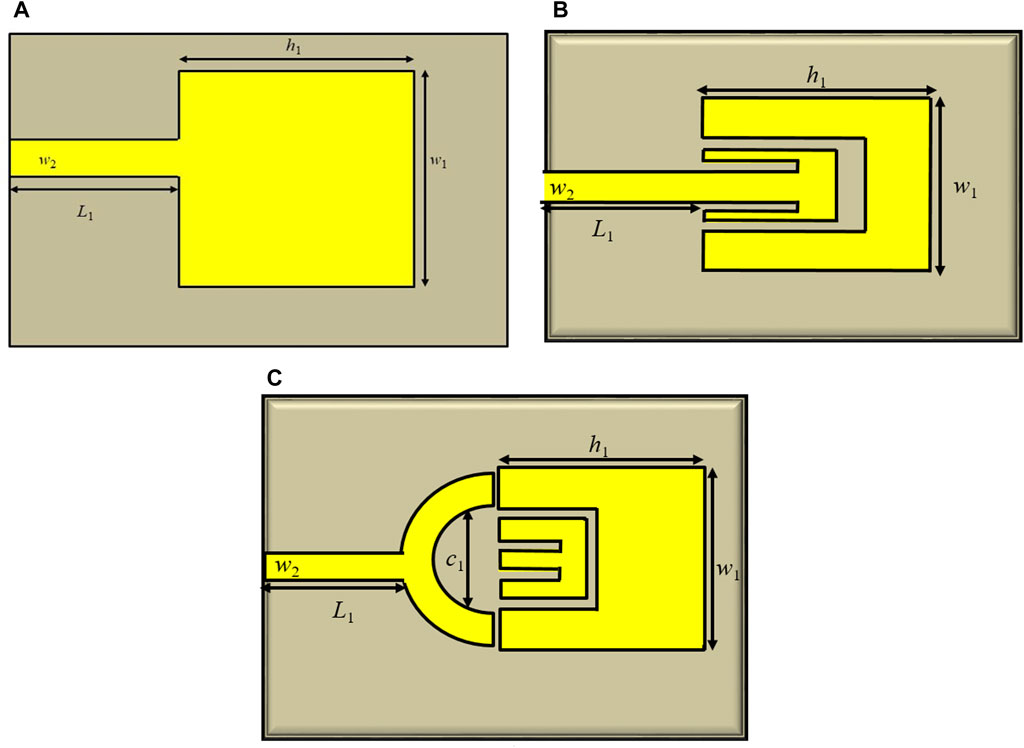
Figure 1. Microstrip patch sensor antenna structures: (A) standard rectangular patch antenna; (B) slotted patch antenna; (C) enhanced coupling modified slotted patch antenna.
The standard microstrip patch antenna (CPA) illustrated in Figure 1A incorporates a patch having a rectangular shape that is connected via 50 Ω microstrip feed line. It is manufactured on an F4B substrate that has a thickness of 0.8 mm and dielectric constant (εr) of 2.65. The designed dimensions of the patch are such that h1 = 19.6 mm and w1 = 15.5 mm, respectively. The width (w2) and calculated length (L1) of the feed line are determined as w2 = 3.2 mm and L1 = 8 mm, respectively. The dimensions of the substrate are 28.1 mm in length (L) and 39.08 mm in width (W).
The dimensions, width (W), length (L), change in length (ΔL) and relative permittivity (Ɛr) of rectangular microstrip patch are calculated using Eqs 1–4 [25].
where, fr is desired resonant frequency, h is height of substrate and c is speed of light in free space. In order to achieve size reduction at lower frequencies compared to a design reported in [26], slots have been incorporated into the antenna structure.
It is known from literature that reducing the gap size can significantly increase the gap capacitance [27]. With strong coupling, maximum electric fields are present, making it more sensitive to overlay permittivity variations. Therefore, a patch antenna is often referred to as a resonator. The proposed design utilizes the concept of enhanced coupling at the periphery of a resonator, as shown in Figure 2. By incorporating an enhanced coupling idea, insertion loss is reduced and gap capacitance is considerably increased. Such a method is more frequently utilized for filters and is used in antenna for same purpose. In addition to coupling capacitance, the capacitance of the ring structure can be further enhanced through mutual coupling. The technique used to increase mutual coupling by adding additional rings is known as concentric circular ring [28]. This technique has shown greater sensitivity in the dielectric characterization of liquid and powder materials.
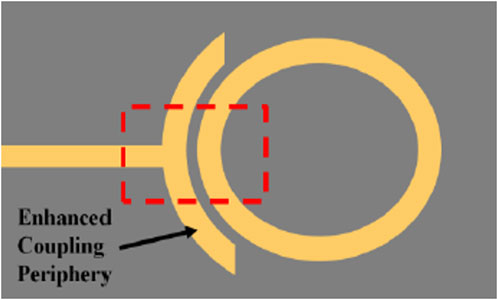
Figure 2. Enhanced coupling periphery of a ring resonator.
Accordingly, a thin rectangular slot is etched radiating above the microstrip feed line, as depicted in Figure 1B. The slotted modified patch antenna (MPA) features a rectangular patch with dimensions of “h1 = 28.3 mm” in length and “w1 = 25.4 mm” in width, which are connected with the microstrip line. In this configuration, the microstrip line is designed using length, L1 = 12 mm and width, w2 = 3.2 mm. Consequently, the proposed enhanced coupling based slotted-patch antenna (ECMPA) sensor is designed on the basis of MPA with an addition of a semi-circle with a radius of 6 mm denoted as C1 that provides the enhanced coupling to the antenna as shown in Figure 1C.
3 Results and discussion
The designed antennas are simulated using a microwave simulation software, ANSYS EM Suite 2022. Analysis of the S11 parameter for the standard inset-fed rectangular microstrip patch antenna (CPA) revealed resonant frequency at 5.807 GHz that has a bandwidth of 400 MHz, as shown in Figure 3A. Subsequently, the fabricated antenna sensor exhibited resonance at 5.82 GHz. In addition, the first slotted rectangular microstrip patch antenna sensor produced a resonant frequency at 2.85 GHz based on simulation results, in addition to a bandwidth of 300 MHz. On the other hand, the fabricated design depicted a similar resonant frequency significantly lower at 2.82 GHz, as indicated in Figure 3B. Finally, the enhanced coupling based microstrip patch antenna (ECMPA) has been simulated utilizing the same parameters and it accomplished dual frequency functioning. The initial resonant frequency, denoted as f1, is at 2.87 GHz, while the other resonant frequency, f2, is at 3.27 GHz, as depicted in Figure 3C. However, measurements revealed the first resonant frequency to be slightly lower at f1 = 2.86 GHz, and the second higher at f2 = 3.4 GHz. The measurement of resonant frequency of the all three designed antennas, i.e., CPA, MPA and ECMPA is determined by measuring its S11 parameter using a vector network analyzer (VNA), which represents the power of the microwave signal reflected by the antenna sensor as a function of frequency. The VNA was calibrated to the end of the coaxial cable so the effect of the microstrip feed is considered to be a part of the antenna sensor.
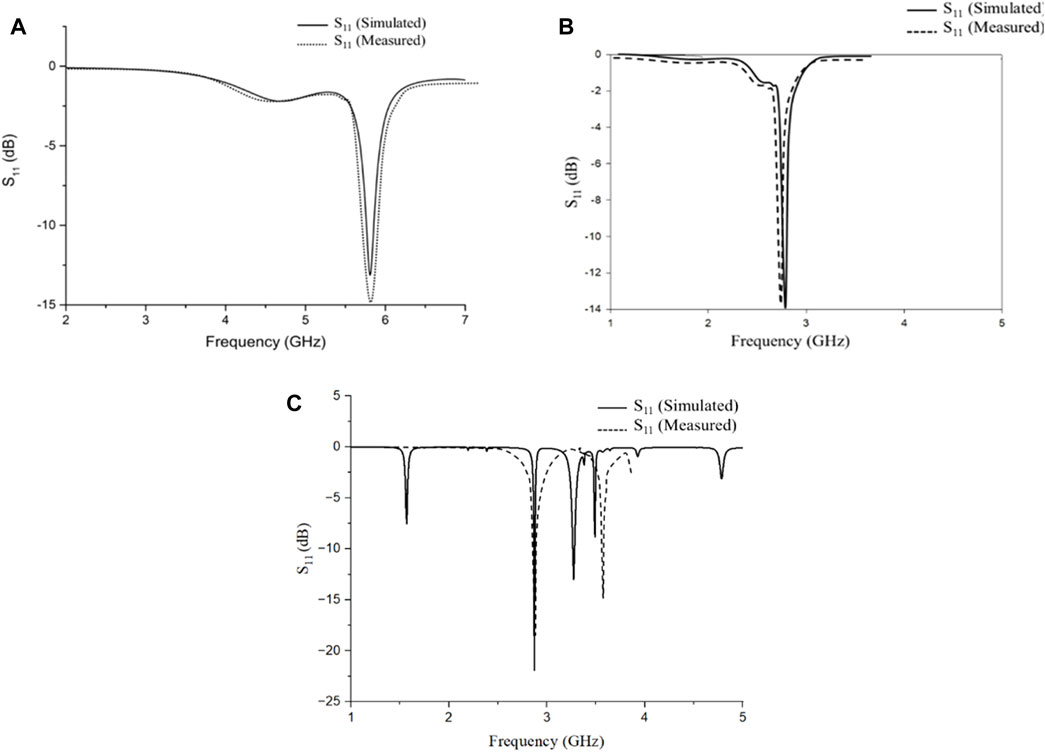
Figure 3. Reflection coefficient values (S11) of the designed antennas (A) standard microstrip patch antenna (CPA); (B) modified slotted microstrip patch antenna; (C) enhanced coupling slotted microstrip patch antenna (ECMPA).
4 Sensitivity of the enhanced coupled microstrip patch antenna
The effectiveness of the designed enhanced coupled microstrip patch antenna (ECMPA) for sensing purposes is validated through measurements in variation in the resonant frequency (f) in gigahertz (GHz) compared to S11 (dB). The electric field intensity is highest in the area influenced by the loaded slot and the coupling, forming a capacitor. This sensor detects variations in the resonant frequency, reflecting the dielectric properties of leaves. By analyzing experimental results, a connection between the resonant characteristics and leaf moisture content can be established. Consequently, during periods of moisture stress in plants, the sensor can detect significant changes in leaf moisture. For precise sensing, the leaf being analyzed should be positioned close to the area with the strongest electric field. The relationship between frequency and capacitance is described by Eq. 5:
where, f is frequency, Ls and Cs are the inductance and capacitance of the designed sensor. In accordance with Eq. 5, the more concentrated the moisture content of the leaf, the larger the permittivity and capacitance. Consequently, the shift in resonant frequency can be exploited to detect leaf moisture. A leaf model also called sample under test (SUT) with a thickness of 0.5 mm and loss tangent of 0.2 is considered in this experiment. The SUT is positioned over the patch and its relative permittivity (εr) is diversified in the range of 20–30 with an increment of 1. Such a range is selectd because the relative permittivity (εr) of plant-based materials, such as fruits and leaves, typically ranges from around 20 to 30.2 This range encompasses the dielectric properties commonly observed in plant tissues {Doidy, 2019 #128}.
Figure 4 depicts the S11 characteristics of the traditional patch antenna and the proposed modified slotted patch antenna. For the traditional patch antenna, it is observed that the resonant frequency is achieved at 5.12 GHz as the test sample dimension having εr1 = 30. Moreover, the frequency response of 5.70 GHz is achieved with value of εr1 = 20.
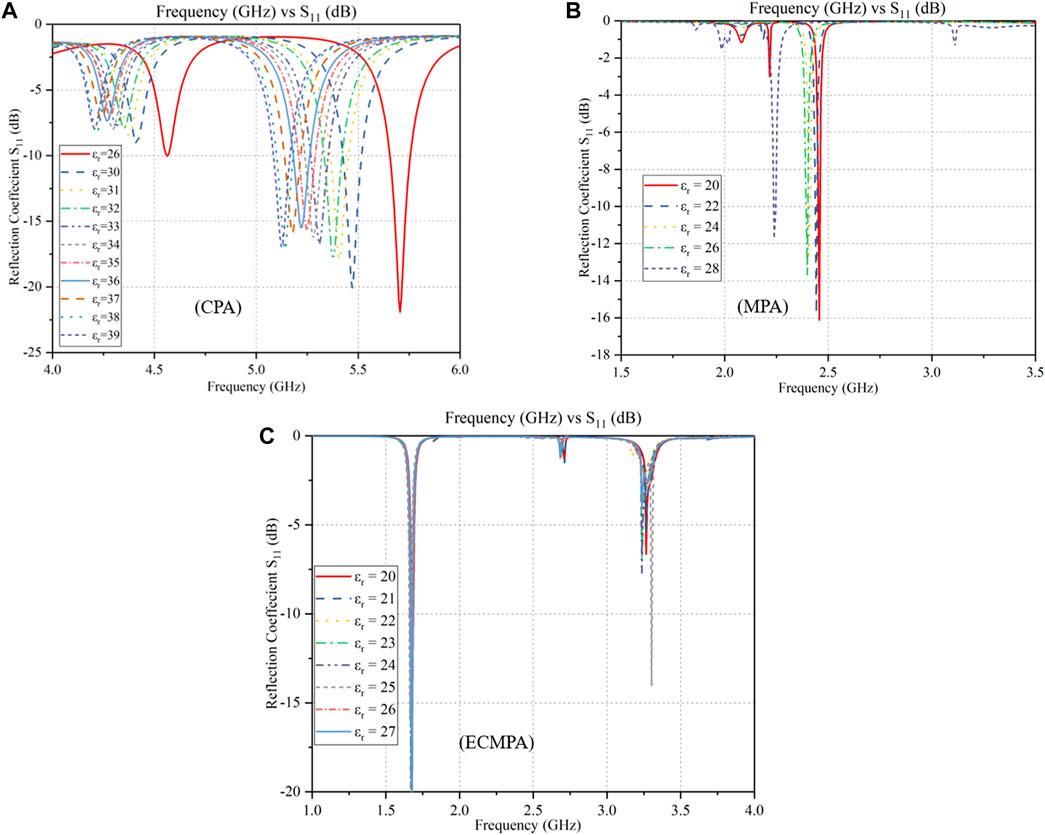
Figure 4. S11 (dB) vs. frequency (GHz) for varying relative permittivity of the SUT: (A) standard rectangular patch antenna; (B) slotted patch antenna; (C) enhanced coupling modified slotted patch antenna.
Whereas, for the proposed slot-loaded modified antenna (MPA), SUT having a permittivity value of εr1 = 30, the antenna demonstrates its lowest frequency response at 2.24 GHz. Conversely, a higher frequency response of 2.48 GHz is achieved when the test sample’s permittivity is set to εr1 = 20. Furthermore, in the case of modified slotted patch antenna with enhanced coupling (ECMPA), it is observed that increasing the relative permittivity (εr) from 20 to 30 that led to a modification in the initial resonant frequency (fr1) of S11, moving it from 2.87 GHz to 2.79 GHz. Furthermore, the second resonant frequency (fr2) of the designed slotted patch antenna shifted from 3.27 GHz to 3.13 GHz. Moreover, it has been observed that introducing slot and enhanced coupling provides better frequency responses in MPA and ECMPA sensors while maintaining acceptable radiation characteristics, i.e., realized gain is above 4 dB and VSWR less than 2. The detailed analysis of radiation characteristics has not been provided as it is out of the scope of paper and it is more focused on sensing analysis.
In order to verify the sensitivity enhancement of the proposed slotted patch antenna with that of the standard patch antenna, the frequency change (Δf), relative frequency change in percent (PRFS), enhancement in PRFS (PRFSE), sensitivity (S) and sensitivity enhancement (SE), are calculated and plotted with respect to S11 responses using Eqs 6–10 [29]:
where, fu and fl represent the resonant frequency under unloaded and loaded (with leaf sample) conditions. The relative position of the sample under test (SUT) just above the patch’s surface plays a crucial role in determining the total capacitance and effective relative permittivity of microstrip patch sensor. As a result, the resonant frequency of S11 displays as a nonlinear function with regard to the effective relative permittivity [30,31]. indicates that the sensitivity, S, varied as the relative permittivity modified with higher values for lower relative permittivity. In this case, when the permittivity of the SUT is Ɛr = 20, the resonant frequency shift, Δfr, for the traditional patch antenna is 0.10 GHz, compared to 0.32 GHz and 0.03 GHz for the two proposed patch antennas. The percentage resonant frequency shift (PRFS) for the traditional patch antenna is 1.72%, whereas for primary and secondary proposed patch antennas, it reached at 5.52% and 0.51% correspondingly as shown in Figure 5B. Therefore, the percentage resonant frequency shift enhancement (PRFSE) of the proposed patch antennas is 3.2 and 0.3 accordingly.
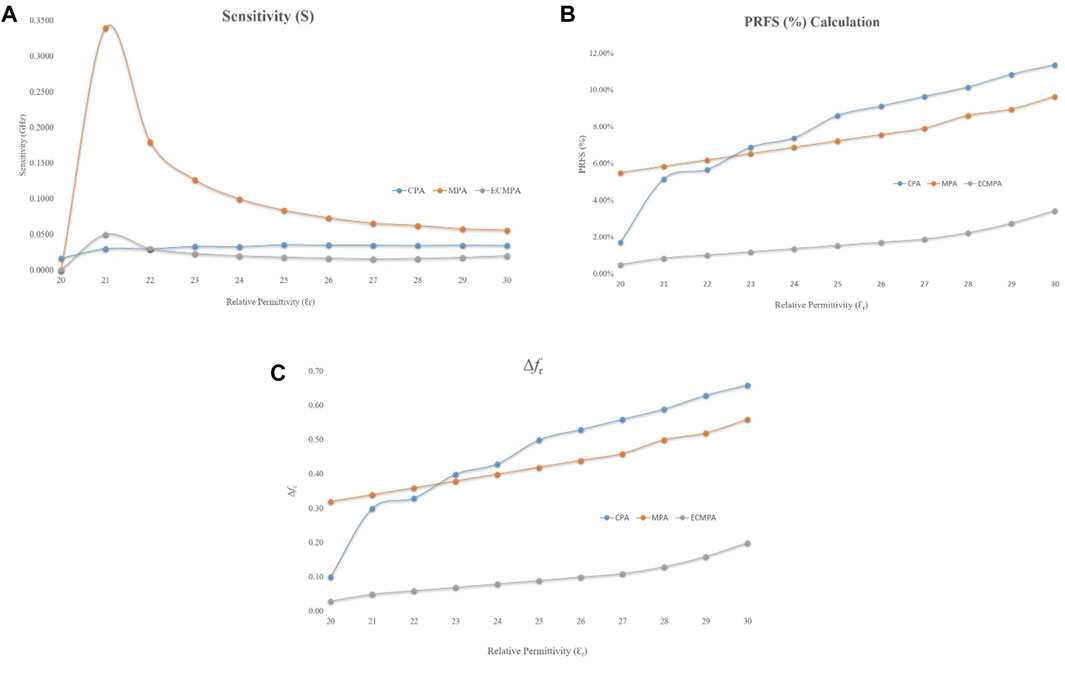
Figure 5. Comparative plots for sensitivity performance of traditional microstrip patch antenna and proposed slotted patch antennas: (A) sensitivity (S); (B) % relative frequency shift (PRFS); (C) variable resonant frequency (Δfr).
Moreover, it is evident from Figure 5C that as the permittivity of the SUT is increased to Ɛr = 30, the shift in resonant frequency, Δfr for the typical patch antenna (CPA) reached 0.68 GHz. In comparison, it reached to 0.56 GHz and 0.20 GHz for the proposed patch antennas, MPA and ECMPA respectively as depicted in Figure 5C. The PRFS for the traditional patch antenna is 11.72%. Meanwhile, for the proposed slotted patch antennas, the percentage is 9.66% and 3.44%, respectively. Subsequently, the PRFSE for both the initial (MPA) and second designed slotted patch antennas (ECMPA) is 0.84 and 0.30. Additionally, the S (sensitivity) of the modified patch antenna (MPA) and enhanced coupling slotted patch antenna (ECMPA) is 0.06 GHz and 0.020 GHz, respectively. Consequently, the sensitivity Enhancement (SE) is found out to be 1.61 GHz and 0.575 GHz respectively for the proposed designs. Therefore, it is evident that the sensitivity of the newly designed patch antennas at the resonant frequency of concern surpasses that of conventional patch antennas by a factor ranging from 0.57 to 1.61, within a relative permittivity range of 20–30.
5 Experimental process for characterization of moisture content relative to mass
The S11 parameters of the designed fabricated traditional and slotted patch antennas shown in Figures 6A–C, have been analyzed by means of an Agilent N5230A network analyzer as indicated in Figure 7A. The leaf is placed above the designed antenna sensor and the shift in resonant frequency is measured. The leaf that is used as a sample is freshly plucked from the renowned Ginkgo tree. It is important to recognize that sensitivity levels may vary between dead and living leaves, as well as between different types of leaves, due to each plant’s unique characteristics in responding to water stress. The experiments are conducted in a laboratory environment filled with various objects to simulate the complex signal propagation challenges encountered in agricultural settings. Measurements were taken under controlled conditions (temperature of 25°C ± 2°C, and 55% RH ±5% humidity) to simulate agricultural environments.
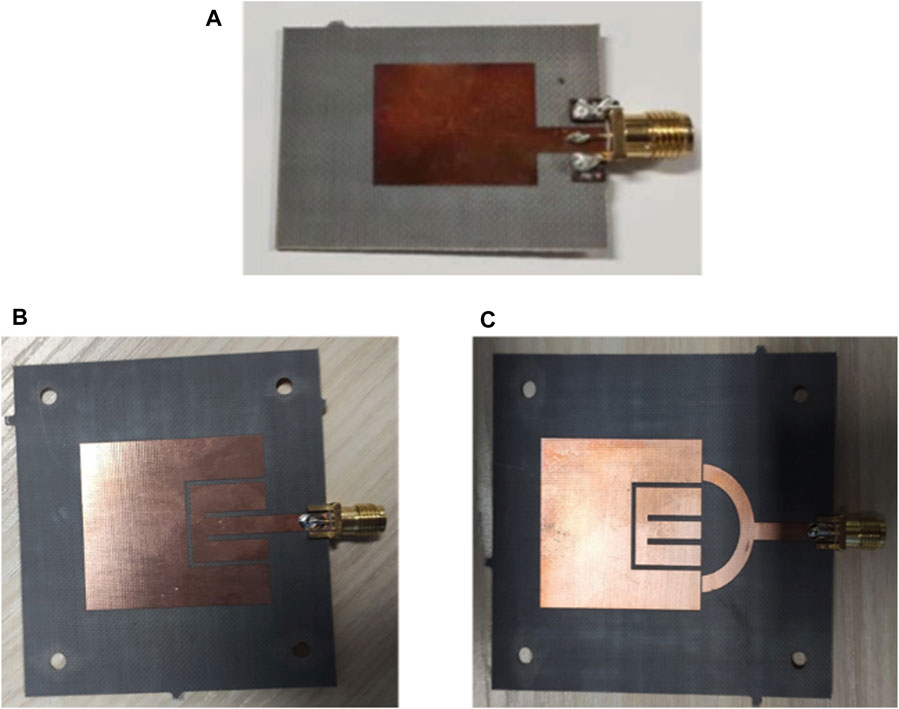
Figure 6. The fabricated slotted patch antennas: (A) standard microstrip patch antenna; (B) modified slotted microstrip patch antenna; (C) enhanced coupling slotted microstrip patch antenna.
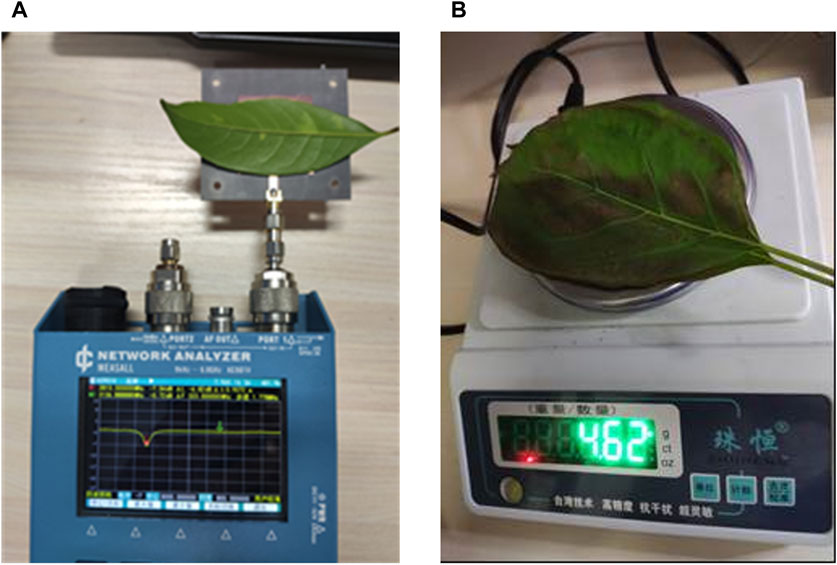
Figure 7. (A) Test bed with network analyzer (B) weighting process of the leaf after every level of water.
For the sensitivity analysis, the modified slotted patch antenna (ECMPA) is tested under moisture stress. In the moisture content analysis setup, four (4) distinct levels are chosen with water content that constitutes to approximately mass ranging from 4.96 g to 5.30 g. The weighing process is depicted in Figure 7B. Initially, with an empty sample holder and the dry leaf weighing 4.96 g, there is negligible change in the resonance frequency, indicating the baseline measurement scenario. As the leaf’s mass increases due to water absorption, observable shifts in the resonant frequency occur, attributable to the varying dielectric properties of the leaf as it transitions from dry to increasingly moist. For the simplicity of discussion, four distant moisture levels, i.e., 0%, 1.6%, 3.0%, 5.0%, and 6.9% of moisture content are selected. Consequently, the relative moisture content (mc) in leaf samples, in percentage can be calculated from Eq. 11:
where mwater and mdry leaf are the weight of water and weight of dry leaf sample.
Table 1 summarizes the results from an experiment designed to measure the moisture content in leaves, where moisture is quantified by the volume of water added, denoted as Mwet in grams. The experiment employs the designed enhanced coupled microstrip patch antenna sensor to detect changes in the moisture content through shifts in resonant frequency and insertion loss.
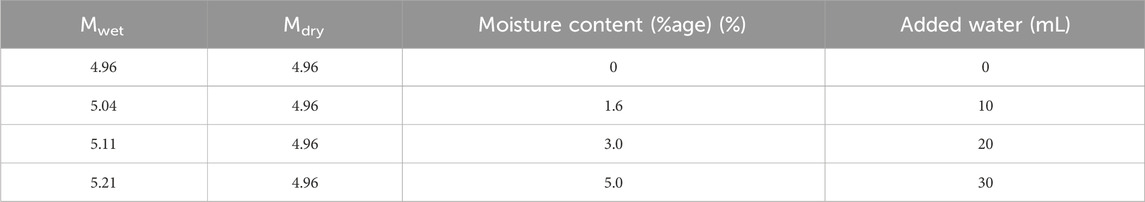
Table 1. Mass of wet leaf and moisture content (%age) by adding water.
The experimental data convey a clear correlation between the moisture content of a leaf and the resonant frequency exhibited by the enhanced coupled patch antenna (ECMPA) sensor. When the sensor is assessing a dry leaf, devoid of additional moisture, the recorded resonant frequency stands at 2.85 GHz. As the leaf’s moisture content escalates to 1.6%, there’s a discernible dip in the resonant frequency to 2.83 GHz. Progressing to 3.0%, the frequency further descends to 2.80 GHz, and with a 5.0% moisture increment, it plunges to 2.79 GHz. The most substantial moisture level tested, which is 6.9%, correlates with a resonant frequency of 2.75 GHz. This consistent downward shift in frequency with rising moisture levels is attributable to the increased dielectric constant of the leaf material. The addition of moisture elevates the dielectric constant since water possesses a higher dielectric constant relative to air. Consequently, as the moisture content within the sample under test (SUT) surges, the resonant frequency of the antenna correspondingly diminishes, affirming the sensor’s capacity to detect and quantify varying levels of leaf hydration through frequency shifts.
6 Regression analysis
Calibration fitting tool is applied to find out the which of the techniques among the relative permittivity measurement and reflection coefficient measurement is best suited for the sensitivity of the proposed sensor with respect to resonant frequency. The graph displayed in Figure 8, shows a linear regression analysis showing the relationship concerning the frequency of a slotted patch antenna (MPA) as shown in Figure 1B and the relative permittivity of a leaf, which is an indirect measure of its moisture content. As the relative permittivity increases, the frequency decreases, suggesting that moisture content has a damping effect on the frequency. The calibration equation (MC = −0.0345f + 3.323) shows the variation in moisture content (MC) as a function of frequency (f). The calibration equation is valid over a range of 2.2 GHz–2.5 GHz as it is the optimal range for sensor’s performance. The high (R2) value of 0.9539 indicates a strong linear relationship between the variables.
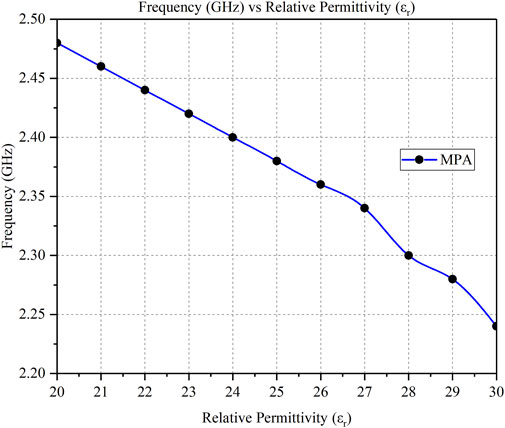
Figure 8. Calibration curve for regression analysis related to frequency (GHz) vs. permittivity (Ɛr).
Figure 9 displays a plot of resonant frequency against reflection coefficient for a slotted patch antenna, indicating moisture content (MC) calibration. As frequency increases from 2.2 to 2.5 GHz, the reflection coefficient becomes less negative, suggesting less energy is reflected back and more is absorbed by the load (leaf in this case). The calibration equation (MC = −17.54f + 26.627) with (R2 = 0.1503) is displayed, suggesting a weak linear relationship between frequency and moisture content based on reflection coefficient values. The low (R2) value indicates that reflection coefficient alone may not be a strong predictor of moisture content as mentioned in [32].
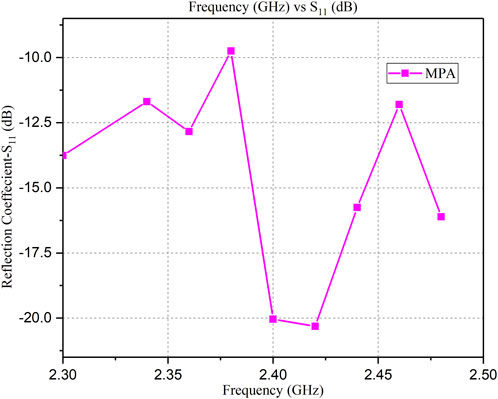
Figure 9. Calibration curve for regression analysis related to frequency (GHz) vs. reflection coefficient S11 (dB).
Moreover, regression analysis technique is performed for frequency with respect to permittivity and frequency with respect to reflection coefficient to find out which approach is much better for sensing purpose. The model summary tabulated in Table 2 indicates a high correlation coefficient (R) of 0.961, suggesting a strong positive relationship between the resonant frequency and moisture content. The R Square value of 0.924 implies that approximately 92.4% of the variability in the moisture content can be explained by the model, which is a significant proportion, indicating a strong model fit. This is further reinforced by the Adjusted R Square value of 0.916, which slightly adjusts the R Square value for the number of predictors in the model, ensuring the model’s validity despite the number of terms. The performed ANOVA analysis depicts that the regression model is statistically substantial (p-value <0.001). The coefficients generated reveals the model’s equation: Each unit decrease in frequency is associated with a significant increase in moisture content, as shown by the large negative coefficient for frequency. The calculated t-values and corresponding p-values indicate that both the intercept and slope are significantly different from zero, reinforcing the model’s predictive.

Table 2. Summary of the performed Regression Analysis.
6.1 Calculation of mean relative error
Additionally, the mathematical validation leads to determining the sensitivity of the experimental data by Eq. 9 whereas the MRE (mean relative error) for the moisture content is found out by Eq. 12:
Where, MCActual is the moisture content being measured via experimental analysis depicted in Table 1. The value of predicted moisture content (PMC) is determined by plotting a calibration curve between frequency and permittivity of the SUT as depicted in Figure 8. The calibration curve provided the calibration equation, i.e., MC = −0.0345f + 3.323. It is calculated at second level of actual moisture content (AMC), which is at 3.55%. By using the calibration equation, the PMC is derived at 3.43%. Therefore, the mean relative error (MRE) at this point is determined as 0.0338 which is an indication of a very low error between the predicted and measured values. Moreover, the designed slotted patch antenna sensor depicts better sensitivity, i.e. 2% and lower MRE, i.e. 0.038 as compared to previous research work done in moisture content detection [33].
7 Comparison with previous research
Table 3 provides comparative analysis of the proposed ECMPA sensor with the three sensor designs used for moisture content detection in different materials. The proposed design of the enhanced coupled microstrip patch antenna (ECMPA) sensor presents several advancements over the previous reported designs [24,34,35] as indicated by various parameters. With dimensions of 47.7 × 56.3 mm2, it is larger than previous design 1, potentially offering a more extensive surface area for interaction, which can be crucial for sensing performance. It operates at lower frequencies of 2.87 GHz and 3.2 GHz compared to previous designs 1 and 3, which could allow for deeper penetration into materials, beneficial for specific sensing applications. In contrast, its frequencies are somewhat similar to previous design 2, suggesting possible similarities in penetration capabilities. The choice of leaf as the sensing material for the proposed design suggests a specialized or targeted application, possibly in the agricultural or environmental monitoring sectors, differing from the rice, granular, and soil materials of the previous designs. This specificity could leverage the unique properties of leaves in sensing applications. The substrate material, F4B, differs from the FR4 used in previous design 1, which can affect the antenna’s performance characteristics such as dielectric properties and mechanical stability. Cost-wise, the proposed design is noted as the cheapest, offering a significant advantage in terms of affordability and accessibility for widespread use. Its performance in terms of accuracy is substantiated by a high R2 value of 0.954, far surpassing the 0.411 and 0.57 of design 1 and design 3, indicating a reliable and accurate model fitting which is crucial for sensor efficacy. In terms of moisture sensing, the proposed design can detect a range from 0.86% to 22.48%, offering a more precise and suitable range for specific applications compared to range of previous design 1, 2, and 3. Finally, its mean relative error (MRE) at 0.30% is significantly lower than that of the other designs, underscoring its superior accuracy and reliability in sensing applications.
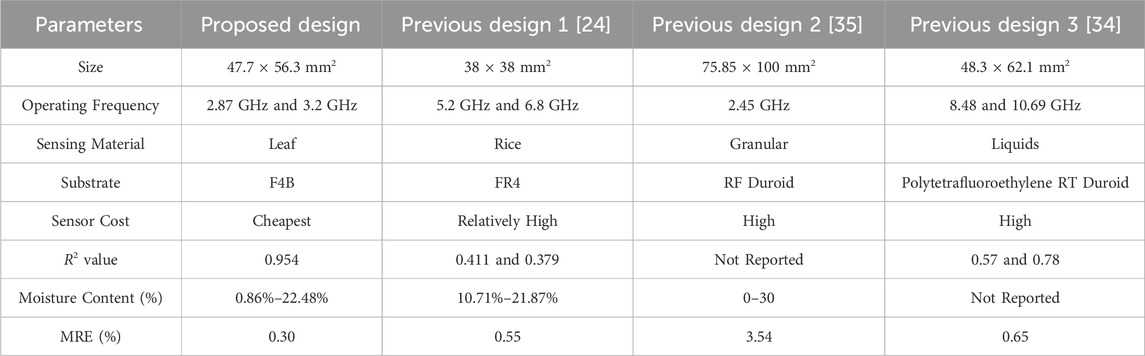
Table 3. Comparative Analysis with previous designs.
Hence, it can be proved with this method that he resonant frequency of the microstrip patch antenna decreases as the moisture content of the leaf increases due to the variation in relative permittivity as proved in previous research [36]. It is due to the fact that the water molecules in the leaf absorb some of the electromagnetic radiation, which reduces the resonant frequency of the antenna. This method of measuring leaf moisture content is non-destructive and can be used in a variety of applications, such as agriculture, environmental monitoring, and plant physiology research.
8 IOT system for moisture content detection
The architectural framework of any system is pivotal in delineating its structure and elucidating the functionality of its components. In the realm of IoT-based systems, numerous architectures have been suggested. The Service Oriented Architecture (SOA), renowned for its efficacy in smart applications, is adopted for the proposed IOT based moisture content detection system due to its simplicity and clear delineation of components. The IOT system as an architecture, encompasses four layers: sensing, network, service, and interface [37].
8.1 Sensing layer
Central to the IoT system is the sensing layer, focused on the “things”—in our context, a microstrip patch antenna designed for moisture sensing in leaves. The primary challenge is engineering a sensor with the precision to detect moisture content accurately. Utilizing a microstrip patch antenna with slotted enhancements, based on the principle of effective permittivity changes, we targeted the microwave frequency range known for its sensitivity to moisture content. Selecting a 2–3 GHz frequency for its compact size and effective correlation with moisture content, the research embarked on optimizing the antenna’s sensitivity through various techniques, including enhanced coupling, to ensure minute variations in moisture content are detectable.
8.2 Network layer
Achieving reliable wireless connectivity for developed sensor to transmit data is crucial. By integrating the sensor within a SOA framework, it ensures modular manageability suited for agricultural settings [38]. After evaluating various communication technologies, Bluetooth Low Energy (BLE) emerged as the optimal choice due to its low energy consumption, compatibility with numerous operating systems, and effective data rate for our application. This BLE-based network facilitates seamless data transmission from the sensor to the gateway, ensuring real-time monitoring of leaf moisture levels.
8.3 Service layer
The service layer, demanding significant computational resources, is hosted on a robust Dell precision tower 3960 workstation, equipped to handle the intensive tasks of data storage, analysis, and reporting. This local-cloud setup not only supports real-time operations but also enables data analytics, essential for the comprehensive IoT-based leaf moisture monitoring system. The system is designed to offer a plethora of services crucial for processing and analyzing the data collected from the field.
8.4 Interface layer
The user interface, developed in LabView®, allows for direct interaction with the system, presenting processed data to users in an accessible manner. This application, coupled with LabView web services, enables both local and remote monitoring of moisture levels, facilitating timely decision-making in agricultural management. Through RESTful API, the system ensures data is shared seamlessly, allowing users to access real-time information and thus optimize irrigation practices based on the moisture content detected by our sophisticated sensor. The flowchart illustration of an IOT-based leaf moisture content monitoring system is depicted in Figure 10.
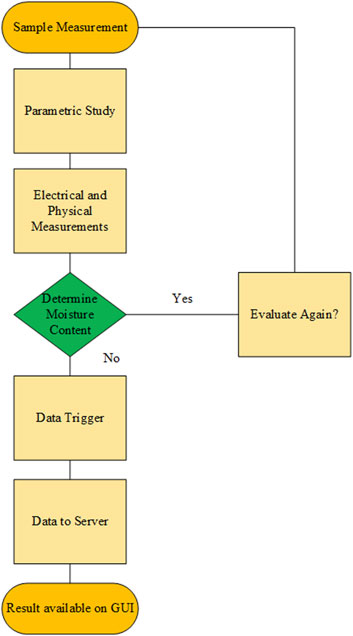
Figure 10. Flowchart of an IOT-based leaf moisture content monitoring system.
8.5 IOT based monitoring system
Evaluating the effectiveness of a cutting-edge IoT-based leaf moisture sensing system is the primary aim of the research. An experimental setup is established, as shown in Figure 11, within a laboratory designed to replicate the varying conditions typical of an agricultural setting as proposed by [39]. A microstrip patch antenna sensor, crucial to the research, is strategically placed few meters away from the gateway node to mirror the real-world deployment distance in a field, though for visualization purposes in Figure 11, it is presented next to the gateway.
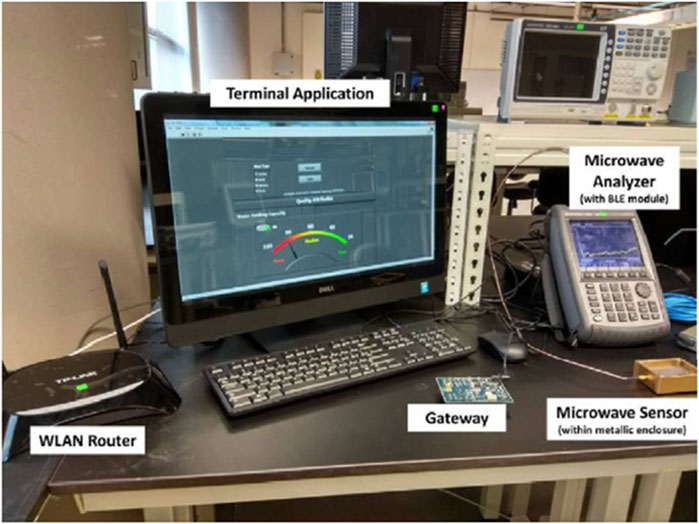
Figure 11. A real-time IOT based monitoring system in lab.
The selected laboratory environment is intentionally filled with various objects, such as equipment and furniture, to simulate the complex signal propagation challenges encountered in agricultural environments. This configuration is chosen to evaluate the durability of the wireless network against the physical barriers common in farming areas. Furthermore, the laboratory included two WLAN routers positioned at different sites to determine the system’s capability to withstand interference.
As detailed in Figure 11, the microstrip patch antenna is connected to a high-precision microwave analyzer, which is equipped with a BLE adapter, emphasizing the system’s applicability to IoT scenarios. The calibration of the system is conducted through standardized procedures to ensure the accuracy of measurements, focusing on the S11 parameter across a broad frequency spectrum.
Before introducing leaf samples, a baseline performance of the system is recorded to identify the unloaded resonance frequency. Subsequently, leaf samples with precise dimensions are placed onto the sensor, aligning carefully with the antenna’s enhanced coupling region for accuracy. Multiple measurements are taken for each sample to verify the consistency of the data. The orientation of the samples is meticulously arranged to facilitate optimal interaction with the electromagnetic fields, a vital factor for precise moisture detection. All experiments are performed under controlled conditions—maintaining a steady temperature of 25°C ± 2°C and humidity levels within 55% RH ± 5%—to closely mimic the operational environment of the IoT-based system in an agricultural context, thus confirming its potential for practical applications. The detailed working of the idea is to be presented as future research.
9 Conclusion
The research presented herein introduces an innovative approach to moisture measurement in foliage through the use of modified slotted microstrip patch sensor antennas, showcasing a marked improvement in sensitivity over the conventional patch antenna models. Our findings reveal that the sensitivity of these newly developed slotted patch antennas surpasses that of the traditional designs by a factor ranging from 0.57 to 1.67 when tested against dielectric samples with constants in the 20 to 30 range. Fabricated on a 0.8 mm F4B substrate, these antennas achieve operational resonance frequencies between 2.4 and 3.0 GHz without load. The key to their enhanced performance lies in the strategic integration of slots above the antenna’s feed point, coupled with an advanced coupling technique, elevating their sensitivity levels. Moreover, an IOT based implementation for real time monitoring is also presented. Such improvements position the modified slotted patch antennas as highly versatile tools, suitable for a wide array of applications that span from proximity sensing in automated systems to the wireless monitoring of biological materials, the measurement of permittivity in both solid and liquid mediums, and the non-destructive evaluation of moisture content in soils, foods, and various liquids. This versatility, combined with their increased sensitivity, underscores the potential of these antennas to significantly advance the field of IoT implementations by providing more accurate and reliable sensors for a multitude of applications.
Data availability statement
The original contributions presented in the study are included in the article/Supplementary material, further inquiries can be directed to the corresponding author.
Author contributions
MK: Conceptualization, Data curation, Formal Analysis, Funding acquisition, Investigation, Methodology, Project administration, Resources, Software, Supervision, Validation, Visualization, Writing–original draft, Writing–review and editing. XL: Funding acquisition, Investigation, Methodology, Project administration, Supervision, Validation, Writing–review and editing. CZ: Conceptualization, Investigation, Methodology, Validation, Writing–review and editing. AS: Software, Writing–review and editing.
Funding
The author(s) declare financial support was received for the research, authorship, and/or publication of this article. The research received financial support from the National Natural Science Foundation of China (NSFC) under Grant No. 61571084 and is also partly funded by the Fundamental Research Funds for the Central Universities (FRFCU) under Grant No. ZYGX2019Z022, acknowledging the institutional and financial backing that facilitated this study.
Conflict of interest
The authors declare that the research was conducted in the absence of any commercial or financial relationships that could be construed as a potential conflict of interest.
Publisher’s note
All claims expressed in this article are solely those of the authors and do not necessarily represent those of their affiliated organizations, or those of the publisher, the editors and the reviewers. Any product that may be evaluated in this article, or claim that may be made by its manufacturer, is not guaranteed or endorsed by the publisher.
References
1. Li J, Hong X, Wang F, Yang L, Yang D, Simultaneous retrieval of corn growth status and soil water content based on one GNSS antenna. Remote sensing (2023) 15(7):1738. doi:10.3390/rs15071738
2. Nguyen TPT, Do TG, Dao PT, Le MT, Underground soil moisture sensor based on monopole antenna for precision agriculture. In: 2023 IEEE International Conference on Industry 4.0, Artificial Intelligence, and Communications Technology (IAICT). Bali, Indonesia: IEEE (2023). doi:10.1109/IAICT59002.2023.10205648
3. Huang H, Flexible wireless antenna sensor: a review. IEEE sensors J (2013) 13(10):3865–72. doi:10.1109/jsen.2013.2242464
4. Huang H. Antenna sensors in passive wireless sensing systems. Handbook Antenna Tech (2016) 2795–838. doi:10.1007/978-981-4560-44-3_86
5. Saeed K, Shafique MF, Byrne MB, Hunter IC, Planar microwave sensors for complex permittivity characterization of materials and their applications. Appl Meas Syst (2012) 319–50. doi:10.5772/36302
6. Fratticcioli E, Dionigi M, Sorrentino R, A simple and low-cost measurement system for the complex permittivity characterization of materials. IEEE Trans Instrumentation Meas (2004) 53(4):1071–7. doi:10.1109/tim.2004.830753
7. Withayachumnankul W, Tuantranont A, Fumeaux C, Abbott D. Metamaterial-based microfluidic sensor for dielectric characterization. Sensors Actuators A: Phys (2013) 189:233–7. doi:10.1016/j.sna.2012.10.027
8. Jirousek EP, Material characterization using complementary split ring resonators. Diploma Thesis, Technische Universität Wien (2022). doi:10.34726/hss.2022.93500
9. Herrmann PSd. P, Sydoruk V, Marques Porto FN, Microwave transmittance technique using microstrip patch antennas, as a non-invasive tool to determine soil moisture in rhizoboxes. Sensors (2020) 20(4):1166. doi:10.3390/s20041166
10. Bahl I, Bhartia P, Stuchly S, Design of microstrip antennas covered with a dielectric layer. IEEE Trans antennas propagation (1982) 30(2):314–8. doi:10.1109/tap.1982.1142766
11. Zambrano MV, Dutta B, Mercer DG, MacLean HL, Touchie MF. Assessment of moisture content measurement methods of dried food products in small-scale operations in developing countries: a review. Trends Food Sci Tech (2019) 88:484–96. doi:10.1016/j.tifs.2019.04.006
12. Bekal A, Balsubramaniam BG, Awaghade V, Ghute S, Application of microwave moisture sensor for DOC and animal feed. IEEE Sensors J (2020) 20(24):14809–16. doi:10.1109/jsen.2020.3010574
13. Jiarasuwan S, Chamnongthai K, Kittiamornkul N, A design method for a microwave-based moisture sensing system for granular materials in arbitrarily shaped containers. IEEE sensors J (2021) 21(17):19436–52. doi:10.1109/jsen.2021.3087414
14. Bartley PG, Nelson SO, McClendon RW, Trabelsi S, Determining moisture content of wheat with an artificial neural network from microwave transmission measurements. IEEE Trans Instrumentation Meas (1998) 47(1):123–6. doi:10.1109/19.728803
15. Kim K-B, Kim J-H, Lee SS, Noh SH. Measurement of grain moisture content using microwave attenuation at 10.5 GHz and moisture density. IEEE Trans Instrumentation Meas (2002) 51(1):72–7. doi:10.1109/19.989904
16. Zhang H-L, Ma Q, Fan L-F, Zhao P-F, Wang J-X, Zhang X-D, et al. Nondestructive in situ measurement method for kernel moisture content in corn ear. Sensors (2016) 16(12):2196. doi:10.3390/s16122196
17. Lin L, He Y, Xiao Z, Zhao K, Dong T, Nie P, Rapid-detection sensor for rice grain moisture based on NIR spectroscopy. Appl Sci (2019) 9(8):1654. doi:10.3390/app9081654
18. Gilmore C, Asefi M, Paliwal J, LoVetri J, Industrial scale electromagnetic grain bin monitoring. Comput Elect Agric (2017) 136:210–20. doi:10.1016/j.compag.2017.03.005
19. Zhang C, Shi Z, Yang H, Zhou X, Wu Z, Jayas DS, A novel, portable and fast moisture content measuring method for grains based on an ultra-wideband (UWB) radar module and the mode matching method. Sensors (2019) 19(19):4224. doi:10.3390/s19194224
20. Fan L, Chai Z, Wang Y, Wang Z, Zhao P, Li J, et al. A novel handheld device for intact corn ear moisture content measurement. IEEE Trans Instrumentation Meas (2020) 69(11):9157–69. doi:10.1109/tim.2020.2994603
21. Javanbakht N, Xiao G, Amaya RE, Sangha J, Ruan Y, Compact frequency selective surface antenna for grain moisture content monitoring. In: 2021 IEEE 19th International Symposium on Antenna Technology and Applied Electromagnetics (ANTEM). Winnipeg MB, Canada: IEEE (2021), pp. 1-2. doi:10.1109/ANTEM51107.2021.9518859
22. Singh U, Ahmed A, Mukherjee J, Microstrip Patch antenna as sensor based on Meta material integrated structures for non-invasive characterization of biological materials. IEEE Sensors J (2024) 24:9970–81. doi:10.1109/jsen.2024.3365526
23. Bansal S, Kaur P, Microstrip and metamaterial embedded patch antenna sensors for determination of moisture in rice, wheat, and pulse grains. J Electrochem Soc (2024) 171(1):017504. doi:10.1149/1945-7111/ad1c17
24. Jain S, Mishra PK, Thakare VV, Mishra J, Design of microstrip moisture sensor for determination of moisture content in rice with improved mean relative error. Microwave Opt Technol Lett (2019) 61(7):1764–8. doi:10.1002/mop.31763
26. Khan MT, Lin XQ, Chen Z, Xiao F, Yan YH, Memon AK, Design and analysis of a microstrip patch antenna for water content sensing. In: 2019 16th International Computer Conference on Wavelet Active Media Technology and Information Processing. Chengdu, China: IEEE (2019), pp. 438-442.
28. Khan MT, Ali SM, A brief review of measuring techniques for characterization of dielectric materials. Int J Inf Tech Electr Eng (2012) 1(1):1–5.
29. Salim A, Lim S, Complementary split-ring resonator-loaded microfluidic ethanol chemical sensor. Sensors (2016) 16(11):1802. doi:10.3390/s16111802
30. You K, Salleh J, Abbas Z, You L, A rectangular patch antenna technique for the determination of moisture content in soil. Prog Electromagnetics Res (2010) C:850–4.
31. Yahaya NZ, Abbas Z, Ali BM, Ismail A, Ansarudin F, Intercomparison of methods for determination of resonant frequency shift of a microstrip patch antenna loaded with hevea rubber latex. J Sensors (2014) 2014:1–9. doi:10.1155/2014/656972
32. Jain S, Mishra PK, Thakare VV, Mishra J, Microstrip moisture sensor based on microstrip patch antenna. Prog Electromagnetics Res M (2018) 76:177–85. doi:10.2528/pierm18092602
33. Yeo J, Lee J-I, Slot-loaded microstrip patch sensor antenna for high-sensitivity permittivity characterization. Electronics (2019) 8(5):502. doi:10.3390/electronics8050502
34. Ghretli MM, Khalid K, Grozescu IV, Sahri MH, Abbas Z, Dual-frequency microwave moisture sensor based on circular microstrip antenna. IEEE Sensors J (2007) 7(12):1749–56. doi:10.1109/jsen.2007.908920
35. Limpiti T, Krairiksh M, In situ moisture content monitoring sensor detecting mutual coupling magnitude between parallel and perpendicular dipole antennas. IEEE Trans Instrumentation Meas (2012) 61(8):2230–41. doi:10.1109/tim.2012.2186656
36. Jilani MT, Wen WP, Rehman MZU, Khan AM, Cheong LY, Microwave sensor for non-destructive dielectric characterization of biological systems. Int J Appl Electromagnetics Mech (2016) 50:353–63. doi:10.3233/jae-150114
37. Haq AU, Li JP, Agbley BLY, Khan A, Khan I, Uddin MI, et al. IIMFCBM: intelligent integrated model for feature extraction and classification of brain tumors using MRI clinical imaging data in IoT-healthcare. IEEE J Biomed Health Inform (2022) 26(10):5004–12. doi:10.1109/jbhi.2022.3171663
38. Li JP, Haq AU, Din SU, Khan J, Khan A, Saboor A, Heart disease identification method using machine learning classification in e-healthcare. IEEE access (2020) 8:107562–82. doi:10.1109/access.2020.3001149
Keywords: microstrip, patch, antenna, sensor, IoT, regression analysis
Citation: Khan MT, Lin XQ, Zhe C and Saboor A (2024) Design, analysis and validation of a microstrip patch antenna with enhanced coupling for leaf moisture sensing: an IoT approach. Front. Phys. 12:1402326. doi: 10.3389/fphy.2024.1402326
Received: 17 March 2024; Accepted: 15 April 2024;
Published: 01 May 2024.
Edited by:
Xin Lu, De Montfort University, United KingdomReviewed by:
Saima Qureshi, University of Novi Sad, SerbiaMuhammad Awais, University of East Anglia, United Kingdom
Mitar Simic, University of Novi Sad, Serbia
Copyright © 2024 Khan, Lin, Zhe and Saboor. This is an open-access article distributed under the terms of the Creative Commons Attribution License (CC BY). The use, distribution or reproduction in other forums is permitted, provided the original author(s) and the copyright owner(s) are credited and that the original publication in this journal is cited, in accordance with accepted academic practice. No use, distribution or reproduction is permitted which does not comply with these terms.
*Correspondence: Xian Qi Lin, xqlin@uestc.edu.cn