 Thomas Barta1
 Walter Sandtner2Johann Wachlmayr1Christof Hannesschlaeger1
 Andrea Ebert3Armin Speletz1
 Andreas Horner1*
- 1Department of Molecular Biophysics and Membrane Biophysics, Institute of Biophysics, Johannes Kepler University Linz, Linz, Austria
- 2Center of Physiology and Pharmacology, Institute of Pharmacology and the Gaston H. Glock Research Laboratories for Exploratory Drug Development, Medical University of Vienna, Vienna, Austria
- 3Department of Analytical Environmental Chemistry, Helmholtz Centre for Environmental Research—UFZ, Leipzig, Germany
The reconstitution of secondary active transporters into liposomes shed light on their molecular transport mechanism. The latter are either symporters, antiporters or exchangers, which use the energy contained in the electrochemical gradient of ions to fuel concentrative uptake of their cognate substrate. In liposomal preparations, these gradients can be set by the experimenter. However, due to passive diffusion of the ions and solutes through the membrane, the gradients are not stable and little is known on the time course by which they dissipate and how the presence of a transporter affects this process. Gradient dissipation can also generate a transmembrane potential (VM). Because it is the effective ion gradient, which together with VM fuels concentrative uptake, knowledge on how these parameters change within the time frame of the conducted experiment is key to understanding experimental outcomes. Here, we addressed this problem by resorting to a modelling approach. To this end, we mathematically modeled the liposome in the assumed presence and absence of the sodium glucose transporter 1 (SGLT1). We show that 1) the model can prevent us from reaching erroneous conclusions on the driving forces of substrate uptake and we 2) demonstrate utility of the model in the assignment of the states of SGLT1, which harbor a water channel.
1 Introduction
Solute carriers (SLCs) serve as gatekeepers for vital physiological functions, including cellular uptake of minerals, vitamins, and nutrients as well as removal of metabolites from the interior of cells (Hediger et al., 2004; Omote et al., 2006; Sano et al., 2020). Mutations in the genes encoding SLC proteins are linked to a plethora of diseases, such as amyotrophic lateral sclerosis [prevalence in the United States in 2016; 0.52% (Mehta et al., 2021)], Alzheimer’s disease [prevalence in Europe; 5.05% (Niu et al., 2017)], and schizophrenia [prevalence in 46 countries worldwide; 0.46% (Saha et al., 2005)]. Extrapolated to the world population of 2021, these three conditions alone amount to as many as 470 million annual patients. In addition, SLC’s like the sodium glucose transporter 1 (SGLT1) play a pivotal role in metabolism, i.e., glucose uptake. Although SLCs have been studied for many years using biophysical and biochemical approaches as for example electrophysiology and radio-ligand uptake experiments, nevertheless, there is a great deal that we still don’t know about their true conformations whilst working against concentration gradients. Hence, there is an urgent need to employ novel approaches so as to gain insight into how SLCs operate.
SLCs undergo long range conformational changes between inward- and outward-open states. As a consequence, the substrate can either bind to the extra- or the intracellular side of the protein but not to both sides simultaneously. For this reason, all SLCs operate within the conceptual framework of the alternating access model (Jardetzky, 1966). Many of them can harvest the energy contained in ion gradients to drive uphill transport of their substrate against an opposing gradient. Others work as exchangers or facilitate passive diffusion of polar solutes. In addition to the ion and substrate gradients, the membrane potential (VM) also impinges on transporter function. As intimated above, solute carrier function is classically explored by monitoring uptake of radiolabeled substrate into a cell in which the transporter is expressed. However, substrate accumulation can also be measured in an artificial vesicle system relying on radioactivity (Billesbolle et al., 2016) or fluorescence (Erokhova et al., 2016). Whereas the VM across cellular membranes is largely stable, it is a dynamic variable in artificial vesicle systems. This is because in cells, the ion gradients are maintained by pumps so that they do not dissipate on passive diffusion and transport by SLCs, which is not the case in proteoliposomes. Hence, disregarding VM in in vitro experiments may lead to erroneous conclusion on the driving forces of substrate uptake by SLCs.
Of the SLC group of proteins, SGLT1 is one of the best studied representatives. This transporter is expressed at high levels on the microvilli of the brush border membrane of enterocytes within the alimentary canal (Hwang et al., 1991). In addition to nutrients, the small intestine also absorbs approximately 8 L of fluid daily. Because aquaporines are absent in enterocytes, it was speculated that SGLT1 acts as conduit for water. Primary experimental evidence for the existence of a water channel passing through the transporter came from in vitro experiments utilizing reconstituted human SGLT1 and from experiments conducted on this protein while expressed in cell monolayers. Per second, the number of transported water molecules (109) exceeded by far the glucose turnover number of SGLT1, which was only in the order of a few hundred molecules (Erokhova et al., 2016). These results led to the postulation that perhaps additional SLCs (Erokhova et al., 2016; Zeuthen et al., 2016) might also be important in the regulation of transcellular water flux. Molecular dynamics (MD) simulations confirmed the passive water transport capability of SGLT1 in its inward-facing state (Li et al., 2013; Adelman et al., 2014). Moreover, a continuous water channel passing within the sugar-binding site was identified in the bacterial homologue vSGLT (Li et al., 2013; Adelman et al., 2014). Extensive simulations carried out on a variety of transporters superfamilies concluded that water-conducting states likely represent a universal phenomenon in membrane transporters, including those belonging to the solute sodium symporter; solute carrier 1; major facilitator superfamily; nucleobase-cationsymport-1; and ATP binding cassette families. It was speculated that this phenomenon is a consequence of transporter reliance on large-scale motions (Li et al., 2013). Experimental results using human SGLT1 (Erokhova et al., 2016; Zeuthen et al., 2016) indicated a shared pathway of water with glucose but not with Na+. However, it is still unknown which states in the transport cycle are permeable for water and which are not.
In the present study, we built a mathematical model of SGLT1 incorporated into an artificial membrane (i.e., unilamellar vesicles). To model the flux of substrate and co-substrate through the transporter, we utilized a previously published kinetic model of human SGLT1 (Wright et al., 2011). Importantly, our approach also accounted for passive diffusion of ions and solutes through the vesicular membrane. We provided predictions regarding the intraluminal concentrations of the ions and solutes, vesicle volume (through osmotic effects), and the transmembrane potential change on (experimental) perturbation (e.g., challenge with the substrate or osmolytes). Another output of the computation were the state occupancies of SGLT1, which depended on the above-mentioned parameters (e.g., VM and ion concentrations). We emulated two types of experiments: 1) radio-ligand uptake experiments and 2) stopped flow experiments of the kind that allow for measuring water flux. With these two approaches we demonstrated the utility of our equations in the interpretation of experimental outcomes.
2 Results
2.1 Parameterizing a Virtual Model for a Unilamellar Vesicle
Displayed in Figure 1 is a schematic representation of our model system (i.e., unilamellar vesicle). This system is comprised of a lipid bilayer, which separates the intra-vesicular space from the surrounding bath solution. In the model, the initial concentrations of the ions and the sugars (i.e., glucose and sucrose) on the opposing sides of the membrane can be set to user-defined values. On start of the simulation, the system equilibrates. Depending on the chosen initial concentrations of the ions and the sugars the following changes can ensue: 1) changes in vesicular volume, if the osmotic concentrations of the intra-and extra-vesicular solutions differ, 2) changes in the concentrations of the intra-vesicular ions and sugars due to passive diffusion of these molecules through the membrane and 3) changes in membrane potential, caused by positive/negative net-charge leaving or entering the vesicle. Indicated in the diagram are the passive fluxes of the ions [i.e., Na+, K+, H+, Cl−, and NMDG+ (N-Methyl-D-glucamin)], water, and glucose/sucrose. In the model, we parameterized these fluxes, with membrane permeabilities (PM values) obtained from the literature. In the case of NMDG+ we determined this value experimentally (see Section 4). For simplicity, we assumed that the extra-vesicular concentrations of all ions and sugars remain constant. This was justified by the fact that in the experiments, which we simulated, the extra-vesicular volume exceeded the combined volume within the vesicles by more than two orders of magnitude. For this reason, depletion of the solutes in the bath solution was considered negligible. A comprehensive description of the model can be found in Section 4.
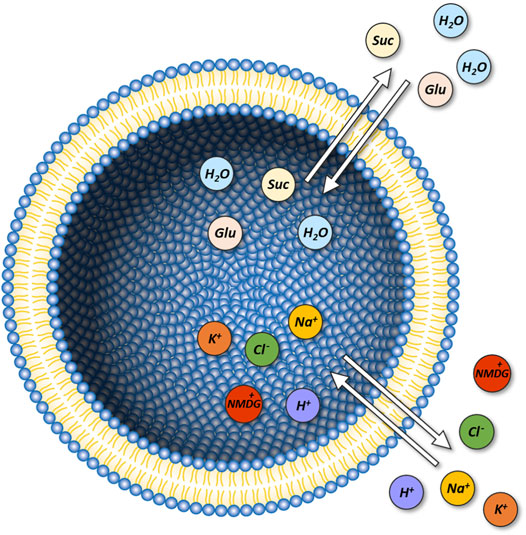
FIGURE 1. Model of a unilamellar vesicle. Initial
2.2 Passive Ion Permeation Through the Vesicular Membrane can Generate a Membrane Potential (VM)
Ions differ in their ability to passively permeate through membranes (Hannesschlaeger et al., 2019a). For instance, anions like Cl− can cross membranes more readily than cations such as Na+. This is because of the dipole potential, which exists within the membrane and which repels positive charges. If the magnitudes of the passive fluxes of cations and anions differ and if for these ions a transmembrane gradient exists, a net flux of charge through the membrane ensues. The same is true, if the different species of cations and anions, present in the assay, permeate through the membrane with differing velocities due to differences in their ionic radii (e.g., Na+ versus K+ or Na+ versus NMDG+). The resulting net flux of charge gives rise to a change in the membrane potential (VM). In turn, the electrical field generated by VM impinges on the flux of the charged particles.
We used our model of the vesicle to better understand how passive ion fluxes through the membrane affect VM and the intra-vesicular ion concentrations. In the example depicted in Figure 2 we assumed that the Na+ and Cl− concentrations were the same on both sides of the membrane (i.e., 100 mM NaCl). We further assumed the additional presence of 10 mM K+Cl− and 10 mM NMDG+Cl− on the extra- and intraluminal side, respectively. We stress that in the chosen example, the osmotic concentrations of the inner and outer solution were kept equal. In a first equilibration step we only allowed for passive diffusion of K+ (grey shaded area in Figure 2). In the upper panel of Figure 2 we show VM as a function of time for two different reported PM values of K+. On equilibration, about 220 K+ ions entered the lumen of the vesicle, upon which VM adopted a value of approximately 80 mV. At this VM the electric force equaled the force exerted by the chemical potential of K+, which is why the K+ flux seized. After equilibrium was reached (i.e., 150 h) we let all other ion-species permeate. As seen, this gave rise to anew change in VM and the intracellular ion concentrations (lower panel of Figure 2). However, in contrast to the changes which had ensued when K+ was the only permeating ion, the changes on permeation of all ions were transient. This was because with all ions permeating their gradients eventually dissipated. This is evident on inspection of Figure 2, where we show that the final intra-vesicular ion concentrations matched exactly the concentrations on the extra-vesicular side. In the absence of ion gradients, VM was zero and no osmotic force was exerted onto the membrane. The transient changes in VM and the intracellular ion concentrations occurred before the system had reached equilibrium. However, the extent and time course of these changes depended on the velocities by which the different ion species traveled through the membrane. This is evident from the two plotted curves in Figure 2, which show that the changes in vesicle parameters were highly dependent on which of the two reported membrane permeabilities for K+ were used in the simulation.
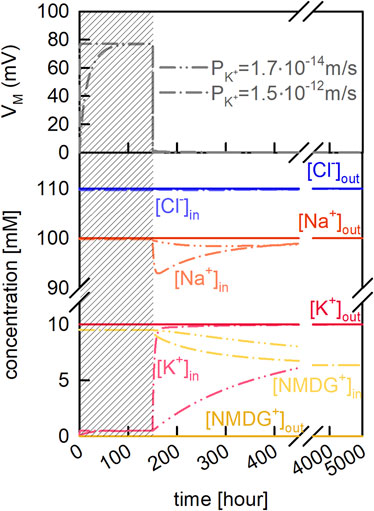
FIGURE 2. Passive ion permeation through the vesicular membrane. Vesicle assay kinetics simulated with two different PM values for potassium (taken from Table 2 of Paula et al. [Paula et al., 1996)]. Dash-dot-dotted lines and dash-dotted lines show simulations in which
2.3 The Membrane Potential Across Vesicular Membranes Depends on the Initial Ion Concentrations at the Intra-and Extra-Vesicular Side
Secondary active transporters use the energy contained in the electrochemical gradient of ions to fuel concentrative uptake of their cognate substrate (Burtscher et al., 2019). Hence, assessment of their function relies on experimental systems, which allow for adjustment of the transmembrane ion gradients. In vesicles these gradients can be set by the experimenter. However, as shown before, in the vesicle these gradients and the membrane potential are expected to change in a time dependent manner, due to passive diffusion of ions through the membrane. This can complicate the interpretation of experimental outcomes. We demonstrate this with an example.
Let’s assume we believe that a candidate Na+ symporter antiports K+ in the return step from the substrate-free inward- to the substrate-free outward-facing conformation and that it can thereby tap the energy contained in the electrochemical gradient of K+. This, for instance, was shown to be the case for the serotonin transporter (SERT-SLC6A4) and for transporters in the SLC1 family (glutamate transporters) (Rudnick and Sandtner, 2019; Wang, et al., 2020). We could test this by preparing vesicles, which contain K+ or the inert cation NMDG+ instead. Let’s further assume that we find the concentrative power of the secondary active transporter, which we reconstituted into these vesicles, higher in the presence than in the absence of intra-vesicular K+. Is it now safe to conclude that this transporter antiports K+?
The issue, here, is that the concentrative power of a secondary active transporter can also depend on VM, if the transporter under scrutiny is electrogenic (i.e., one or more net charges are transported through the membrane in each transport cycle). The question, therefore, is whether the two tested experimental conditions can give rise to differing VMs. In Figure 3 (left panel) we show the time course of the VM change on equilibration for the two different conditions. The chosen PM values for Na+, Cl−, and K+ are indicated in the figure (black bar). We simulated the evolution of VM for 1,000 s. As seen, on start of the simulation VM rapidly diverged from zero. More importantly, the VM values for the two conditions differed by about 10 mV after a few minutes. Given this result we can no longer be sure that the increase in concentrative power, which we observed in the experiment, is supportive of K+ antiport. Arguably, this increase could also have been caused by the difference in VM. Admittedly, the divergence in the VM values in the shown simulations was conditioned on the chosen PM values for the ions. We obtained the values for Na+, Cl− and K+ from the literature. Yet, the spread in the reported values for these ions is considerable (see Table 1). For NMDG+ no experimentally determined PM value was available. Because of its large size this cation was considered impermeable (Dhoke et al., 2005; Elustondo et al., 2013; Reuss, 1979). However, what has been frequently overlooked is that NMDG can exist in an uncharged form (NMDG0; pKa = 8.8). The latter is expected to diffuse through the membrane at a larger rate. For this reason, we determined the PM value for NMDG0 experimentally (see Section 4). In Figure 3 (right panel) we show the predicted difference (∆VM) between the two experimental conditions when using different combinations of reported PM values. Each bar shows the result of a simulation in which we did or did not account for diffusion of NMDG0. It is evident that only for two of the chosen combinations this made a small difference (white bars indicate results obtained when NMDG0 was assumed to permeate). In summary we conclude from the data depicted in Figure 3, that 1) the magnitude of ∆VM depends on the chosen combination of PM values, 2) that VM is always more negative in the presence than in the absence of an outwardly directed K+ gradient and 3) that the influence of the uncharged form of NMDG on VM is negligible.
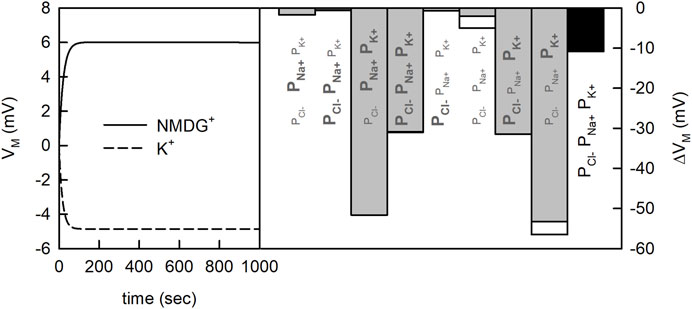
FIGURE 3. Membrane potential generated by the net flux of charged particles. Vesicle assay kinetics simulated for two different experimental conditions. At both conditions, 200 mM NaCl was present outside the vesicle. Inside the vesicle there was either 200 mM KCl or 200 mM NMDG+Cl−. In the simulation 20 mM HEPES, was present inside and outside the vesicle and the pH was set to 7.5. Left panel Time course of the change in membrane potential
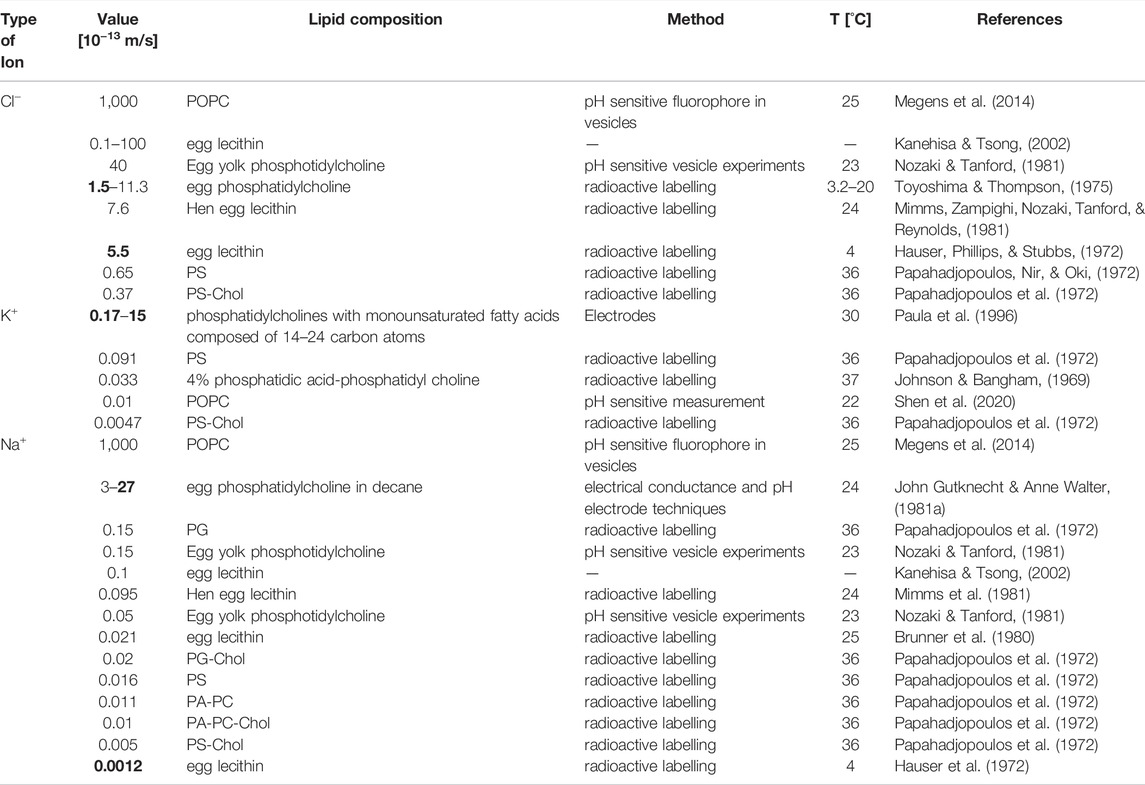
TABLE 1. Literature values for passive membrane permeabilities of Cl−, K+, and Na+. Indicated are the lipid composition and temperature for which the value was estimated and the method employed for the measurement. Bold values indicate for each ion the values for
2.4 Model of a Unilamellar Vesicle Harboring SGLT1
To predict substrate uptake by the transporter into the vesicle, we incorporated SGLT1 into our model system. To this end, we used a previously published kinetic model of SGLT1 (see Figure 8 in Section 4). The established stoichiometry of SGLT1 is that two Na+ ions and one glucose molecule are transported through the membrane in each transport cycle. Reconstituted proteins are usually randomly oriented. We accounted for this in the model by assuming that one half of the SGLT1 units was oriented in the inside-out and the other half in the inside-in configuration.
It is possible with the kinetic model to calculate the flux of glucose and Na+ through SGLT1. However, the magnitudes of these fluxes depend on the intra-and extraluminal Na+ and glucose concentrations and on VM. In the bare vesicle, the extents and time courses by which these vesicle parameters changed were conditioned on the rates by which the different ion species passively permeated. With SGLT1 incorporated into the vesicle, the situation is different. For instance, in the presence of SGLT1, a set Na+ gradient is expected to dissipate faster because of the additional Na+ ions, which can enter the vesicle via the transporter. Accordingly, with SGLT1 present, the evolution of the vesicle parameters over time ought to be different from that in its absence.
In Figure 4 we revisited the question, which we posed above. That is: is it safe to conclude that a solute carrier antiports K+ if we find its concentrative power increased in the presence of a transmembrane K+ gradient? To tackle this question, we conducted simulations in the assumed presence and absence of a K+ gradient, respectively. However, in contrast to the simulation shown above (Figure 3) we now assumed that SGLT1 was inserted into the vesicular membrane. The reaction scheme of SGLT1 does not specify K+ binding to the transporter. Accordingly, if in the simulations the presence of a K+ gradient gives rise to elevated glucose uptake by SGLT1 we know that this cannot be due to K+ antiport. In Figure 4 (upper panel), we simulated glucose uptake into the vesicle for a period of 100 s on addition of 1 µM glucose to the extra-vesicular solution. We note that 1 µM is within the range of concentrations, which are typically employed in radioligand uptake assays. As seen, in the presence of the K+ gradient, uptake of glucose into the vesicle was increased. In Figure 4 (upper middle panel) we plotted the evolution of VM over time for the two experimental conditions. The plot confirmed that the observed increase in glucose uptake in the presence of the K+ gradient had been a corollary of the more negative VM, which had built up at this condition. In the lower middle panel of Figure 4 we show the time dependent change in vesicular volume in percent. We also simulated glucose uptake as a function of the extra-vesicular glucose concentration (lower panel of Figure 4). These data were fit to the Michaelis Menten equation. The Km and the Vmax values for glucose uptake estimated by the fit were 10.90 mM and 1.22 ± 0.006 10−23 mol/s, respectively.
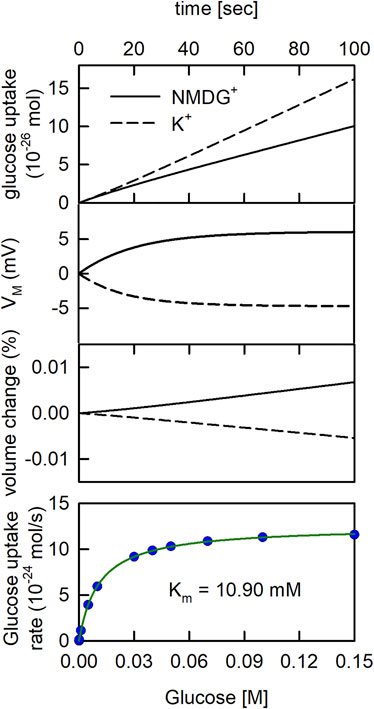
FIGURE 4. The glucose uptake rate of SGLT1 is larger in the presence than in the absence of a K+ gradient. Upper. Glucose uptake by SGLT1. In the simulation 1 µM glucose was applied to the extraluminal side of the vesicle. In the in-silico experiment, we assumed that on average 4.3 monomers were inserted into the vesicle with half of them oriented outside-in (Erokhova et al., 2016). The extraluminal concentration of 200 mM NaCl was osmotically balanced with either 200 mM KCl or 200 mM NMDG+Cl− in the vesicle lumen. The rate of glucose uptake was higher in the presence of a K+ gradient (dashed line) than in its absence (solid line). Upper middle panel Time course of VM change. VM was more negative in the presence of the K+ gradient (dashed line) than in its absence (solid line). Lower middle panel Time course of vesicle volume change. The volume of the vesicle slightly increased and decreased when 200 mM NMDG+(solid line) and 200 mM K+ (dashed line) were initially contained in the vesicle, respectively. Lower panel Simulated glucose uptake as a function of glucose concentration (blue dots). The synthetic data were fit to the Michaelis Menten equation (green curve):
In Figure 5 (upper panel) we plotted the concentrative power of SGLT1 (i.e., [Glu]in/[Glu]out) as a function of time in the assumed presence (dashed line) and absence (solid line) of a K+ gradient. In the simulation we applied 1 µM glucose to the extraluminal side of the vesicle for 50 h. As seen, at both conditions, the concentrative power first increased and then decreased. The decrease occurred on dissipation of the Na+ gradient (Figure 5-middle panel). This transient change in concentrative power is a frequently observed phenomenon if radio-ligand uptake is monitored over an extended period of time (i.e., overshoot phenomenon) (Heinz and Weinstein, 1984). Most notably, however, we found the concentrative power of SGLT1 increased when the K+ gradient was present. Since SGLT1 did not interact with K+, this was also a consequence of the differing VMs between the two different experimental conditions (Figure 5-lower panel).
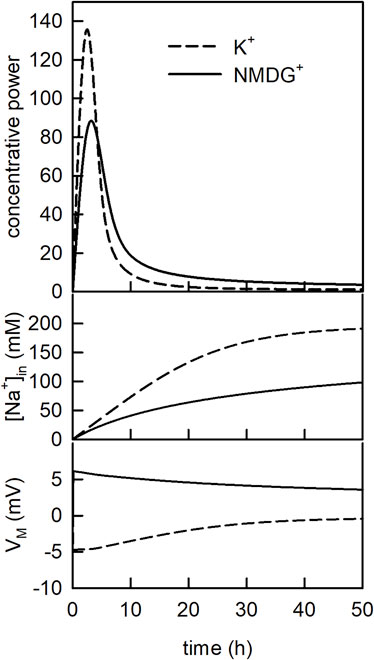
FIGURE 5. The concentrative power of SGLT1 changes over time. Upper panel Evolution of the concentrative power of SGLT1 over time. In the simulation 1 µM glucose was applied for 50 h. The dashed line and the solid line show the concentrative power ([Glu]in/[Glu]out) in the presence and in the absence of the K+ gradient, respectively. Middle panel Time course of the intraluminal sodium concentration [Na+]in for the two conditions. Lower panel Time course of the membrane voltage (
2.5 State Occupancies Depend on the Intra- and Extra Luminal Buffer Conditions
Our model system can also be used to address more sophisticated questions. We demonstrate this with an example. We recently showed that SGLT1 is highly permeable for water (Erokhova et al., 2016). We also found that the conductivity of SGLT1 for water was not contingent on the presence of the co-substrate (i.e., Na+), because when K+ was used as the substituting ion, the water flux remained essentially unchanged. Addition of 20 mM glucose, on the other hand, decreased water transport through SGLT1 by approx. 17%. However, it remained unclear, which conformation visited during glucose transport had or had not been water permeable. Here, we tackled this question with our model.
In the actual measurement of water flux through SGLT1, vesicles which contained this transporter (proteoliposomes) were subjected to a hyperosmotic buffer in a stopped-flow device. Application of the hyperosmotic buffer led to shrinkage of the vesicles, which was monitored by measuring the scattered light intensities at 90° (Hoomann et al., 2013; Hannesschlager et al., 2018). These data allowed for calculating the unitary water permeability through SGLT1 (Horner et al., 2015). To emulate stopped-flow experiments with our mathematical model we first let the proteoliposomes (PL) equilibrate. We then applied a step change of sucrose/glucose with the characteristic time constant of the dead time of our stopped-flow device (τ = 2 ms). To gain a deeper understanding of our published data on water flux through SGTL1 (Erokhova et al., 2016) we simulated three experimentally tested conditions: 1) PLs reconstituted in 150 mM KCl buffer and subjected to a 150 mOsm sucrose gradient, 2) PLs reconstituted in 150 mM NaCl buffer and subjected to a 150 mOsm sucrose gradient and 3) PLs reconstituted in 150 mM NaCl buffer and subjected to a hyperosmotic gradient of 150 mM sucrose and 20 mM glucose.
In our model, application of the hyperosmotic buffer led to a spontaneous decrease of vesicle volume (Figure 6-upper panel). The volume settled at about two-thirds of its original value, 100 ms after application of the osmolyte. The decrease in volume was accompanied by concentration changes of the solutes in the vesicle (data not shown). An additional output of our model are the state occupancies of SGLT1, which because they depended on the vesicle parameters, also changed on application of the osmolyte. In Figure 6 we plotted the state occupancies of all states specified in the reaction scheme of SGLT1. The equilibrated proteoliposomes were challenged with 150 mM sucrose 3 seconds after start of the simulation. The three curves in each panel are the state occupancies for the three experimentally tested conditions. In the lower panel of Figure 6 we also plotted the inhibitory effect of glucose on water flux as a function of the applied glucose concentration. These data were fit to an inhibition curve. The fit yielded an IC50 value of 10.81 mM. This value agreed well with the Km for glucose uptake (cf. Figure 4 -lower panel and Figure 6 -lower panel).
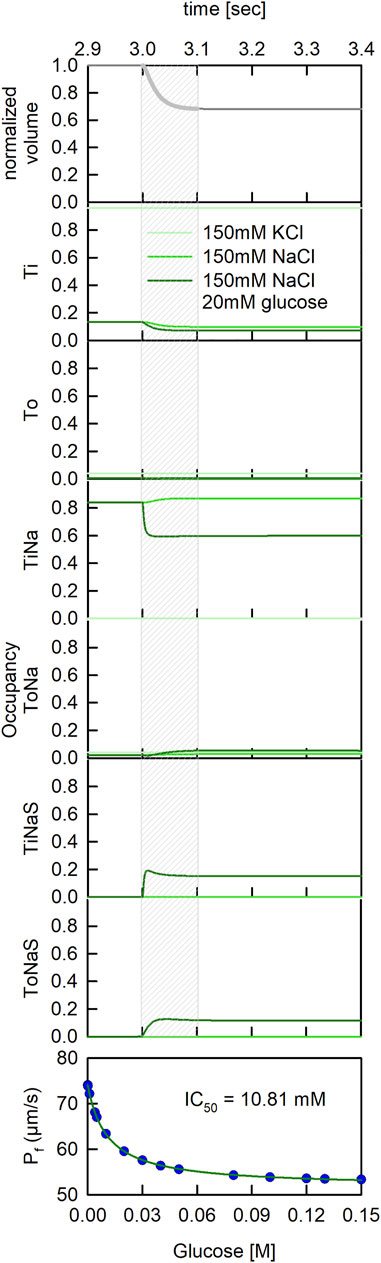
FIGURE 6. Dynamic changes of state occupancies in a stopped flow experiment. State occupancies of SGLT1 before and after application of a hyperosmotic gradient (at time t = 3 s). We simulated three different experimental conditions: (light green line) PLs reconstituted in 150 mM KCl buffer and subjected to a 150 mOsm sucrose gradient, (green line) PLs reconstituted in 150 mM NaCl buffer and subjected to a 150 mOsm sucrose gradient and (dark green line) PLs reconstituted in 150 mM NaCl buffer and subjected to a hyperosmotic gradient of 150 mM sucrose and 20 mM glucose. The grey shaded area indicates the time period during which the vesicles shrunk (see uppermost panel). It was during this period that the scattered light intensities changed and that we obtained information on water flux through SGLT1.
Displayed in Figure 7 are the state occupancies averaged over the period during which the proteoliposomes shrunk (i.e., the first 100 ms following the application of sucrose). This is the period during which we had obtained information on the water flux through SGLT1. As seen, in the presence of 150 mM KCl the transporter mostly dwelled in the apo-inward facing conformation (Ti—96% occupancy) (see Figure 7). In contrast, in the presence of 150 mM NaCl, SGLT1 adopted the sodium bound inward facing conformation (TiNa—87% occupancy) and the Ti state (10% occupancy). In the additional presence of 20 mM glucose, the transporter also visited substrate bound states (i.e., TiNaS—12% occupancy and ToNaS—15% occupancy).
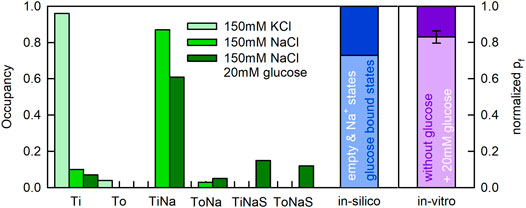
FIGURE 7. State occupancies of SGLT1 during water flux though the transporter. Upper panel To and Ti represent the outward and inward facing apo-conformations, respectively (Figure 8). ToNa, TiNa, ToNaS, and TiNaS denote the sodium and the sodium/glucose bound states. State occupancies were averaged over the first 100 ms after application of the osmolyte (Figure 6). We used the same color code as in Figure 6 to indicate the different experimental conditions. The bar in blue shows the summed fraction of the substrate bound states (dark blue) and, the summed fraction of the substrate free states (light blue). The difference between the light purple and dark purple bar shows the decreased unitary water permeability measured in the presence of 20 mM glucose. Lower panel Simulated water permeability of SGLT1 (assuming water impermeable glucose states) as a function of the glucose concentration (blue dots). The green curve denotes the fit of an inhibition curve to the data:
We note that the summed fraction of glucose bound states amounted to 27% when 20 mM glucose was present. Because water flux through SGLT1 was reduced by approximately 17% at the same condition, it is tempting to speculate that it were the substrate-free states which conducted water and the substrate bound states which were water impermeable. The blue bar in Figure 7 shows the summed fraction of the substrate-free states (in light blue) and the summed fraction of the substrate bound states (in dark blue) in the presence of 20 mM glucose. The bar in purple summarizes our recent experimental findings (i.e., water flux in the presence of glucose normalized to the water flux measured in its absence). The occupancies of the substrate bound states and the loss in water flux were in reasonable agreement.
3 Discussion
Here, we present an in-silico model, which allows to predict the time courses of solute concentration changes within the confinement of a unilamellar vesicle, both in the absence and presence of a glucose transporter (SGLT1). The model accounts for passive diffusion of ions, sucrose, glucose, and water through the vesicular membrane and for solute flux through the transporter (i.e., Na+ and glucose). In addition, we also incorporated state-dependent water flux through SGLT1. In the model, the solutes and solvent, which entered or left the vesicle gave rise to changes in the intra-vesicular solute concentrations, vesicle volume and transmembrane potential (VM). These parameters in turn impinged on the operation of the embedded transporter. The model can emulate a wide range of experiments and it can therefore be used to predict and interpret experimental outcomes. In addition, it can help find optimal experimental conditions. That is: it can 1) assist in ruling out initial conditions, which would lead to vesicle rupture due to excessive volume increase and/or large membrane potential, and 2) provide estimates for the expected signal change to help chose the measurement strategy, which has the highest chance of success. In the present study, we simulated radioligand uptake and stopped-flow experiments, of the kind used to measure water flux through proteoliposomes.
We previously showed by utilizing proteoliposomes that SGLT1 is an efficient facilitator of passive water transport (Erokhova et al., 2016). The measured unitary permeability for water amounted to 3.3 ± 0.4 × 10⁻¹³ cm3/s at 5°C. These rates were comparable to those reported for aquaporins (Erokhova et al., 2016). Water flux through SGLT1 did not depend on the presence of the co-substrate Na+, because it remained the same when Na+ was substituted with K+. Less water flew through SGLT1 when 20 mM glucose, a saturating concentration, was present in the bath solution. However, the reduction in the conductivity for water was small (i.e., 17%). This suggested that during transport, SGLT1 dwelled longer in states, which conducted water than in states, which were water-impermeable. Our model predicted that at the condition at which the water flux was found reduced, SGLT1 dwelled 27 percent of the time in glucose-bound states. This tempted us to speculate that the water-impermeable states were those, which were bound to glucose. This view is in line with results obtained from MD simulations of the bacterial homolog vSGLT in the inward-facing state. These showed that residues located close to the glucose binding site gated water flux (Li et al., 2013) and that the permeability for water was modulated albeit not tightly coupled to substrate release (Adelman et al., 2014). However, a shortcoming of our modeling approach is that for technical reasons water flux through SGLT1 had to be measured at 5°C, while the employed six state model (see Figure 8) was parametrized using data obtained at room-temperature. Arguably, the conformational equilibrium of SGLT1 at 5°C can differ from that at room temperature. However, the low activation energy for water transport through SGLT1, reported by others (i.e., in the range of 4.2–5 kcal/mol) (Meinild et al., 1998; Zeuthen et al., 2016), suggests that temperature dependent changes of the conformational equilibrium of the transporter are likely modest. The explanation for this could be as follows: the two reactions in the transport cycle, which ought to be most affected by temperature are the conformational rearrangements (i.e., 1) the transition, which carries substrate and co-substrate through the membrane and 2) the return of the empty transporter to the outward facing conformation). Because, the reaction paths of these two transitions are similar, there is no reason to believe that their temperature dependencies are vastly different. If true, the rates of these two reactions are expected to change with temperature by a similar factor. As a consequence of this, the conformational equilibrium (but not the glucose uptake rate), remains the same at different temperatures.
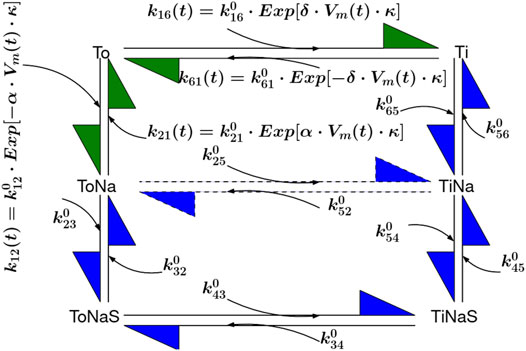
FIGURE 8. Six State Model of SGLT1. The transitions To to Ti and To to ToNa are voltage dependent and indicated with green arrows. The reactions denoted by blue arrows are voltage independent and described with constant rates
Our vesicle model is unique in that it incorporates a solute carrier. Yet, other vesicle models exist, which account for passive diffusion of water (Wachlmayr et al., 2022), weak acids (Hannesschlaeger et al., 2019a; Gabba and Poolman, 2020), and ions (Megens et al., 2014; Shen et al., 2020) through the vesicular membrane. However, due to their different scopes, none of them simultaneously modeled 1) membrane potential (Gabba and Poolman, 2020), 2) partial volume effects (Hannesschlaeger et al., 2019b; Gabba and Poolman, 2020; Shen et al., 2020), 3) de/protonation of the buffer (Gabba and Poolman, 2020; Shen et al., 2020), and 4) self-dissociation of water (Gabba and Poolman, 2020). While we modeled all of the above, we disregarded the size distribution of the vesicle ensemble as was included in models, which dealt with water (Wachlmayr et al., 2022) and weak acid permeation (Gabba and Poolman, 2020).
It is important to point out, however, that the predictive power of any given model hinges on its accurate parameterization. For example, we showed that the time course and extent by which VM changed, depended 1) on the initial intra- and extra-vesicular ion concentrations and 2) on the PM values used in the simulation. The rates of passive ion fluxes can be measured in experiments. However, we found for the same ion vastly different values in the literature (Table 1). The variabilities in the reported PM values for the same ion likely reflect differences in the experimental conditions at which this parameter was determined (e.g., the lipid composition of the membranes), and inaccuracies of the methods used to estimate it. We, therefore, surmise that accurate parametrization of the model may necessitate measuring these rates for membranes of exactly the same lipid composition as used in the experiment. For lack of such a coherent set of values we selected for most simulations, literature values, which adhered to the generally accepted rank order of permeability:
Proteoliposomes are well suited for studies of solute carrier function. This is because 1) the experimental outcomes are not confounded by the presence of other proteins, 2) the number of protein units reconstituted into a vesicle can be titrated and- if so wished- even down to a single molecule 3) the ion concentrations in and outside the vesicle can be set as desired and 4) the lipid composition of the vesicular membrane is in the hands of the experimenter. However, one major challenge when using proteoliposomes is that vesicle parameters such as membrane voltage and the intraluminal ion-concentrations are difficult to control. Here we tried to address this problem with our model. The idea was that if we cannot control these parameters, we can at the very least try to model how they change over time and on (experimental) perturbation. We demonstrated in an example that the presence of a K+ gradient accelerated the rate of glucose uptake and increased the concentrative power of SGLT1, although K+ binding was not specified in the reaction scheme of this transporter. In the model this had occurred because SGLT1 is an electrogenic transporter, which reacted to the more negative VM that arose in the presence of the K+ gradient. In this context, it is worth mentioning that a study exists, in which it was proposed that LeuT (a bacterial homolog of neurotransmitter transporters) antiports K+ (Billesbolle et al., 2016). The main argument was that the concentrative power of reconstituted LeuT was found increased in the presence of a K+ gradient. While it may turn out that LeuT indeed antiports K+, this conclusion can be challenged on the grounds that the vesicle parameters, in particular VM were not monitored in this study. The same is true for a more recent study on the drosophila dopamine transporter, which was conducted by the same group (Loland et al., 2022).
Another challenge when using proteoliposomes, is the difficulty to influence the orientation of the transporter in the membrane during reconstitution. Whereas protein orientation in cellular membranes is mainly determined by the positive-inside rule (von Heijne, 1992), with basic residues being more abundant on the cytoplasmic side, in-vitro protein orientation is- in most instances- random (i.e., 50% in the proper orientation and 50% inserted upside down). We accounted for this in our model by implementing both orientations with the two fractions kept tunable. This allows for predicting the impact of random-, biased- or perfect-orientation of membrane transporters on experimental outcomes. Thereby, the model can help to direct efforts to tune the orientation of reconstituted membrane transporters.
The ultimate goal of our modelling exercise is to find a model, which can faithfully predict the time dependence of the vesicle parameters. However, it is unlikely that our model already fulfills this criterion. To improve the model, its predictions must be tested in experiments. A readily accessible parameter, for instance, is the time course of volume change via scattering or fluorescence self-quenching experiments (Wachlmayr et al., 2022). The latter is performed via intra luminal trapped fluorophores as volume readout. The time course and extent of the change in the concentration of the individual ion species and the magnitude of the transmembrane potential are accessible via ion-(Feroz et al., 2021) or voltage- (Cortes et al., 2018; Gest et al., 2021) sensitive fluorophores. These parameters can be measured for different intra and extraluminal ion concentrations in the presence and absence of SGLT1, with and without substrate. The results of these measurements can then be compared with the predictions of the model and discrepancies therein resolved by adapting the model. However, testing the feasibility of this approach is beyond the scope of the present study, but we intend to test utility in follow-up investigations.
4 Materials and Methods
We simulated substrate uptake by SGLT1 embedded into a unilamellar vesicle. We accounted for solute flux through SGLT1 by employing a recently published kinetic model of this transporter (Parent et al., 1992; Adelman et al., 2016; Wright et al., 2011). Passive diffusion of solutes through the membrane was described using the Goldman-Hodgkin-Katz flux equation. If for a solute no experimentally determined PM value was available, we calculated it from estimated hexadecane/water partition coefficients. The system of differential equations constituting the model, was solved numerically with Mathematica’s NDSolve IDA package (V. 12) (RRID:SCR_014448).
4.1 Vesicle Model
The change in vesicle volume caused by the presence of an osmotic gradient
where
TABLE 2. Model parameters.
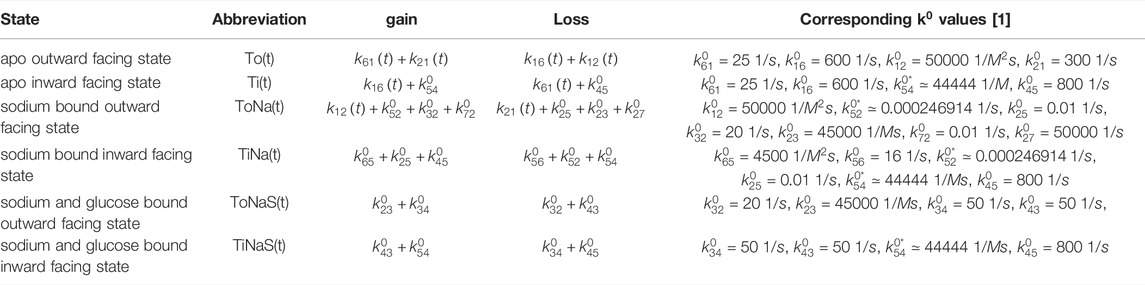
TABLE 3. The six different states after Figure 8 and corresponding shortcuts used in the code implementation are listed in the first two columns. The overall rate gain and loss is always contributed to the corresponding state in the row. The right column refers to the initial rates given at
where
where we corrected the outer radius
We used the Goldman-Hodgkin-Katz flux equation to describe passive diffusion of solutes through the membrane
where
The membrane was modeled as a capacitor, which was charged by the charged molecules entering the vesicle. For membrane potentials below
where
Q can be expressed as:
where
Since permeation of free ions like
where
For the formulation of Eq. 8 and Eq. 9 we used the following relation:
where pK is the pK value of the buffer M and
We predicted water flux through proteoliposome by emulating stopped flow experiments. For these it was necessary to change the osmotic concentration outside the vesicle by adding an osmolyte such as glucose or sucrose with a concentration
The total concentration can be calculated as:
4.2 SGLT1 Model
SGLT1 was modeled utilizing a recently published Six State Model (see Figure 8) (Adelman et al., 2016; Parent et al., 1992; Wright et al., 2011). Voltage dependent transitions are indicated with green arrows, all other transitions with blue arrows. The published model accounts for Na+ slippage (dotted arrow between
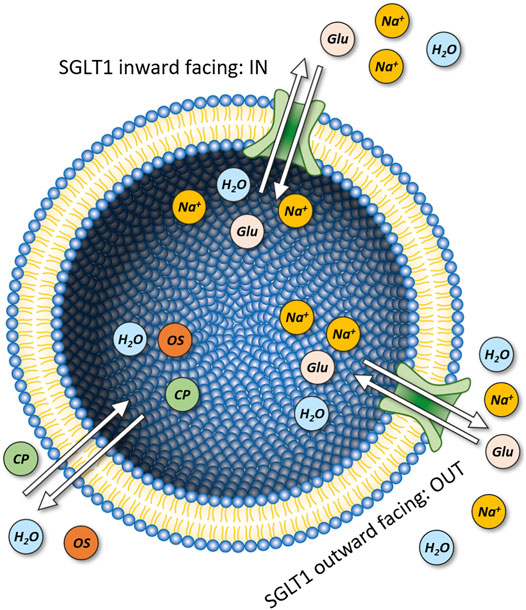
FIGURE 9. Vesicles containing SGLT1. Model of a unilamellar vesicle with SGLT1 incorporated in two different orientations. The inward- and outward facing configurations oriented towards the intra and extra luminal side are denoted as IN and OUT, respectively. In each transport cycle SGLT1 transports 2 Na+ ions and one glucose molecule. The model takes into account passive permeation of osmotically active solutes (OS) (i.e., sucrose, glucose, and NMDG0) and charged particles (CP) (i.e., Na+, K+, NMDG+, Cl−, and protons) as well as passive flux of water.
We introduced a passive water permeability for SGLT1 according to Erokhova et al. (2016) in our model. This enhanced the rate of volume shrinkage according to Eq. 1. As a first estimate we assumed that SGLT1 is only water permeable in its apo states but not in the glucose bound states. Therefore, we weighted the water permeability
The passive water permeability through the membrane is:
where N is the number of SGLT1 transporters per vesicle.
We calculated the membrane potential
The factor two at the beginning of Eq. 15 accounts for the fact that in each transport cycle two sodium ions are transported.
where
Glucose uptake
Since glucose is also an osmolyte but uncharged, the passive glucose flux
where
4.3 Estimation of Passive Membrane Permeabilities
For solutes for which experimentally determined PM-values were unavailable, we calculated them from the estimated hexadecane/water partition coefficients Khex/w in accordance with the solubility diffusion model, using semi-empirical correlations for neutral (Walter and Gutknecht, 1986), anionic (Ebert et al., 2018), and cationic (Ebert, 2020) molecules. Predicted values and the pertinent correlations are listed in Table 4. Partition coefficients were predicted using commercial software based on quantum chemical calculations and the COSMO-RS (“Conductor-like Screening Model for Realistic Solvation”) theory. Thereby, Turbomole (TURBOMOLE V7.3 2018, a development of University of Karlsruhe and Forschungszentrum Karlsruhe GmbH, 1989–2007, TURBOMOLE GmbH, since 2007; available from http://www.turbomole.com) was used to generate so called COSMOfiles—surface charge densities of energetically optimized structures. Using COSMOconf (COSMOlogic GmbH & Co. KG; http://www.cosmologic.de: Leverkusen, Germany) we accounted for different possible conformers. COSMOtherm (Release 18 [2018] COSMOlogic GmbH & Co. KG) was used to calculate the partition coefficients. For more details see (Eckert and Klamt, 2002). All values were calculated at 22°C using the BP_TZVPD_FINE_parametrization.
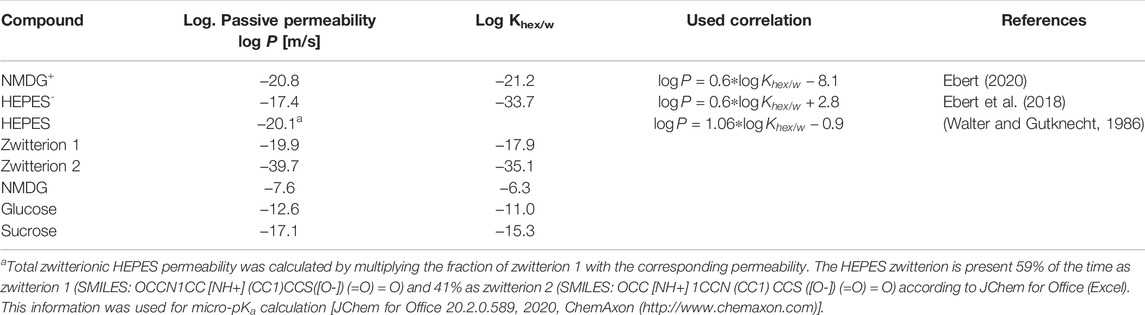
TABLE 4. Estimated values for passive HEPES0, HEPES-, glucose, sucrose, NMDG0, and NMDG+ membrane permeabilities, the corresponding hexadecane/water partition coefficients Khex/w (see Sections 4.3 and 4.4) and the pertinent correlations to calculate logP.
4.4 Reliability of Predictions for Passive Membrane Permeabilities
A deviation of about 1 log unit between an experimentally determined and predicted p-value is normal when using COSMOtherm to calculate the membrane permeability of neutral solutes (Schwobel et al., 2020). For glucose the predicted value (listed in Table 4) and the experimentally determined value were in good agreement (Pexp = 3.0⋅10−13 m/s (Brunner et al., 1980); Ppred = 2.5⋅10−13 m/s). The deviation in the case of sucrose was higher (Pexp = 3.1⋅10−14 m/s (Stefely et al., 2002); Pexp = 8⋅10−16 m/s (Brunner et al., 1980); Ppred = 8⋅10−18 m/s). NMDG can exist in a neutral and in a charged form (i.e., NMDG0 and NMDG+; pKa = 8.8). The predicted permeability of NMDG0 was 2.5⋅10−8 m/s. This value seemed high given that NMDG was thought to permeate slower through membranes than sodium or potassium ions (Dhoke et al., 2005; Elustondo et al., 2013; Reuss, 1979). To resolve this discrepancy, we determined the NMDG0 permeability experimentally. These measurements allowed for calculating an upper limit of
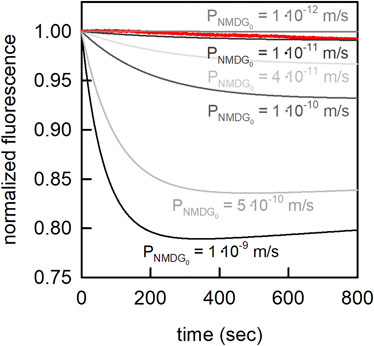
FIGURE 10. Estimation of the passive membrane permeability of NMDG0. In the presence of an outwardly directed NMDG gradient (10 mM inside to 3.33 mM outside) NMDG0 diffused out of the vesicle, which led to a drop of the intraluminal pH. The extra- and intraluminal solutions contained 1 mM MES, and 100 mM NaCl. The pH on both sides of the membrane was 7.0. Shown in red is the measured change in carboxyfluorescein fluorescence on imposition of the NMDG gradient at time point zero. From these measurements we estimated an upper limit for the membrane permeability of
4.5 Experimental Estimation of the Neutral NMDG Species Membrane Permeability
We measured
Data Availability Statement
The original contributions presented in the study are included in the article/Supplementary Material, further inquiries can be directed to the corresponding author.
Author Contributions
AH and WS conceptualized the study. TB performed simulations. TB, WS, JW, CH, AE, AS, and AH contributed to the model and analyzed and discussed the in-silico data. JW is responsible for the art work. TB, WS, and AH wrote the manuscript. All authors approved the manuscript.
Funding
The financial support for this study is from the Austrian Science Fund (No. P31074) to AH and (No. P31813) to WS.
Conflict of Interest
The authors declare that the research was conducted in the absence of any commercial or financial relationships that could be construed as a potential conflict of interest.
Publisher’s Note
All claims expressed in this article are solely those of the authors and do not necessarily represent those of their affiliated organizations, or those of the publisher, the editors and the reviewers. Any product that may be evaluated in this article, or claim that may be made by its manufacturer, is not guaranteed or endorsed by the publisher.
Acknowledgments
We thank Aner Gurvitz for proofreading the manuscript.
References
Adelman J. L., Sheng Y., Choe S., Abramson J., Wright E. M., Rosenberg J. M., et al. (2014). Structural Determinants of Water Permeation through the Sodium-Galactose Transporter vSGLT. Biophysical J. 106 (6), 1280–1289. doi:10.1016/j.bpj.2014.01.006
Adelman J. L., Ghezzi C., Bisignano P., Loo D. D. F., Choe S., Abramson J., et al. (2016). Stochastic Steps in Secondary Active Sugar Transport. Proc. Natl. Acad. Sci. U.S.A. 113 (27), E3960–E3966. doi:10.1073/pnas.1525378113
Benz R., Beckers F., Zimmermann U. (1979). Reversible Electrical Breakdown of Lipid Bilayer Membranes: a Charge-Pulse Relaxation Study. J. Membrain Biol. 48 (2), 181–204. doi:10.1007/BF01872858
Billesbølle C. B., Mortensen J. S., Sohail A., Schmidt S. G., Shi L., Sitte H. H., et al. (2016). Transition Metal Ion FRET Uncovers K+ Regulation of a Neurotransmitter/sodium Symporter. Nat. Commun. 7 (1), 12755. doi:10.1038/ncomms12755
Born M. (1920). Volumen und Hydratationswärme der Ionen. Z. Phys. 1 (1), 45–48. doi:10.1007/bf01881023
Borsarelli C. D., Braslavsky S. E. (1998). The Partial Molar Volume of the Proton in Water Determined by Laser-Induced Optoacoustic Studies. J. Photochem. Photobiol. B Biol. 43 (3), 222–228. doi:10.1016/s1011-1344(98)00112-2
Brunner J., Graham D. E., Hauser H., Semenza G. (1980). Ion and Sugar Permeabilities of Lecithin Bilayers: Comparison of Curved and Planar Bilayers. J. Membrain Biol. 57 (2), 133–141. doi:10.1007/BF01868999
Burtscher V., Schicker K., Freissmuth M., Sandtner W. (2019). Kinetic Models of Secondary Active Transporters. Ijms 20 (21), 5365. doi:10.3390/ijms20215365
Cortes S., Barette C., Beroud R., De Waard M., Schaack B. (2018). Functional Characterization of Cell-free Expressed Kv1.3 Channel Using a Voltage-Sensitive Fluorescent Dye. Protein Expr. Purif. 145, 94–99. doi:10.1016/j.pep.2018.01.006
Dhoke M. A., Ladha P. J., Boerio F. J., Lessard L. B., Malinowska D. H., Cuppoletti J., et al. (2005). Porous Membranes for Reconstitution of Ion Channels. Biochimica Biophysica Acta (BBA) - Biomembr. 1716 (2), 117–125. doi:10.1016/j.bbamem.2005.09.008
Ebert A., Hannesschlaeger C., Goss K.-U., Pohl P. (2018). Passive Permeability of Planar Lipid Bilayers to Organic Anions. Biophysical J. 115 (10), 1931–1941. doi:10.1016/j.bpj.2018.09.025
Ebert A. (2020) Permeability of Organic Ions through Biological Membranes, PhD Dissertation. Linz: Universität Linz
Eckert F., Klamt A. (2002). Fast Solvent Screening via Quantum Chemistry: COSMO-RS Approach. AIChE J. 48 (2), 369–385. doi:10.1002/aic.690480220
Elustondo P. A., Angelova P. R., Kawalec M., Michalak M., Kurcok P., Abramov A. Y., et al. (2013). Polyhydroxybutyrate Targets Mammalian Mitochondria and Increases Permeability of Plasmalemmal and Mitochondrial Membranes. PLoS One 8 (9), e75812. doi:10.1371/journal.pone.0075812
Erokhova L., Horner A., Ollinger N., Siligan C., Pohl P. (2016). The Sodium Glucose Cotransporter SGLT1 Is an Extremely Efficient Facilitator of Passive Water Transport. J. Biol. Chem. 291 (18), 9712–9720. doi:10.1074/jbc.M115.706986
Feroz H., Ferlez B., Oh H., Mohammadiarani H., Ren T., Baker C. S., et al. (2021). Liposome-based Measurement of Light-Driven Chloride Transport Kinetics of Halorhodopsin. Biochimica Biophysica Acta (BBA) - Biomembr. 1863 (8), 183637. doi:10.1016/j.bbamem.2021.183637
Fucaloro A. F., Pu Y., Cha K., Williams A., Conrad K. (2007). Partial Molar Volumes and Refractions of Aqueous Solutions of Fructose, Glucose, Mannose, and Sucrose at 15.00, 20.00, and 25.00 °C. J. Solut. Chem. 36 (1), 61–80. doi:10.1007/s10953-006-9100-7
Gabba M., Poolman B. (2020). Physiochemical Modeling of Vesicle Dynamics upon Osmotic Upshift. Biophysical J. 118 (2), 435–447. doi:10.1016/j.bpj.2019.11.3383
Gawrisch K., Ruston D., Zimmerberg J., Parsegian V. A., Rand R. P., Fuller N. (1992). Membrane Dipole Potentials, Hydration Forces, and the Ordering of Water at Membrane Surfaces. Biophysical J. 61 (5), 1213–1223. doi:10.1016/s0006-3495(92)81931-8
Gest A. M. M., Yaeger-Weiss S. K., Lazzari-Dean J. R., Miller E. W. (2021). VoltageFluor Dyes and Fluorescence Lifetime Imaging for Optical Measurement of Membrane Potential. Methods Enzym. 653, 267–293. doi:10.1016/bs.mie.2021.02.009
Gutknecht J., Walter A. (1981a). Hydroxyl Ion Permeability of Lipid Bilayer Membranes. Biochimica Biophysica Acta (BBA) - Biomembr. 645 (1), 161–162. doi:10.1016/0005-2736(81)90525-3
Gutknecht J., Walter A. (1981b). Transport of Protons and Hydrochloric Acid through Lipid Bilayer Membranes. Biochimica Biophysica Acta (BBA) - Biomembr. 641 (1), 183–188. doi:10.1016/0005-2736(81)90582-4
Gutman M., Nachliel E. (1990). The Dynamic Aspects of Proton Transfer Processes. Biochimica Biophysica Acta (BBA) - Bioenergetics 1015 (3), 391–414. doi:10.1016/0005-2728(90)90073-d
Hannesschlaeger C., Barta T., Pechova H., Pohl P. (2019a). The Effect of Buffers on Weak Acid Uptake by Vesicles. Biomolecules 9 (2), 63. doi:10.3390/biom9020063
Hannesschlaeger C., Horner A., Pohl P. (2019b). Intrinsic Membrane Permeability to Small Molecules. Chem. Rev. 119 (9), 5922–5953. doi:10.1021/acs.chemrev.8b00560
Hannesschläger C., Barta T., Siligan C., Horner A. (2018). Quantification of Water Flux in Vesicular Systems. Sci. Rep. 8 (1), 8516. doi:10.1038/s41598-018-26946-9
Hauser H., Phillips M. C., Stubbs M. (1972). Ion Permeability of Phospholipid Bilayers. Nature 239 (5371), 342–344. doi:10.1038/239342a0
Hediger M. A., Romero M. F., Peng J.-B., Rolfs A., Takanaga H., Bruford E. A. (2004). The ABCs of Solute Carriers: Physiological, Pathological and Therapeutic Implications of Human Membrane Transport Proteins. Pflugers Archiv Eur. J. Physiology 447 (5), 465–468. doi:10.1007/s00424-003-1192-y
Heinz E., Weinstein A. M. (1984). The Overshoot Phenomenon in Cotransport. Biochimica Biophysica Acta (BBA) - Biomembr. 776 (1), 83–91. doi:10.1016/0005-2736(84)90253-0
Hoomann T., Jahnke N., Horner A., Keller S., Pohl P. (2013). Filter Gate Closure Inhibits Ion but Not Water Transport through Potassium Channels. Proc. Natl. Acad. Sci. U.S.A. 110 (26), 10842–10847. doi:10.1073/pnas.1304714110
Horner A., Zocher F., Preiner J., Ollinger N., Siligan C., Akimov S. A., et al. (2015). The Mobility of Single-File Water Molecules Is Governed by the Number of H-Bonds They May Form with Channel-Lining Residues. Sci. Adv. 1 (2), e1400083. doi:10.1126/sciadv.1400083
Hwang E.-S., Hirayama B. A., Wright E. M. (1991). Distribution of the SGLT1 Na+glucose Cotransporter and mRNA along the Crypt-Villus axis of Rabbit Small Intestine. Biochem. Biophysical Res. Commun. 181 (3), 1208–1217. doi:10.1016/0006-291x(91)92067-t
Jardetzky O. (1966). Simple Allosteric Model for Membrane Pumps. Nature 211 (5052), 969–970. doi:10.1038/211969a0
Johnson S. M., Bangham A. D. (1969). Potassium Permeability of Single Compartment Liposomes with and without Valinomycin. Biochimica Biophysica Acta (BBA) - Biomembr. 193 (1), 82–91. doi:10.1016/0005-2736(69)90061-3
Kanehisa M. I., Tsong T. Y. (2002). Cluster Model of Lipid Phase Transitions with Application to Passive Permeation of Molecules and Structure Relaxations in Lipid Bilayers. J. Am. Chem. Soc. 100 (2), 424–432. doi:10.1021/ja00470a011
Li J., Shaikh S. A., Enkavi G., Wen P.-C., Huang Z., Tajkhorshid E. (2013). Transient Formation of Water-Conducting States in Membrane Transporters. Proc. Natl. Acad. Sci. U.S.A. 110 (19), 7696–7701. doi:10.1073/pnas.1218986110
Loland C., Schmidt S., Malle M., Nielsen A., Bohr S., Pugh C., et al. (2022). The Dopamine Transporter Counter-transports Potassium to Increase the Uptake of Dopamine. Nat. Commun. 13, 1–7701. doi:10.1038/s41467-022-30154-5
McLaughlin S. (1989). The Electrostatic Properties of Membranes. Annu. Rev. Biophys. Biophys. Chem. 18, 113–136. doi:10.1146/annurev.bb.18.060189.000553
Megens M., Korman C. E., Ajo-Franklin C. M., Horsley D. A. (2014). Faster-Than-anticipated Na+/Cl− Diffusion across Lipid Bilayers in Vesicles. Biochimica Biophysica Acta (BBA) - Biomembr. 1838 (10), 2420–2424. doi:10.1016/j.bbamem.2014.05.010
Mehta P., Raymond J., Punjani R., Larson T., Bove F., Kaye W., et al. (2021). Prevalence of Amyotrophic Lateral Sclerosis (ALS), United States, 2016. Amyotroph. Lateral Scler. Frontotemporal Degener. 23, 220–225. doi:10.1080/21678421.2021.1949021
Meinild A.-K., Klaerke D. A., Loo D. D. F., Wright E. M., Zeuthen T. (1998). The Human Na+-Glucose Cotransporter Is a Molecular Water Pump. J. Physiol. 508 (Pt 1), 15–21. doi:10.1111/j.1469-7793.1998.015br.x
Millero F. J. (2002). Molal Volumes of Electrolytes. Chem. Rev. 71 (2), 147–176. doi:10.1021/cr60270a001
Mimms L. T., Zampighi G., Nozaki Y., Tanford C., Reynolds J. A. (1981). Phospholipid Vesicle Formation and Transmembrane Protein Incorporation Using Octyl Glucoside. Biochemistry 20 (4), 833–840. doi:10.1021/bi00507a028
Montal M., Mueller P. (1972). Formation of Bimolecular Membranes from Lipid Monolayers and a Study of Their Electrical Properties. Proc. Natl. Acad. Sci. U.S.A. 69 (12), 3561–3566. doi:10.1073/pnas.69.12.3561
Niu H., Álvarez-Álvarez I., Guillén-Grima F., Aguinaga-Ontoso I. (2017). Prevalence and Incidence of Alzheimer's Disease in Europe: A Meta-Analysis. Neurol. Engl. Ed. 32 (8), 523–532. doi:10.1016/j.nrleng.2016.02.009
Nozaki Y., Tanford C. (1981). Proton and Hydroxide Ion Permeability of Phospholipid Vesicles. Proc. Natl. Acad. Sci. U.S.A. 78 (7), 4324–4328. doi:10.1073/pnas.78.7.4324
Omote H., Hiasa M., Matsumoto T., Otsuka M., Moriyama Y. (2006). The MATE Proteins as Fundamental Transporters of Metabolic and Xenobiotic Organic Cations. Trends Pharmacol. Sci. 27 (11), 587–593. doi:10.1016/j.tips.2006.09.001
Papahadjopoulos D., Nir S., Ohki S. (1972). Permeability Properties of Phospholipid Membranes: Effect of Cholesterol and Temperature. Biochimica Biophysica Acta (BBA) - Biomembr. 266 (3), 561–583. doi:10.1016/0005-2736(72)90354-9
Parent L., Supplisson S. p., Loo D. F., Wright E. (1992). Electrogenic Properties of the Cloned Na+/glucose Cotransporter: II. A Transport Model under Nonrapid Equilibrium Conditions. J. Membarin Biol. 125 (1), 63–79. doi:10.1007/BF00235798
Parsegian A. (1969). Energy of an Ion Crossing a Low Dielectric Membrane: Solutions to Four Relevant Electrostatic Problems. Nature 221 (5183), 844–846. doi:10.1038/221844a0
Paula S., Volkov A. G., Van Hoek A. N., Haines T. H., Deamer D. W. (1996). Permeation of Protons, Potassium Ions, and Small Polar Molecules through Phospholipid Bilayers as a Function of Membrane Thickness. Biophysical J. 70 (1), 339–348. doi:10.1016/s0006-3495(96)79575-9
Pohl P., Saparov S. M., Borgnia M. J., Agre P. (2001). Highly Selective Water Channel Activity Measured by Voltage Clamp: Analysis of Planar Lipid Bilayers Reconstituted with Purified AqpZ. Proc. Natl. Acad. Sci. U.S.A. 98 (17), 9624–9629. doi:10.1073/pnas.161299398
Reuss L. (1979). Electrical Properties of the Cellular Transepithelial Pathway inNecturus Gallbladder: III. Ionic Permeability of the Basolateral Cell Membrane. J. Membrain Biol. 47 (3), 239–259. doi:10.1007/BF01869080
Rudnick G., Sandtner W. (2019). Serotonin Transport in the 21st Century. J. General Physiology 151 (11), 1248–1264. doi:10.1085/jgp.201812066
Saha S., Chant D., Welham J., McGrath J. (2005). A Systematic Review of the Prevalence of Schizophrenia. PLoS Med. 2 (5), e141. doi:10.1371/journal.pmed.0020141
Sano R., Shinozaki Y., Ohta T. (2020). Sodium-glucose Cotransporters: Functional Properties and Pharmaceutical Potential. J. Diabetes Investig. 11 (4), 770–782. doi:10.1111/jdi.13255
Schwöbel J. A. H., Ebert A., Bittermann K., Huniar U., Goss K.-U., Klamt A. (2020). COSMOperm: Mechanistic Prediction of Passive Membrane Permeability for Neutral Compounds and Ions and its pH Dependence. J. Phys. Chem. B 124 (16), 3343–3354. doi:10.1021/acs.jpcb.9b11728
Shen Y., Zhong Y., Fei F., Sun J., Czajkowsky D. M., Gong B., et al. (2020). Ultrasensitive Liposome-Based Assay for the Quantification of Fundamental Ion Channel Properties. Anal. Chim. Acta 1112, 8–15. doi:10.1016/j.aca.2020.03.044
Stefely J., Markowitz M. A., Regen S. L. (2002). Permeability Characteristics of Lipid Bilayers from Lipoic Acid-Derived Phosphatidylcholines. Comparison of Monomeric, Crosslinked and Noncrosslinked Polymerized Membranes. J. Am. Chem. Soc. 110 (22), 7463–7469. doi:10.1021/ja00230a030
Stillinger F. H. (1978). Proton Transfer Reactions and Kinetics in Water. Theor. Chem. Adv. Perspect. 3, 177–234. doi:10.1016/b978-0-12-681903-8.50011-4
Toyoshima Y., Thompson T. E. (1975). Chloride Flux in Bilayer Membranes. Chloride Permeability in Aqueous Dispersions of Single-Walled, Bilayer Vesicles. Biochemistry 14 (7), 1525–1531. doi:10.1021/bi00678a028
Ulrich N., Goss K.-U., Ebert A. (2021). Exploring the Octanol-Water Partition Coefficient Dataset Using Deep Learning Techniques and Data Augmentation. Commun. Chem. 4 (1), 90. doi:10.1038/s42004-021-00528-9
von Heijne G. (1992). Membrane Protein Structure Prediction. J. Mol. Biol. 225 (2), 487–494. doi:10.1016/0022-2836(92)90934-c
Wachlmayr J., Hannesschlaeger C., Speletz A., Barta T., Eckerstorfer A., Siligan C., et al. (2022). Scattering versus Fluorescence Self-Quenching: More Than a Question of Faith for the Quantification of Water Flux in Large Unilamellar Vesicles? Nanoscale Adv. 4 (1), 58–76. doi:10.1039/d1na00577d
Walter A., Gutknecht J. (1986). Permeability of Small Nonelectrolytes through Lipid Bilayer Membranes. J. Membrain Biol. 90 (3), 207–217. doi:10.1007/BF01870127
Wang J., Dlamini D. S., Mishra A. K., Pendergast M. T. M., Wong M. C. Y., Mamba B. B., et al. (2014). A Critical Review of Transport through Osmotic Membranes. J. Membr. Sci. 454, 516–537. doi:10.1016/j.memsci.2013.12.034
Wang J., Zhang K., Goyal P., Grewer C. (2020). Mechanism and Potential Sites of Potassium Interaction with Glutamate Transporters. J. General Physiology 152 (10). e202012577. doi:10.1085/jgp.202012577
Wright E. M., Loo D. D. F., Hirayama B. A. (2011). Biology of Human Sodium Glucose Transporters. Physiol. Rev. 91 (2), 733–794. doi:10.1152/physrev.00055.2009
Keywords: human sodium glucose co-transporter, water-permeable apo states, solute carrier, glucose uptake, lipid vesicles, mathematical modeling, passive membrane permeabilities
Citation: Barta T, Sandtner W, Wachlmayr J, Hannesschlaeger C, Ebert A, Speletz A and Horner A (2022) Modeling of SGLT1 in Reconstituted Systems Reveals Apparent Ion-Dependencies of Glucose Uptake and Strengthens the Notion of Water-Permeable Apo States. Front. Physiol. 13:874472. doi: 10.3389/fphys.2022.874472
Received: 12 February 2022; Accepted: 10 May 2022;
Published: 15 June 2022.
Edited by:
Christof Grewer, Binghamton University, United StatesReviewed by:
Richard J. Naftalin, King’s College London, United KingdomAlessio Accardi, Cornell University, United States
Copyright © 2022 Barta, Sandtner, Wachlmayr, Hannesschlaeger, Ebert, Speletz and Horner. This is an open-access article distributed under the terms of the Creative Commons Attribution License (CC BY). The use, distribution or reproduction in other forums is permitted, provided the original author(s) and the copyright owner(s) are credited and that the original publication in this journal is cited, in accordance with accepted academic practice. No use, distribution or reproduction is permitted which does not comply with these terms.
*Correspondence: Andreas Horner, andreas.horner@jku.at