 Emilie Sleight1,2
 Michael S. Stringer1,2
 Isla Mitchell3
 Madeleine Murphy3
 Ian Marshall1,2
 Joanna M. Wardlaw1,2,3
 Michael J. Thrippleton1,2,3*
- 1Centre for Clinical Brain Sciences, University of Edinburgh, Edinburgh, United Kingdom
- 2UK Dementia Research Institute, University of Edinburgh, Edinburgh, United Kingdom
- 3Edinburgh Imaging Facility, Royal Infirmary of Edinburgh, University of Edinburgh, Edinburgh, United Kingdom
Introduction: Cerebrovascular reactivity (CVR) measurements using blood oxygen level dependent (BOLD) magnetic resonance imaging (MRI) are commonly used to assess the health of cerebral blood vessels, including in patients with cerebrovascular diseases; however, evidence and consensus regarding reliability and optimal processing are lacking. We aimed to assess the repeatability, accuracy and precision of voxel- and region-based CVR measurements at 3 T using a fixed inhaled (FI) CO2 stimulus in a healthy cohort.
Methods: We simulated the effect of noise, delay constraints and voxel- versus region-based analysis on CVR parameters. Results were verified in 15 healthy volunteers (28.1±5.5 years, female: 53%) with a test-retest MRI experiment consisting of two CVR scans. CVR magnitude and delay in grey matter (GM) and white matter were computed for both analyses assuming a linear relationship between the BOLD signal and time-shifted end-tidal CO2 (EtCO2) profile.
Results: Test-retest repeatability was high [mean (95% CI) inter-scan difference: −0.01 (−0.03, −0.00) %/mmHg for GM CVR magnitude; −0.3 (−1.2,0.6) s for GM CVR delay], but we detected a small systematic reduction in CVR magnitude at scan 2 versus scan 1, accompanied by a greater EtCO2 change [±1.0 (0.4,1.5) mmHg] and lower heart rate [−5.5 (−8.6,−2.4] bpm]. CVR magnitude estimates were higher for voxel- versus region-based analysis [difference in GM: ±0.02 (0.01,0.03) %/mmHg]. Findings were supported by simulation results, predicting a positive bias for voxel-based CVR estimates dependent on temporal contrast-to-noise ratio and delay fitting constraints and an underestimation for region-based CVR estimates.
Discussion: BOLD CVR measurements using FI stimulus have good within-day repeatability in healthy volunteers. However, measurements may be influenced by physiological effects and the analysis protocol. Voxel-based analyses should be undertaken with care due to potential for systematic bias; region-based analyses are more reliable in such cases.
1 Introduction
Cerebrovascular reactivity (CVR) reflects the ability of the cerebral blood vessels to dilate in response to a vasoactive stimulus. Investigating CVR impairment in cerebral tissues is of particular interest in patients with cerebrovascular diseases (Watchmaker et al., 2019; Blair et al., 2020). This can be achieved in vivo using magnetic resonance imaging (MRI) (Liu et al., 2019). Typically, a hypercapnic stimulus is used to trigger vasodilation and induce changes in vascular parameters, including cerebral blood flow (CBF), which can be detected using vascular-sensitive MRI techniques (Ogawa et al., 1990; Rostrup et al., 1994; Noth et al., 2008). The CVR MRI technique is well-correlated with other imaging modalities such as transcranial doppler and positron-emission tomography (Ziyeh et al., 2005; Heijtel et al., 2014). Blood oxygen-level dependent (BOLD) MRI is most widely used along with end-tidal carbon dioxide (EtCO2) recording, with CVR magnitude typically defined as the percent change in the BOLD signal due to the hypercapnic challenge divided by the change in EtCO2 to account for the magnitude of the stimulus (Sleight et al., 2021). As CVR reflects a dynamic process, CVR delay, which comprises CO2 travel time between the lungs and the brain tissues and vasodilation response time, is often included as a variable in the signal model to avoid underestimation of CVR magnitude (Liu et al., 2019). A haemodynamic response function (HRF) has been proposed as a means to separate travel to vasodilation response time (Poublanc et al., 2015; Yao et al., 2021), though this isn’t commonly used in the literature (Sleight et al., 2021).
Previous studies have found good repeatability of CVR magnitude measured with a hypercapnic BOLD experiment (Kassner et al., 2010; Leung et al., 2016; Dengel et al., 2017; Merola et al., 2018; Thrippleton et al., 2018; Hou et al., 2019), though it is lower in normal-appearing white matter (NAWM) than in grey matter (GM) (Kassner et al., 2010; Leung et al., 2016; Thrippleton et al., 2018). However, the studies did not report on inter-scan differences in physiological variables such as blood pressure, respiration and heart rates. Indeed, CVR is a momentary measurement affected by the underlying physiology: Changes in respiration rate can alter the arterial CO2 partial pressure (Petersson and Glenny, 2014) and studies have reported increased heart rate during hypercapnia (Grubb et al., 1974; Lipp et al., 2010). Repeatability of the CVR delay has only been reported for 1.5T MRI (Thrippleton et al., 2018), whereas CVR experiments are typically performed at 3T (Thrippleton et al., 2018). Furthermore, CVR data analysis methods differed across studies (Tong et al., 2011; Bright and Murphy, 2013; Bhogal et al., 2014; Donahue et al., 2016; Liu et al., 2017). First, various CVR delay computation methods were present across the literature: some studies used an estimated constant (Kassner et al., 2010; Leung et al., 2016; Dengel et al., 2017; Hou et al., 2019) and others a variable CVR delay (Thrippleton et al., 2018). It is unknown how robust the estimation of CVR delay is against noise and its impact on the reliability of CVR magnitude estimates. While voxel- (Kassner et al., 2010; Leung et al., 2016; Hou et al., 2019) and ROI-based (Dengel et al., 2017; Thrippleton et al., 2018) analyses were applied, there is little evidence to indicate which analysis is more appropriate.
In this work, we aimed to determine 1) the within-day test-retest repeatability of CVR magnitude and delay with a 3T BOLD MRI experiment using a fixed inhaled CO2 stimulus while measuring blood pressure, heart and respiration rates; 2) the impact of noise on accuracy and precision of CVR magnitude and delay measurements; 3) the impact of using variable versus fixed or zero delay; 4) the impact of extracting CVR magnitude and delay using voxel-based versus ROI-based analysis.
2 Materials and methods
2.1 Simulations
Simulations were conducted using MATLAB (version R2018b, MathWorks, Inc., MA, United States) to investigate the effect of noise and processing methods on CVR estimates. We simulated the EtCO2 trace as a block paradigm without noise ranging from 40 (normocapnia) to 50 mmHg (hypercapnia). Timings of the paradigm replicated the in vivo stimulus (see Section 2.4). The BOLD voxel time courses were generated by scaling and shifting the EtCO2 trace according to the given CVR magnitude and delay, respectively. BOLD signals had a temporal resolution of TR = 1 s. Values for the true median, mean and standard deviation of CVR magnitude and delay in ROIs were extracted from the healthy volunteer’s data acquired in this study by averaging CVR maps across subjects (see Supplementary Material).
The number of signals simulated for each ROI was set to the median number of voxels per ROI in a healthy volunteer dataset, described below, namely: 1,247 in subcortical GM (SGM), 656 in cortical GM (CGM) and 11,748 in NAWM. For each voxel, we added random Gaussian noise with a standard deviation equal to the hypercapnia-induced change in BOLD signal divided by the pre-defined temporal contrast-to-noise ratio (tCNR). The true CVR magnitudes and delays were sampled according to distributions of CVR magnitudes and delays extracted from the healthy volunteer data of this study (see Supplementary Material; Supplementary Figure S1). We therefore used distributions with a median/mean ± SD of 0.25/0.27 ± 0.13, 0.25/0.30 ± 0.21 and 0.10/0.11 ± 0.07%/mmHg for true CVR magnitude and 8/10 ± 8, 15/20 ± 16 and 27/29 ± 13 s for CVR delay in SGM, CGM and NAWM respectively.
For different values of tCNR and analysis type (voxel- and ROI-based), we simulated 1,000 repetitions (N voxels per repetition) of the same experiment. We computed the mean and standard deviation of CVR magnitude and delay estimates across the repetitions.
For the voxel-based analysis, we performed the multiple linear regression between each simulated BOLD time courses and time-shifted EtCO2 (see Section 2.5). For the ROI-based analysis, we applied the linear regression to the mean BOLD signal of the ROI.
To investigate the effect of the delay constraint, we repeated simulations using four delay ranges: −31–93, 0–58, −93–93, −31–124 s. We also simulated CVR magnitude estimation assuming a fixed delay, based on three previous approaches reported in the literature: 1) a global delay defined as the delay calculated from the averaged BOLD signal across GM and NAWM voxels, 2) a GM delay calculated from the averaged BOLD signal across GM voxels and 3) a delay of 0 s corresponding to no delay correction.
2.2 Participants
Healthy volunteers were recruited for two CVR scans. The study was conducted under Research Ethics Committee approval (ref. 14/HV/0001) and according to the principles expressed in the Declaration of Helsinki. All volunteers gave written informed consent. Exclusion criteria consisted of contraindication to MRI, migraine, hypertension, anxiety disorders, panic attacks, respiratory, and cardiovascular illnesses and known family history of subarachnoid haemorrhage, intracranial aneurysm or arteriovenous malformation.
2.3 Magnetic resonance imaging
All images were acquired using a 3T MRI scanner (MAGNETOM Prisma, Siemens Healthcare GmbH, Erlangen, Germany) with a 32-channel receive head coil. Each participant underwent two 13.5-min CVR scans, each acquired using axial 2D single-shot gradient-echo echo-planar imaging (GE-EPI; TR/TE = 1550/30 ms, 67°flip angle, 23.5 × 23.5 cm2 FOV, 94 × 94 acquisition matrix, 50 × 2.5 mm slices, 2.5 mm3 isotropic resolution, multiband acceleration factor 2, in-plane GRAPPA acceleration factor 2, 5 dummy scans) during a hypercapnic challenge. We discarded the first minute of the scanning (39 volumes) to obtain the same paradigm as in clinical studies on small vessel disease (Thrippleton et al., 2018). Structural imaging sequences consisted of sagittal T1-weighted 3D inversion recovery spoiled gradient-echo (T1W; TR/TE = 2500/4.37 ms, 7° flip angle, 25.6 × 25.6 × 19.2 cm3 FOV, 256 × 256×192 acquisition matrix size, 1.0 mm3 isotropic resolution, GRAPPA acceleration factor three in anterior-posterior phase-encoding direction) and axial T2-weighted 3D RARE (T2W; TR/TE = 3200/408 ms, 24.0 × 24.0 × 15.8 cm3 FOV, 256 × 256×176 acquisition matrix size, 0.9 mm3 isotropic resolution, GRAPPA acceleration factor 2 in phase- and partition-encoding directions).
The scanning session took place between 11 a.m. and 4 p.m. Structural images were acquired after the first CVR scan, followed by a short break when the subject came out of the scanner room before the second CVR scan.
2.4 Vasodilatory stimulus
The hypercapnic challenge used an established method which consisted of a block paradigm alternating between 2 min of medical air and 3 min of fixed inhaled CO2 stimulus for a duration of 12 min (Thrippleton et al., 2018). Actually, the first air block was 3 min long, but, for the analyses, we didn’t consider the data acquired during the first minute. The hypercapnic gas contained 6% CO2, 21% O2, and 73% N2, while the medical air contained 21% O2 and 79% N2 (BOC Special Products, United Kingdom). Expired CO2 and oxygen (O2) concentration waveforms were measured with a sampling frequency of 20 Hz using CD-3A CO2 and S-3A Oxygen sensors (AEI Technologies, Pittsburgh, United States) respectively, calibrated prior to each CVR scan. We recorded peripheral oxygen saturation, blood pressure pre- and post-CVR, heart rate and respiration rate using an MR conditional patient monitor with a sampling frequency of 1 Hz (MR400 and IP5; Philips, United Kingdom).
After each CVR scan, we asked participants to rate the tolerability of the scan (scale: 1 = very tolerable, 2 = tolerable, 3 = not very tolerable, 4 = intolerable) and recorded any reports of discomfort and possible hypercapnia symptoms.
2.5 Data processing
The CO2 and O2 concentrations were converted to partial pressures by multiplying them by the atmospheric pressure (i.e., 760 mmHg). The resulting waveforms were converted into EtCO2 and end-tidal oxygen (EtO2) traces using in-house MATLAB code, which identifies the signal peaks or troughs, as previously described (Thrippleton et al., 2018).
DICOM files were converted into NIFTI format (Li et al., 2016). BOLD images were realigned to each participant’s mean BOLD image using SPM12 (Friston, 2007).
For the ROI-based analysis, we computed the mean BOLD signal-time course in each ROI and performed multiple linear regression between the mean BOLD time course, the time-shifted EtCO2 course and a vector comprising the volume numbers to account for a linear signal drift in MATLAB (Figure 1). Unless otherwise mentioned, we allowed time shifts ranging from −31–93 s, both multiples of TR, for the EtCO2 profile allowing for long responses in damaged tissues (Thrippleton et al., 2018) and for negative delays in individual voxels or ROIs due to noise in the BOLD signals. This delay range was used previously (Thrippleton et al., 2018; Stringer et al., 2021). The optimal time shift was taken from the model with lowest sum of squared residuals. CVR magnitude (%/mmHg) was computed as the regression coefficient associated with the time-shifted EtCO2 term divided by the mean BOLD baseline signal and multiplied by 100, where the mean BOLD baseline was defined as the mean intensity of the mean BOLD signal over the first 30 volumes (overlapping medical air inhalation). CVR delay was defined as the optimal time shift plus 4 s to account for the sampling line delay. The latter was calculated prior to the study as the average time across five repetitions for an abrupt CO2 concentration change at the distal sampling point to be reported by the sensor. In the voxel-based analysis, the same multiple linear regression process was applied to the BOLD time course of each voxel within the ROI and the resulting CVR magnitude and delay estimates were averaged across the ROI.
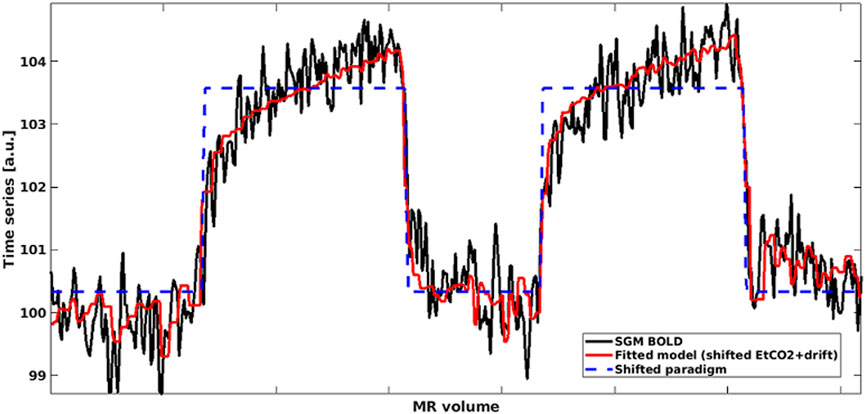
FIGURE 1. Mean BOLD time series in SGM (black) modelled using shifted EtCO2 and linear drift term (red). The shifted rescaled paradigm is shown in blue: High values correspond to hypercapnia periods whereas low values correspond to normocapnia periods. (SGM, Subcortical grey matter; EtCO2, End-tidal CO2).
For each analysis, we investigated the dependence of CVR estimates on the range of allowed delay values, i.e., delay constraint. In practice, delay constraint is limited by the amount of EtCO2 data recorded before and after the MRI acquisition. We reprocessed the data with a higher upper bound (from −31–124 s instead of −31–93 s).
We defined tCNR in vivo as the difference in mean BOLD intensity during hypercapnia and during normocapnia, excluding a 1 min transition period at the start of a new block to allow for the BOLD response to stabilise, divided by the standard deviation of the BOLD baseline signal. For each ROI, we computed the tCNR of the mean BOLD signal time course as well as the mean tCNR for voxels within the ROI.
2.6 Regions of interest
We used FSL FAST (Zhang et al., 2001) and FIRST (Patenaude et al., 2011) (FMRIB Analysis Group, Oxford, United Kingdom) to segment CGM, SGM (formed of the thalamus, putamen, pallidum and caudate nucleus) and NAWM in native T1W space based on the MNI-152 template (Fonov et al., 2009; Fonov et al., 2011). To reduce partial volume effects, all ROIs were eroded using a box kernel with a width of three voxels centred on target voxel. The linear affine transformation between the T1W and mean BOLD spaces was calculated using FLIRT (Jenkinson and Smith, 2001; Jenkinson et al., 2002) and applied to transform each ROI into the mean BOLD space. We then applied a threshold of 50% to obtain binary masks in the mean BOLD space.
2.7 Statistics
CVR magnitude, CVR delay and physiological parameters were reported as mean ± standard deviation. We investigated inter-scan, inter-block and inter-analysis differences using Bland-Altman statistics including the 95% confidence intervals for the mean difference reported in parentheses. We defined the inter-scan difference of a parameter as the parameter at scan 2 minus the parameter at scan 1. The inter-block difference in a parameter was defined as the mean value during the CO2 blocks minus the that during the air blocks. The inter-analysis difference of a parameter was defined as the value from the ROI-based analysis minus that from the voxel-based analysis. Furthermore, we computed the inter-scan coefficients of variation (CVs) for CVR magnitudes and delays as the standard deviation of the differences in paired measurements (i.e., one pair for each participant) divided by the mean of the pair-averaged values. The impact of physiological parameters was assessed using a linear regression model with the inter-scan difference in CVR magnitude as outcome, the inter-scan differences in baseline EtCO2 and EtCO2 change as independent variables and without an intercept, as described previously (Hou et al., 2019).
3 Results
3.1 Simulations
Simulations were performed using openly-accessible MATLAB scripts (https://doi.org/10.7488/ds/3503), which can also be used to process in vivo CVR data. At high tCNR, CVR parameters estimated from the simulated data using voxel-based analysis converged to the ground-truth mean values (Figure 2). However, at lower tCNR, random error increased and a positive bias was observed for both CVR magnitude and CVR delay for the voxel-based analysis. CVR magnitudes derived from ROI-based analysis had a similar precision to those from voxel-based analysis, but were always lower than the true CVR magnitude (Figure 2). CVR delays from ROI-based analysis converged to the ground-truth median values at high tCNR; at low tCNR, they remained accurate but were less precise.
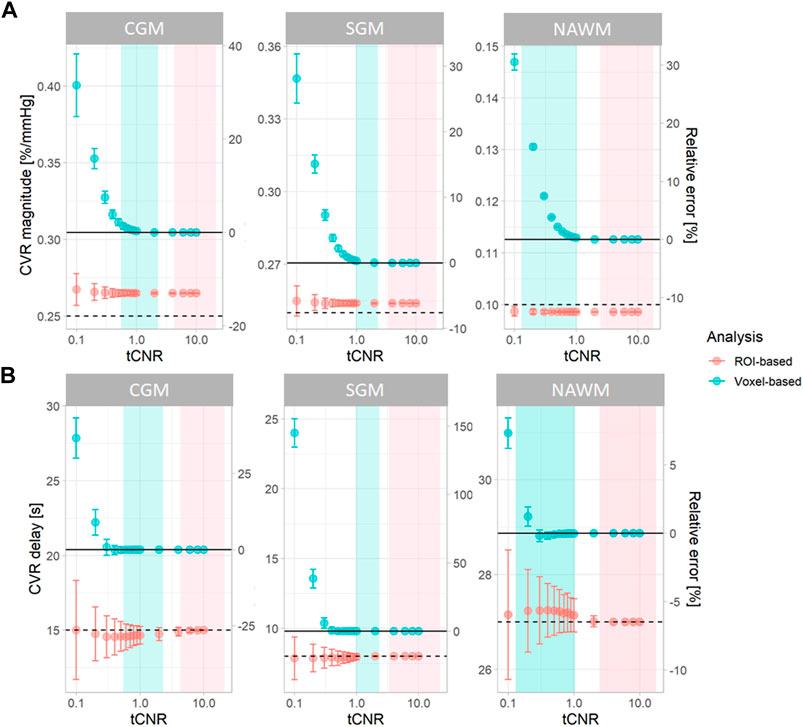
FIGURE 2. Simulations showing the effect of tCNR on the estimation of CVR magnitude (A) and delay (B) corresponding to all subcortical and cortical GM, and NAWM voxels. Data points and error bars indicate the mean ± the standard deviation of the estimates across 1000 simulations. Simulations were performed for both ROI- (pink) and voxel-based (blue) analyses. tCNR on the x-axis represents the tCNR in voxels. The ranges of tCNR values in the in vivo data are represented by the shaded areas in blue for tCNR in voxels and in pink for tCNR of mean BOLD signals. The delay constraint was from −31 to 93 seconds, corresponding to the delay constraint used to process real data. Horizontal solid and dashed lines represent the ground-truth mean and median values, respectively. The relative errors were computed with respect to the ground-truth mean values. (ROI: region of interest, CGM: cortical grey matter, GM: grey matter, NAWM: normal-appearing white matter, SGM: subcortical grey matter, tCNR: temporal contrast-to-noise ratio).
To investigate the origins of the biases in the voxel-based analysis, we simulated NAWM CVR estimates using different delay constraints at a low tCNR of 0.1 (Figure 3). CVR estimates from ROI-based analysis were independent of the delay constraint. However, CVR estimates from voxel-based analysis depended on the centre of the delay constraint.
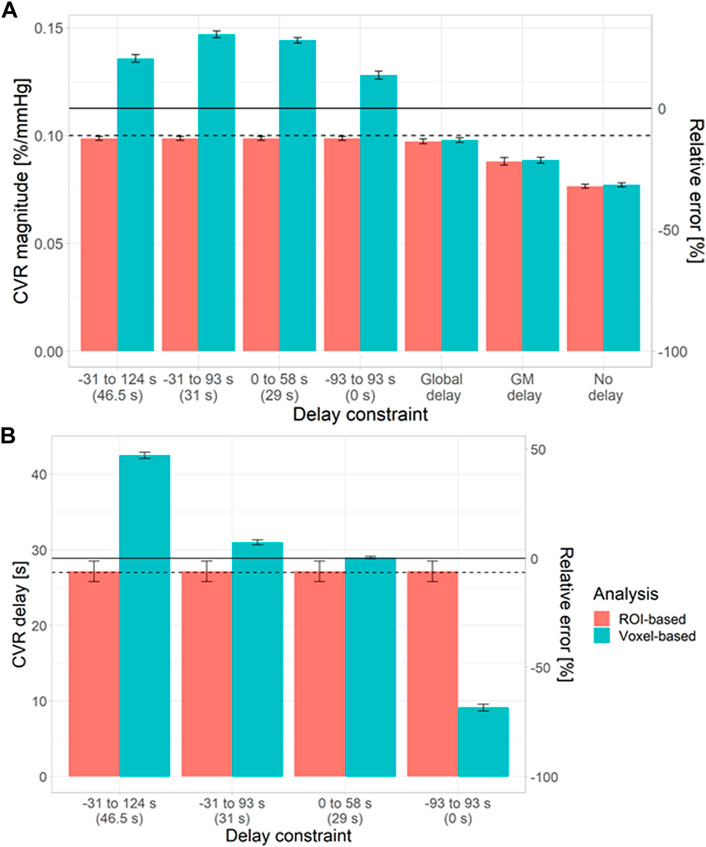
FIGURE 3. Simulations showing the impact of the delay constraint and assumption of fixed delay at a voxel tCNR of 0.1 on the estimation of CVR magnitude (A) and delay (B) in NAWM. The bars and error bars correspond to the mean and standard deviation respectively of the CVR estimates across 1000 repetitions for the voxel- (blue) and ROI-based (pink) analyses. Horizontal solid and dashed lines represent the ground-truth mean and median values, respectively. The relative errors were computed with respect to the ground-truth mean values. The central values for each delay constraint are shown in parentheses. (ROI: region of interest, GM: grey matter, NAWM: normal-appearing white matter).
When CVR magnitude was estimated with a fixed delay, estimates from ROI- and voxel-based analyses were similar (Figure 3), but large systematic errors were observed (5–32%). The closer the fixed delay was to the mean delay in the ROI, the lower the relative error in CVR magnitude. For example, using a fixed delay obtained by fitting the mean GM signal resulted in large relative errors in NAWM CVR (>20%).
3.2 MRI experiments
Raw data acquired for this work were made openly accessible (https://doi.org/10.7488/ds/3492). We recruited 15 healthy volunteers (age: 28.1 ± 5.5 years, female: 53%) who all underwent the two CVR scans with a median time of 31.5 min between the starts of the scans. One participant didn’t complete the first CVR scan, but sufficient data was collected (4.2/12 min) to include in the analysis. Data from another subject were excluded from the analysis due to severe motion artefacts during scan one. Overall, the scans were well-tolerated (scan one: 4/15 very tolerable, 10/15 tolerable, 1/15 intolerable; scan two: 7/15 very tolerable, 8/15 tolerable). Symptoms reported by the subjects per scan were: 26/30 dyspnoea, 9/30 dry mouth, 8/30 dizziness or headache, 6/30 tingling sensations, 6/30 anxiety, 6/30 sensation of accelerated heart rate and 3/30 claustrophobia. Subjects reported mask discomfort in 3/30 scans and noticed a difference between the two inhaled gases in 27/30 scans.
3.3 CVR and physiological parameters
CVR magnitude and delay measurements at the two scans are shown in Table 1 and displayed in Figures 4–6; Supplementary Figure S2, S3. CVR magnitude was higher in GM than in NAWM [scan one difference: 0.19 (0.17, 0.21)%/mmHg for ROI-based analysis, 0.20 (0.17, 0.22)%/mmHg for voxel-based analysis], while CVR delay was shorter [−25.3 (−31.3, −19.3) s for ROI-based analysis, −21.8 (−23.7, −20.0) s for voxel-based analysis; Table 1]. Inter-scan CVs ranged from 7.48% to 14.91% for CVR magnitude and from 12.49% to 50.00% for CVR delay (Table 2). CVR magnitude was systematically lower at scan two than scan one [difference in GM: −0.01 (−0.03, −0.00)%/mmHg corresponding to −4% change for ROI-based analysis, −0.02 (−0.03, −0.00)%/mmHg corresponding to −7% for voxel-based analysis; Figures 5, 6; Supplementary Figure S2; Table 1].

TABLE 1. Mean and standard deviation across subjects of CVR magnitudes and delays in SGM, CGM, GM and NAWM computed for each scan with ROI- and voxel-based processing. Mean ± standard deviation of the inter-scan and inter-analysis differences are reported with the 95% confidence intervals in parentheses.
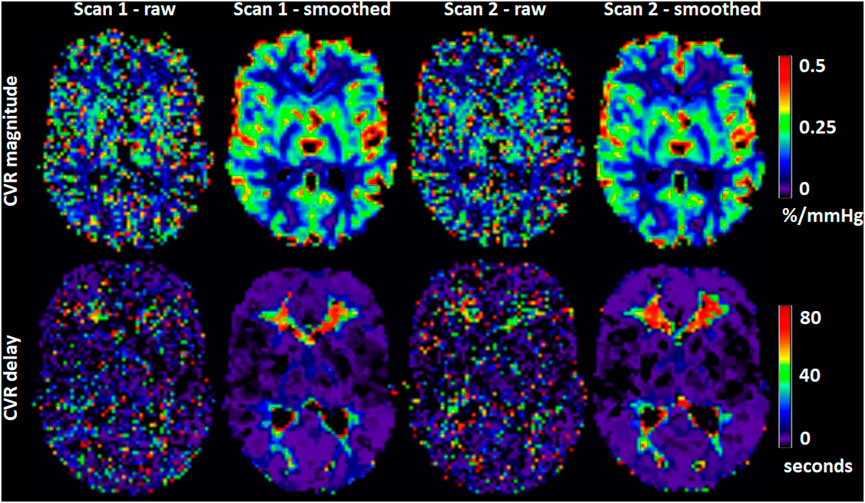
FIGURE 4. Maps of CVR magnitude and delay from one representative participant obtained from scan 1 and 2. The smoothed maps were obtained after spatially smoothing the BOLD volumes using a Gaussian filter with full width at half maximum of 4 mm and are shown here for visual purposes only.
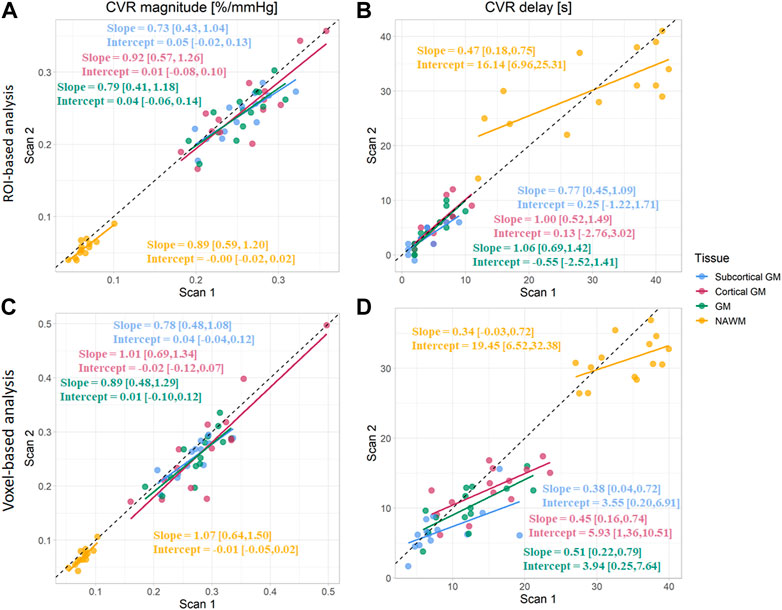
FIGURE 5. Comparison of CVR magnitudes (A, C) and delays (B, D) between scans. Estimates were computed in subcortical GM, cortical GM, GM, and NAWM from the ROI-based (A, B) and voxel-based analysis (C, D). (GM, Grey matter; NAWM, Normal-appearing white matter).
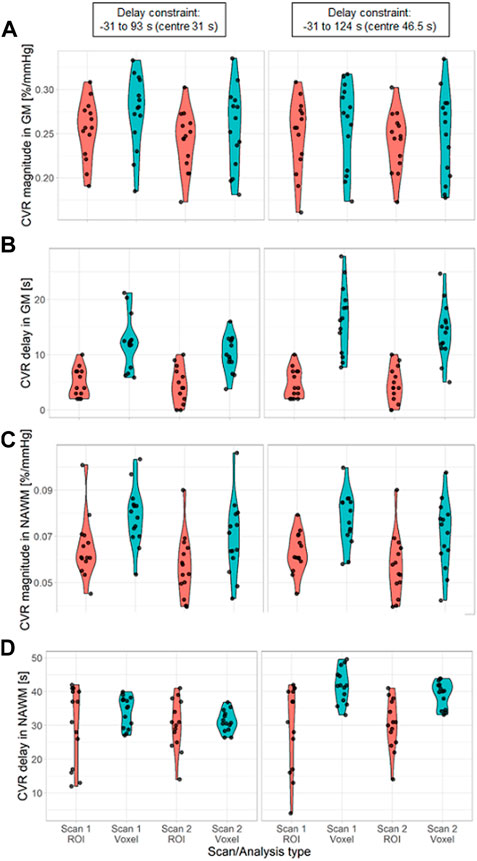
FIGURE 6. Violin distribution of CVR magnitude (A, C) and delay (B, D) in SGM (A, B) and NAWM (C, D) as a function of the scan and the processing method: ROI-based (red) versus voxel-based analysis (blue). The analysis was performed with two different delay constraints: −31–93 s (first column) and −31–124 s (second column). (SGM, Subcortical grey matter; NAWM, Normal-appearing white matter).
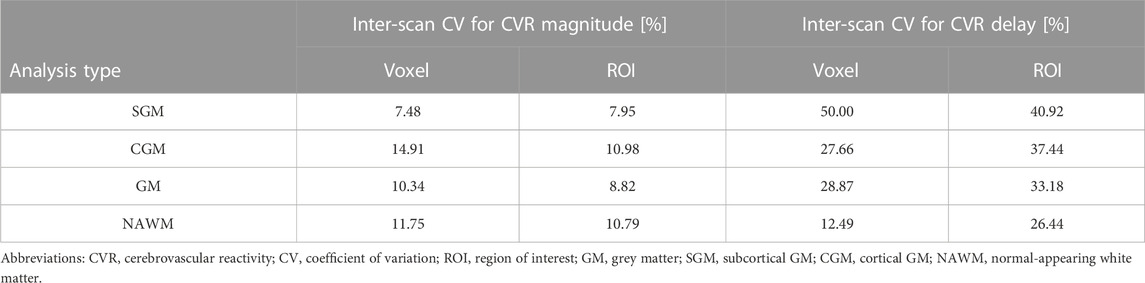
TABLE 2. Inter-scan coefficients of variation for CVR magnitude and delay in SGM, CGM, GM, and NAWM as a function of the analysis type.
Physiological variables and baseline BOLD signals measured at both scans are given in Table 3. EtCO2 (Supplementary Figure S4; Table 3) and EtO2 (Table 3) changes were greater in scan two than in scan one [+1.0 (0.4, 1.5) mmHg for EtCO2, +1.6 (0.4, 2.8) mmHg for EtO2] but the baseline values were similar. In a linear model, reduced CVR magnitude was associated with increased EtCO2 change in SGM [−0.012 (−0.021, −0.003)%/mmHg2] and NAWM [−0.006 (−0.010, −0.002)%/mmHg2], and increased baseline EtCO2 in GM [−0.013 (−0.023, −0.004)%/mmHg2]. Mean heart rate was lower at scan two than at scan one [difference: −5.5 (−8.6, −2.4) bpm; Table 3]. Heart rate was lower during the CO2 block than during the air block in scan one but did not change between blocks in scan two. The respiration rate did not differ between scans and blocks nor were there differences in mean arterial pressure pre- and post-CVR scan (Table 3).
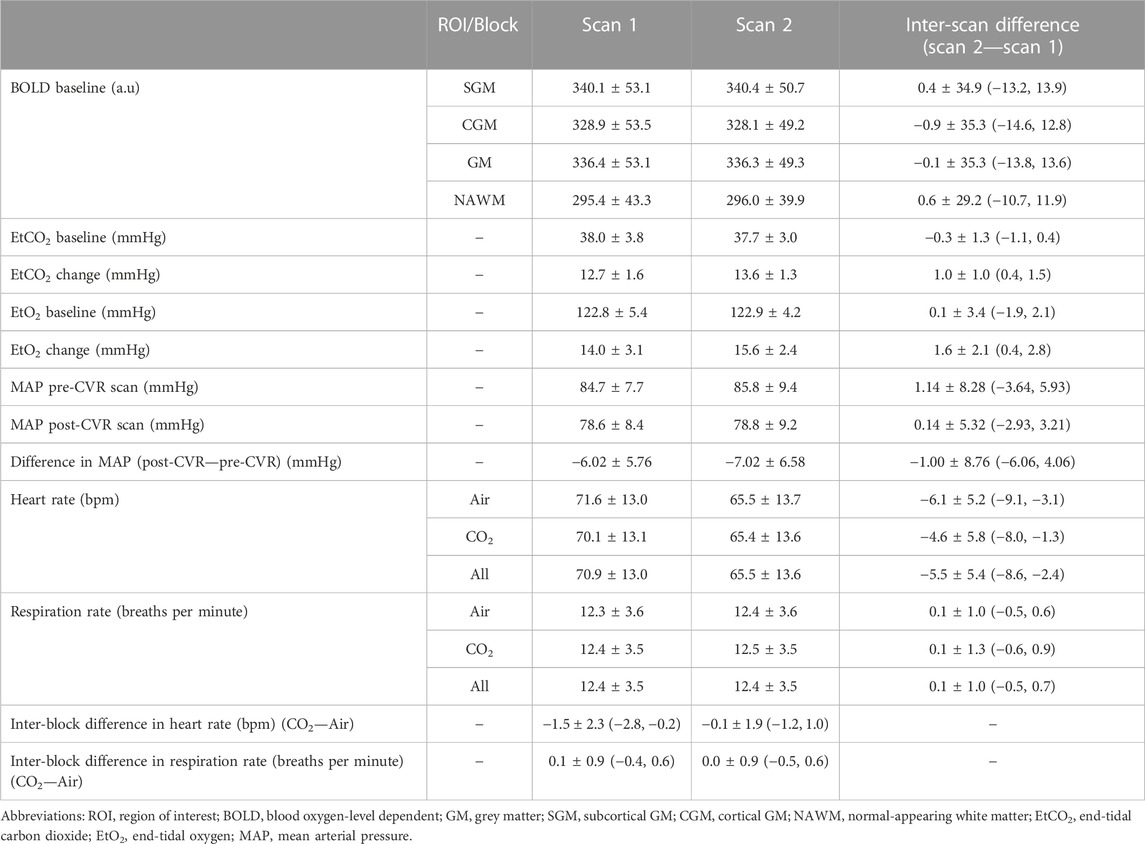
TABLE 3. Mean and standard deviation of the physiological variables. The mean and standard deviation of inter-scan and inter-block differences are reported, together with the 95% confidence intervals.
3.4 Comparison of ROI- and voxel-based analysis in vivo
CVR magnitude was lower and CVR delay shorter in the ROI-based versus voxel-based analysis [e.g., difference for scan 1: −0.020 (−0.027, −0.013)%/mmHg for GM CVR magnitude, −7.4 (−9.9, −4.9) s for GM CVR delay; Table 1]. Nevertheless, CVR magnitude had a good test-retest repeatability (CV: 7.48–14.91%) in all ROIs independent of analysis type (Figure 5; Table 1, 2). The repeatability of CVR delay in GM structures was good (28.87% for the voxel-based analysis, 33.18% for the ROI-based analysis; Figure 5 and Table 1, 2. CV for CVR delay in NAWM from the voxel-based analysis was 12.49%, compared to 26.44% in the ROI-based analysis (Table 2), and its distribution was tightly centred around 33 s (Figure 6).
Increasing the upper delay constraint resulted in a delay range with a higher mid-point (46.5 s for the −31–124 s range vs. 31 s for the −31–93 s range). CVR delays from the voxel-based analysis were extended [difference for scan 1: +4.1 (2.7, 5.4) s in GM] whereas CVR delays from the ROI-based analysis did not change (Figure 6; Supplementary Table S1). CVR magnitudes from the voxel-based analysis were lower [difference for scan one: −0.015 (−0.027, −0.003)%/mmHg in GM; Figure 6; Supplementary Table S1]; CVR magnitudes estimated using ROI analysis weren’t affected.
4 Discussion
In this work, we found through simulations that 3T BOLD CVR magnitude values determined using voxel-based analysis rapidly lost accuracy and precision at low tCNR. ROI-based analysis estimated CVR delay accurately but underestimated CVR magnitude due to averaging BOLD signals across voxels with a distribution of ground-truth values. Fitting data with a variable delay parameter was found to be essential to obtain accurate CVR magnitude estimates, however estimates from voxel-based analysis can be strongly dependent on the delay constraints. The 3T BOLD CVR experiment using a fixed inspired CO2 stimulus showed good within-day repeatability, though CVR delay estimates were less repeatable than CVR magnitude estimates. However, we noted small systematic differences in CVR magnitude between the two scans.
4.1 Simulations
Simulation results showed that, for ROI-based analysis, the accuracy of CVR magnitude estimates didn’t depend on tCNR, but there was a consistent underestimation with respect to the ground-truth mean (6%–26% depending on the ROI) due to signal averaging over voxels with a distribution of ground-truth CVR delay. On the other hand, CVR magnitude estimates were closer to the ground-truth median, although without converging towards it at high tCNR. Moreover, CVR delay estimates from ROI-based analysis were close to the ground-truth median value, independent of tCNR, reflecting the asymmetry of the CVR delay distribution. For voxel-based analysis, CVR magnitude and delay were accurate with respect to the ground-truth mean values at high tCNR. However, substantial bias with respect to the ground-truth mean CVR magnitude and delay values were found at low tCNR. Additional simulations showed that the choice of delay constraints had a strong impact on the accuracy of both parameters at low tCNR. This can be explained by the distribution of the CVR delay estimates being dominated by the delay constraints at low tCNR. Regarding precision, this was similar for CVR magnitude estimates using both methods. For CVR delay estimates, precision was higher for voxel-based analysis, however this may reflect the estimates being determined by the constraints rather than the intrinsic precision. Additional simulations explored the practice, reported in the literature, of fitting the CVR signal without a delay, or with a delay obtained by fitting the mean signal in GM or across the whole brain. This resulted in substantial systematic errors (2–24%) in CVR magnitude, irrespective of whether voxel- or ROI-based analysis was used, though precision was increased.
4.2 In vivo findings
In our group of healthy volunteers, we found GM CVR magnitudes (range: 0.19%—0.24%/mmHg) within the range of reported values from previous repeatability studies (Kassner et al., 2010; Leung et al., 2016; Thrippleton et al., 2018), though one study using an EtCO2 targeting stimulus reported GM CVR magnitude of 0.43%/mmHg (Dengel et al., 2017). In our study, NAWM CVR magnitudes were lower than in GM (0.06—0.08 versus 0.19%—0.24%/mmHg); these values were also in good agreement with the literature (Kassner et al., 2010; Thrippleton et al., 2018), except for one study that reported NAWM CVR magnitude of 0.15%/mmHg, but scanned adolescents, used an EtCO2 targeting stimulus and processed the data using a voxel-based analysis with fixed global delay (Leung et al., 2016). CVR delays were shorter in GM than in NAWM (3.2—14.9 s versus 30.1—34.0 s), agreeing with results from a previous repeatability study at 1.5T (Thrippleton et al., 2018). Our results also provide further evidence for the good repeatability of the CVR experiment using an FI stimulus: CVs for CVR magnitude repeatability were low (range including all ROIs: 7.48%—14.91%), similar to reported literature values using the same technique and processing method (Thrippleton et al., 2018), but higher than studies using an EtCO2 targeting stimulus (Kassner et al., 2010; Dengel et al., 2017). CVs for CVR delay repeatability (12.49%—50.00%) were similar to previously reported values at 1.5T (Thrippleton et al., 2018).
When comparing analysis approaches, we found systematically higher CVR magnitudes and longer CVR delays in all tissues for the voxel-based analysis, which was consistent with simulations. Indeed, simulations showed that processing methods are intrinsically dependent on the ground-truth distributions and differences in CVR estimates obtained from voxel- and ROI-based analyses can arise from asymmetry in those distributions. This finding, confirmed here in simulations and in data from healthy volunteers, can limit inter-study comparisons. Repeatability of CVR magnitude measurements was similar for both methods, however the repeatability for CVR delay in NAWM computed using a voxel-based analysis was higher than for ROI-based analysis. We showed that these effects were related to the delay constraint and high noise level in the voxel-wise BOLD signals. These findings are consistent with our simulation results and show that CVR estimates from voxel-based analysis are likely to be unreliable.
Surprisingly, average CVR magnitude was slightly lower at the second scan. Such a bias was only reported in one previous repeatability study, which found that a reduction in CVR magnitude between scans was associated with higher baseline EtCO2 and greater EtCO2 change in the second scan (Hou et al., 2019). In the present study, EtCO2 change was also significantly greater in the second scan compared to the first scan, but baseline EtCO2 was unchanged. Greater EtCO2 change was also associated with reduction in CVR magnitude. Therefore, we speculate that the non-linearity of the (approximately sigmoidal (Bhogal et al., 2014)) BOLD response to EtCO2 combined with the greater EtCO2 change explained the reduced CVR estimates based on a linear model at the second scan. The reason for the greater EtCO2 change at the second scan isn’t known; based on the inter-scan reduction in heart rate, we speculate that habituation to the CVR experiment could be a contributing factor. This could impact studies where CVR scans are repeated within the same day, for example to investigate instantaneous effects of a specific treatment on CVR. On the other hand, this might be a short-term effect that would not affect longitudinal studies of CVR, but further work is needed to confirm this.
4.3 Implications
Our findings have some implications for future studies. First, using devices targeting specific values of and changes in EtCO2 could be beneficial in reducing the impact of variable EtCO2 change and baseline EtCO2 (Fierstra et al., 2013). Familiarising the participants with the gas challenge prior to the CVR scan is essential to avoid anxiety and to minimise differences in baseline physiological state between repeated CVR measurements. Measuring blood pressure, heart and respiration rates during the CVR scan provides an indication of the extent of these effects.
The dynamic aspect of the CVR response should be taken into account. Estimating CVR delay provides additional physiological information, and is known to differ between tissues (Thomas et al., 2014; Thrippleton et al., 2018) and diseases (Thrippleton et al., 2018; Atwi et al., 2019). However, the interpretation of CVR delay should take into account possible steal effects through the redistribution of blood flow from blood vessels that have more reactivity (Sobczyk et al., 2014; Bhogal et al., 2015) and venous architecture in the WM that contributes to delayed WM responses (Bhogal, 2021). A recent systematic review showed that, though correcting for CVR delay is becoming more common, consensus regarding the delay extraction method is still missing (Sleight et al., 2021). We found that variable delays should be used when modelling the signal, since fitting with a fixed delay may result in large biases. Delay constraints are needed to restrict delays to realistic values. However, to allow variable delays, one should ensure sufficient EtCO2 recording before and after the CVR scan. We expect that the findings of this study would also be applicable in analyses where bulk alignment of the EtCO2 with the mean whole-brain or mean GM BOLD signal is used as a pre-processing step followed by voxel- or ROI-based analysis of CVR delay and magnitude.
Potential asymmetry in the distributions of ground-truth parameters should be considered. Using the median instead of mean estimates across ROIs in a voxel-based analysis could be more representative of the underlying distribution.
It is important to achieve sufficiently high tCNR to ensure accurate voxel-based mapping of CVR parameters. If this cannot be achieved then it may be advantageous to use a ROI-based analysis. However, intra-regional heterogeneity of the CVR parameters will be missed using this method, and the CVR magnitude estimates may not reflect the true mean values of non-uniform distribution. Moreover, any processing method that uses a voxel-based analysis to determine CVR delay will be subject to the bias at low tCNR found in this study (e.g., determining CVR delay for each voxel in order to realign the MRI signal before averaging). Analysis of data using different delay constraints may help verify that the estimates are not biased in this way. In our healthy volunteer cohort, analysis using different constraints did affect the results, implying that a ROI-based analysis could be more accurate in this context.
4.4 Strengths and limitations
A strength of this work is that we used simulations to compare different analysis types, tCNR levels and fitting constraints. As such, we could predict estimation errors based on known ground-truth values. Furthermore, this is the first study to objectively compare multiple analysis approaches that have been commonly reported in the literature. Lastly, our in vivo repeatability MRI dataset and simulation code have been made publicly accessible to allow other researchers to test and compare their processing methods; it is hoped that this will facilitate objective comparison of methods and development of consensus-based harmonisation in the field.
There are some limitations in this study. First, findings from this study might not be applicable to CVR MRI experiments where EtCO2 trace is not available. Furthermore, we didn’t investigate the effect of pre-processing methods such as spatial smoothing. However, we expect those to have an impact on the accuracy, precision and specificity of CVR estimates which should be investigated in future work. Regarding the simulations, we did not account for a non-instantaneous impulse response function (Poublanc et al., 2015). Research is on-going to determine and validate the HRF underlying the BOLD CVR signal (Poublanc et al., 2015; Yao et al., 2021). This could be addressed in future work. Moreover, the simulated noise was assumed to be independent in each voxel. For in vivo data, some noise components are temporally and spatially correlated due to phenomena such as physiological noise and patient motion. Future work could benefit from the development of a realistic four-dimensional digital reference object for CVR. We also assumed no correlation between ground-truth CVR magnitude and delay within each tissue, since the relationship isn’t known. Furthermore, while our simulations incorporated non-uniform distributions of ground-truth CVR magnitude and delay within tissues, these were based on average measurements from our relatively small healthy volunteer cohort, which are themselves subject to the limitations addressed in this work. Future simulation work could incorporate improved estimates of ground-truth CVR parameter distributions. This limitation may affect the quantitative results but is unlikely to affect our conclusions.
4.5 Conclusion
In conclusion, we have shown that CVR measurement using 3T BOLD MRI with a fixed inhaled CO2 concentration stimulus has good within-day repeatability in healthy volunteers, supporting its application in clinical studies and trials. We addressed the long-standing question of whether ROI- or voxel-based analysis is more accurate, predicting more robust estimation with the ROI-based approach, though underestimating CVR estimates with respect to the mean of the ground-truth distribution. Voxel-based analysis should be applied and interpreted with caution. Finally, we found that accurately modelling the CVR delay is key for reducing errors in CVR magnitude estimates.
Data availability statement
The datasets presented in this study can be found in online repositories. The names of the repository/repositories and accession number(s) can be found below: 3T BOLD CVR data from healthy volunteers suitable for within-day repeatability analyses (https://doi.org/10.7488/ds/3492).
Ethics statement
The studies involving human participants were reviewed and approved by Research Ethics Committee (ref. 14/HV/0001). The patients/participants provided their written informed consent to participate in this study.
Author contributions
ES designed the study, acquired, processed, and analysed the CVR data, created and analysed the simulations and prepared the manuscript. MJT, MSS, IaM, and JMW contributed to the work by participating in the study design and discussing the interpretation of the results. IsM and MM participated in the acquisition of the CVR data. All authors contributed and reviewed the article, and approved the submitted version.
Funding
This work was funded by the Medical Research Council (ES) and UK Dementia Research Institute (UK DRI), which receives its funding from UK DRI Ltd., which is funded by the Medical Research Council, Alzheimer’s Society and Alzheimer’s Research United Kingdom. This work also received funding from the European Union Horizon 2020 (PHC-03-15, project no. 666881 “SVDs@Target”), the Fondation Leducq Transatlantic Network of Excellence for the Study of Perivascular Spaces in Small Vessel Disease (ref. No. 16CVD 05), and the Scottish Chief Scientist Office through the NHS Lothian Research and Development Office (MJT). For the purpose of open access, the author has applied a CC BY public copyright licence to any Author Accepted Manuscript version arising from this submission.
Acknowledgments
We thank the participants, radiographers, and professional support staff for their contribution to this work.
Conflict of interest
The authors declare that the research was conducted in the absence of any commercial or financial relationships that could be construed as a potential conflict of interest.
Publisher’s note
All claims expressed in this article are solely those of the authors and do not necessarily represent those of their affiliated organizations, or those of the publisher, the editors and the reviewers. Any product that may be evaluated in this article, or claim that may be made by its manufacturer, is not guaranteed or endorsed by the publisher.
Supplementary material
The Supplementary Material for this article can be found online at: https://www.frontiersin.org/articles/10.3389/fphys.2023.1070233/full#supplementary-material
References
Atwi S., Shao H., Crane D. E., Costa L., da Aviv R. I., Mikulis D. J., et al. (2019). BOLD-based cerebrovascular reactivity vascular transfer function isolates amplitude and timing responses to better characterize cerebral small vessel disease. NMR Biomed. 32, e4064. doi:10.1002/nbm.4064
Bhogal A. A. (2021). Medullary vein architecture modulates the white matter BOLD cerebrovascular reactivity signal response to CO2: Observations from high-resolution T2* weighted imaging at 7T. NeuroImage 245, 118771. doi:10.1016/j.neuroimage.2021.118771
Bhogal A. A., Philippens M. E. P., Siero J. C. W., Fisher J. A., Petersen E. T., Luijten P. R., et al. (2015). Examining the regional and cerebral depth-dependent BOLD cerebrovascular reactivity response at 7T. NeuroImage 114, 239–248. doi:10.1016/j.neuroimage.2015.04.014
Bhogal A. A., Siero J. C. W., Fisher J. A., Froeling M., Luijten P., Philippens M., et al. (2014). Investigating the non-linearity of the BOLD cerebrovascular reactivity response to targeted hypo/hypercapnia at 7T. NeuroImage 98, 296–305. doi:10.1016/j.neuroimage.2014.05.006
Blair G. W., Thrippleton M. J., Shi Y., Hamilton I., Stringer M., Chappell F., et al. (2020). Intracranial hemodynamic relationships in patients with cerebral small vessel disease. Neurology 94, e2258–e2269. doi:10.1212/WNL.0000000000009483
Bright M. G., Murphy K. (2013). Reliable quantification of BOLD fMRI cerebrovascular reactivity despite poor breath-hold performance. NeuroImage 83, 559–568. doi:10.1016/j.neuroimage.2013.07.007
Dengel D. R., Evanoff N. G., Marlatt K. L., Geijer J. R., Mueller B. A., Lim K. O. (2017). Reproducibility of blood oxygen level-dependent signal changes with end-tidal carbon dioxide alterations. Clin. Physiol. Funct. Imaging 37, 794–798. doi:10.1111/cpf.12358
Donahue M. J., Strother M. K., Lindsey K. P., Hocke L. M., Tong Y., Frederick B. D. B. (2016). Time delay processing of hypercapnic fMRI allows quantitative parameterization of cerebrovascular reactivity and blood flow delays. J. Cereb. Blood Flow. Metab. 36, 1767–1779. doi:10.1177/0271678X15608643
Fierstra J., Sobczyk O., Battisti-Charbonney A., Mandell D. M., Poublanc J., Crawley A. P., et al. (2013). Measuring cerebrovascular reactivity: What stimulus to use? J. Physiol. 591, 5809–5821. doi:10.1113/jphysiol.2013.259150
Fonov V., Evans A. C., Botteron K., Almli C. R., McKinstry R. C., Collins D. L., et al. (2011). Unbiased average age-appropriate atlases for pediatric studies. NeuroImage 54, 313–327. doi:10.1016/j.neuroimage.2010.07.033
Fonov V., Evans A., McKinstry R., Almli C., Collins D. (2009). Unbiased nonlinear average age-appropriate brain templates from birth to adulthood. NeuroImage 47, S102. doi:10.1016/S1053-8119(09)70884-5
Friston K. J. (Editor) (2007). “Statistical parametric mapping,” Statistical parametric mapping: The analysis of funtional brain images (Amsterdam Boston: Elsevier/Academic Press), 10–31.
Grubb R. L., Raichle M. E., Eichling J. O., Ter-Pogossian M. M. (1974). The effects of changes in PaCO2 on cerebral blood volume, blood flow, and vascular mean transit time. Stroke 5, 630–639. doi:10.1161/01.STR.5.5.630
Heijtel D. F. R., Mutsaerts H. J. M. M., Bakker E., Schober P., Stevens M. F., Petersen E. T., et al. (2014). Accuracy and precision of pseudo-continuous arterial spin labeling perfusion during baseline and hypercapnia: A head-to-head comparison with ¹⁵O H₂O positron emission tomography. Neuroimage 92, 182–192. doi:10.1016/j.neuroimage.2014.02.011
Hou X., Liu P., Li Y., Jiang D., De Vis J. B., Lin Z., et al. (2019). The association between BOLD-based cerebrovascular reactivity (CVR) and end-tidal CO2 in healthy subjects. Neuroimage 207, 116365. doi:10.1016/j.neuroimage.2019.116365
Jenkinson M., Bannister P., Brady M., Smith S. (2002). Improved optimization for the robust and accurate linear registration and motion correction of brain images. NeuroImage 17, 825–841. doi:10.1016/s1053-8119(02)91132-8
Jenkinson M., Smith S. (2001). A global optimisation method for robust affine registration of brain images. Med. Image Anal. 5, 143–156. doi:10.1016/S1361-8415(01)00036-6
Kassner A., Winter J. D., Poublanc J., Mikulis D. J., Crawley A. P. (2010). Blood-oxygen level dependent MRI measures of cerebrovascular reactivity using a controlled respiratory challenge: Reproducibility and gender differences. J. Magn. Reson. Imaging 31, 298–304. doi:10.1002/jmri.22044
Leung J., Kim J. A., Kassner A. (2016). Reproducibility of cerebrovascular reactivity measures in children using BOLD MRI. J. Magn. Reson. Imaging 43, 1191–1195. doi:10.1002/jmri.25063
Li X., Morgan P. S., Ashburner J., Smith J., Rorden C. (2016). The first step for neuroimaging data analysis: DICOM to NIfTI conversion. J. Neurosci. Methods 264, 47–56. doi:10.1016/j.jneumeth.2016.03.001
Lipp A., Schmelzer J. D., Low P. A., Johnson B. D., Benarroch E. E. (2010). Ventilatory and cardiovascular responses to hypercapnia and hypoxia in multiple-system atrophy. Archives Neurology 67, 211–216. doi:10.1001/archneurol.2009.321
Liu P., De Vis J. B., Lu H. (2019). Cerebrovascular reactivity (CVR) MRI with CO2 challenge: A technical review. NeuroImage 187, 104–115. doi:10.1016/j.neuroimage.2018.03.047
Liu P., Welch B. G., Li Y., Gu H., King D., Yang Y., et al. (2017). Multiparametric imaging of brain hemodynamics and function using gas-inhalation MRI. NeuroImage 146, 715–723. doi:10.1016/j.neuroimage.2016.09.063
Merola A., Germuska M. A., Murphy K., Wise R. G. (2018). Assessing the repeatability of absolute CMRO2, OEF and haemodynamic measurements from calibrated fMRI. NeuroImage 173, 113–126. doi:10.1016/j.neuroimage.2018.02.020
Noth U., Kotajima F., Deichmann R., Turner R., Corfield D. R. (2008). Mapping of the cerebral vascular response to hypoxia and hypercapnia using quantitative perfusion MRI at 3 T. NMR Biomed. 21, 464–472. doi:10.1002/nbm.1210
Ogawa S., Lee T. M., Kay A. R., Tank D. W. (1990). Brain magnetic resonance imaging with contrast dependent on blood oxygenation. Proc. Natl. Acad. Sci. U. S. A. 87, 9868–9872. doi:10.1073/pnas.87.24.9868
Patenaude B., Smith S. M., Kennedy D. N., Jenkinson M. (2011). A Bayesian model of shape and appearance for subcortical brain segmentation. Neuroimage 56, 907–922. doi:10.1016/j.neuroimage.2011.02.046
Petersson J., Glenny R. W. (2014). Gas exchange and ventilation–perfusion relationships in the lung. Eur. Respir. J. 44, 1023–1041. doi:10.1183/09031936.00037014
Poublanc J., Crawley A. P., Sobczyk O., Montandon G., Sam K., Mandell D. M., et al. (2015). Measuring cerebrovascular reactivity: The dynamic response to a step hypercapnic stimulus. J. Cereb. Blood Flow. Metab. 35, 1746–1756. doi:10.1038/jcbfm.2015.114
Rostrup E., Larsson H. B. W., Toft P. B., Garde K., Thomsen C., Ring P., et al. (1994). Functional MRI of CO2 induced increase in cerebral perfusion. NMR Biomed. 7, 29–34. doi:10.1002/nbm.1940070106
Sleight E., Stringer M. S., Marshall I., Wardlaw J. M., Thrippleton M. J. (2021). Cerebrovascular reactivity measurement using magnetic resonance imaging: A systematic review. Front. Physiol. 12, 643468. doi:10.3389/fphys.2021.643468
Sobczyk O., Battisti-Charbonney A., Fierstra J., Mandell D. M., Poublanc J., Crawley A. P., et al. (2014). A conceptual model for CO₂-induced redistribution of cerebral blood flow with experimental confirmation using BOLD MRI. NeuroImage 92, 56–68. doi:10.1016/j.neuroimage.2014.01.051
Stringer M. S., Blair G. W., Hamilton I., Doubal F. N., Marshall I. M., Thrippleton M. J., et al. (2021). A comparison of CVR magnitude and delay assessed at 1.5 and 3T in patients with cerebral small vessel disease. Front. Physiol. 12, 644837. doi:10.3389/fphys.2021.644837
Thomas B. P., Liu P., Park D. C., Van Osch M. J. P., Lu H. (2014). Cerebrovascular reactivity in the brain white matter: Magnitude, temporal characteristics, and age effects. J. Cereb. Blood Flow. Metab. 34, 242–247. doi:10.1038/jcbfm.2013.194
Thrippleton M. J., Shi Y., Blair G., Hamilton I., Waiter G., Schwarzbauer C., et al. (2018). Cerebrovascular reactivity measurement in cerebral small vessel disease: Rationale and reproducibility of a protocol for MRI acquisition and image processing. Int. J. Stroke 13, 195–206. doi:10.1177/1747493017730740
Tong Y., Bergethon P. R., Frederick B. D. (2011). An improved method for mapping cerebrovascular reserve using concurrent fMRI and near-infrared spectroscopy with Regressor Interpolation at Progressive Time Delays (RIPTiDe). NeuroImage 56, 2047–2057. doi:10.1016/j.neuroimage.2011.03.071
Watchmaker J. M., Frederick B. D., Fusco M. R., Davis L. T., Juttukonda M. R., Lants S. K., et al. (2019). Clinical use of cerebrovascular compliance imaging to evaluate revascularization in patients with moyamoya. Clin. Neurosurg. 84, 261–271. doi:10.1093/neuros/nyx635
Yao J., Fiona , Yang H.-C., Shawn , Wang J. H., Liang Z., et al. (2021). A novel method of quantifying hemodynamic delays to improve hemodynamic response, and CVR estimates in CO2 challenge fMRI. J. Cereb. Blood Flow. Metab. 41, 18860271678X20978582–1898. doi:10.1177/0271678X20978582
Zhang Y., Brady M., Smith S. (2001). Segmentation of brain MR images through a hidden Markov random field model and the expectation-maximization algorithm. IEEE Trans. Med. Imaging 20, 45–57. doi:10.1109/42.906424
Keywords: cerebrovascular reactivity, reliability, repeatability, blood oxygen-level dependent, hypercapnia
Citation: Sleight E, Stringer MS, Mitchell I, Murphy M, Marshall I, Wardlaw JM and Thrippleton MJ (2023) Cerebrovascular reactivity measurements using 3T BOLD MRI and a fixed inhaled CO2 gas challenge: Repeatability and impact of processing strategy. Front. Physiol. 14:1070233. doi: 10.3389/fphys.2023.1070233
Received: 14 October 2022; Accepted: 19 January 2023;
Published: 06 February 2023.
Edited by:
Binu P. Thomas, University of Texas Southwestern Medical Center, United StatesReviewed by:
Alex Bhogal, Utrecht University, NetherlandsAli Golestani, University of Toronto, Canada
Copyright © 2023 Sleight, Stringer, Mitchell, Murphy, Marshall, Wardlaw and Thrippleton. This is an open-access article distributed under the terms of the Creative Commons Attribution License (CC BY). The use, distribution or reproduction in other forums is permitted, provided the original author(s) and the copyright owner(s) are credited and that the original publication in this journal is cited, in accordance with accepted academic practice. No use, distribution or reproduction is permitted which does not comply with these terms.
*Correspondence: Michael J. Thrippleton, m.j.thrippleton@ed.ac.uk