 Xuehong Zhang1,2
 Yang He1
 Chao Wang1Fan Xu1Xinhui Li1Changwei Tan3*Dongmei Chen1,4*Guojie Wang1Lixin Shi2
- 1Key Laboratory of Meteorological Disaster, Ministry of Education (KLME), Joint International Research Laboratory of Climate and Environment Change (ILCEC), Collaborative Innovation Center on Forecast and Evaluation of Meteotological Disasters (CIC-FEMD), School of Remote Sensing & Geomatics Engineering,School of Electronic and Information Engineering, School of Geographical Sciences, Nanjing University of Information Science & Technology, Nanjing, China
- 2Key Laboratory of Meteorology and Ecological Environment of Hebei Province, Meteorological Institute of Hebei Province, Shijiazhuang, China
- 3Jiangsu Key Laboratory of Crop Genetics and Physiology, Jiangsu Co-Innovation Center for Modern Production Technology of Grain Crops, Joint International Research Laboratory of Agriculture and Agri-Product Safety of the Ministry of Education of China, Yangzhou University, Yangzhou, China
- 4Department of Geography and Planning, Queen’s University, Kingston, ON, Canada
Chlorophyll (Chl) is one of the most important classes of light-absorbing pigments in photosynthesis, and the proportion of Chl in leaves is closely related to vegetation nutrient status. Remote sensing-based estimation of Chl content holds great potential for evaluating crop growth status in agricultural management, precision farming and ecosystem monitoring. Recent studies have shown that steady-state fluorescence contributed up to 2% on the apparent reflectance in the 750-nm spectral region of plant and also provided additional evidence for fluorescence in-filling of the atmospheric oxygen absorption band at a central wavelength of 760 nm (O2–A band). In this study, an in situ hyperspectral remote sensing approach zwas employed to estimate corn Chl content at the canopy level by using chlorophyll fluorescence (ChlF) signals in the O2–A absorption band. Two new spectral indices, REArea760 (sum of first derivative reflectance between 755 and 763 nm) and REA760 (maximum of first derivative reflectance between 755 and 763 nm), derived from the first derivative spectra in the O2–A band, were proposed for estimating the corn canopy Chl content (CCC). They were compared with the performance of published indices measured at ground level, including the MERIS Terrestrial Chlorophyll Index (MTCI), Optimized Soil-Adjusted Vegetation Index 2 (OSAVI2), Modified Chlorophyll Absorption Ratio Index 2 (MCARI2), SR710, REArea (sum of first derivative reflectance between 680 and 780 nm), REA (maximum value of first derivative reflectance between 680 and 780 nm), and mND705. The results indicated that corn Chl content at the canopy level was better predicted by the new indices (with R2 = 0.835) than the published indices (with R2 ranging from 0.676 to 0.826). The two new indices ranked in the top four according to their summed ranks by integrating the ranks of RMSE and R2 of CCC linear regression models. ChlF originates only from chlorophyll in the photosynthetic apparatus and therefore is less sensitive to soil, wood, and dead biomass interference. Moreover, due to the fluorescence in-filling of the O2–A band and the amplified effect on spectrum signals by derivative operation, the spectral derivative indices in the O2–A band have great potential for estimating the CCC.
Introduction
Photosynthesis, a chemical reaction converting light energy to chemical energy in glucose, is the basis for sustaining all plants’ life on Earth (Nelson and Yocum, 2006; Ustin et al., 2009). Chlorophylls (Chls) are vital light-absorbing pigments for photosynthesis (Gitelson et al., 2014), and thus their concentrations in leaves are related closely to primary production (Gitelson et al., 2006a; Houborg et al., 2013; Schull et al., 2015) and leaf nitrogen content (Clevers and Kooistra, 2012; Schlemmer et al., 2013; Kokaly and Skidmore, 2015; Ramoelo et al., 2015). Furthermore, leaf chlorophyll (Chl) content can be impacted by changes in plant type (Gitelson et al., 2006b), disease and nutritional and environmental stresses (Datt, 1999a), and plant phenology (Croft et al., 2014). Therefore, it is important to accurately estimate Chl content for agricultural management, precision farming and ecosystem monitoring.
There are two types of Chl existing in the photosystems of leaves: Chl a and b. Over the past few decades, studies have found that Chl a when extracted in diethyl ether has peak absorption wavelengths of 430 and 662 nm, while the peak absorptions of Chl b are at 453 and 642 nm (Du et al., 1998; Ustin et al., 2009). However, the strong absorption and weak penetrability to leaves near the peak absorption wavelength can result in the saturation of pigment absorption, which makes the reflectance spectra less sensitive to the Chl content at the wavelengths near the peak absorption band. (Gamon and Surfus, 1999). On the contrary, the spectral regions at the green and red edge region, ranging from 680 to 780 nm, have a strong penetrating power to leaves, and the reflectance spectra are highly sensitive to Chl content (Miller et al., 1990; Carter, 1998; Gupta et al., 2003; Sampson et al., 2003; Ustin et al., 2009). Therefore, the concentration of Chl within leaves can be estimated by measuring the absorption of light in the red and far red spectrum.
Previous research has indicated that vegetation Chl content can be retrieved using combinations of wavebands (i.e. vegetation indices) from remote sensing platforms. In remote sensing, canopy Chl content (CCC) is often used as a good indicator of canopy photosynthetic activity. CCC is defined as the product of the green leaf area index (LAI) and the leaf Chl content per unit leaf area. CCC can be derived from satellite observed signals by inversion of leaf optics and canopy reflectance physical modes as well as empirical models (Daughtry et al., 2000; Sims and Gamon, 2002; Wu et al., 2008; Gitelson et al., 2014). A number of spectral indices were proposed to estimate vegetation Chl contents, including i) reflectance-based indices (Dash and Curran, 2004; Reyniers et al., 2006; Wu et al., 2008; Zhu et al., 2008), ii) derivative-based indices (Filella and Peñuelas, 1994; Zarco-Tejada et al., 2003; Ju et al., 2010; Wei et al., 2013), and iii) feature-based indices (Boochs et al., 1990; Vogelman et al., 1993; Broge and Leblanc, 2001; Vincini et al., 2006).
Derivative-based indices have been widely used in monitoring vegetation with remotely sensed data. The reflectance spectra of vegetation are often characterized by an abrupt ascending slope in the “red edge” region, ranging from 680 to 780 nm (Horler et al., 1983), due to the strong absorption and scattering of incident solar radiation in the red and near infrared region. The biophysical properties of vegetation, canopy structure, atmospheric absorption and scattering, and soil backgrounds always affect canopy hyperspectral reflectance (Tsai and Philpot, 1998). However, derivative-based indices can minimize the influences of these background interferences and spectral noise and more effectively capture biophysical characteristics of vegetation from the canopy spectra (Li et al., 2013). Previous studies have indicated that canopy reflectance spectra in the red edge region can provide important information regarding biochemical composition and biophysical features (Datt, 1998; Sims and Gamon, 2002). Therefore, several indices calculated from the red edge reflectance and its first derivative reflectance, such as the red edge amplitude (REA: maximum derivative spectra in the red edge region), the red edge position (REP: defined as the wavelength of inflection point in the red edge region), and red edge area (REArea) are often used to estimate plant composition, such as crop Chl (Gitelson and Merzlyak, 1996; Sims and Gamon, 2002; Gitelson et al., 2003; Tang et al., 2004; Mutanga and Skidmore, 2007; Wei et al., 2013).
Some researchers found that REA was a good indicator of plant Chl content (Boochs et al., 1990; Tang et al., 2004; Ju et al., 2010). Other reports, however, found that the relationship between REA and plant Chl concentration was dependent on the vegetation types (Wang et al., 2003; Tang et al., 2004). These results implied that the relationship between REA and Chl content was poorly defined (Ju et al., 2010). REP, another major red edge parameter, shifted toward the longer wavelengths with increasing Chl content (Horler et al., 1983; Curran et al., 1990), and thus REP has been usually used to estimate Chl content (Wei et al., 2013; Li et al., 2017). But double-peak features of the vegetation derivative spectra weakened the usefulness of REP in monitoring Chl content (Li et al., 2017). Therefore, new or improved red edge spectral parameters are needed to improve the robustness and accuracy of assessing plant Chl content using hyperspectral data.
Previous studies also have found that Chlorophyll fluorescence (ChlF) is closely related to Chl a+b content (Ni et al., 2015; Wieneke et al., 2016). ChlF is the red- and far-red emission reemitted by the Chl molecules itself after light absorption (Porcar-Castell et al., 2014). Solar-induced ChlF emission spectrum is characterized by two peaks at approximately 690 and 740 nm (Meroni et al., 2009; Van der Tol et al., 2016). Typically, only about 1% of the absorbed sunlight is reemitted through ChlF (Baker, 2008) and contributed up to 2% on the apparent reflectance in the 750-nm spectral region (Campbell et al., 2002; Liu et al., 2005; Pérez-Priego et al., 2005). ChlF radiance at 760 nm (F760) generally increased with increasing Chl concentration while ChlF radiance at 685 nm (F685) decreased due to re-absorption of the emitted fluorescence signal, and the variations in the ratio of F685 and F760 were most likely related to structural variables such as CCC (Ač et al., 2015; Wieneke et al., 2016). Two main canopy parameters (Chl a+b content and LAI) have a considerable effect on the ChlF radiance in the atmospheric oxygen absorption band at the central wavelength of 760 nm (O2–A band), besides dry matter and the leaf inclination distribution (Ni et al., 2015; Van der Tol et al., 2016). Canopy fluorescence signal is not only related to plant photosynthetic capacity, but also varies with leaf and canopy biophysical and biochemical characteristics (Rossini et al., 2016). In addition, the evaluation of the fluorescence in-filling effects on reflectance showed that the apparent reflectance and its derivative reflectance in the 680-770nm range were sensitive to ChlF (Zarco-Tejada et al., 2003; Pérez-Priego et al., 2005; Ni et al., 2015).
In this paper, we have investigated the characteristics of derivative reflectance in the O2–A band for corn canopy. A novel remote sensing approach for estimation of corn Chl content using the derivative reflectance indices in the O2–A band has been developed and evaluated. Specifically, two objectives were addressed: 1) to evaluate the feasibility of estimating the CCC using two derivative reflectance indices: REArea760 (sum of the first derivative reflectance between 755nm and 763nm) and REA760 (maximum value of first derivative reflectance between 755 and 763 nm); and 2) to compare the proposed derivative reflectance indices to other chlorophyll-related vegetation indices used for estimating Chl content.
Materials and Methods
Experimental Design
Two field trials were conducted during the corn growing seasons of 2003. Experiment 1 (Exp.1) was carried out on a field with loam soil located at the Beijing Academy of Agriculture and Forestry Sciences, China (39°55′N, 116°16′ E). The field experiment included a fertility experiment and cultivar experiment. Eleven cultivars were sown, including four compact type cultivars (Tangyu 10, Hudan 2000, Jingshibai 1 and Tangkang 5), four semi-compact type cultivars (Jingyu 7, Zhongyuandan 32, Zhongdan 9409 and Gaoyou 115), and three spread type cultivars (96-3, Zhengdan 958 and Yuyu 22). Two of them, Jingyu 7 and Tangyu 10, were selected for a fertility experiment of the three different nitrogen treatments. In total, 15 plots were sown with a unified planting density of row spacing of 70 cm and plant spacing of 30 cm. In addition, 10 additional density treatment plots were also set up, with a density of 7.8 × 10⁴ plants ha−1 for compact type cultivars and a density of 6.4 × 10⁴ plants ha−1 for semi-compact type cultivars. The individual size of all 25 plots was 15 m × 7m. Figure 1 shows the spatial distribution of all cultivars and nitrogen treatments of Exp.1. All the cultivars were sown on 20 June 2003 and each plot had no duplicated treatment with the others. Nitrogen treatments consisted of three doses [0, 75, 150Kg N ha−1] and the N applications were carried out on 15 July 2003 and 6 August 2003, respectively.
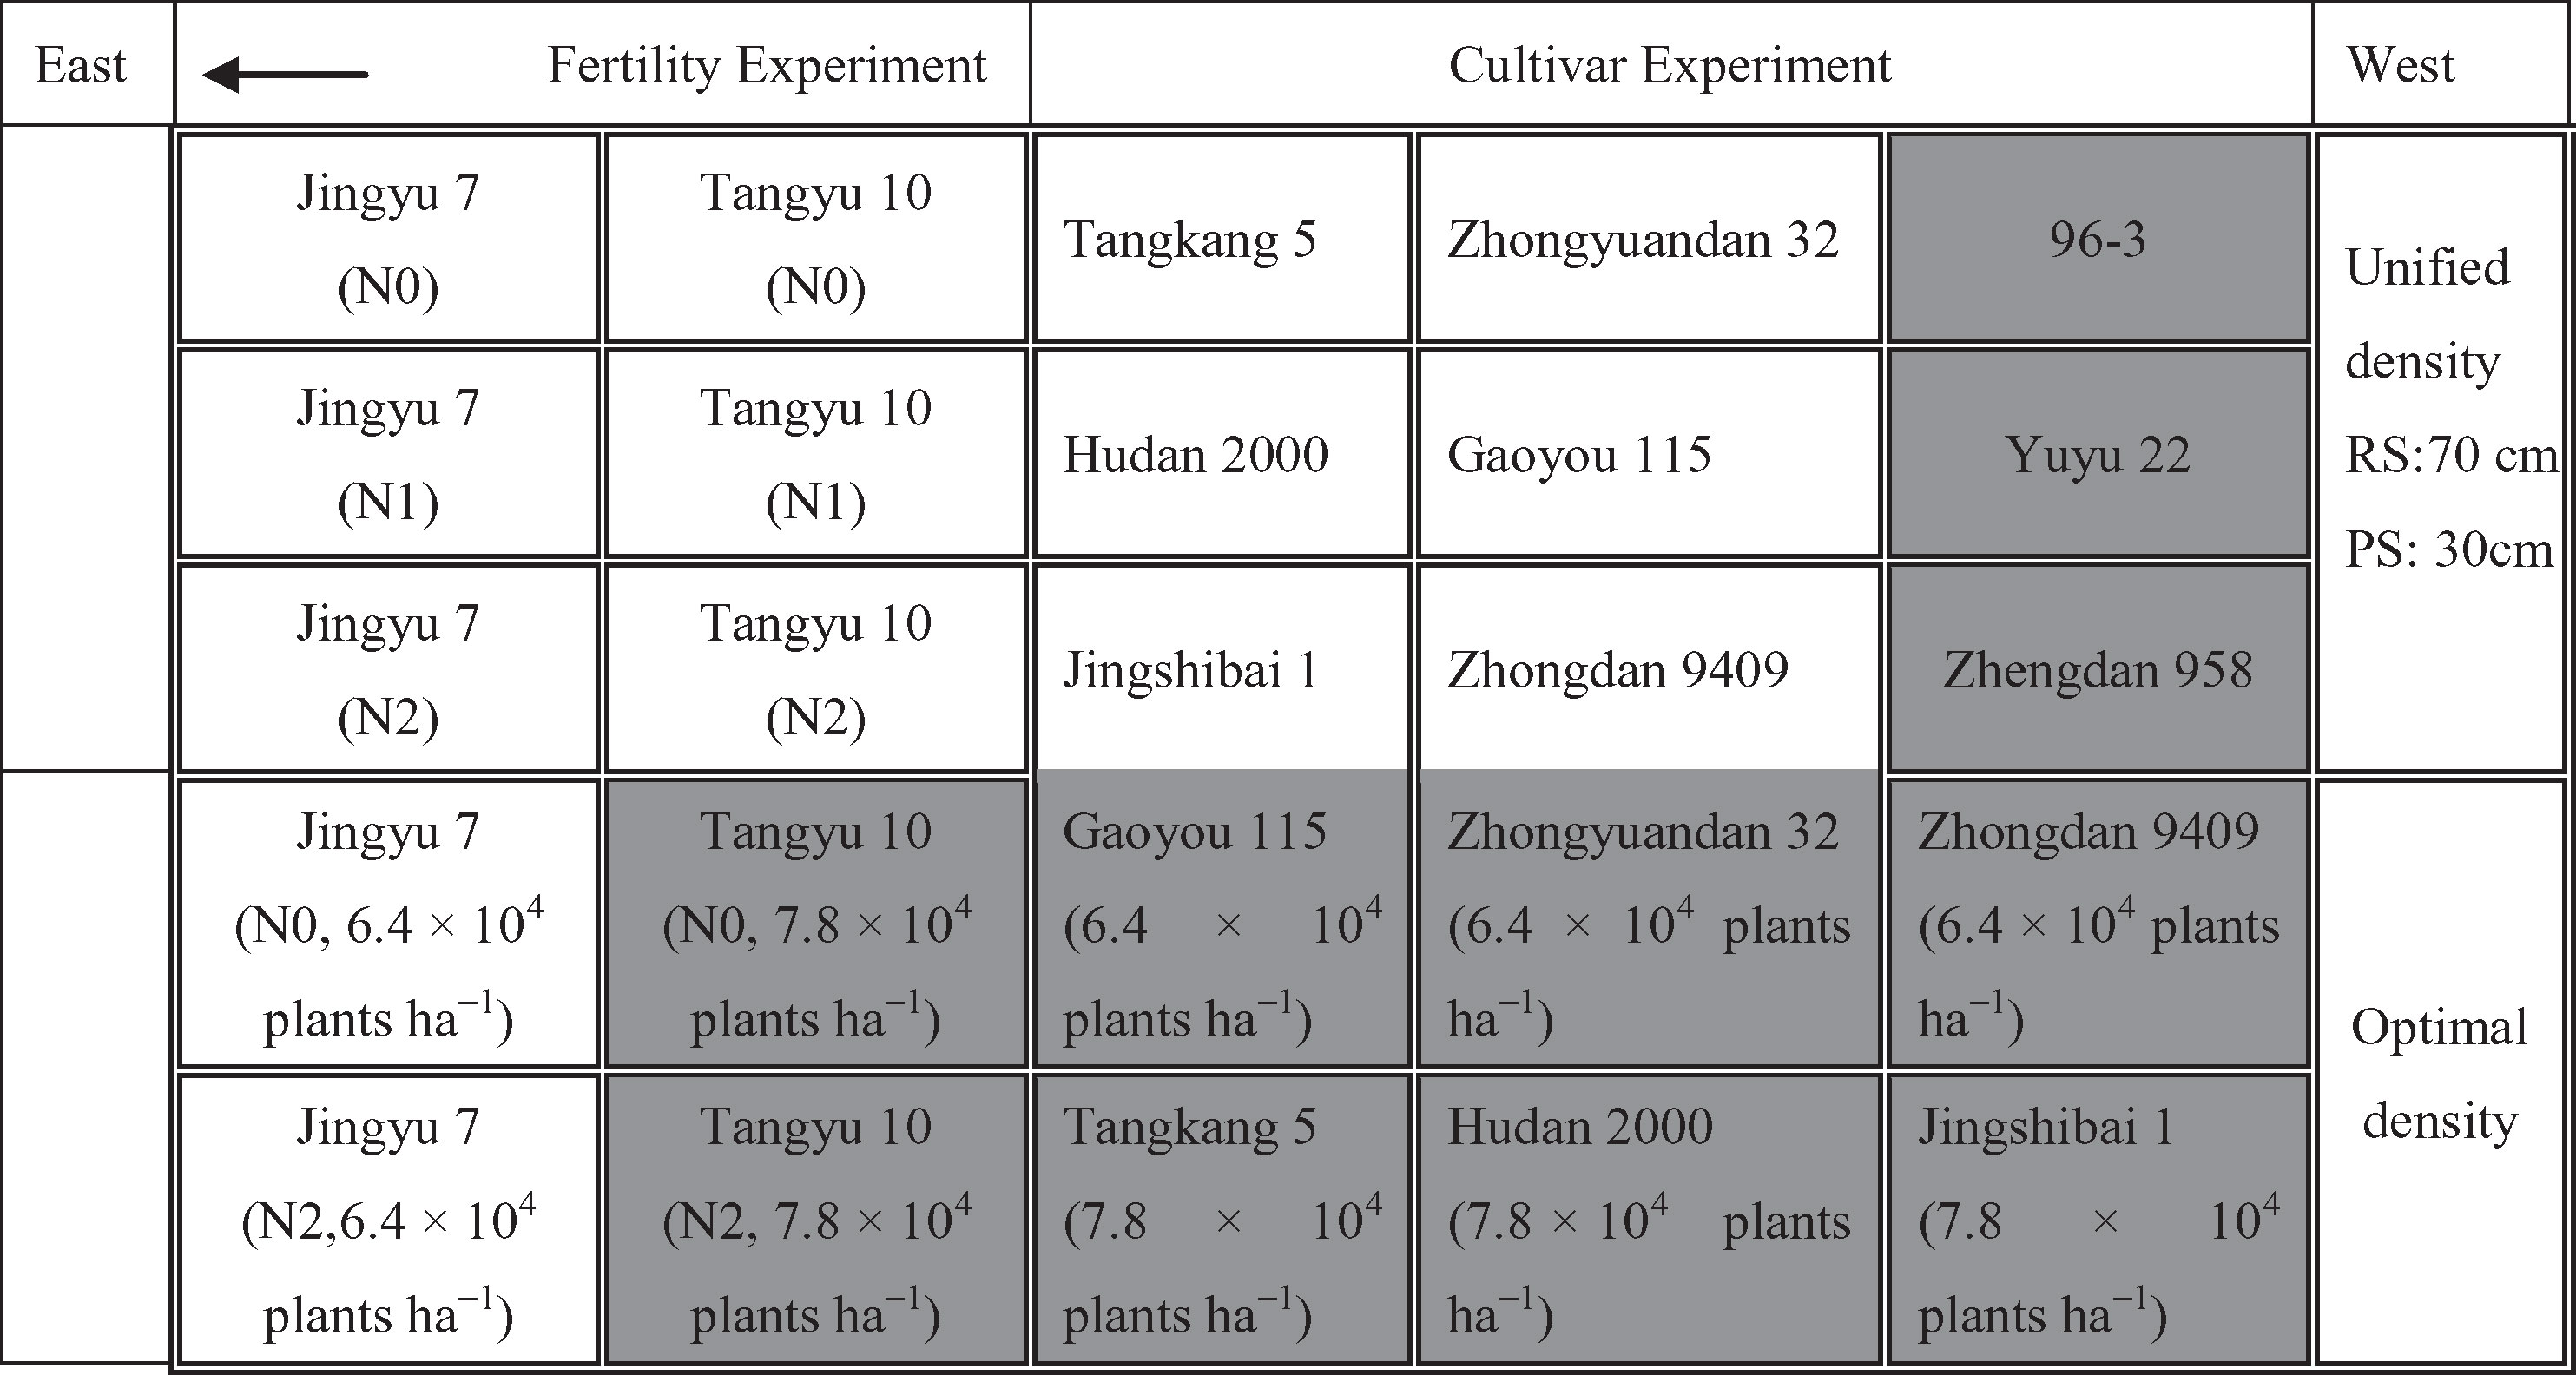
Figure 1 Field plot design in Exp.1 with different cultivars, density, and nitrogen fertilizer treatments. Eleven cultivars were selected, including four compact type cultivars, four semi-compact type cultivars, and three spread type cultivars. These were sown at a unified planting density with a row spacing of 70 cm and plant spacing of 30 cm. Two of these cultivars, i.e., Jingyu 7 and Tangyu 10, were selected to conduct a fertility experiment of the three nitrogen treatments. Moreover, 10 additional density treatment plots were also set up with a density of 7.8 × 10⁴ plants ha−1 for compact type cultivars and a density of 6.4 × 10⁴ plants ha−1 for semi-compact type cultivars. There were 25 15m x 7m plots in total. No plot had duplicated treatment with the others. N0, N1 and N2 represented N application treatments with the dose of 0, 75 and 150 kg ha−1, respectively. RS and PS denoted row spacing and plant spacing, respectively. The Chl content of the 11 shaded plots were measured only at VE and R1 growth stages.
Experiment 2 (Exp.2) was carried out on a field of 900 m2 (30 m ×30m) with silty loam soil at Luancheng experiment station located in Hebei Province, China (37°53′N, 114°41′ E). Corn was sown on 17 June 2003, in the north-south direction with 70cm row spacing and 30 cm planting spacing. Three corn cultivars (Laiyu 2, Hengfeng 6 and Jingyu 7) were sown at a density of 7.42 × 10⁴ plants ha−1 with three replicates. A total of 200kg N ha−1 was applied for all corn cultivars on 15 July 2003. Figure 2 shows the spatial distribution of all cultivars in Exp.2. All nine plots were designed with a plot size of 9 m × 9m.
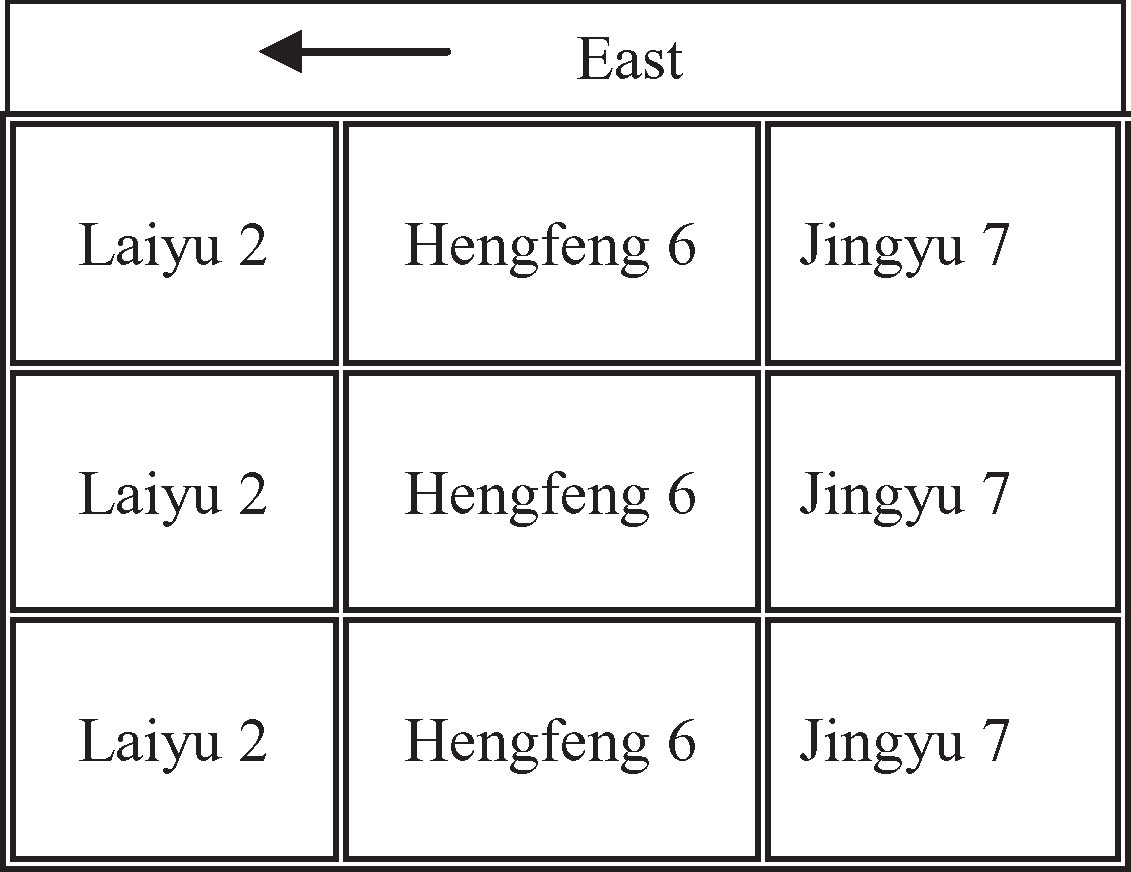
Figure 2 Field experiment design of Exp.2. Three corn cultivars (Laiyu 2, Hengfeng 6 and Jingyu 7) were sown at a density of 7.42 × 10⁴ plants ha−1 with three replicates. N was applied at 200kg N ha−1 for all corn cultivars.
Data Collection
Measurement of In situ Canopy Reflectance Spectrum
The corn canopy reflectance spectra were measured by ASD FieldSpec Pro FR™ (Analytical Spectral Devices Inc., Boulder, Colorado, USA) fitted with 25° field-of-view fiber optics under clear sky conditions between 12:00–14:00 local time at seven growth stages: VE, V6, V10, V12, VT, R1, and R3. Figure 3 exhibits the photos taken from the top of the corn canopy at different growth stages, illustrating the changes of the corn canopy with the growth stages. The fiber optics was fixed at the end of a horizontal pole carried by a tripod. This instrument recorded reflectance between 350 and 2500 nm with 3 nm and 10 nm resolution for the Ultraviolet/Visible-near infrared (UV/VNIR) (350–1000 nm) and shortwave infrared (SWIR) (1000–2500 nm) region, respectively. The hyperspectral data were re-sampled to 1 nm bandwidth using a self-driven interpolation method of the ASD spectrometer and then saved. Canopy reflectance spectral measurements were taken randomly at one site in Exp. 1 and three sites in Exp. 2 in each plot at a height of 1.6 m above plant canopy. Each spectral measurement was taken by averaging 20 scans at an optimized integration time with dark current correction. A 40 × 40 cm BaSO4 calibration panel was used to calculate reflectance at the canopy. The total numbers of canopy reflectance spectra acquired in Exp. 1 and Exp. 2 were 175 and 189, respectively.
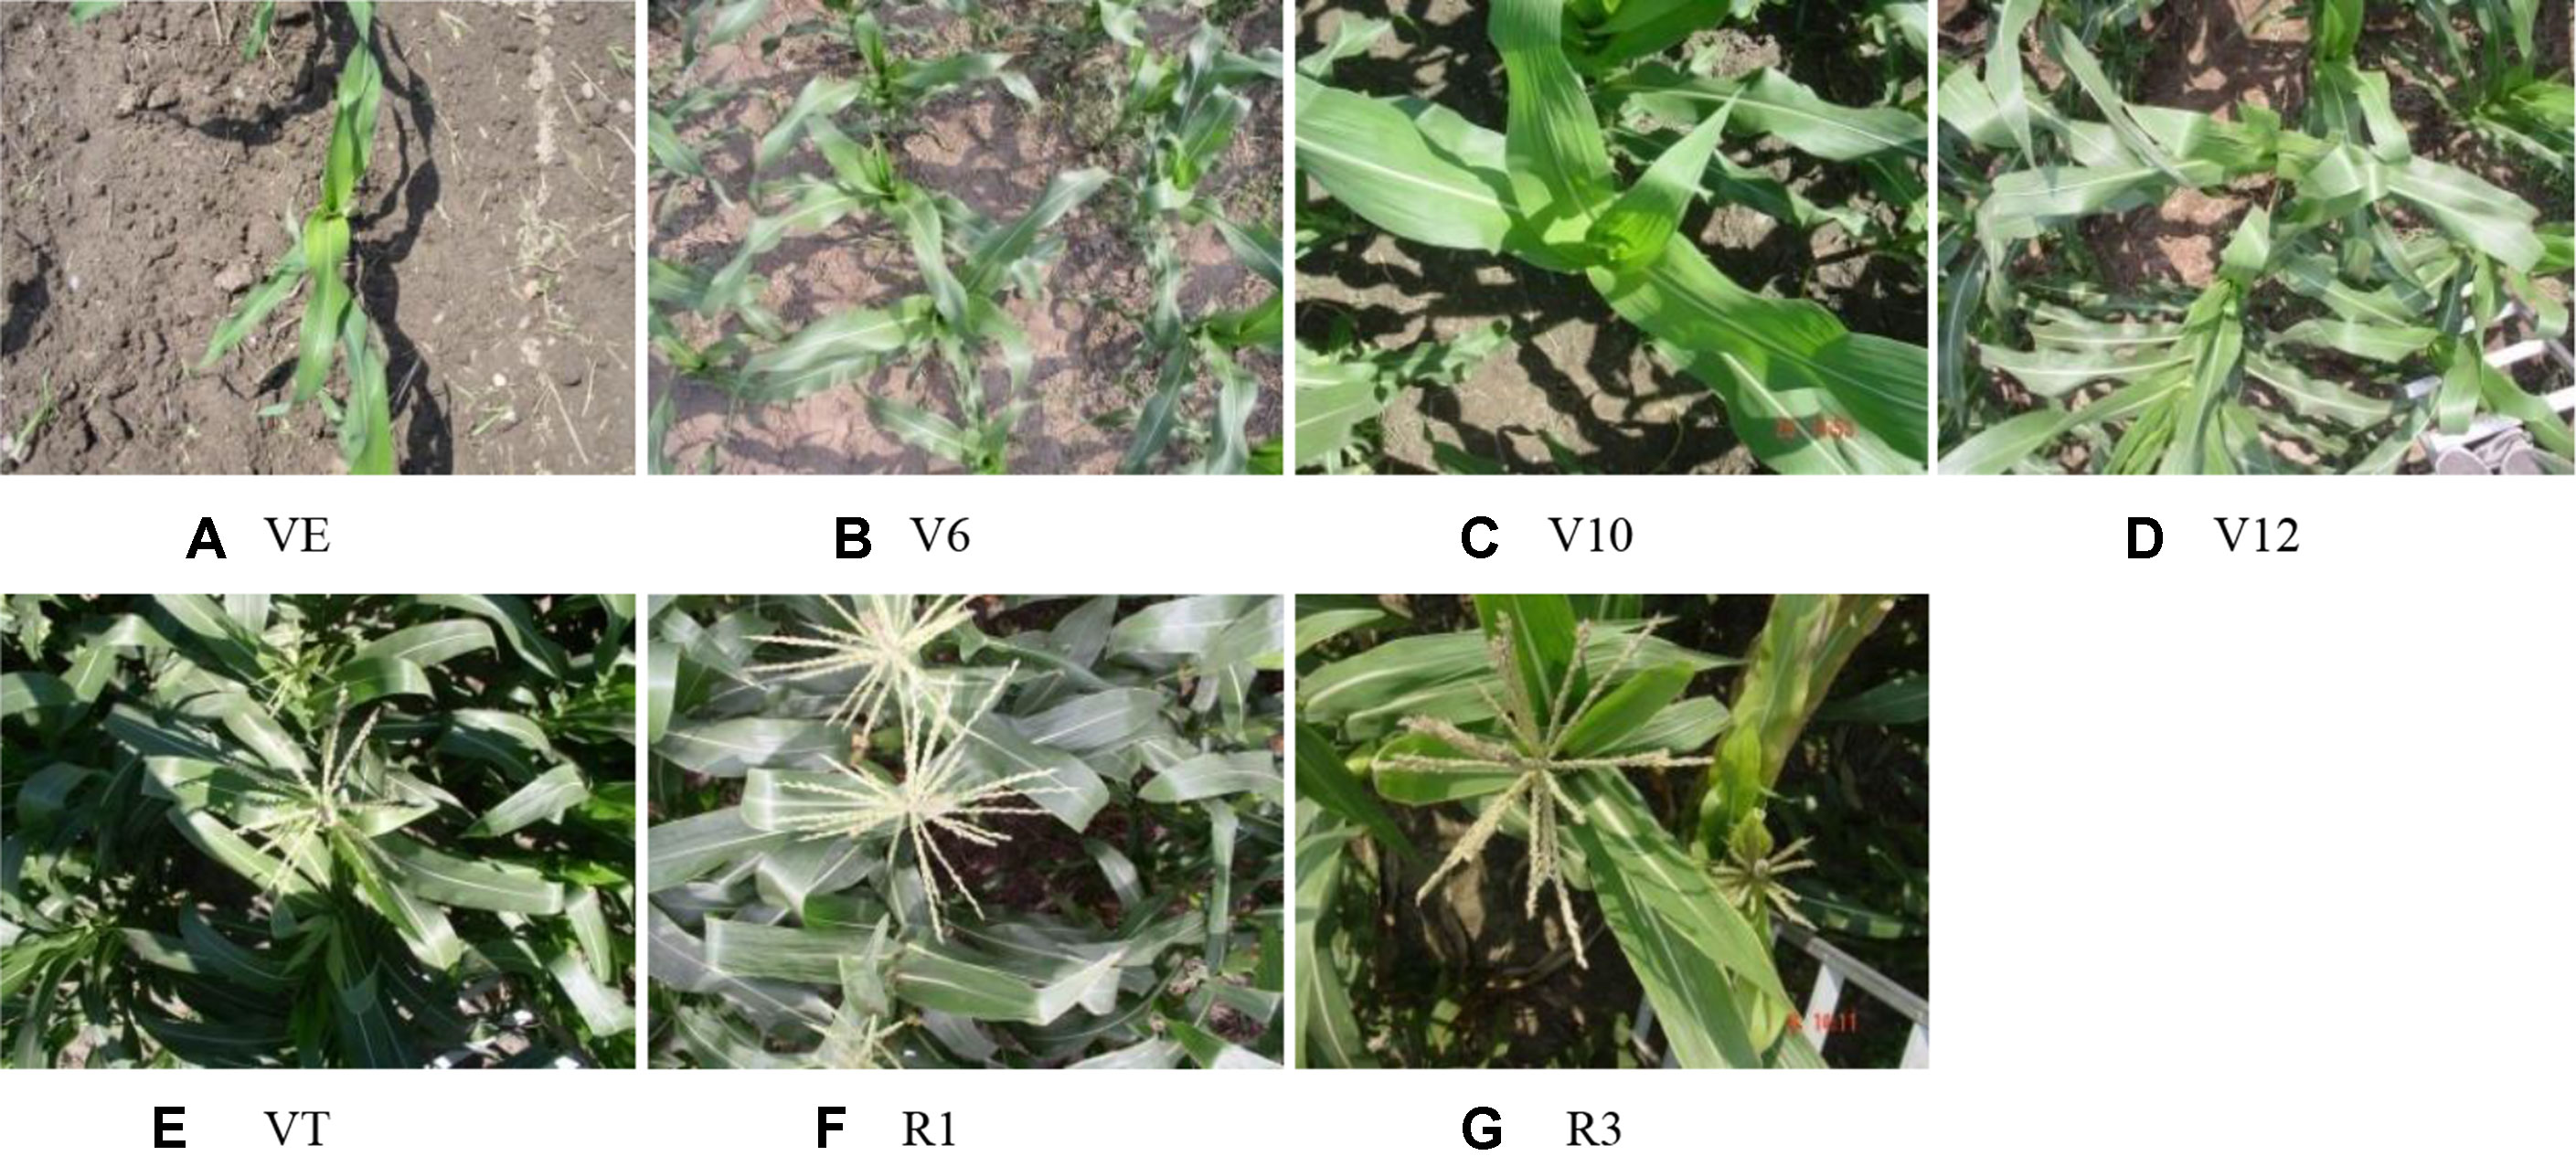
Figure 3 Photos taken from the top of corn canopy in Exp. 1 at VE (A), V6 (B), V10 (C), V12 (D), VT (E), R1 (F), and R3 (G) growth stages, illustrating the changes of the corn canopy with the growth stages.
Measurement of Canopy Chlorophyll Content
After each measurement of canopy spectral reflectance, five pieces of corn leaves from each site were chosen at random. From these leaf samples, the veins were removed and 0.2 g was cut from each sample. Chl was extracted in 90% acetone. Absorption was measured at 470, 649 and 665 nm with the spectrophotometer. The average value of three replicates was used to calculate the content (ChlF, mg/g fresh leaf mass) of leaf Chl a and Chl b using the formula described by Lichtenthaler (1987). In addition, for each sample, all green leaves were separated from stems and destructively sampled for leaf fresh weight (WF) measured using a Sartorius CPA324S electronic balance. Finally, these samples were oven-dried at 105°C for 30 min to destroy tissues and then dried at 80°C until a constant dry weight was reached (dry weight, WD) (Jing et al., 2007; Feng et al., 2017).
Leaf water content (LWC) was calculated as follows:
Leaf Chl content for dry leaf (ChlD, mg/g dry leaf mass) was estimated as follows:
The LAI was measured using a destructive sampling method. All the corn plants within an area of 100 cm × 100 cm were sampled in the laboratory using the specific leaf weight (SLW) method (Bréda, 2003).
Total canopy chlorophyll content (CCC) at each growth stage was estimated as follows:
where the unit of CCC is g/m2. LAIgreen represents the green LAI and SLW is the ratio of dry mass to leaf area (mg/cm2).
CCC data were estimated for 120 groups in Exp. 1 and 178 groups in Exp. 2 using the above method.
Data Analysis
Construction of Derivative Spectral Indices in the O2–A Absorption Band
There is a weak peak at 761 nm for the apparent reflectance (Figure 4) due to the solar-induced ChlF emission and the in-filling effects in the O2–A absorption band. Therefore, this unique feature can give rise to a significant peak for the first derivative spectra ranging from 755 nm to 763 nm (Figure 5). The ChlF in-filling in the O2–A absorption band at 760 nm was sensitive to variations of fluorescence (Pérez-Priego et al., 2005), and the Chl a+b content and LAI were highly correlated with F760 (Ni et al., 2015; Van der Tol et al., 2016). Accordingly, this study was intended to examine the feasibility of estimating crop CCC by developing two new indices, i.e., REArea760 (sum of the first derivative reflectance between 755nm and 763nm) and REA760 (maximum value of first derivative reflectance between 755 and 763 nm).
REArea760 is defined as:
REA760 is denoted as:
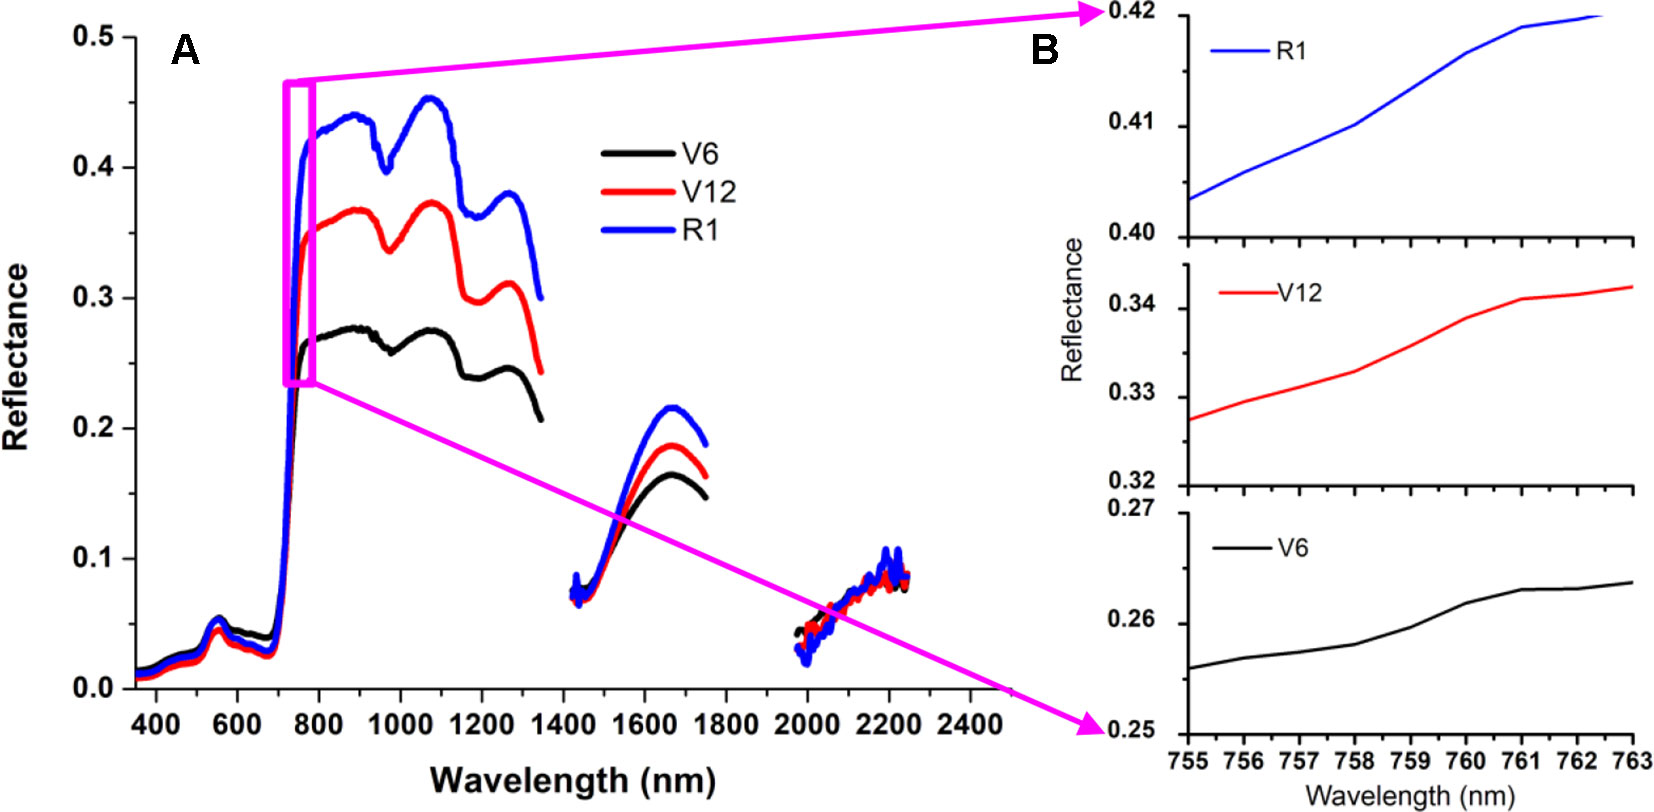
Figure 4 Three canopy reflectance spectra measured at the V6, V12 and R1 growth stages for the Jingyu 7 cultivar from Exp. 1 (A). These apparent reflectance spectra ranging from 755 nm to 763 nm were demonstrated by local enlarged (B) and characterized by a weak peak at 761 nm because of the in-filling effects in the O2–A absorption band.
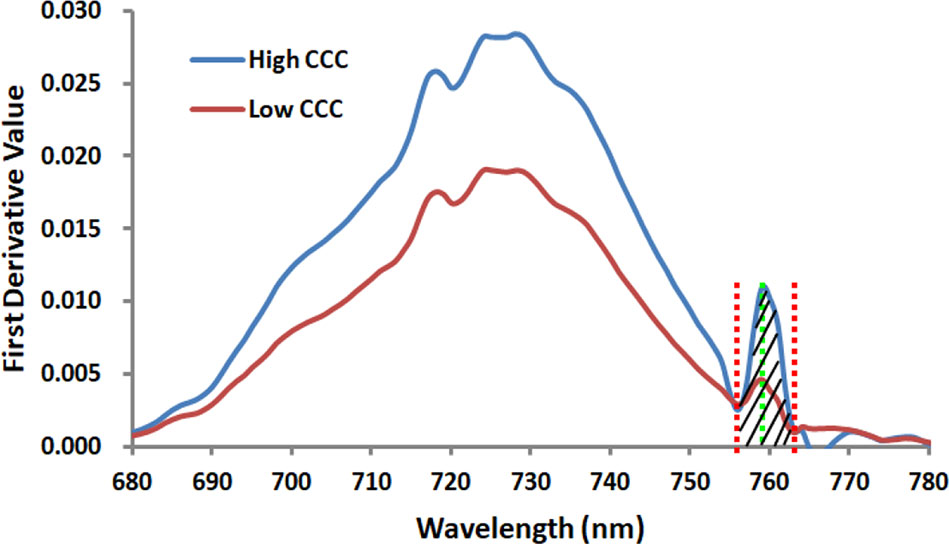
Figure 5 The curves of two proposed first derivative spectral indices REArea760 and REA760 for the Jingyu 7 cultivar measured at V6 and V10 growth stages in Exp.1. The high CCC and low CCC were 3.58 and 0.91g/m2, respectively. REArea760 is defined as the sum of the first derivative reflectance ranging from 755 nm to 763 nm, and REA760 is the maximal among the first derivative value from 755 nm to 763 nm.
Model Calibration and Validation
Correlation analyses were performed between the spectral indices related to Chl content and corn CCC using SPSS 17.0 (SPSS, Chicago, IL, USA). In total, 30 existing spectral parameters were calculated (Table 1), and linear inversion models for CCC were established based on Exp.1. The coefficient of determination (R2) was used to evaluate these models. Additionally, to investigate the robustness of the spectral indices, we employed the data from Exp.2 to validate the fitted linear inversion models based on the data from Exp.1. The predictive performance of the spectral indices was assessed by ranking the RMSE values in ascending order. The overall performance of the spectral indices was then evaluated by finding the sum of the RMSE ranks and the R2 ranks of fitted linear inversion models. Finally the spectral indices were ordered according to their summed ranks, such that the best performing spectral indices had the lowest summed rank. Root mean square error (RMSE) in the equation were utilized to measure the fitness between predicted and observed values. RMSE was calculated with the following formula:
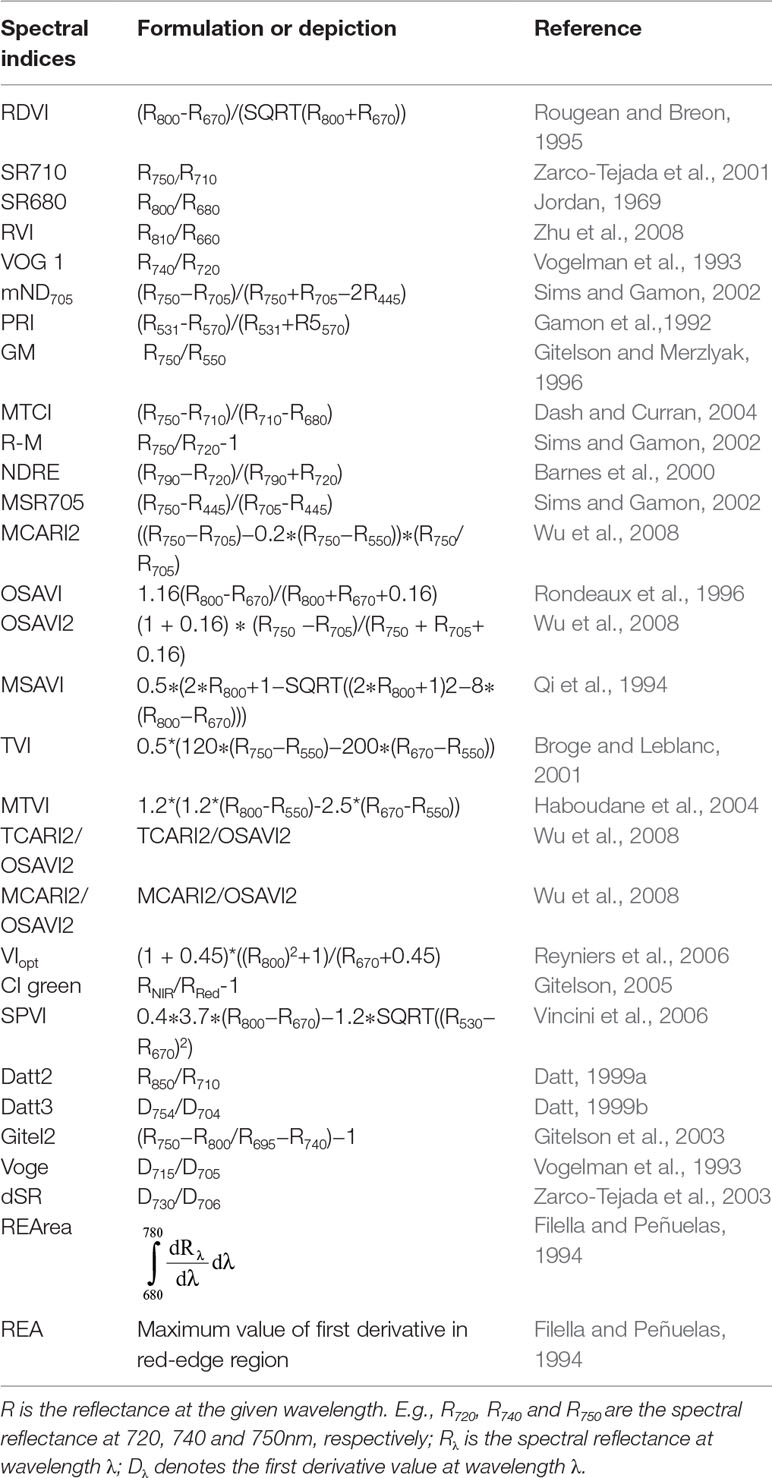
Table 1 Summary of selected chlorophyll-related spectral indices reported in the literature.
Where Pi and Oi are predicted and observed CCC values and n is the number of samples.
Results
The First Derivative Spectra in the Red-Edge Region Under Different N Treatments
First derivative spectra of corn canopy in the red-edge region changed significantly with N treatments and CCC during different growth stages. Figure 6 displays the response of first derivative spectra to N treatments in Jingyu 7 measured at different growth stages in Exp.1. The first derivative spectra of corn canopy were characterized by multiple peaks. The positions of the first peak, the second peak, and the third peak were always approximately at 718 nm, 729 nm and 759 nm, especially from the V6 to R3 (from Figures 6B–G) growth stages. Additionally, there was a clear minimum near 755 nm. It was found that the REArea and REA increased with an increasing amount of N fertilizer and CCC. However, REP was unstable due to the multiple peak phenomena. The REArea and REA showed an increasing trend from VE to R1 (from Figures 6A–E) growth stages. The REArea760 and REA760 were also highly positively correlated with CCC. The wavelength of the inflection point in the O2–A absorption band was stable near 759 nm. Moreover, the peak ranging from 755 nm to 763 nm was more blunt and the contrast between the minima near 755 nm and the peak near 759 nm reduced after VT growth stage (see Figures 6F, G).
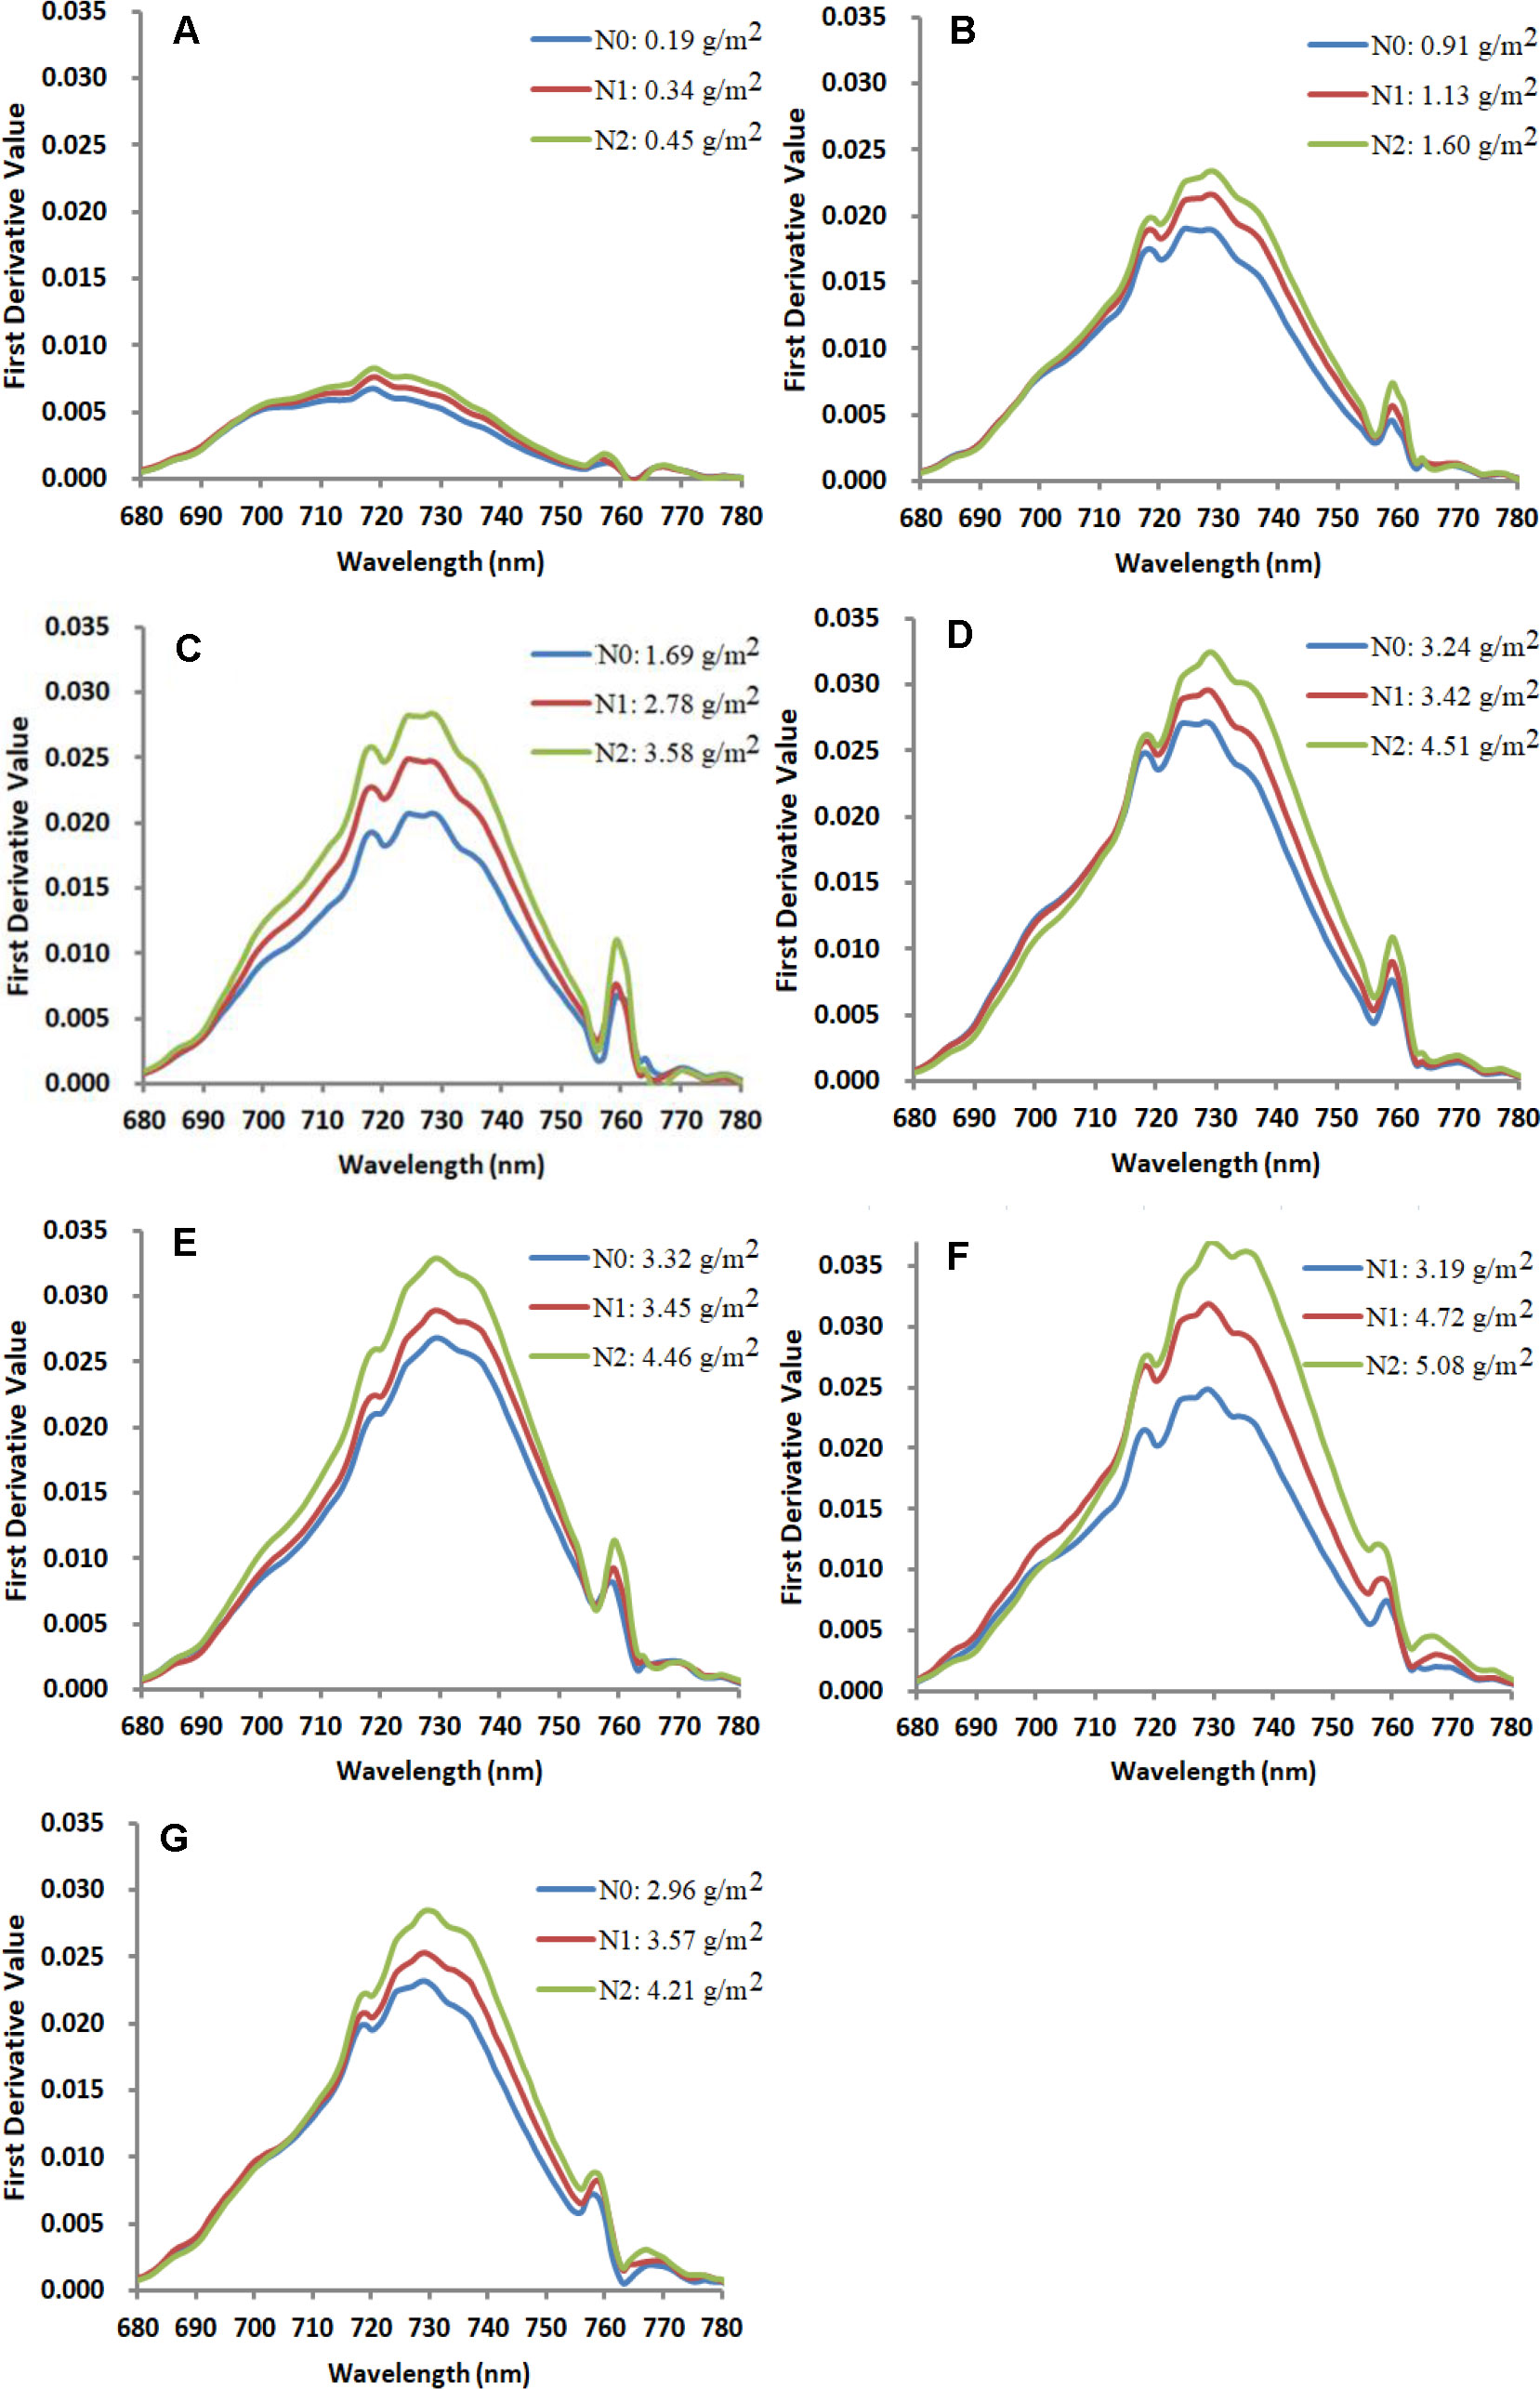
Figure 6 Response of first derivative spectra to nitrogen treatment at VE (A), V6 (B), V10 (C), V12 (D), VT (E), R1 (F), and R3 (G) growth stages in the Jingyu 7 cultivar in Exp.1. Note: each line stands for a single measurement. N0, N1, and N2 represent N application treatments of 0, 75 and 150 kg ha−1, respectively.
Relationships Between CCC and Chlorophyll-Related Spectral Indices
Table 2 shows that the linear relationships between CCC and 30 Chlorophyll-related spectral indices selected from literature and the two new spectral indices proposed in this study based on the observed data from Exp.1. Overall, the red-edge-related spectral indices were significantly correlated with CCC. R2 values ranged from 0.697 to 0.835, suggesting that spectral information in the red edge region was useful for assessing crop Chl status. As shown in Table 2, SR710,VOG1,GM, R-M, NDRE, and Datt2, as well as REArea760 and REA760, were proved to be superior parameters, with high R2 values above 0.80. In addition, compared with other commonly used red-edge-related spectral indices, the two novel red-edge parameters, especially REArea760, yielded relatively high R2 values for CCC. REArea760 performed better in estimating CCC than the traditional red edge parameters, such as REArea and REA, for which R2 values were 0.697 and 0.721. Figure 7 displays the scatterplots between CCC and the spectral indices, REArea760, REA760, Datt2, VOG 1, REArea, and REA. Among them REArea760 had the highest R2 value of 0.835.
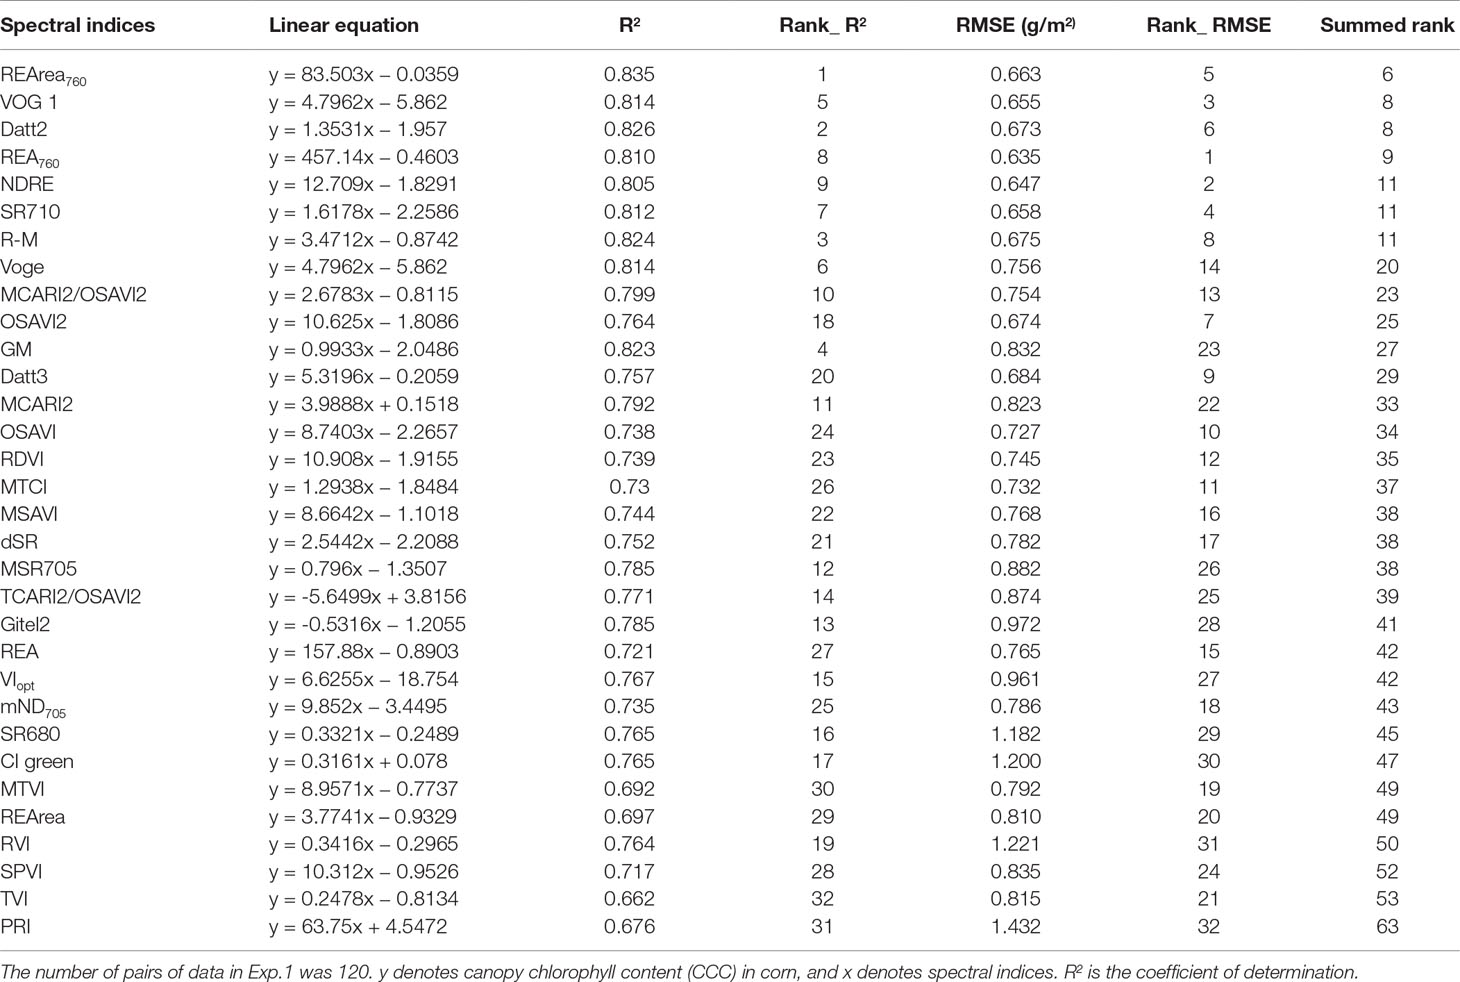
Table 2 Linear relationship between corn canopy chlorophyll content (CCC) and common red-edge spectral parameters using data from Exp.1. The ranking results of the performance (assessed using RMSE) of the 32 spectral indices to predict CCC using validation data from Exp.2. The spectral indices are ordered in ascending order according to their summed ranks.
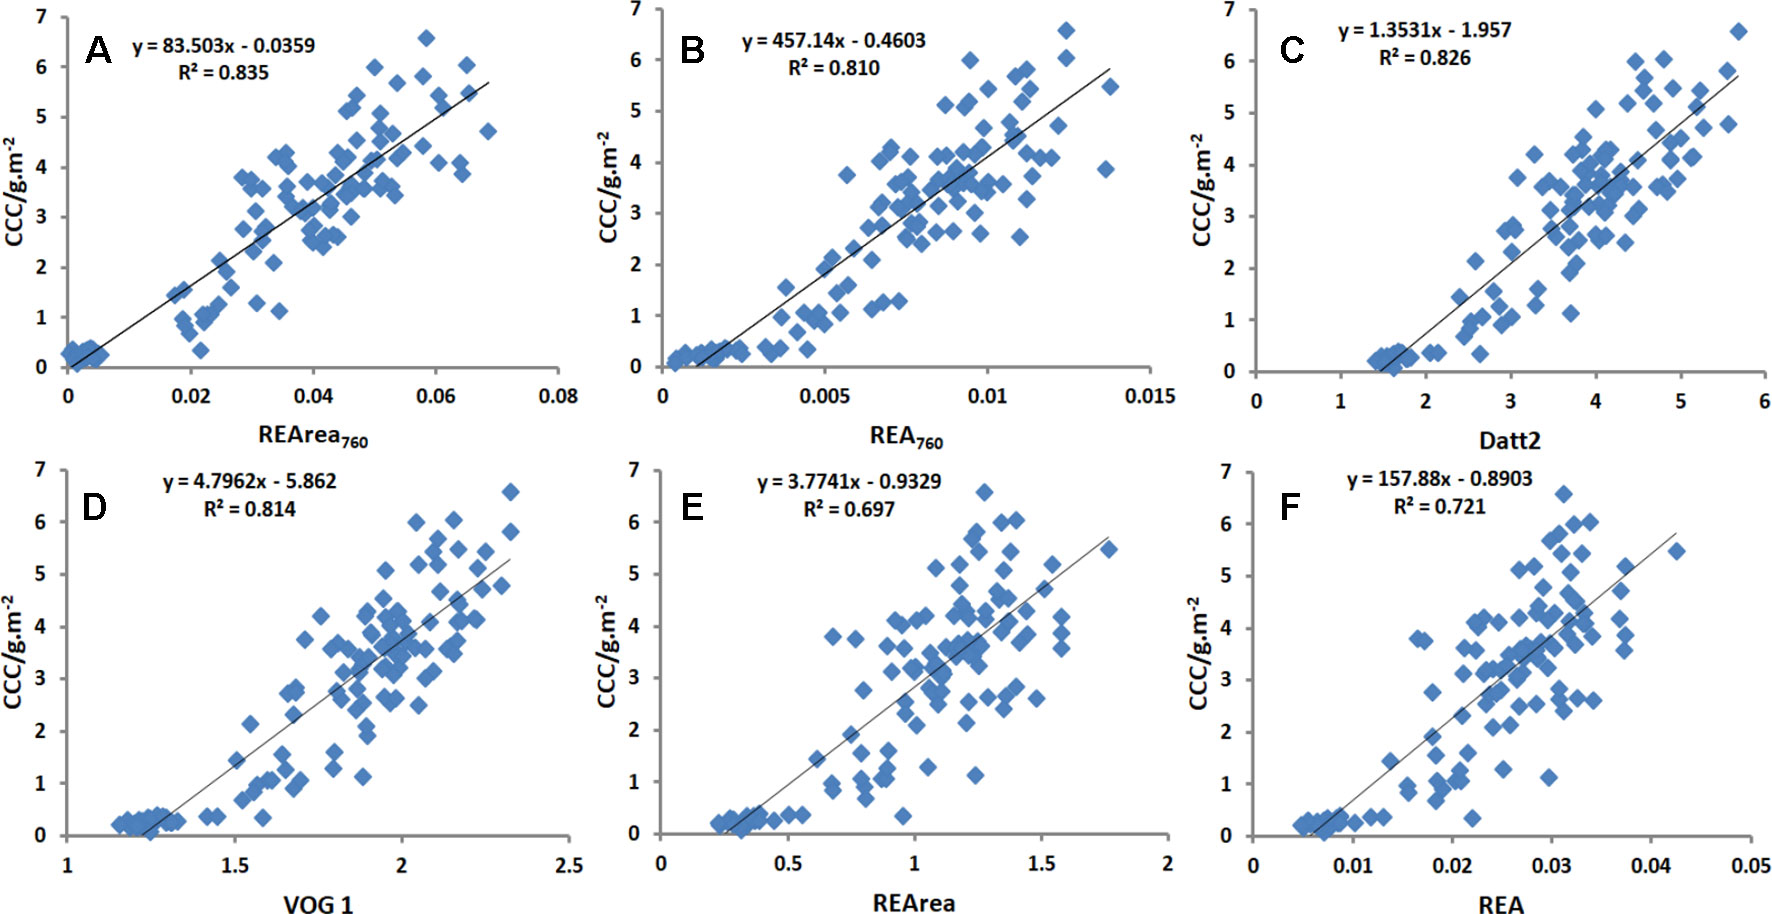
Figure 7 Linear relationship between CCC and spectral index [REArea 760, REA 760, Datt2, VOG 1, REArea and REA] for all cultivars in Exp.1. Among them REArea760 had the highest R2 value of 0.835 and REArea had the lowest R2 value of 0.697. REArea760 and REA760 were proved to be superior parameters, with high R2 values above 0.80.
Test of CCC Relationship to Chlorophyll-Related Spectral Indices
The relationships between CCC and the spectral indices described above were tested using data from Exp.2. RMSE was employed to measure the reliability and accuracy between estimated and observed values. As shown in Table 2, the estimation accuracy for REA760 has the lowest RMSE of 0.635 g/m2, and PRI has the highest RMSE value of 1.432 g/m2. Figure 8 compares the observed and predicted CCC values generated from six spectral indices, including REArea760, REA760, Datt2, VOG 1, REArea, and REA. Their RMSEs were 0.663, 0.635, 0.673, 0.655, 0.810, and 0.765 g/m2, respectively. The model of REArea overestimated the CCC of corn when the CCC was low, e.g., less than 3 g/m2, and underestimated the CCC for high Chl content of canopy. The scatterplots of REArea (Figure 8E) and REA (Figure 8F) show more dispersion than those of REArea760 (Figure 8A), REA760 (Figure 8B), Datt2 (Figure 8C), and VOG 1 (Figure 8D), especially for high CCC. Their summed ranks were 6, 9, 8, 8, 49, and 42. Additionally, in Table 2, the indices were also sorted in ascending order according to their summed ranks by integrating the ranks of RMSE and R2 of CCC linear equation models. REArea760, Datt2, VOG 1, and REA760 ranked in the top four and the summed ranks were 6, 8, 8, and 9.
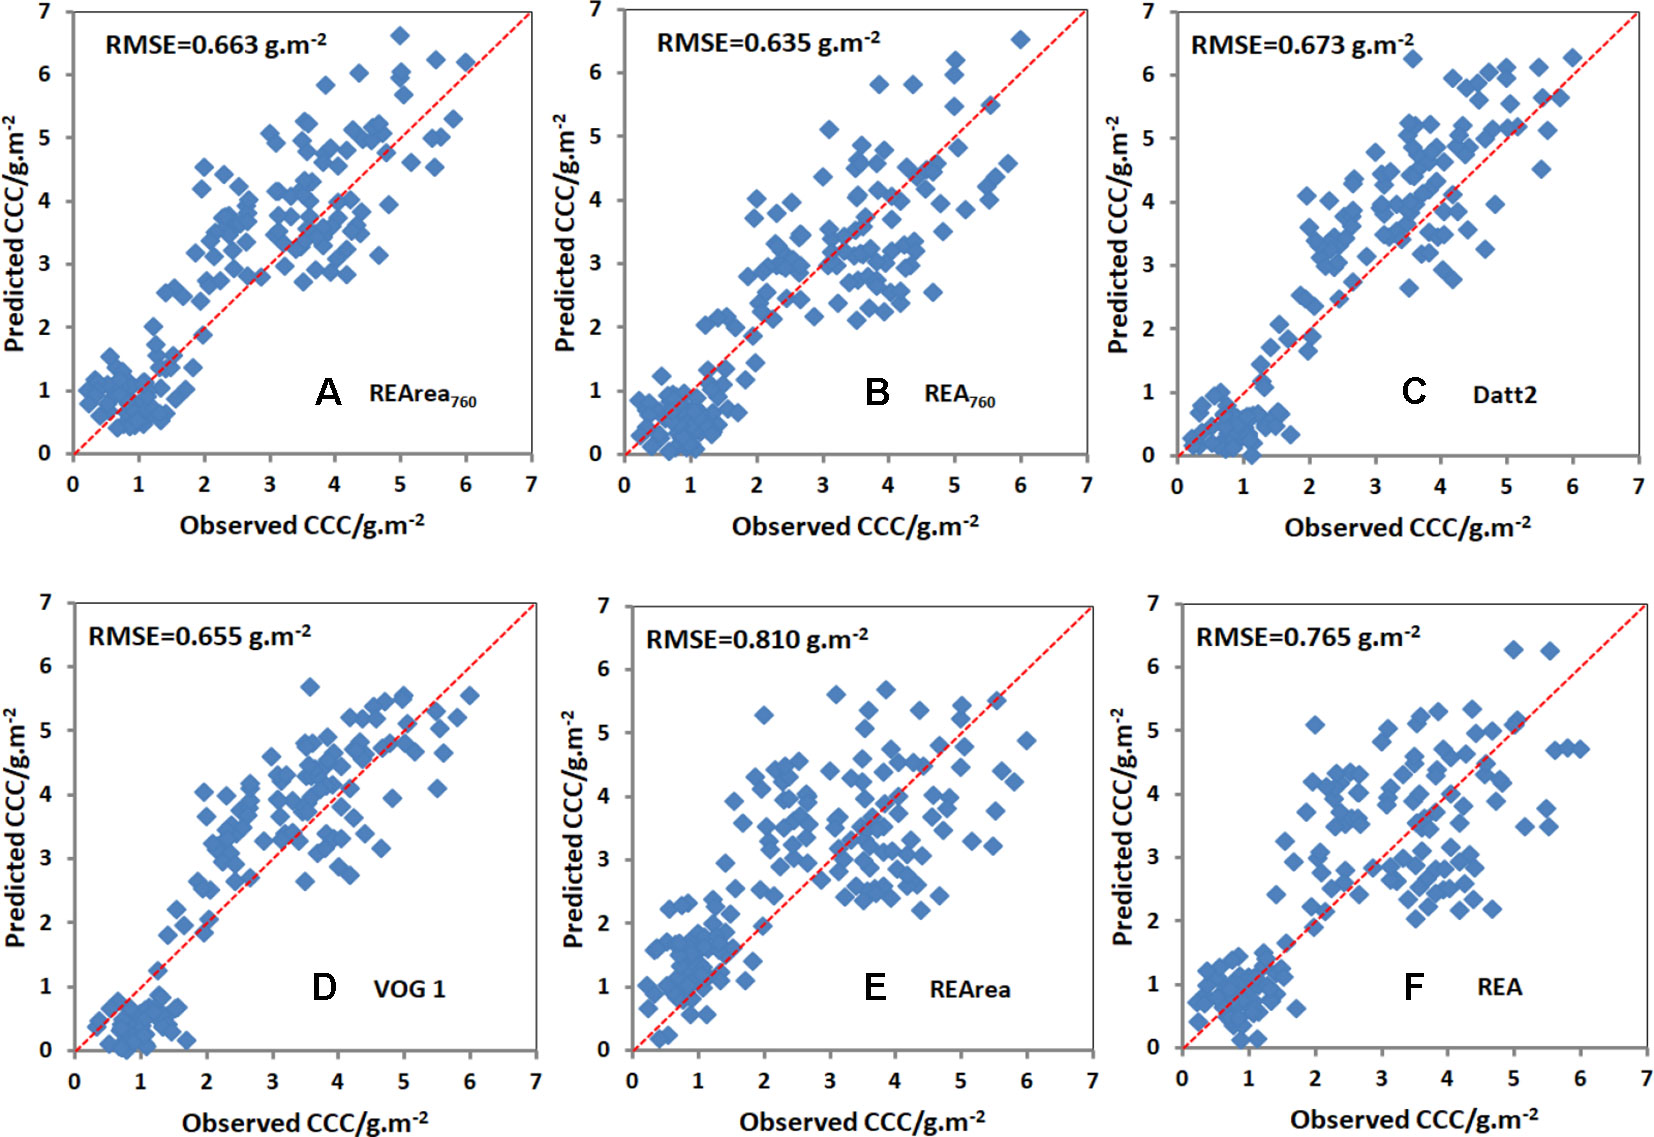
Figure 8 Comparison between the observed and predicted CCC based on REArea760 (A), REA760 (B), Datt2 (C), VOG 1 (D), REArea (E) and REA (F) for all cultivars in Exp.2. Note: The number of sample points used for validation was 178.
Discussion
Similar to other crops, such as rice, cotton, soybean, and grass, the first derivative spectra of corn canopy were characterized by multiple peaks (see Figure 6) (Tang et al., 2004; Li et al., 2016). Previous research has shown that the derivative reflectance around the peaks was sensitive to plant Chl status, leaf area index, and canopy biomass (Yang et al., 2010). However, though the derivative method can minimize the influences of various linear signals, such as atmosphere and soil background, double-peak features of the vegetation derivative spectra weaken the usefulness of red edge parameters, such as REP in monitoring Chl content (Ju et al., 2010; Li et al., 2017). As showed in Figure 4, numerous previous studies provided additional evidence for the ChlF in-filling in O2−A band effects on apparent reflectance (Liu et al., 2005; Pérez-Priego et al., 2005; Ni et al., 2015). The changes of derivative values around 760 nm were not caused by the noise from strong water and oxygen absorption but indicated the changes on Chl content as well as ChlF (Ni et al., 2015) and biomass (Van der Tol et al., 2016).
Compared to the vegetative stages, the peak of first derivative spectrum in the O2−A band was not obvious during the reproductive stages (i.e., after R1 growth stage), and the contrast between the minima and peak of first derivative spectrum has gradually reduced. The possible reason is that nutrients (mainly nitrogen) were transfered from vegetative organs (e.g. shoots and leaves) to the reproductive organs (e.g. grain) (Salon et al., 2001), which led to the decreasing in leaf Chl content. Moreover, the tassel above the corn canopy also evidently contributed to the canopy reflectance spectrum after the reproductive stages.
As shown in this study, though the ChlF re-emitted by Chl molecules is very weak, F760 can represent the information on leaf Chl content, LAI, and biomass. Many previous studies also found that F760 was strongly correlated to LAI and biomass (Bånkestad and Wik, 2016; Van der Tol et al., 2016) and generally increased with increasing chlorophyll content (Buschmann, 2007). The fluorescent in-filling effects on reflectance results in the peak of the first derivative spectra in the O2−A band, and two indices—REArea760 and REA760—were proposed to estimate CCC of corn canopy in this study.
The summed ranks of REArea and REA were far higher than those of REArea760 and REA760 (Table 2). The possible reason is that double-peak feature has little effect on the derivative spectral characteristics in the O2−A band. Moreover, the performance of REArea760 and REA760 was also better than most of the reflectance-based indices selected from previous studies. ChlF originates only from chlorophyll in the photosynthetic apparatus and materials such as soil, wood, and dead biomass also absorb PAR but do not contribute to photosynthesis. ChlF therefore is less sensitive to soil, wood, and dead biomass interference (Daughtry et al., 2000; Porcar-Castell et al., 2014; Bånkestad and Wik, 2016). Therefore, it can improve the accuracy of CCC estimation.
A simplified formulation has also been used to express steady state ChlF (Joiner et al., 2014), i.e.,
where SIF is solar-induced ChlF, λ is the excitation wavelength, PAR is the incident photosynthetically active radiation, fPAR is the fraction of photosynthetically active radiation, ΘF is the fluorescence efficiency and e is the fractional amount of fluorescence that escapes the canopy. However, SIF is emitted by the canopy colony (Liu and Chen, 2011), and many factors would impact it, such as PAR, fPAR, ΘF and e (Equation 7) The diurnal variation trend in the SIF is similar to that of PAR (Liu et al., 2015, Liu et al., 2017). REArea760 and REA760 were derived from the reflectance spectrum and therefore the influence of PAR on the two indices can be largely reduced. fPAR and e were determined by canopy structure and vegetation biochemistry (Joiner et al., 2014). In other words, the two parameters contain the information about canopy structure and vegetation biochemistry. The red- but not far-red fluorescence was readily reabsorbed (Bånkestad and Wik, 2016). Therefore, the reabsorption of far-red SIF, e.g. F760, caused by complex canopy structure or increasing leaf chlorophyll content was much smaller than for the red bands and is usually neglected (Van Wittenberghe et al., 2015). The e parameter is considered to be less important in crop and grass canopies (Damm et al., 2015; Liu et al., 2017).
The fluorescence yield of PSI is generally low and invariant to illumination change (Franck et al., 2002; Porcar-Castell et al., 2014). The contribution from PSI fluorescence has a higher relative contribution at longer wavelengths since PSI fluorescence peaks at longer wavelengths than PSII fluorescence. However, the fluorescence yield of PSI is typically much smaller than that of PSII. Therefore, fluorescence at 760 nm is still dominated by variable fluorescence from PSII (Porcar-Castell et al., 2014). The number of PSII reaction centers is known to increase with irradiance (Anderson et al., 1988). Thus, the fluorescence yield at 760 nm is influenced by light intensity. The spectral data in the paper were measured from the same species on sunny days in summer, which probably caused the relatively stable fluorescence yield due to little changes in the measurement conditions, e.g. light intensity. This may be one of the important reasons that the fluorescence-based indices proposed in this study function fairly well.
In addition, the method developed in the paper has been tested with only one species and by using point measurements. In order to improve reliability and robustness of the method, more species and approaches to data acquisition, e.g. imaging measurement, should be taken into account in future research.
Conclusions
Timely assessment of CCC in crops is critical for diagnosing the growth stage, maximizing yield, and minimizing adverse environmental impacts. In this study, combining ChlF signals in the O2–A absorption band, an in situ hyperspectral remote sensor was used to estimate corn Chl content at the canopy level. Two new spectral indices, REArea760 and REA760, were proposed because the double-peak feature of vegetation derivative spectra weakens the usefulness of red edge parameters in monitoring CCC. REArea760 and REA760 models were compared with existing red edge indices as well as REArea and REA and proved stable and powerful enough for monitoring CCC. The novel parameters for CCC estimation were proved to be accurate for corn under different environmental conditions and across many typical growing seasons. Even so, further validation is needed to test the stability and the robustness of the two indices by considering canopy phenological stages and transfer ability of the spectral indices in estimating CCC for other crops.
Data Availability
All datasets for this study are included in the manuscript and the supplementary files.
Author Contributions
XZ and GW conceived and designed the research. CT, CW, FX, YH, and XL analyzed the data. XZ and DC wrote the manuscript. CT, GW, and LS assisted manuscript writing and editing.
Funding
The data of the paper were from the spectral database system of typical objects in China. This work was supported by the National Natural Science Foundation of China (41871239 and 61601229), China Postdoctoral Science Foundation (2017M610338 and 2019M650125), the Open Fund of Key Laboratory of Meteorology, Ecological Environment of Hebei Province (Z201607Y), National Key Research and Development Program of China (2018YFD0300805), Priority Academic Program Development of Jiangsu Higher Education Institutions (PAPD), Hebei Innovation Capability Promotion Project(18964201H), and the Natural Science Foundation of Jiangsu Province (BK20160966).
Conflict of Interest Statement
The authors declare that the research was conducted in the absence of any commercial or financial relationships that could be construed as a potential conflict of interest.
Acknowledgments
We thank the reviewers and editor for their valuable comments in improving the quality of the manuscript.
References
Ač, A., Malenovský, Z., Olejníčková, J., Gallé, A., Rascher, U., Mohammed, G. (2015). Meta-analysis assessing potential of steady-state chlorophyll fluorescence for remote sensing detection of plant water, temperature and nitrogen stress. Remote Sens. Environ. 168, 420–436. doi: 10.1016/j.rse.2015.07.022
Anderson, J. M., Chow, W. S., Goodchild, D. J. (1988). Thylakoid membrane organisation in sun/shade acclimation. Aust. J. Plant Physiol. 15, 11–26. doi: 10.1071/PP9880011
Baker, N. R. (2008). Chlorophyll fluorescence: a probe of photosynthesis in vivo. Annu. Rev. Plant Biol. 59, 89–113. doi: 10.1146/annurev.arplant.59.032607.092759
Bånkestad, D., Wik, T. (2016). Growth tracking of basil by proximal remote sensing of chlorophyll fluorescence in growth chamber and greenhouse environments. Comput. Electron. Agric. 128, 77–86. doi: 10.1016/j.compag.2016.08.004
Barnes, E. M., Clarke, T. R., Richards, S. E. (2000). Coincident detection of crop water stress, nitrogen status and canopy density using ground based multispectral data. In: Proceedings of the Fifth International Conference on Precision Agriculture, Bloomington, MN, USA, 1–16.
Boochs, F., Kupfer, G., Dockter, K., Kuhbauch, W. (1990). Shape of the red edge as vitality indicator for plants. Int. J. Remote Sens. 11, 1741–1753. doi: 10.1080/01431169008955127
Bréda, N. J. (2003). Ground-based measurements of leaf area index: a review of methods, instruments and current controversies. J. Exp. Bot. 54, 2403–2417. doi: 10.1093/jxb/erg263
Broge, N. H., Leblanc, E. (2001). Comparing prediction power and stability of broadbandand hyperspectral vegetation indices for estimation of green leaf area index and canopy chlorophyll density. Remote Sens. Environ. 76, 156–172. doi: 10.1016/S0034-4257(00)00197-8
Buschmann, C. (2007). Variability and application of the chlorophyll fluorescence emission ratio red/far-red of leaves. Photosynth. Res. 92, 261–271. doi: 10.1007/s11120-007-9187-8
Campbell, P. K. E., Middleton, E. M., Corp, L. A., McMutey, J. E., Kim, M. S., Chappelle, E. W., et al. (2002). Contribution of chlorophyll fluorescence to the reflectance of corn foliage. Proc. IGARSS, 1–4. doi: 10.1109/IGARSS.2002.1026771
Carter, G. A. (1998). Reflectance wavebands and indices for remote estimation of photosynthesis and stomatal conductance in pine canopies. Remote Sens. Environ. 63 (1), 61–72. doi: 10.1016/S0034-4257(97)00110-7
Clevers, J. G. P. W., Kooistra, L. (2012). Using hyperspectral remote sensing data for retrieving canopy chlorophyll and nitrogen content. IEEE J-STARS. 5, 574–583. doi: 10.1109/JSTARS.2011.2176468
Croft, H., Chen, J. M., Zhang, Y. (2014). Temporal disparity in leaf chlorophyll content and leaf area index across a growing season in a temperate deciduous forest. Int. J. Appl. Earth Obs. Geoinf. 33, 312–320. doi: 10.1016/j.jag.2014.06.005
Curran, P. J., Dungan, J. L., Gholz, H. L. (1990). Exploring the relationship between reflectance red edge and chlorophyll content in slash pine. Tree Physiol. 7, 33–38. doi: 10.1093/treephys/7.1-2-3-4.33
Damm, A., Guanter, L., Paul-Limoges, E., van der Tol, C., Hueni, A., Buchmann, N., et al. (2015). Far-red sun-induced chlorophyll fluorescence shows ecosystem-specific relationships to gross primary production: an assessment based on observational and modeling approaches. Remote Sens. Environ. 166, 91–105. doi: 10.1016/j.rse.2015.06.004
Dash, J., Curran, P. J. (2004). The MERIS terrestrial chlorophyll index. Int. J. Remote Sens. 25, 5403–5413. doi: 10.1080/0143116042000274015
Datt, B. (1998). Remote sensing of chlorophyll a, chlorophyll b, chlorophyll a + b and total carotenoid content in Eucalyptus leaves. Remote Sens. Environ. 66 (2), 111–121. doi: 10.1016/S0034-4257(98)00046-7
Datt, B. (1999a). A new reflectance index for remote sensing of chlorophyll content in higher plants: tests using eucalyptus leaves. J. Plant Physiol. 154, 30–36. doi: 10.1016/S0176-1617(99)80314-9
Datt, B. (1999b). Visible/near infrared reflectance and chlorophyll content in eucalyptus leaves. Int. J. Remote Sens. 20, 2741–2759. doi: 10.1080/014311699211778
Daughtry, C. S. T., Walthall, C. L., Kim, M. S., de Colstoun, E. B., McMurtrey, J. E. (2000). Estimating corn leaf chlorophyll concentration from leaf and canopy reflectance. Remote Sens. Environ. 74, 229–239. doi: 10.1016/S0034-4257(00)00113-9
Du, H., Fuh, R. C. A., Li, J., Corkan, L. A., Lindsey, J. S. (1998). PhotochemCAD: a computer-aided design and research tool in photochemistry. Photochem. Photobiol. 68, 141–142. doi: 10.1111/j.1751-1097.1998.tb02480.x
Feng, W., Qi, S., Heng, Y., Zhou, Y., Wu, Y., Liu, W., et al. (2017). Canopy vegetation indices from in situ hyperspectral data to assess plant water status of winter wheat under powdery mildew stress. Front. Plant Sci. 8, 1219. doi: 10.3389/fpls.2017.01219
Filella, I., Peñuelas, J. (1994). The red-edge position and shape as indicators of plant chlorophyll content, biomass and hydric status. Int. J. Remote Sens. 15, 1459–1470. doi: 10.1080/01431169408954177
Franck, F., Juneau, P., Popovic, R. (2002). Resolution of the photosystem I and photosystem II contributions to chlorophyll fluorescence of intact leaves at room temperature. Biochim. Biophys. Acta 1556, 239–246. doi: 10.1016/S0005-2728(02)00366-3
Gamon, J. A., Peñuelas, J., Field, C. B. (1992). A narrow-waveband spectral index that tracks diurnal changes in photosynthetic efficiency. Remote Sens. Environ. 41, 35–44. doi: 10.1016/0034-4257(92)90059-S
Gamon, J. A., Surfus, J. S. (1999). Assessing leaf pigment content and activity with a reflectancer. New Phytol. 143, 105–117. doi: 10.1046/j.1469-8137.1999.00424.x
Gitelson, A. A., Merzlyak, M. N. (1996). Signature analysis of leaf reflectance spectra: algorithm development for remote sensing of chlorophyll. J. Plant. Physiol. 148, 494–500. doi: 10.1016/S0176-1617(96)80284-7
Gitelson, A. A. (2005). Remote estimation of canopy chlorophyll content in crops. Geophys. Res. Lett. 32, L08403. doi: 10.1029/2005GL022688
Gitelson, A. A., Gritz, Y., Merzlyak, M. N. (2003). Relationships between leaf chlorophyll content and spectral reflectance and algorithms for non-destructive chlorophyll assessment in higher plant leaves. J. Plant Physiol. 160, 271–282. doi: 10.1078/0176-1617-00887
Gitelson, A. A., Peng, Y., Arkebauer, T. J., Schepers, J. (2014). Relationships between gross primary production, green LAI, and canopy chlorophyll content in maize: implications for remote sensing of primary production. Remote Sens. Environ. 144, 65–72. doi: 10.1016/j.rse.2014.01.004
Gitelson, A. A., Vina, A., Verma, S. B., Rundquist, D. C., Arkebauer, T. J., Keydan, G., et al. (2006a). Relationship between gross primary production and chlorophyll content in crops: implications for the synoptic monitoring of vegetation productivity. J. Geophys. Res. 111, D08S11. doi: 10.1029/2005JD006017
Gitelson, A. A., Keydan, G. P., Merzlyak, M. N. (2006b). Three-band model for noninvasive estimation of chlorophyll, carotenoids, and anthocyanin contents in higher plant leaves. Geophys. Res. Lett. 33, L11402. doi: 10.1029/2006GL026457
Gupta, R. K., Vijayan, D., Prasad, T. S. (2003). Comparative analysis of red-edge hyperspectral indices. Adv. Space Res. 32 (11), 2217–2222. doi: 10.1016/S0273-1177(03)90545-X
Haboudane, D., Miller, J. R., Pattey, E., Zarco-Tejada, P. J., Strachan, I. (2004). Hyperspectral vegetation indices and novel algorithms for predicting green LAI of crop canopies: modeling and validation in the context of precision agriculture. Remote Sens. Environ. 90 (3), 337–352. doi: 10.1016/j.rse.2003.12.013
Horler, D. N. H., Dockray, M., Barber, J. (1983). The red edge of plant leaf reflectance. Int. J. Remote Sens. 4, 273–288. doi: 10.1080/01431168308948546
Houborg, R., Cescatti, A., Migliavacca, M., Kustas, W. P. (2013). Satellite retrievals of leaf chlorophyll and photosynthetic capacity for improved modeling of GPP. Agric. For. Meteorol. 177, 10–23. doi: 10.1016/j.agrformet.2013.04.006
Jordan, C. F. (1969). Derivation of leaf-area index from quality of light on the forest floor. Ecology 50, 663–666. doi: 10.2307/1936256
Jing, Q., Dai, T., Jiang, D., Zhu, Y., Cao, W. (2007). Spatial distribution of leaf area index and leaf n content in relation to grain yield and nitrogen uptake in rice. Plant Prod. Sci. 10 (1), 136–145. doi: 10.1626/pps.10.136
Joiner, J., Yoshida, Y., Vasilkov, A. P., Schaefer, K., Jung, M., Guanter, L., et al. (2014). The seasonal cycle of satellite chlorophyll fluorescence observations and its relationship to vegetation phenology and ecosystem atmosphere carbon exchange. Remote Sens. Environ. 152, 375–391. doi: 10.1016/j.rse.2014.06.022
Ju, C. H., Tian, Y. C., Yao, X., Cao, W. X., Zhu, Y., Hannaway, D. (2010). Estimating leaf chlorophyll content using red edge parameters. Pedosphere 20, 633–644. doi: 10.1016/S1002-0160(10)60053-7
Kokaly, R. F., Skidmore, A. K. (2015). Plant phenolics and absorption features in vegetation reflectance spectra near 1.66 μm. Int. J. Appl. Earth Obs. Geoinf. 43, 55–83. doi: 10.1016/j.jag.2015.01.010
Li, D., Cheng, T., Zhou, K., Zheng, H., Yao, X., Tian, Y., et al. (2017). WREP: a wavelet-based technique for extracting the red edge position from reflectance spectra for estimating leaf and canopy chlorophyll contents of cereal crops. ISPRS J. Photogramm. 129, 103–117. doi: 10.1016/j.isprsjprs.2017.04.024
Li, F., Mistele, B., Hu, Y. C., Chen, X. P., Schmidhalter, U. (2013). Comparing hyperspectral index optimization algorithms to estimate aerial N uptake using multi-temporal winter wheat datasets from contrasting climatic and geographic zones in China and Germany. Agric. For. Meteorol. 180, 44–57. doi: 10.1016/j.agrformet.2013.05.003
Li, L., Ren, T., Ma, Y., Wei, Q., Wang, S., Li, X., et al. (2016). Evaluating chlorophyll density in winter oilseed rape (Brassica napus L.) using canopy hyperspectral red-edge parameters. Comput. Electron. Agric. 126, 21–31. doi: 10.1016/j.compag.2016.05.008
Liu, L., Chen, Z. (2011). Mapping C3 and C4 plant functional types using separated solar-induced chlorophyll fluorescence from hyperspectral data. Int. J. Remote Sens. 32 (24), 9171–9183. doi: 10.1080/01431161.2010.550646
Liu, L., Guan, L., Liu, X. (2017). Directly estimating diurnal changes in GPP for C3 and C4 crops using far-red sun-induced chlorophyll fluorescence. Agric. For. Meteorol. 232, 1–9. doi: 10.1016/j.agrformet.2016.06.014
Liu, L., Zhang, Y., Wang, J., Zhao, C. (2005). Detecting solar-induced chlorophyll fluorescence from field radiance spectra based on the Fraunhofer line principle. IEEE Trans. Geosci. Remote 43 (4), 827–832. doi: 10.1109/TGRS.2005.843320
Liu, X., Liu, L., Zhang, S., Zhou, X. (2015). New spectral fitting method for full-spectrum solar-induced chlorophyll fluorescence retrieval based on principal components analysis. Remote Sens. 7, 10626–10645. doi: 10.3390/rs70810626
Lichtenthaler, H. K. (1987). Chlorophylls and carotenoids: pigments of photosynthetic biomembranes. Method. Enzymol. 148, 350–382. doi: 10.1016/0076-6879(87)48036-1
Meroni, M., Rossini, M., Guanter, L., Alonso, L., Rascher, U., Colombo, R., et al. (2009). Remote sensing of solar-induced chlorophyll fluorescence: Review of methods and applications. Remote Sens. Environ. 113, 2037–2051. doi: 10.1016/j.rse.2009.05.003
Miller, J. R., Hare, E. W., Wu, J. (1990). Quantitative characterization of the vegetation red edge reflectance 1. An inverted-Gaussian reflectance model. Int. J. Remote Sens. 1, 1755–1773. doi: 10.1080/01431169008955128
Mutanga, O., Skidmore, A. K. (2007). Red edge shift and biochemical content in grass canopies. ISPRS J. Photogramm. 62, 34–42. doi: 10.1016/j.isprsjprs.2007.02.001
Nelson, N., Yocum, C. F. (2006). Structure of function of photosystems I and II. Annu. Rev. Plant Biol. 57, 521–565. doi: 10.1146/annurev.arplant.57.032905.105350
Ni, Z., Liu, Z., Li, Z., Nerry, F., Huo, H., Li, X. (2015). Estimation of solar-induced fluorescence using the canopy reflectance index. Int. J. Remote Sens. 36, 5239–5256. doi: 10.1080/01431161.2015.1058987
Pérez-Priego, O., Zarco-Tejada, P. J., Sepulcre-Cantó, G., Miller, J. R., Fereres, E. (2005). Detection of water stress in orchard trees with a high-resolution spectrometer through chlorophyll fluorescence in-filling of the O2-A band. IEEE Trans. Geosci. Remote Sens. 43, 2860–2869. doi: 10.1109/TGRS.2005.857906
Porcar-Castell, A., Tyystjärvi, E., Atherton, J., Van der Tol, C., Flexas, J., Pfündel, E. E. (2014). Linking chlorophyll a fluorescence to photosynthesis for remote sensing applications: mechanisms and challenges. J. Exp. Bot. 65, 4065–4095. doi: 10.1093/jxb/eru191
Qi, J., Chehbouni, A., Huete, A. R., Kerr, Y. H., Sorooshian, S. (1994). A modified soil adjusted vegetation index. Remote Sens. Environ. 48, 119–126. doi: 10.1016/0034-4257(94)90134-1
Ramoelo, A., Cho, M. A., Mathieu, R., Madonsela, S., van deKerchove, R., Kaszta, Z., et al. (2015). Monitoring grass nutrients and biomass as indicators of rangeland quality and quantity using random forest modelling and World View-2 data. Int. J. Appl. Earth Obs. Geoinf. 43, 43–54. doi: 10.1016/j.jag.2014.12.010
Reyniers, M., Walvoort, D. J. J., Baardemaaker, J. D. (2006). A linear model to predict with a multi-spectral radiometer the amount of nitrogen in winter wheat. Int. J. Remote Sens. 27 (19), 4159–4179. doi: 10.1080/01431160600791650
Rondeaux, G., Steven, M., Baret, F. (1996). Optimization of soil-adjusted vegetation indices. Remote Sens. Environ. 55 (2), 95–107. doi: 10.1016/0034-4257(95)00186-7
Rossini, M., Meroni, M., Celesti, M., Cogliati, S., Julitta, T., Panigada, C., et al. (2016). Analysis of red and far-red sun-induced chlorophyll fluorescence and their ratio in different canopies based on observed and modeled data. Remote Sens. 8, 412. doi: 10.3390/rs8050412
Rougean, J. L., Breon, F. M. (1995). Estimating PAR absorbed by vegetation from bidirectional reflectance measurements. Remote Sens. Environ. 51, 375–384. doi: 10.1016/0034-4257(94)00114-3
Salon, C., Munier-Jolain, N., Duc, G., Voisin, A., Grandgirard, D., Larmure, A., et al. (2001). Grain legume seed filling in relation to nitrogen acquisition: a review and prospects with particular reference to pea. Agronomie EDP Sci. 21 (6–7), 539–552. doi: 10.1051/agro:2001143
Sampson, P. H., Mohammed, G. H., Zarco-Tejada, P. L. (2003). Hyperspectral remote sensing of forest condition: estimating chlorophyll content in tolerant hardwoods. Forest Sci. 49 (3), 381–391. doi: 10.1191/030913399673417384
Schlemmer, M., Gitelson, A. A., Schepers, J., Ferguson, R., Peng, Y., Shanahan, J., et al. (2013). Remote estimation of nitrogen and chlorophyll contents in maize at leaf and canopy levels. Int. J. Appl. Earth Obs. Geoinf. 25, 47–54. doi: 10.1016/j.jag.2013.04.003
Schull, M. A., Anderson, M. C., Houborg, R., Gitelson, A., Kustas, W. P. (2015). Thermal-based modeling of coupled carbon, water, and energy fluxes usingnominal light use efficiencies constrained by leaf chlorophyll observations. Biogeosciences 12, 1511–1523. doi: 10.5194/bg-12-1511-2015
Sims, D. A., Gamon, J. A. (2002). Relationships between leaf pigment content and spectral reflectance across a wide range of species, leaf structures, and developmental stages. Remote Sens. Environ. 81, 337–354. doi: 10.1016/S0034-4257(02)00010-X
Tang, Y. L., Wang, R. C., Huang, J. F. (2004). Relations between red edge characteristics and agronomic parameters of crops. Pedosphere. 14, 467–474.
Tsai, F., Philpot, W. (1998). Derivative analysis of hyperspectral data. Remote Sens. Environ. 66, 41–51. doi: 10.1016/S0034-4257(98)00032-7
Ustin, S. L., Gitelson, A. A., Jacquemoud, S., Schaepman, M., Asner, G. P., Gamon, J. A., et al. (2009). Retrieval of foliar information about plant pigment systems from high resolution spectroscopy. Remote Sens. Environ. 113, S67–S77. doi: 10.1016/j.rse.2008.10.019
Van der Tol, C., Rossini, M., Cogliati, S., Verhoef, W., Colombo, R., Rascher, U., et al. (2016). A model and measurement comparison of diurnal cycles of sun-induced chlorophyll fluorescence of crops. Remote Sens. Environ. 186, 663–677. doi: 10.1016/j.rse.2016.09.021
Van Wittenberghe, S., Alonso, L., Verrelst, J., Moreno, J., Samson, R. (2015). Bidirectional sun-induced chlorophyll fluorescence emission is influenced by leaf structure and light scattering properties – a bottom-up approach. Remote Sens. Environ. 158, 169–179. doi: 10.1016/j.rse.2014.11.012
Vincini, M., Frazzi, E., D’Alessio, P. (2006). “Angular dependence of maize and sugar beet Vis from directional CHRIS/PROBA data,” in Fourth ESA CHRIS PROBA Workshop (Frascati, Italy: ESRIN), 19–21.
Vogelman, J. E., Rock, B. N., Moss, D. M. (1993). Red-edge spectral measurements from sugar maple leaves. Int. J. Remote Sens. 14 (8), 1563–1575. doi: 10.1080/01431169308953986
Wang, X. Z., Huang, J. F., Li, Y. M., Wang, R. C. (2003). Correlation between chemical contents of leaves and characteristic variables of hyperspectra on rice field. Trans. Chinese Soc. Agr. Eng. (in Chinese). 19, 144–148. doi: 10.3321/j.issn:1002-6819.2003.02.033
Wei, D., Li, X., Wang, H., Li, Y. (2013). Estimation of chlorophyll content in the typical steppe vegetation of Inner Mongolia, China, using various red-edge position extraction techniques. J. Appl. Remote Sens. 7, 157–171. doi: 10.1117/1.JRS.7.073471
Wieneke, S., Ahrends, H., Damm, A., Pinto, F., Stadler, A., Rossini, M., et al. (2016). Airborne based spectroscopy of red and far-red sun-induced chlorophyll fluorescence: implications for improved estimates of gross primary productivity. Remote Sens. Environ. 184, 654–667. doi: 10.1016/j.rse.2016.07.025
Wu, C., Niu, Z., Tang, Q., Huang, W. (2008). Estimating chlorophyll content from hyperspectral vegetation indices: modeling and validation. Agric. For. Meteorol. 148 (8–9), 1230–1241. doi: 10.1016/j.agrformet.2008.03.005
Yang, F., Li, J. L., Gan, X. Y., Qian, Y. R., Wu, X. L., Yang, Q. (2010). Assessing nutritional status of Festuca arundinacea by monitoring photosynthetic pigments fromhyperspectral data. Comput. Electron. Agric. 70, 52–59. doi: 10.1016/j.compag.2009.08.010
Zarco-Tejada, P. J., Miller, J. R., Noland, T. L., Mohammed, G. H., Sampson, P. H. (2001). Scaling-up and model inversion methods with narrowband optical indices for chlorophyll content estimation in closed forest canopies with hyperspectral data. IEEE Trans. Geosci. Remote Sens. 39, 1491–1507. doi: 10.1109/36.934080
Zarco-Tejada, P. J., Pushnik, J. C., Dobrowski, S., Ustin, S. L. (2003). Steady-state chlorophyll a fluorescence detection from canopy derivative reflectance and double-peak red-edge effects. Remote Sens. Environ. 84 (2), 283–294. doi: 10.1016/S0034-4257(02)00113-X
Keywords: corn, chlorophyll content, chlorophyll fluorescence, derivative spectra, O2–A absorption
Citation: Zhang X, He Y, Wang C, Xu F, Li X, Tan C, Chen D, Wang G and Shi L (2019) Estimation of Corn Canopy Chlorophyll Content Using Derivative Spectra in the O2–A Absorption Band. Front. Plant Sci. 10:1047. doi: 10.3389/fpls.2019.01047
Received: 15 October 2018; Accepted: 29 July 2019;
Published: 27 August 2019.
Edited by:
Guijun Yang, Beijing Research Center for Information Technology in Agriculture, ChinaReviewed by:
Zhenhai Li, Beijing Research Center for Information Technology in Agriculture, ChinaEsa Tyystjärvi, University of Turku, Finland
Copyright © 2019 Zhang, He, Wang, Xu, Li, Tan, Chen, Wang and Shi. This is an open-access article distributed under the terms of the Creative Commons Attribution License (CC BY). The use, distribution or reproduction in other forums is permitted, provided the original author(s) and the copyright owner(s) are credited and that the original publication in this journal is cited, in accordance with accepted academic practice. No use, distribution or reproduction is permitted which does not comply with these terms.
*Correspondence: Changwei Tan, tanwei010@126.com; Dongmei Chen, chendm@queensu.ca