 Zunfu Lv
 Guoquan Lu
- The Key Laboratory for Quality Improvement of Agricultural Products of Zhejiang Province, College of Advanced Agricultural Sciences, Zhejiang A&F University, Hangzhou, China
Critical leaf nutrient concentrations have often been used to diagnose the nutritional status of crops. Determining critical leaf potassium (K) concentrations for the maximum root dry matter (RDM) will provide a reliable means of linking leaf K nutrient concentrations to the yield of sweet potato. Three field experiments, using varying K application rates (0–300 kg K ha−1) and two sweet potato cultivars, were performed in the Zhejiang Province of China. A new critical leaf K curve (Kleaf) based on the maximum RDM was determined to assess K nutrition in sweet potato and described by the equation . A critical root K curve (Kroot) based on the maximum RDM was also determined to assess K nutrition and described by the equation . The K nutrition index (KNI) was constructed to identify the situations of K-limiting and non-K-limiting treatments. The leaf KNI (KNIleaf) ranged from 0.56 to 1.17, and the root K KNI (KNIroot) ranged from 0.52 to 1.35 during the growth period of sweet potato. The results showed that the critical leaf K concentration curve can be used as an accurate leaf K status diagnostic tool at critical growth stages that connected leaf nutrient concentration and sweet potato tuber yield. This K curve will contribute to K management of sweet potato during its growth period in China.
Introduction
Sweet potato (Ipomoea batatas L.) is an essential food crop, and based on its cultivation area and yield, it is ranked as the fourth major food crop after rice, wheat, and corn in China (Ma et al., 2012). China cultivates sweet potato on a large scale, and the annual average total yield and planting area are ranked first in the world (Tang et al., 2018). Sweet potato is a typical potassium (K)-favoring crop. The demand ratio of nitrogen (N), phosphorus (P), and K is ~2:1:4 (Wang et al., 2015). Unlike N and P nutrients, K does not become a part of the chemical structure of the plant. Sweet potato is much more vulnerable to K-deficiency than to N- and P-deficiency (Tang et al., 2018). K plays many regulatory roles in plant nutrition, i.e., it promotes root growth, activates enzymes, improves photosynthetic capacity, transports sugar and starch, and causes earlier tuber initiation (Liu et al., 2013). Since K application plays a significant role in the distribution and accumulation of dry matter in tuber roots (Shi et al., 2002), it promotes the accumulation of K in sweet potato (Li et al., 2015) and increases tuber root yield (Ning et al., 2012; Wang et al., 2017a). However, excessive K application would lead to luxury absorption of K in sweet potato and a reduction in the K utilization rate (Foloni et al., 2013).
The concept of critical nutrient concentration was first proposed in 1984 (Lemaire and Salette, 1984) on N, and it was stated that a minimum N concentration is required for maximal growth. Models have been constructed to simulate critical N concentration dilution curves for rice (Ata-Ul-Karim et al., 2017), corn (Zhao et al., 2017), wheat (Yao et al., 2014), and other crops. However, the critical K concentration curve was rarely studied. The critical K concentration is defined as the minimum K concentration required for maximal growth. Some studies found that the K concentration in sweet potato decreases with an increase in biomass during the growth and development of sweet potato (Qi et al., 2016). In addition, some studies reported that the potato seedling dry weight and yield no longer increased when the K concentration exceeded a certain level (Trehan and Claassen, 1998; Karam et al., 2009). All these studies indicated the likely presence of a critical K concentration curve for crops. Recent studies by Adiele et al. (2021) reported, for the first time, the critical K dilution curves for cassava.
Leaf nutrient concentration is usually used to diagnose nutrient deficiency in crops. O'Sullivan et al. (1997) used leaf nutrient concentrations to diagnose nutrient disorders of sweet potato. However, these diagnostic criteria were not available for mature storage root of sweet potato. Ramakrishna et al. (2009) developed the Diagnosis and Recommendation Integrated System to provide a means of connecting leaf nutrient concentrations to crop yield, but it was based on empirical statistical methods. Ze and Dong (1991) showed that leaf nutrition excess or deficiency could determine the root yield of sweet potato, but it did not show the critical leaf value. The leaf nutrient concentration is, therefore, optimal at the highest root dry matter (RDM) values. Therefore, a critical K concentration in sweet potato leaves can be used to diagnose K nutrition in its storage roots.
Source-sink balance is an ideal state for sweet potato growth. The root/shoot (R/S) ratio is the best index to reflect the balance between source and sink (Ning et al., 2015). K application can promote the translocation of photosynthates to storage roots (Liu et al., 2013). The appropriate leaf K concentration is the key to coordinate the source-sink balance. K and other nutrients are the internal driving factors of sweet potato growth, and the R/S ratio is the external performance. The critical K concentration and the optimal R/S ratio represent the best physiological and growth state of sweet potato, respectively. The change of R/S ratio of sweet potato under different K concentrations is helpful to clarify the effect of K concentration on R/S ratio.
The objectives of this study were to (i) determine the critical leaf K concentrations for sweet potato for maximum RDM, (ii) construct a K nutrition index (KNI) for assessing K nutritional status, and (iii) reveal the relationship between shoots and roots under different K fertilization levels.
Materials and Methods
Experimental Design
Three field experiments, using varying K application rates and two sweet potato cultivars (Xinxiang and Shang 19), were conducted at Lin'an (30°15′N, 119°43′E) and Yuhang (30°41′N, 120°29′E) in the Zhejiang Province of China. The basic soil data and that of the three field experiments are shown in Table 1. The soil was clay loam, classified as Ultisol soil. The annual average temperature is 16.4°C. The annual average precipitation is 1,628.6 mm, and precipitation occurs mostly between April and September. The minimum and maximum temperatures recorded in the sampling date are shown in Table 1. The plot size was 6 × 4 m, and plots were arranged in a randomized block design with three replicates. The planting density was 5.0 plants m−2 with a distance of 1 m between plants and 0.2 m between rows. As shown in Table 1, organic matter, total N, available K, and available P values were determined per site and year. Five different K application rates consisting of 0 (K0), 75 (K1), 150 (K2), 225 (K3), and 300 kg ha−1 (K4) were used. Notably, 50% K-fertilizer was applied as base fertilizer, and 50% K-fertilizer was applied on day 30 after planting (50%). N (50 kg ha−1) and P (120 kg ha−1) fertilizers were applied as base fertilizers in all plots. N (50 kg ha−1) fertilizers were dressed on day 30 after planting. Planting occurred on May 4, 2017, April 30, 2018, and May 1, 2019. The data used to construct critical K concentration curves were derived from Experiments 2 and 3. The data were used to validate the critical K concentration curves from Experiment 1.
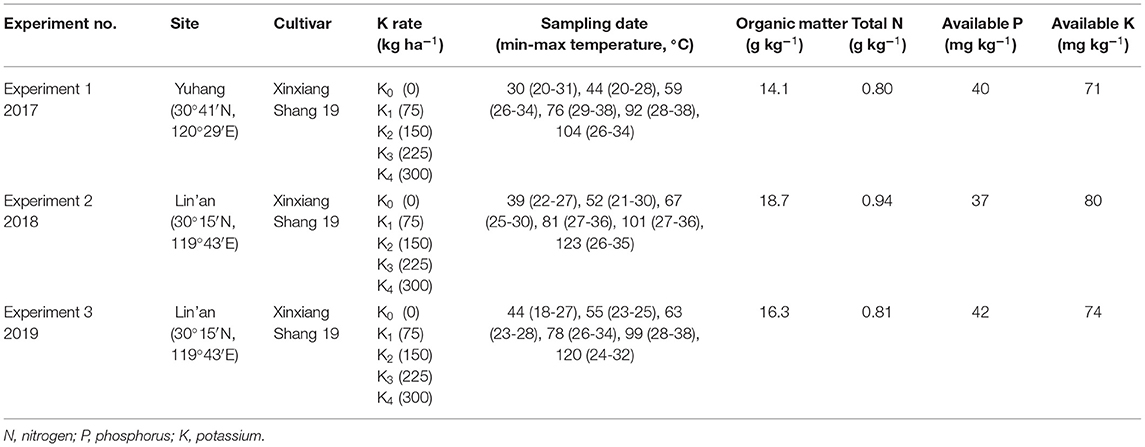
Table 1. Nutrient content data for the three field experiments.
Sampling and Measurements
Sweet potato samples were collected from the experimental plots during six growth dates, and five sweet potato plants were randomly selected from each plot. The leaf, stem, and root samples of sweet potato were dried to constant mass at 80°C, and the dry biomass was determined. Roots and corresponding aboveground biomass were used to calculate the R/S ratio. The separated organs of the dried sweet potato plants were ground to powder to pass through a 1-mm sieve. The powder (0.200 ± 0.020 g) was weighted out to measure K content. The leaf K content (LKC) and the root K content were determined using atomic absorption spectroscopy (Thermo Scientific iCE™ 3300, Germany).
Model Construction
Critical Leaf K Concentration Based on the Maximum RDM
The critical leaf K concentration was constructed based on the critical data points at which RDM was neither limited nor enhanced by K. A critical data point was determined by each sampling data that include K-limiting treatments and non-K-limiting treatments. With increasing K application, both the storage root weight and leaf K concentration of sweet potato increased significantly (P < 0.05). With the continuous increase of K application, there were no significant changes in the storage root weight (P < 0.05), but the leaf K concentration increases continuously with increasing K application (P < 0.05). Therefore, the K treatments for each sampling were divided into two groups: (i) K-limiting treatment was defined as a treatment in which additional K supply led to a significant response in the storage root weight and leaf K concentration and (ii) non-K-limiting treatment was defined as a treatment in which additional K supply did not lead to a significant increase in the storage root weight but resulted in a significant increase in the leaf K concentration. The RDM values in different K treatments were compared using ANOVA (SPSS Statistics 19.0 software, IBM Corp., Armonk, NY, USA) at a probability level of 5%.
The critical leaf K concentration based on the maximum RDM is defined as the minimum leaf K concentration required for maximal root growth. A critical leaf K concentration model for sweet potato roots was constructed according to the method of the critical N concentration model (Justes et al., 1994). First, the RDM and the leaf K concentrations were used to identify whether root growth was restricted by K nutrition. A regression line was used to fit data from the K-limiting treatments. A vertical line was calculated with the data from the non-K-limiting treatments as the average of the maximum RDM. The critical leaf K concentration point was the intersection point of the oblique and vertical lines. The following equation describes the critical leaf K concentration curve (Kleaf) based on the maximum RDM:
where a1 and b1 are the empirical coefficients.
Critical Root K Concentration Based on the Maximum RDM
The critical root K concentration is defined as the minimum root K concentration required for maximal root growth. A critical root K concentration model for sweet potato was constructed according to the method of the critical root N concentration model (Lv et al., 2020). The following equation describes the critical root K concentration curve (Kroot) based on the maximum RDM:
where a2 and b2 are the empirical coefficients.
The KNI
The KNI is an indicator used to determine crop K status. The KNIleaf at each sampling date was determined according to the actual leaf K concentration and the critical leaf K concentration as follows:
The KNIroot at each sampling date was determined according to the actual root K concentration and the critical root K concentration as follows:
where Kl and Kr are the measured leaf and root K concentrations, respectively. Thus, for KNI = 1, K nutrition is considered optimal for root growth; for KNI <1, K nutrition is considered limited for root growth, and for KNI > 1, K nutrition is considered excessive for root growth plants contain excess K.
The R/S ratio reflects the relationship between the roots and the shoots. The allometric growth of root and shoot can be expressed as the following equation: R = a × Sb.
Results
RDM According to K Application Rate
The RDM of sweet potato gradually increased during the growth period of sweet potato (Figure 1; Table 2). The growth rate increased significantly after 2 months of planting. The RDM showed a continuously increasing trend from K0 to K3 treatments, but there were no significant differences among K3 and K4 treatments. Therefore, RDM increased initially and then stabilized as the K application rate increased for two sweet potato cultivars. RDM differed significantly among K0, K1, and K2 treatments. The RDM in K3 and K4 treatments with high K application rates was significantly higher than that in the three treatments with low K application rates. The RDM was consistent with the following inequality under different K application treatments: K0 < K1 < K2 < K3 = K4.
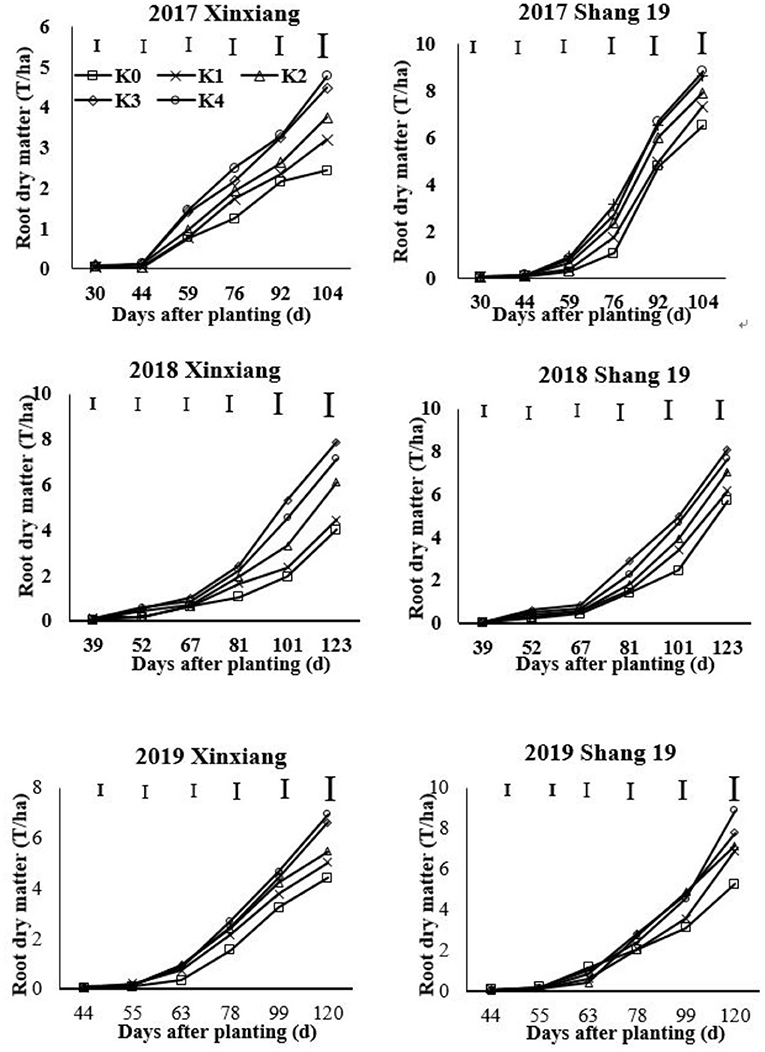
Figure 1. Changes in root dry matter (RDM) for two sweet potato cultivars with time under different potassium (K) fertilization levels.
Table 2. Root dry matter for sweet potato grown under different potassium (K) application rates in three field experiments.
Leaves and Roots K Concentration Under Different K-Fertilizer Level
The leaf K concentration declined gradually during the growth period of sweet potato (Figure 2; Table 3). The K concentration in sweet potato leaves increased as the K application rate increased. Leaf K concentration showed a slightly decreasing trend during days 67–123 in 2018 and days 63–120 in 2019 (Figure 2). Leaf K concentration ranged from 2.9 to 5.29% for the Xinxiang cultivar and 2.7 to 5.57% for Shang 19 in 2017, from 2.47 to 5.39% for the Xinxiang cultivar and 2.33 to 6.36% for Shang 19 in 2018, and from 3.01 to 5.91% and 3.03 to 5.85%, respectively, in 2019 (Figure 2).
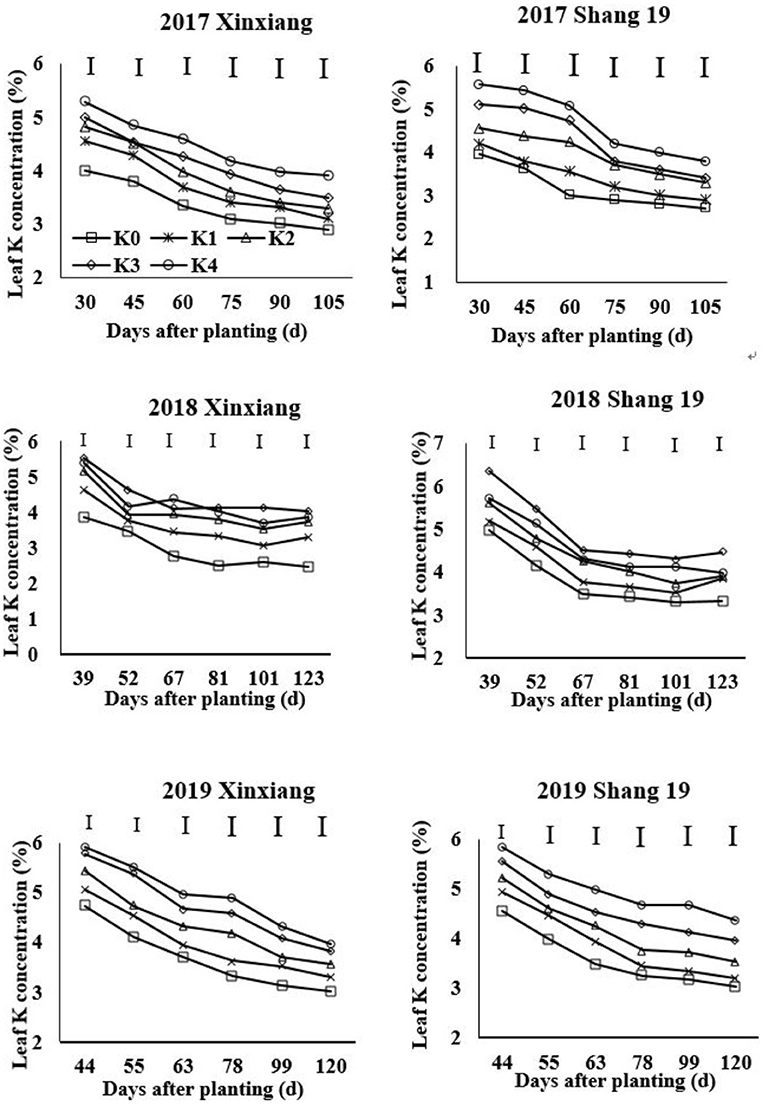
Figure 2. Changes in K concentration in sweet potato leaves with time under different K fertilization levels.
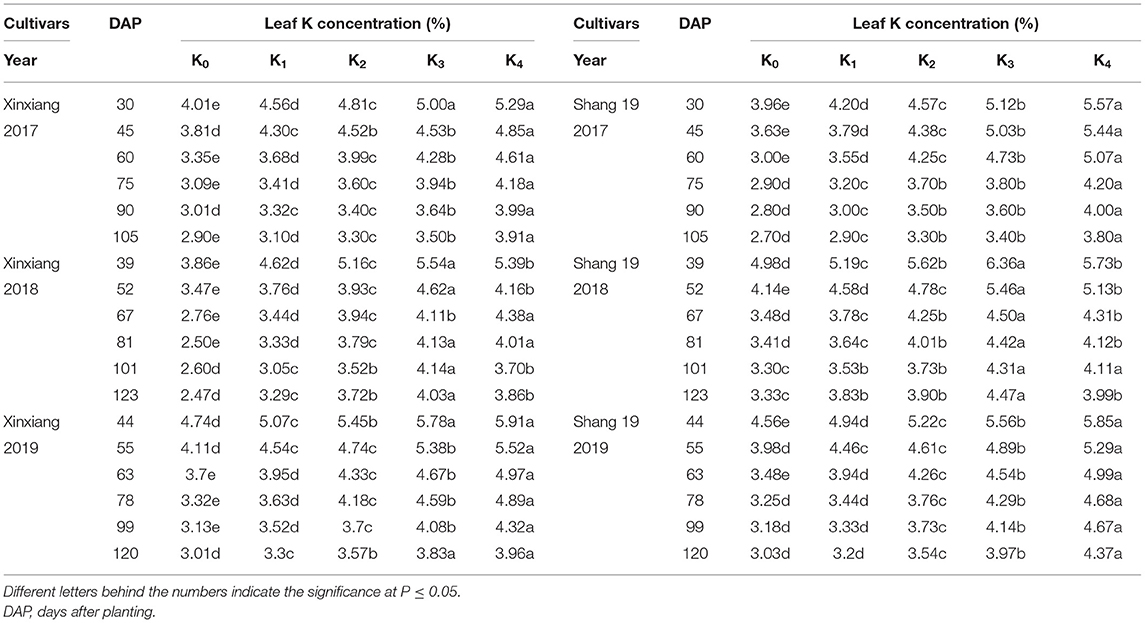
Table 3. Leaf K concentration for sweet potato grown under different K application rates in three field experiments.
The root K concentration declined gradually during the growth period of sweet potato (Figure 3; Table 4). The K concentration in sweet potato roots increased with the increasing K application rate (Figure 3). The root K concentration exhibited a significant decreasing trend during days 39–67 in 2018 and during days 44–63 in 2019, but it exhibited a slightly decreasing trend during days 67–123 in 2018 and days 63–120 in 2019 (Figure 3). Root K concentration ranged from 0.9 to 2.63% for the Xinxiang cultivar and 0.84 to 3.67% for Shang 19 during 2017, from 1.36 to 2.79% for the Xinxiang cultivar and 1.26 to 3.16% for Shang 19 during 2018, and from 1.35 to 3.02% and 1.33 to 3.13%, respectively, in 2019 (Figure 3).
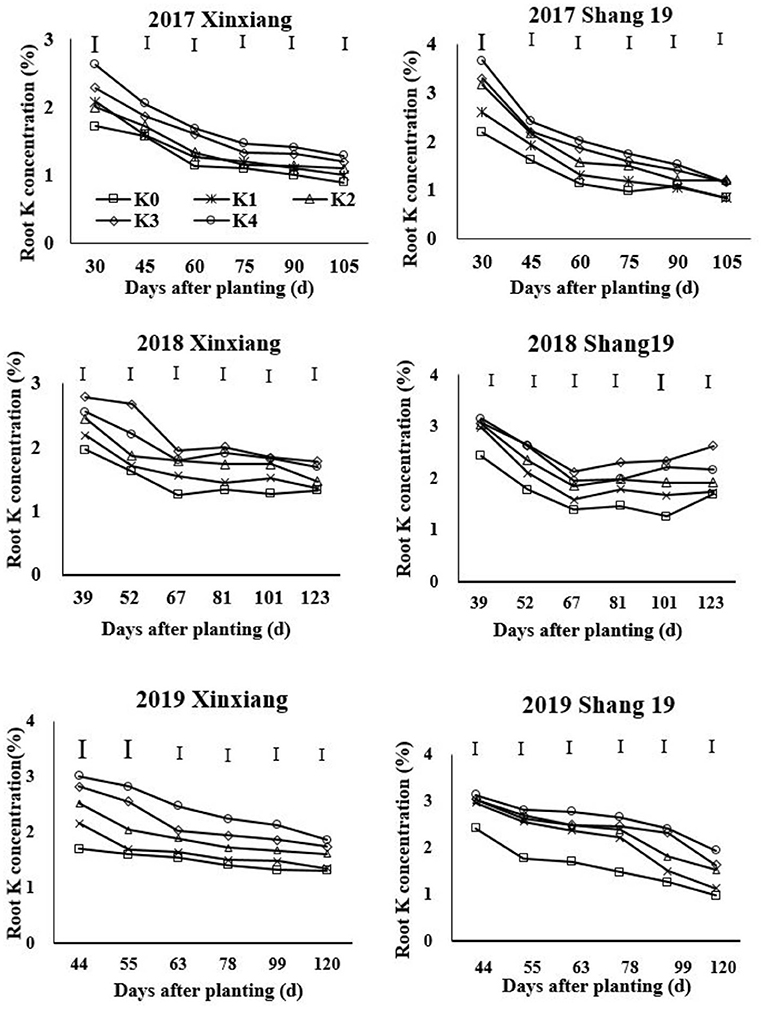
Figure 3. Changes in K concentration in sweet potato roots with time under different K fertilization levels.
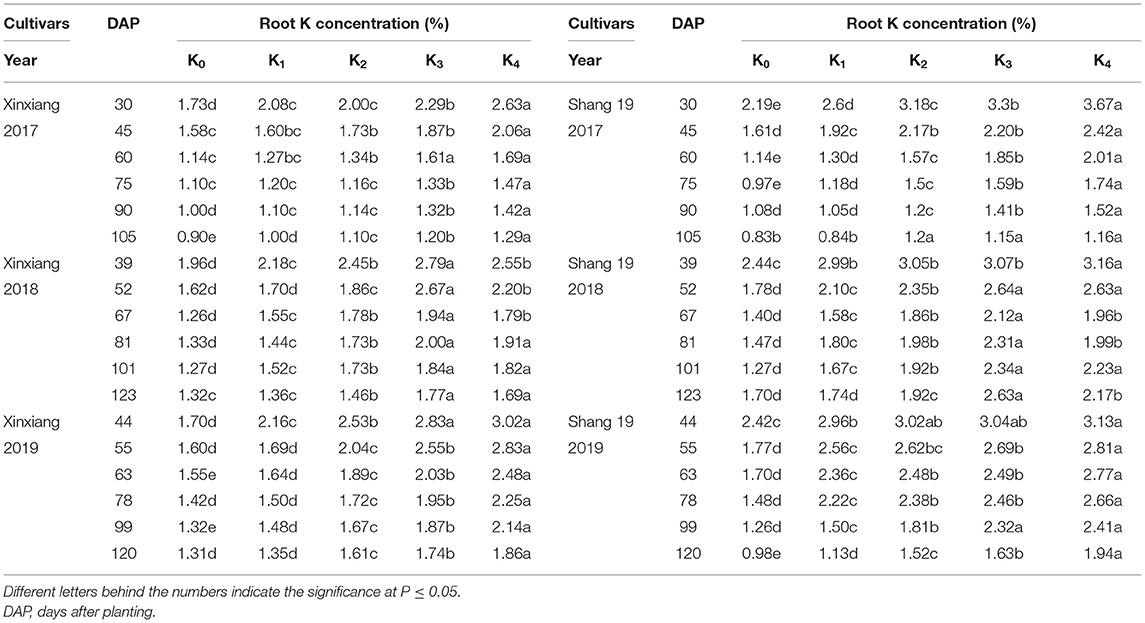
Table 4. Root K concentration for sweet potato grown under different K application rates in three field experiments.
Critical Leaf K Concentration Based on RDM
According to the method described in the “Model construction” section, the critical leaf K concentration point was the intersection point of the oblique and vertical lines (Figure 4). There was a decreasing trend of Kleaf with increasing RDM of sweet potato. The regression trend line could be fitted by the following power equation:
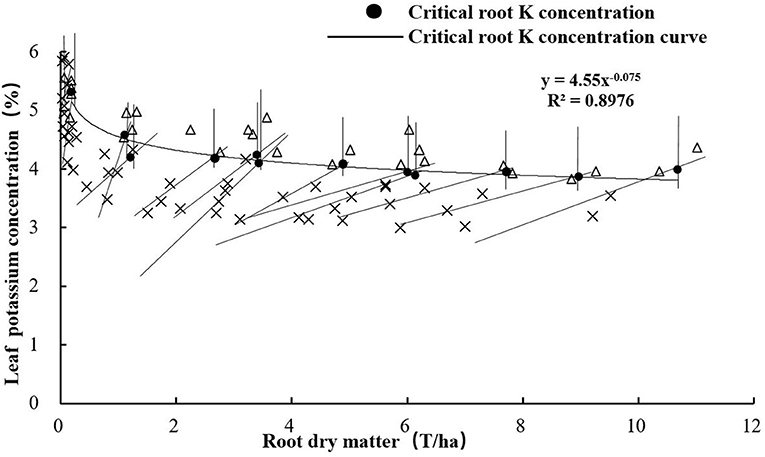
Figure 4. Critical leaf K concentration curve based on RDM.
Critical Root K Concentration Based on RDM
The critical root K concentration model based on RDM was also constructed according to the method described in the “Model construction” section. There was a decreasing trend of Kroot with increasing RDM of sweet potato (Figure 5). The regression trend line could be fitted by the following power equation:
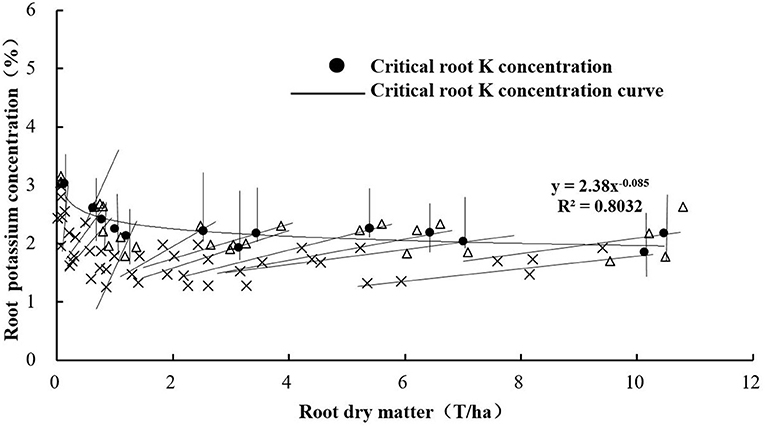
Figure 5. Critical root K concentration curve based on RDM.
Validation of Critical K Concentration Curves
The independent data from an experiment conducted during the 2017 growing season were used for the comprehensive validation of the critical K concentration curves. Both curves identified the situations of K-limiting and non-K-limiting treatments well. The data points from the K-limiting treatments were near or below the curve, while those data points from the non-K-limiting treatments were near or above the curve (Figure 6). Cultivar, growth stage, season, or site did not significantly affect this curve.
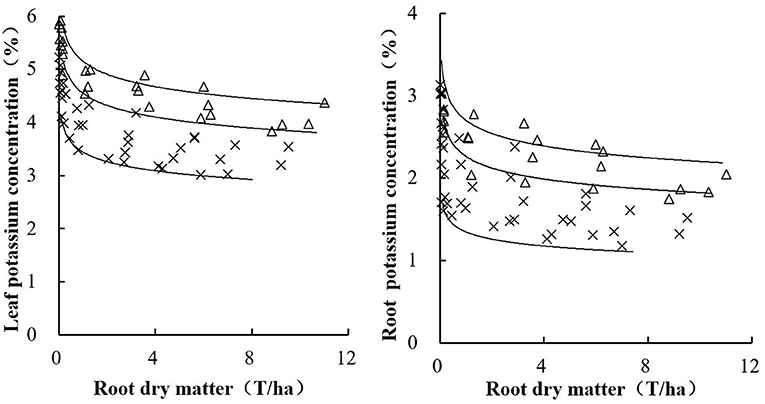
Figure 6. Validation of leaf (left) and root (right) K concentration curves using the independent data set conducted during 2007.
The data from the K4 and K0 treatments in 2018 and 2019 were used to determine the maximum leaf K (Kmax1) and minimum leaf K (Kmin1) curves based on leaf dry matter (LDM). The data from the K4 treatments in 2018 and 2019 were used to construct the maximum leaf K (Kmax2) and minimum leaf K (Kmin2) curves based on RDM. The following equations describe the maximum and minimum leaf K concentration curves based on RDM:
The following equations describe the maximum and minimum root K concentration curves based on RDM:
Differences in the KNI According to K Application Rate
The KNI can be used to identify the situations of K-limiting and non-K-limiting treatments. The KNI increased with the increasing K application rate, with the KNIleaf for Shang 19 ranging from 0.76 to 1.17 in 2018, and the KNIroot ranging from 0.56 to 1.35 (Figure 7). The KNIleaf for Xinxiang ranged from 0.56 to 1.04 in 2018, whereas the KNIroot ranged from 0.52 to 1.09. The KNIleaf values were <1 for the K0 and K1 treatments, whereas the KNIleaf values were >1 for the K3 and K4 treatments. The KNIroot values were <1 for the K0 and K1 treatments, whereas the KNIroot values were >1 for the K3 and K4. The KNI values for the K2 treatment in 2018 were close to 1, indicating optimal K levels. The minimum KNI value among the K-limiting treatments occurred at the vegetative growth stage. The KNIroot values were <1 for the K2 treatment during the vegetative growth stage, whereas the KNIroot values were >1 during the root expansion stage. The KNI exhibited a decreasing trend at the early stage and then an increasing trend at the latter stage. There was a significant relationship between KNIleaf and KNIroot (R2 = 0.81, Figure 8). In terms of K-deficiency, KNIleaf slightly overestimated the required K nutrition.
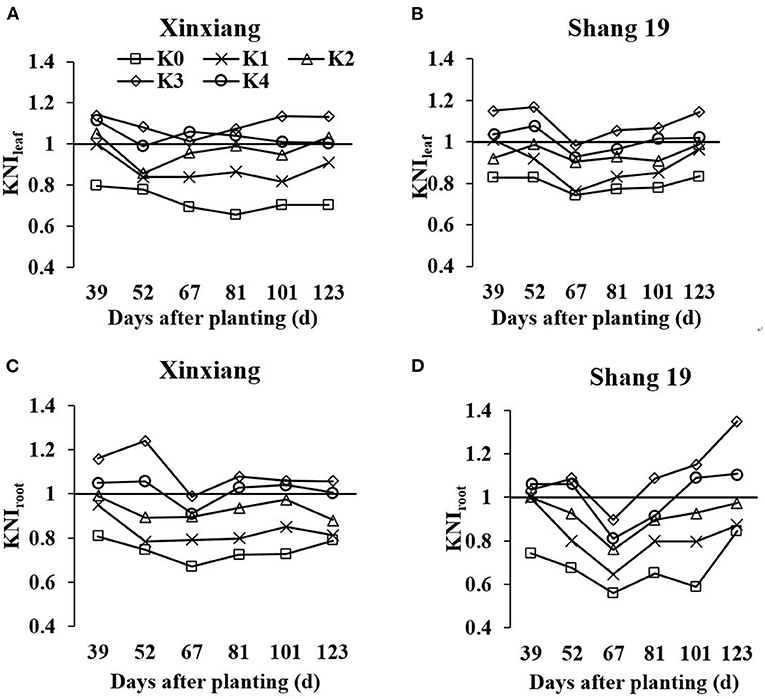
Figure 7. Changes in leaf K nutrition index (KNI) based on leaf dry matter (LDM) and RDM (KNIleaf and KNIroot, respectively) for sweet potato grown under different K fertilization levels. (A) Xinxiang KNIleaf, (B) Shang 19 KNIleaf, (C) Xinxiang KNIroot, and (D) Shang 19 KNIroot.
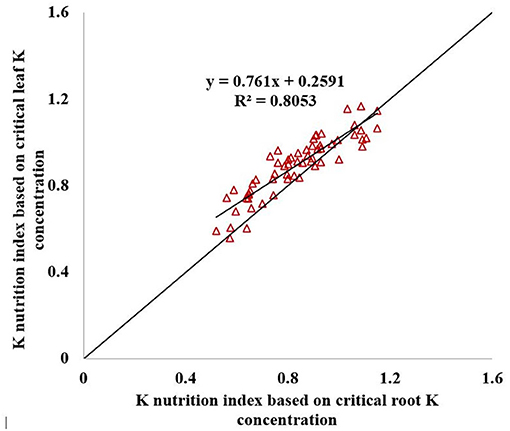
Figure 8. Relationship between KNIleaf and KNIroot.
The R/S Ratio
The R/S ratio reflects the relationship in dry matter distribution between the shoots and the roots. The R/S ratio increased gradually during the growth period (Figure 9). With the increase of K application rate, the R/S ratio of sweet potato first increased and then decreased. The R/S ratio of sweet potato in the K2 and K3 treatments was significantly higher than that in the other treatments. In most cases, the R/S ratio of sweet potato in the K0 and K4 treatments was lower than that in the other treatments.
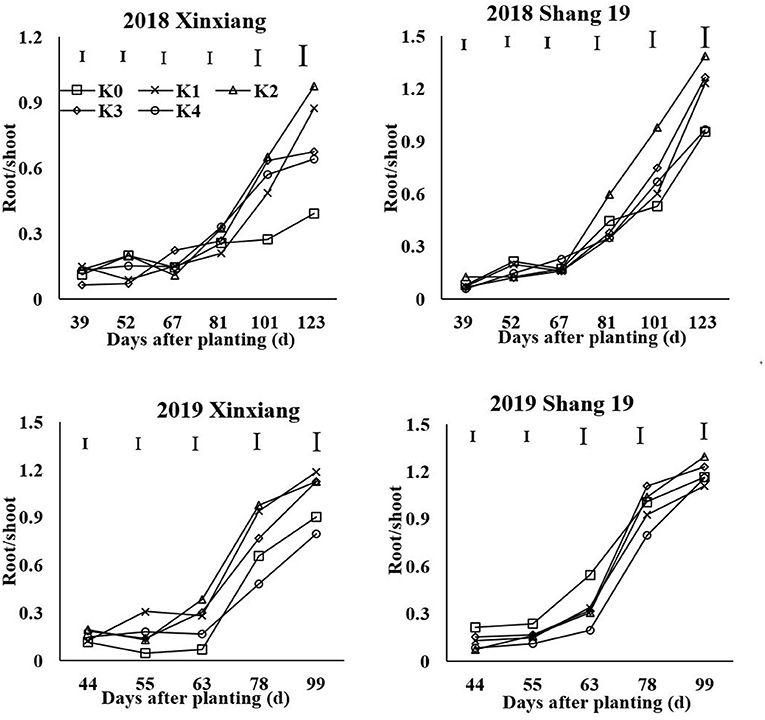
Figure 9. Changes in root/shoot (R/S) ratio with time under different K fertilization levels.
The allometric growth of root and shoot can be expressed as the following equation: R = a × Sb (Figure 10). Low K application inhibited the growth of the storage roots and the growth of the upper plant parts. With the increase of K application rate, the effect of K on the growth rate of the shoot was significantly higher than that of the root. The proportion of dry matter distribution in aboveground was increased by excessive K application.
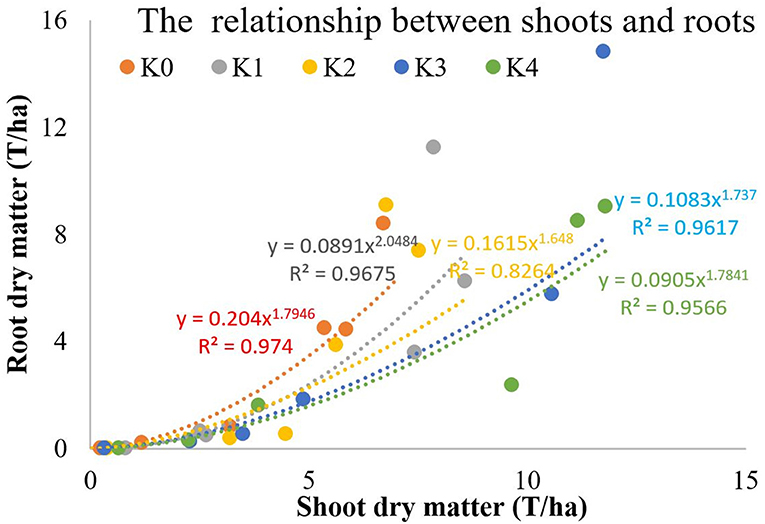
Figure 10. Relationship between shoots and roots under different K fertilization levels.
Discussion
Critical K Concentration
Critical nutrient concentration refers to the concentration of a specific nutrient within a specific plant part, below which its growth or yield begins to decline. Based on this approach, a single concentration value is assigned to a point where the plant nutritional status shifts from deficient to adequate (Yin and Vyn, 2004). Smith and Henderson (1985) showed the estimated critical leaf concentrations for K-deficiency in perennial ryegrass (Lolium perenne L.) grown in sand culture. Yin and Vyn (2004) showed that the critical leaf K concentration at the initial flowering stage of the development of soybean was 24.3 g kg−1. Ramakrishna et al. (2009) developed a diagnostic system by linking the leaf K concentrations to the yield of sweet potato tubers based on empirical statistical methods. In this study, we developed a critical leaf K concentration model to diagnose the K nutrition status of sweet potato. The critical leaf K concentration curve equation was Kleaf = 4.55 RDM−0.075, whereas the critical root K concentration curve equation was Kroot = 2.38 RDM−0.085. The a1 parameter is larger than a2, but there was no significant difference between the parameters b1 and b2. This is because the changes in K concentration in the leaves were consistent with the changes in K concentration in the roots.
Unlike the N dilution phenomenon, K does not enter into a structural pool of the cells but locates in the metabolic pool associated with the enzymatic reactions of respiration, photosynthesis, and translocation of assimilates. Gómez et al. (2018) proved the existence of a “dilution phenomenon” for K in potato and constructed critical shoot dilution curves for K in potato (Suprema: Kc = 6.58 W−0.135). Adiele et al. (2021) constructed the critical plant and shoot K dilution curves in cassava (the whole plant: Kc = 4.2DM−0.69; shoot: Kc = 4.3DM−0.54) and proved that the dilution of K concentration in leaves was less than that in roots, which is consistent with our study. Generally, the K dilution of sweet potato is less than that of potato and cassava. Lv et al. (2020) constructed the following critical N concentration dilution curve equation for roots: Nr = 0.57 RDM−0.425. The a-coefficient (0.57) for N is much lower than that (2.38) for K, because the concentration of root N stored is much lower than that of K. The b-coefficient (0.425) for N is much higher than that (0.085) for K. This is because K is less diluted than N. Thus, as the plant develops, the roots accumulate an increasing proportion of structural tissues that contain less K.
The KNI
Soil and tissue analyses are usually used to identify K-deficiency and to predict the K-fertilizer requirements of crops (Shen et al., 1996). However, the recommended amount of K-fertilizer based on the soil-testing results may not be suitable for sweet potato production. Consequently, the plant K content may function as an important alternative index for K-fertilizer management. Walworth and Muniz (1993) classified K contents in potato petiole into three categories, which served to estimate the accurate amount of K-fertilizer for potato plants. Westermann and Tindall (2000) proposed the K diagnostic criteria by comparing petiole K content with the K balance. In this study, the KNI was proposed to diagnose K-deficiency in plants. The KNI is based on the critical K concentration, which has reasonable biological significance.
The KNI highlighted the relationship between actual K concentration and critical K concentration. If the actual K concentration was lower than the critical K concentration, then the sweet potato growth was restricted; the critical K concentration was the most optimal K concentration for maximizing the sweet potato growth and avoiding fertilizer waste. The KNIleaf and KNIroot exhibited the same trend during the entire growth period of sweet potato. The correlation coefficient between KNIleaf and KNIroot was >0.897. Therefore, KNIleaf can be used to diagnose the K nutritional status instead of KNIroot.
The KNI exhibited a decreasing trend in 30–60 days after transplanting and then an increasing trend at the latter stages. A large amount of K absorbed was mainly concentrated 30–60 days after transplanting during the tuber formation period. At this stage, the K demand accounted for 54% of the whole growth period (Ning et al., 2011). However, the shoot is the center of growth at this stage (Lv et al., 2020), whereas the root system is small. Therefore, the K absorption capacity is weak, and the KNI decreases at this stage. With the gradual transfer of the growth center to the underground part, the K nutrition absorption capacity of the root system increases, and the KNI increases. The KNI exhibited a significantly increasing trend in 100 days after transplanting. This was because more K was transported from the shoot to the root during the latter stage (Ning et al., 2011). The KNI increased significantly at the latter stage due to K uptake by the root system and transport from the shoot to the root.
There was a liner-plateau function relationship between relative RDM and KNI. KNIroot and KNIleaf explained about 63 and 65% of the variation for the relative RDM, respectively (Figure 11). KNIleaf has better advantages to combine with remote sensing than KNIroot for monitoring the yield of sweet potato quickly. Adiele et al. (2021) showed that there was a linear relationship between relative biomass yield and KNI in cassava, and KNI explained 65–66% of the variation for the relative biomass for all treatments. Gómez et al. (2018) developed a quadratic polynomial model between N nutrition index (NNI) and potato yield, and NNI explained 73% of the variability in relative yield. Many other studies also constructed relationships between nutrition index and relative yield (He et al., 2017; Zhao et al., 2018). Therefore, the nutrition index can be used as a diagnostic tool to explain variations in yield caused by differences in crop nutrition status.
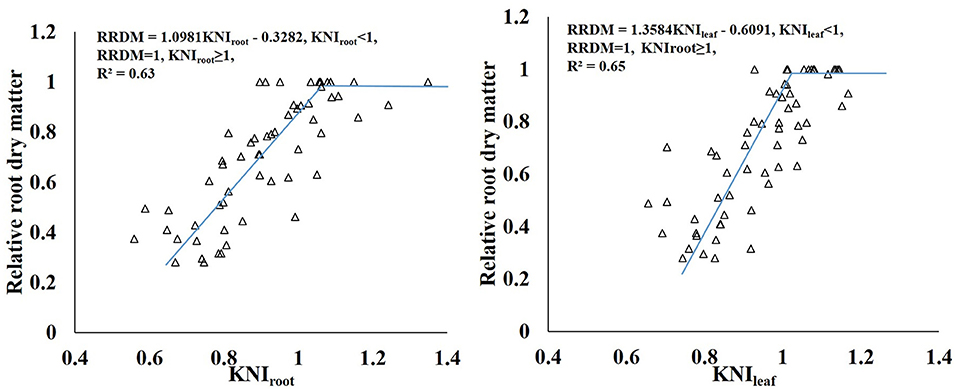
Figure 11. Relationship between relative RDM and the KNI of sweet potato grown under different K rates.
The R/S Ratio
The critical K concentration can reflect the dry matter distribution between shoot and root in sweet potato. K-deficiency first inhibits storage root growth, whereas K excess also inhibits storage root growth to a certain extent (Zhang et al., 2020). The dry matter proportion in roots increased initially and then decreased with the increasing K application rate. The R/S ratio is an important index that reflects the sink-source relationship of sweet potato. The R/S ratio in sweet potato was greater in the K2 treatment than in the other treatments. K influenced the storage root yield by an increase in the proportion of dry matter in the storage root and in the storage root numbers per plant. The main reason for the increase in yield following K application was due to the increasing trend of the R/S value, which reflected a larger amount of photosynthate translocation to the storage roots, resulting in their increased size (George et al., 2002; Lu et al., 2003). By contrast, excessive K promoted the growth of the stem slightly (George et al., 2002) and decreased the R/S ratio in sweet potato.
Potassium is the “lubricant” for carbohydrate transfer and distribution between the “sink-source” organs of crops. Proper K supply can regulate the R/S value of sweet potato, promote the transfer of photosynthetic products to root tubers (Ning et al., 2012), and can alleviate any source-sink imbalance. Sweet potato yield depends on both source strength and sink strength. The R/S ratio is an important index that reflects the sink-source relationship of sweet potato. K could significantly increase sucrose phosphate synthase (SPS) activity, sucrose synthase (SS) activity, insoluble acid invertase (IAI), and ADP-glucose pyrophosphorylase (ADPGPPase) activity. The appropriate amount of K could increase leaf SPS activity, chlorophyll content, and improved net photosynthesis (PN), which was beneficial to increase the supply of photosynthates from the source (Ma and Shi, 2011; Wang et al., 2014). Meanwhile, the appropriate amount of K could improve root SS, IAI, and ADPGPPase activity, which promoted the unloading ability of photosynthates to the sink (Liu et al., 2013; Wang et al., 2016). Insufficient leaf K levels under K0 treatment lead to decreased photosynthesis. Low K seriously limited the strength of source and sink but have a minimal effect on the R/S ratio (Ning et al., 2013). The R/S ratio under K2 treatment reached the maximum. Sweet potato under K2 treatment not only supplied more photosynthates but also had higher sink strength of storage roots, which lead to higher photosynthate distribution in storage roots. Compared with the K2 treatment, sweet potato under K4 treatment has a higher yield but a lower R/S ratio. This was because that high amount of K improved the N accumulation and lead to vigorous aboveground growth. Wang et al. (2016) showed that the total N accumulation under high K treatment (300 mg/kg) increased by 92.1% compared with control in the tuber formation period. Therefore, the excessive K-fertilizer leads to aboveground parts grow excessively and reduce the R/S ratio by greatly increasing the N content in the aboveground parts of sweet potato. In addition, the upper plant parts exhibited a greater range of increased K than the underground parts with increased K concentration (Qi et al., 2016). With increased K concentration, the stems exhibited a greater range of increased K than did the leaves and roots. The excessive K leads to vigorous aboveground growth and consumes most of the photosynthetic products (Li, 2016). Therefore, proper K application helps to regulate the source-sink relationship (Shi et al., 2002; Wang et al., 2017b). The excessive K application decreases the R/S ratio in sweet potato.
The Advantages of Leaf K Diagnosis
Due to the poor relationship between the soil exchangeable K content and the storage root yield of sweet potato, the recommended amount of K-fertilizer based on the soil-testing results may not be suitable for sweet potato production. The K content in leaves may be an important indicator for K-fertilizer management. However, the traditional test method for determining K content in leaves is not only complex but also time-consuming, which cannot effectively estimate the appropriate amount of K-fertilizer. Therefore, there is a need for a fast and accurate method for the real-time management of K-fertilizer treatment.
Critical leaf nutrient concentrations have often been used to diagnose the causes of crop malnutrition (Westermann and Tindall, 2000; Shi et al., 2018). However, these diagnostic criteria are not available for the mature storage root of sweet potato. Ramakrishna et al. (2009) established the statistical relationship between leaf nutrition and high-yield sweet potato. However, the statistical relationship is not a mechanistic model and cannot show the dynamic changes of K nutrition status. The critical leaf K concentration based on RDM developed in this study belongs to the mechanism model and can show the dynamic changes of K nutrition status at all growth stages of sweet potato. The constructed model in this study provides a reliable means of connecting leaf nutrient concentrations to the storage root yield of sweet potato and is a diagnostic tool that can be used to predict nutrient insufficiencies in sweet potato crops. Therefore, the diagnosis of root K nutritional status using leaf nutrient analysis is recommended.
Conclusion
A new critical leaf K curves were developed based on the maximum RDM to assess the K nutritional status in sweet potato in China. The critical leaf K curve for sweet potato, based on the maximum RDM, is described by the equation . The Kleaf can diagnose the K status of the storage roots. The curve can effectively identify the situations of K-limiting and non-K-limiting treatments under different conditions. The KNIleaf reflected the relationship between actual K concentration and critical K concentration and can be used to diagnose K-deficiency in plants. Our results show that the critical leaf K concentration curve can provide a reliable means of linking leaf nutrient concentrations to the storage root yield of sweet potato; thus, it is recommended as a reliable indicator for diagnosing the K status in sweet potato.
Data Availability Statement
The original contributions presented in the study are included in the article, further inquiries can be directed to the corresponding author/s.
Author Contributions
ZL contributed to designing the experiment, writing, reviewing, and editing. GL was involved in oversight and leadership responsibility for the research activity. All authors contributed to the article and approved the submitted version.
Funding
This study was supported by the Natural Science Foundation of China (32071897 and 31701322), the China Agriculture Research System of MOF and MARA, and the Key Research and Development Program of Zhejiang Province (2021C02057). Taishun County Science and Technology Planning Project (2021TSXM0049).
Conflict of Interest
The authors declare that the research was conducted in the absence of any commercial or financial relationships that could be construed as a potential conflict of interest.
Publisher's Note
All claims expressed in this article are solely those of the authors and do not necessarily represent those of their affiliated organizations, or those of the publisher, the editors and the reviewers. Any product that may be evaluated in this article, or claim that may be made by its manufacturer, is not guaranteed or endorsed by the publisher.
References
Adiele, J. G., Schut, A., Ezui, K. S., Pypers, P., and Giller, K. E. (2021). Dynamics of n-p-k demand and uptake in cassava. Agron. Sustain. Dev. 41:1. doi: 10.1007/s13593-020-00649-w
Ata-Ul-Karim, S. T., Zhu, Y., Liu, X. J., Cao, Q., Tian, Y. C., and Cao, W. (2017). Estimation of nitrogen fertilizer requirement for rice crop using critical nitrogen dilution curve. Field Crops Res. 201, 32–40. doi: 10.1016/j.fcr.2016.10.009
Foloni, J. S. S., Corte, A. J., Corte, J. R. D. N., Fabio, R. E., and Carlos, S. T. (2013). Topdressing fertilization with nitrogen and potassium levels in sweetpotato. Semina Ciências Agrárias 34, 117–126. doi: 10.5433/1679-0359.2013v34n117
George, M. S., Lu, G., and Zhou, W. (2002). Genotypic variation for potassium uptake and utilization efficiency in sweetpotato (I. batatas). Field Crops Res. 77, 7–15. doi: 10.1016/S0378-4290(02)00043-6
Gómez, M. I., Magnitskiy, S., and Rodríguez, L. E. (2018). Critical dilution curves for nitrogen, phosphorus, and potassium in potato group andigenum. Agron. J. 111, 1–9. doi: 10.2134/agronj2018.05.0357
He, Z., Qiu, X., Ata-Ul-Karim, S. T., Li, Y., Liu, X., Cao, Q., et al. (2017). Development of a critical nitrogen dilution curve of double cropping rice in south China. Front. Plant Sci. 8:638. doi: 10.3389/fpls.2017.00638
Justes, E., Mary, B., and Machet, J. M. (1994). Determination of a critical nitrogen dilution curve for winter wheat crops. Ann. Bot. 74, 397–407. doi: 10.1006/anbo.1994.1133
Karam, F., Rouphael, Y., and Lahoud, R. (2009). Influence of genotypes and potassium application rates on yield and potassium use efficiency of potato. Agron. J. 8, 27–32. doi: 10.3923/ja.2009.27.32
Lemaire, G., and Salette, J. (1984). Relation entre Dynamique de Croissance et Dynamique de Prevelevement d'Azote pour un Peuplement de Graminees Fourrageres. Etude de l'Effect du Milieu. Agronomie 4, 423–430. doi: 10.1051/agro:19840503
Li, Q. (2016). Effects of potassium fertilizer application rate on Agronomic Characters and yield of sweet potato. Liaoning Agric. Sci. 1, 70–72. doi: 10.3969/j.issn.1002-1728.2016.01.018
Li, W., Xiong, J., Tang, X., Yan, H., Zheng, X., Wei, M., et al. (2015). Effects of potassium application rate on yield formation and potassium utilization efficiency of starchy sweetpotato variety Xushu 26. Chin. J. Trop. Crops 36, 1037–1042. doi: 10.3969/j.issn.1000-2561.2015.06.005
Liu, H., Shi, C., Zhang, H., Wang, Z., and Chai, S. (2013). Effects of potassium on yield, photosynthate distribution, enzymes' activity and aba content in storage roots of sweet potato (ipomoea batatas lam.). Aust. J. Crop Sci. 7, 735–743.
Lu, G., George, M. S., and Weijun, Z. (2003). Genotypic variation of sweetpotato under low potassium stress. J. Plant Nutr. 26, 743–754. doi: 10.1081/PLN-120018562
Lv, Z., He, W., Lin, L., Deng, L., Yu, M., Fei, C, et al. (2020). Development of critical shoot and root N curves for diagnosing sweetpotato shoot and root N status. Field Crops Res. 257:107927. doi: 10.1016/j.fcr.2020.107927
Ma, D., Li, Q., Cao, Q., Niu, F., Xie, Y., Tang, J., et al. (2012). Development and prospect of sweetpotato industry and its technologies in china. Jiangsu J. Agric. Sci. 28, 969–973.
Ma, L., and Shi, Y. (2011). Effects of potassium fertilizer on physiological and biochemical index of Stevia rebaudiana Bertoni. Energy Procedia. 5, 581–586. doi: 10.1016/j.egypro.2011.03.102
Ning, Y., Cao, B., Zhu, L., Zhang, Y., Wang, J., Xu, X., et al. (2012). Effects of potassium application rates on dry matter accumulation, dry matter distribution, and potassium efficiency of sweet potato. Jiangsu Agric. Sci. 28, 320–325. doi: 10.3969/j.issn.1000-4440.2012.02.016
Ning, Y., Ma, H., Xu, X., Wang, J., Zhang, H., Xu, J., et al. (2013). Effects of deficiency of N, P, or K on growth traits and nutrient uptakes of sweetpotato at early growing stage. Scientia Agric. Sinica 46, 486–495. doi: 10.3864/j.issn.0578-1752.2013.03.005
Ning, Y., Zhang, Y., Zhu, L., Chen, D., Cai, F., Wang, J., et al. (2011). Uptake and distribution of nitrogen, phosphorus and potassium in sweetpotato (ipomoea batatas l.). Jiangsu J. Agric. Sci. 27, 71–74.
Ning, Y. W., Hong-Bo, M. A., Zhang, H., Wang, J. D., and Zhang, Y. C. (2015). Response of sweetpotato in source-sink relationship establishment, expanding, and balance to nitrogen application rates. Acta Agronomica Sinica 41:432. doi: 10.3724/SP.J.1006.2015.00432
O'Sullivan, J. N., Asher, C. J., and Blamey, F. P. C. (1997). “Nutrient disorders of sweet potato,” in ACIAR Monograph Series, ACIAR, Canberra, Australia, 136.
Qi, H., An, X., Liu, Y., Zhu, G., Wang, J., and Zhang, Y. (2016). Effects of potassium application rates on yield, potassium uptake and utilization in sweetpotato (Ipomoea batatas L.) genotypes. Jiangsu J. Agric. Sci. 32, 84–89.
Ramakrishna, A., Bailey, J. S., and Kirchhof, G. (2009). A preliminary diagnosis and recommendation integrated system (dris) model for diagnosing the nutrient status of sweetpotato (ipomoea batatas). Plant Soil 316, 107–116. doi: 10.1007/s11104-008-9763-5
Shen, J., Schoenau, J. J., Qian, P., and Greer, K. (1996). Assessment of cation exchange membrane method and estimation of potassium critical values. Pedosphere 6, 129–138.
Shi, C. Y., Wang, Z. L., Zhao, B. Q., Guo, F. F., and Yu, S. L. (2002). Effect of potassium nutrition on some physiological characteristics and yield formation of sweet potato. Plant Nutr. Fert. Sci. 8, 81–85 (in Chinese with English abstract). doi: 10.11674/zwyf.2002.0115
Shi, X., Zhang, X., Kang, W., Chen, Y., and Fan, M. (2018). Possibility of recommending potassium application rates based on a rapid detection of the potato petiole k status with a portable k ion meter. Am. J. Potato Res. 96, 48–54. doi: 10.1007/s12230-018-9687-4
Smith, G. S., and Henderson, I. S. C. V. (1985). Critical leaf concentrations for deficiencies of nitrogen, potassium, phosphorus, sulphur, and magnesium in perennial ryegrass. New Phytol. 101, 393–409. doi: 10.1111/j.1469-8137.1985.tb02846.x
Tang, W., Zhang, Y., Liu, Y., Wang, X., Kou, M. Y., Ma, D., et al. (2018). Quantifying cultivation technique and growth dynamics of purple-fleshed sweetpotato (ipomoea batatas l.) in china. Field Crops Res. 227, 41–48. doi: 10.1016/j.fcr.2018.08.007
Trehan, S. P., and Claassen, N. (1998). External K requirement of young plants of potato, sugar beet and wheat in flowing solution culture resulting from different internal requirements and uptake efficiency. Potato Res. 41, 229–237. doi: 10.1007/BF02358193
Walworth, J. L., and Muniz, J. E. (1993). A compendium of tissue nutrient concentrations for field-grown potatoes. Am. Potato J. 70, 579–597. doi: 10.1007/BF02850848
Wang, J. D., Wang, H. Y., and Zhang, Y. C. (2015). Intraspecific variation in potassium uptake and utilization among sweetpotato (Ipomoea batatas L.) genotypes. Field Crops Res. 170, 76–82. doi: 10.1016/j.fcr.2014.10.007
Wang, S., Huan, L. I., Shi, Y., and Changzhi, L. I. (2014). Summarization of sweet potato potassium nutrition. J. Qingdao Agric. Univ. 1, 272–276.
Wang, S., Li, H., Liu, Q., and Shi, Y. (2017a). Effect of potassium application on root grow and yield of sweetpotato and its physiological mechanism. Acta Agronomica Sinica. 43, 1057–1066. doi: 10.3724/SP.J.1006.2017.01057
Wang, S., Liu, Q., Shi, Y., and Li, H. (2016). Effects of potassium on nitrogen translocation and distribution and nitrogen metabolism enzymeactivities of sweet potato. Chinese J. Appl. Ecol. 27, 3569–3576. doi: 10.13287/j.1001-9332.201611.021
Wang, S., Liu, Q., Shi, Y., and Li, H. (2017b). Interactive effects of nitrogen and potassium on photosynthesis product distribution and accumulation of sweet potato. Scientia Agricultura Sinica 50, 2706–2716. doi: 10.3864/j.issn.0578-1752.2017.14.007
Westermann, D. T., and Tindall, T. A. (2000). Potassium diagnostic criteria for potato plants. Better Crop. 84(3):6–8.
Yao, X., Zhao, B., Tian, Y. C., Liu, X. J., Ni, J., Cao, W. X., et al. (2014). Using leaf dry matter to quantify the critical nitrogen dilution curve for winter wheat cultivated in eastern China. Field Crops Res. 159, 33–42. doi: 10.1016/j.fcr.2013.12.007
Yin, X., and Vyn, T. J. (2004). Critical leaf potassium concentrations for yield and seed quality of conservation-till soybean. Soil Sci. Soc. Am. J. 68, 1626–1634. doi: 10.2136/sssaj2004.1626
Ze, T., and Dong, Q. (1991). Study on sweetpotato tuber expansion characteristics iii. varieties differences in the effects of different nutrient supplies on tuber expansion. Horticult. Seedl. 19, 32–35.
Zhang, H., Dong, S., Xie, B., Wang, B., Zhang, L., and Duan, W. (2020). Effects of amount of potassium fertilizer on yield and potassium utilization efficiency of sweetpotato in Barren Land. J. Nucl. Agric. Sci. 34, 2299–2306.
Zhao, B., Ata-Ul-Karim, S. T., Duan, A., Liu, Z., Wang, X., Xiao, J., et al. (2018). Determination of critical nitrogen concentration and dilution curve based on leaf area index for summer maize. Field Crops Res. 228, 195–203. doi: 10.1016/j.fcr.2018.09.005
Keywords: sweet potato, leaf, critical potassium concentration, K nutrition index (KNI), root
Citation: Lv Z and Lu G (2021) A New Curve of Critical Leaf Potassium Concentration Based on the Maximum Root Dry Matter for Diagnosing Potassium Nutritional Status of Sweet Potato. Front. Plant Sci. 12:714279. doi: 10.3389/fpls.2021.714279
Received: 25 May 2021; Accepted: 30 August 2021;
Published: 30 September 2021.
Edited by:
Carla S. Santos, Catholic University of Portugal, PortugalReviewed by:
Elke Pawelzik, University of Göttingen, GermanyJaved Akhatar, Punjab Agricultural University, India
Copyright © 2021 Lv and Lu. This is an open-access article distributed under the terms of the Creative Commons Attribution License (CC BY). The use, distribution or reproduction in other forums is permitted, provided the original author(s) and the copyright owner(s) are credited and that the original publication in this journal is cited, in accordance with accepted academic practice. No use, distribution or reproduction is permitted which does not comply with these terms.
*Correspondence: Zunfu Lv, lvzunfu@163.com; Guoquan Lu, lugq10@zju.edu.cn