Differences in impact of official development assistance on foreign direct investment by aid types
 Saori Ono
 Takashi Sekiyama
- Graduate School of Advanced Integrated Studies in Human Survivability, Kyoto University, Kyoto, Japan
This study examined the impact of Official Development Assistance (ODA) on Foreign Direct Investment (FDI) by aid type, which has been largely overlooked in previous studies. Using the Generalized Method of Moments with a gravity model, five major donor countries (France, Germany, Japan, the United Kingdom, and the United States) and 63 recipient country pairs from 1996 to 2020 were analyzed. Granger causality tests, impulse response analyses and variance decomposition analyses using a panel vector autoregressive model were conducted to identify causal relationships in the time series and to quantitatively capture the impact. The results suggest that ODA Loans from Germany, Japan, and the United Kingdom promote FDI. Their ODA Loans have a high proportion of economic infrastructure and productive-sector support. Hence, their ODA Loans may attract FDI to recipient countries by developing infrastructure in recipient countries such as transportation, telecommunications, energy, and finance. This study contributes to an academic community by highlighting the differences of aid type in attracting FDI and provides practical implications for policymakers and practitioners in the field of international development.
1. Introduction
The Organization for Economic Co-operation and Development (OECD, 2002) has encouraged Foreign Direct Investment (FDI) because it brings profits to both investors and investee countries and plays a crucial role in international economy. According to the World Bank (2021), FDI brings increased investment, exports, employment, new technologies and business practices to host nations, and the bank has provided international support to attract FDI.
The OECD (2020) defines Official Development Assistance (ODA) as government aid that facilitates the development of economy and welfare in developing countries. ODA is important for developing countries to overcome bottlenecks in their economic growth. The impact of ODA on FDI has been studied, beginning with Karakaplan et al. (2005), but the relationship is still not well understood. Moving from ODA to FDI would be beneficial for both donors and recipients; thus, understanding what form of ODA attracts FDI is critical.
ODA can be categorized into three main forms: Loans, Grants, and Technical Cooperation. ODA Loans are concessional (OECD, n. d.) and, in other words, they have very low or no interest rates. For Grants, the OECD defines “Grants are transfers made in cash, goods, or services for which no repayment is required (OECD, 2013a).” Technical Cooperation encompasses subsidies for education and training of nationals of developing countries, and payments for consultants and advisers working for them (OECD, 2013b).
While previous research has studied the ODA's effect on FDI (Ono and Sekiyama, 2022), few studies exist that verify the effects of different forms of ODA on FDI. Loans, Grants and Technical Cooperation are all ODA, but they focus on different areas. Additionally, the impact on economy of a recipient country will differ between Loans, which require repayment, Grants, and Technical Cooperation, which does not require repayment. Therefore, the purpose of this study is to determine whether there are differences in the impact of different aid types on FDI in order to elucidate new mechanisms by which ODA promotes or suppresses FDI. Moreover, by providing new insights into the ODA's impact on FDI by aid type, this study contributes to the academic community in terms of research novelty but could also provide important suggestions that may lead to more effective ODA policies.
In this study, the generalized method of moments (GMM) with a gravity model was used to estimate the relationship between ODA and FDI from five major donor countries [France, Germany, Japan, the United Kingdom (the UK), and the United States (the US)] to 63 developing countries between 1996 and 2020. Additionally, this study used less arbitrary methods, such as the Granger causality tests, impulse response analyses and variance decomposition analyses with a panel VAR model, to conduct a more robust analysis. The rest of this study consists of the following: Section 2 is a literature review; Section 3 presents the analytical methodology; Section 4 shows the data; Section 5 describes the results; Section 6 shows the discussion; and Section 7 presents the conclusions.
2. Review of the literature
Previous studies have investigated the relationship between ODA and FDI, but there is no consensus on it. Karakaplan et al. (2005) argued that a positive relationship between ODA and FDI is found when the investment environment in a recipient country is favorable, but some studies have found negative relationship between ODA and FDI. Harms and Lutz (2006) analyzed data between 1988 and 1999 and found that ODA generally does not affect FDI, but it does promote FDI in countries where firms face significant regulation burdens. Kimura and Todo (2010) estimated whether ODA facilitates FDI for 227 country pairs between 1990 and 2002. They found that the effect of ODA on FDI is not significant in general, but solely Japanese ODA encourages its outward FDI.
Previous studies also showed the negative relationship between ODA and FDI; Beladi and Oladi (2006) theoretically demonstrated a “crowding-out effect” in which ODA suppresses FDI. Kang et al. (2011) conducted a GMM estimation for 7 donor countries and 24 recipient country pairs between 1980 and 2003. They found that ODA has a substitution effect to FDI except for the ODA from Japan and Korea. In particular, Dutch ODA is mainly humanitarian aid and is a strong alternative to FDI. Selaya and Sunesen (2012) tested the data for 186 developing countries from 1970 to 2001 and concluded that there is no clear relationship with ODA and FDI. However, they noted that ODA attracts FDI when it is used for infrastructure and human capital. They also insisted that ODA crowds out FDI when ODA is a transfer of physical capital. Liao et al. (2020) analyzed a sample of B&R countries until 2017. This analysis found that aid for complementary sectors promotes FDI, while physical capital aid crowds out FDI. They also confirmed that that the effects of total aid on FDI are significantly negative. By contrast, in special circumstances such as post-conflict, ODA has been shown to promote FDI. Garriga and Phillips (2014) analyzed post-conflict countries from 1973 to 2008. They found that ODA attracts FDI to post-conflict countries while the ODA from the US is negatively correlated with FDI.
There are a lot of regional studies on the connection of ODA and FDI in recent years; Teng (2021) conducted a random-effects model analysis and GMM estimation for 50 African countries between 1993 and 2011. The results indicated that in International Development Association (IDA) countries with low levels of development, ODA and concessional debt promote FDI, whereas neither ODA nor concessional debt has a significant relationship with FDI in International Bank for Reconstruction and Development (IBRD) countries with high levels of development, indicating that economic growth plays a more important role in attracting FDI inflows. Aluko (2020) conducted GMM estimation using panel data for 47 African countries from 1996 to 2016 and found that the effect of ODA in attracting FDI is higher for countries with high quality institutions and sound development of finance. Quazi et al. (2019) conducted their analysis on 19 Latin American countries from 1996 to 2017 and found that the relationship between ODA and FDI is not clear. They also found that multilateral aid increases FDI, but not bilateral aid.
While previous research about the ODA-FDI relationship has been examined by sector and region, no analysis of ODA effectiveness by aid type has been conducted. Are there differences in the impact of ODA on FDI according to aid type? To answer this research question, this study examines the ODA impact from 5 major donor countries by aid type, using data from 63 recipient countries between 1996 and 2020.
3. Methodology
3.1. Estimation by gravity model
The estimation was performed with GMM using an equation that applies the gravity model. Blonigen and Piger (2014) conducted a systematic investigation of the determining factors of FDI. Their results showed that gravity model variables are FDI's major determining factors. In contrast, they argued that the gravity model cannot account for vertical FDI motives. Therefore, in order to express vertical FDI motives, the gravity model in this study includes the differences in the logarithm of per capita GDP between the investing and recipient countries as Kimura and Todo (2010). Karakaplan et al. (2005) showed that ODA attracts FDI in countries with good governance. Accordingly, governance indicators of recipient countries were also included in the model as variables using the Worldwide Governance Indicator (WGI) (Kaufmann et al., 2010).
3.1.1. Model
In this study, the gravity model is as follows:
i represents a donor country, j shows recipient country, t indicates period (year) and l shows a lag in Equation (1). Due to the wide variation in FDI and ODA disbursement amounts, 3-year moving average data set was used to identify trends. A one-period lag was used for all variables, except the aid variables, to consider the time lag of the variables' impact on FDI. For the aid variables, four types of analyses were conducted with one-, three-, six-, and nine-period lags, considering that the time lag in their impact on FDI varies depending on the type of ODA. ln indicates that the variable is the natural logarithm. FDIij is a flow of real FDI from i to j, and AIDij is a flow of real ODA disbursements from i to j. GDPi and GDPj are a real GDP in i and j. GOVj is a total of the six indicators [(I) Voice and Accountability; (II) Political Stability and Absence of Violence; (III) Government Effectiveness; (IV) Regulatory Quality; (V) Rule of Law; and (VI) Control of Corruption] of WGI for country j (Kaufmann et al., 2010). DIFij is the log difference between i and j in real GDP per capita. DISTij is a distance among capitals of i and j. αij denotes a country-pair fixed effect, μt shows a year effect and εijt indicates an error term.
Some types of aid variables were used as AIDij in Equation (1) to examine ODA's impact by aid types and donors. First, to estimate the ODA impact from all donors, the total ODA for country j from all donors, AID_Allj, was employed. Additionally, to analyze the impact of aid type, the estimates were divided into Loans (Loan_Allj), Grants (Grant_Allj), and Technical Cooperation (Tech_Allj) from all donors to country j. The rationale behind this approach considered that Technical Cooperation is included in Grants in OECD.Stat, the value obtained by subtracting Technical Cooperation from Grants was used as the Grants variable in this study.
Next, to examine ODA's impact from major donors, the same types as the first estimation (AIDij, Loanij, Grantij, Techij) were used. To eliminate ODA's impact of countries other than i, a variable subtracting the amount of ODA in country i from the total ODA of all donors was also added (NAIDij).
Regarding the relationship between exports and FDI, Bricongne et al. (2022) showed that horizontal FDI is a substitute for exports while vertical FDI is a complement to exports, indicating that the effects of exports on FDI are mixed. An estimation of Equation (1) with an export variable was performed, and since the export variable was not significant, it was determined that the effects of exports were mixed and was not included in the estimation for this study.
3.1.2. Estimation method
The system GMM (Blundell and Bond, 1998) and two-step estimation were used to estimate the model. The endogenous variables were all the explanatory variables other than DISTij, αij, μt, and εijt in Equation (1), and instrumental variables were lagged endogenous variables. Robust corrections were performed during the estimation to correct the problem of heteroskedasticity. Moreover, the GMM requires that the instrumental variables be in orthogonality with the error terms and error terms not be autocorrelated. Therefore, Hansen test to examine validity of the instrumental variable and Arellano-Bond test to verify autocorrelation of error terms were conducted. In order to verify the multicollinearity, the Variance Inflation Factor (VIF) was performed.
3.2. Estimation by panel VAR model
As Gravity models identify explained variables in accordance with theory, they have the drawback of being relatively arbitrary. Panel VAR models that are relatively less arbitrary were used to compensate for this shortcoming. Additionally, the VAR model examined only the types of ODA that were significant in the GMM estimation. Granger causality tests was performed to verify causal relationships using panel VAR models. Impulse response analyses and variance decomposition analyses also used to describe how much ODA influences FDI.
3.2.1. Model
In this study, the panel VAR model is as follows:
x, y, μ, ε, and Γ are an aid variable, In FDI, a constant, a error term and a coefficient, respectively. p, i, j, and t show a lag order, a donor country, a recipient country and period (year). Optimal value for p was decided by Akaike Information Criterion (AIC) (Akaike, 1998). As Wooldridge (2012) recommended a lag order of one or two for the annual data, lag 1 or 2, this study used lag 1 or 2 with the lowest value by AIC.
It is necessary to perform a panel unit root test to examine if a variable is stationary or not before using a panel VAR model. While a stationary variable is used directly in the model, a non-stationary variable is transformed to first-order differences before incorporating into the model. The LLC test (Levin et al., 2002) is used as the panel unit root test in this study.
3.2.2. Granger causality test
Equation (4) shows that “there is no Granger causality from X to Y” (Rossi and Wang, 2019). To examine the overall trend of Granger causality in the target countries, all coefficients were assumed to be common (Kim et al., 2018).
3.2.3. Impulse response analysis
Impulse response analysis shows how an innovation of an aid variable with one standard deviation affects FDI variable over 10 years. Ninety-five percentage confidence interval was also calculated (Efron and Tibshirani, 1993).
3.2.4. Variance decomposition analysis
Variance decomposition clarifies how much influence that FDI variable and an aid variable have on the variation of the FDI variable.
4. Data
Panel data for pairs of 63 recipient countries (Supplementary Table A1) and 5 major donors between 1996 and 2020 were used in this study (Supplementary Tables A2, A3). Nominal FDI data and nominal ODA data were taken from OECD.Stat. The nominal values were transformed to real values using the proportion of nominal GDP to real GDP (2015 baseline) of recipient countries obtained from World Development Indicators (WDI). Data on GDP per capita were also taken from WDI. Governance indicators were obtained from WGI, and the distance between two capital cities was obtained from CASIO.
To convert the data to natural logarithm, the data before transformation be at least 1. However, since the smallest FDI value targeted in this study was <1, a constant value was added to all FDI values to ensure that the minimum FDI value is 1. The other variables with a minimum value <1 were processed in the same manner.
During the study period, ODA from the 5 donor countries accounted for 51% of the total ODA from all donors to the 63 recipient countries covered by this study. The data covered by this estimation is 56% of France's ODA, 55% of Germany's ODA, 69% of Japan's ODA, 39% of UK's ODA, and 39% of the US's ODA from 1996 to 2020. Figure 1 shows the percentage of each donor country for each form of ODA.
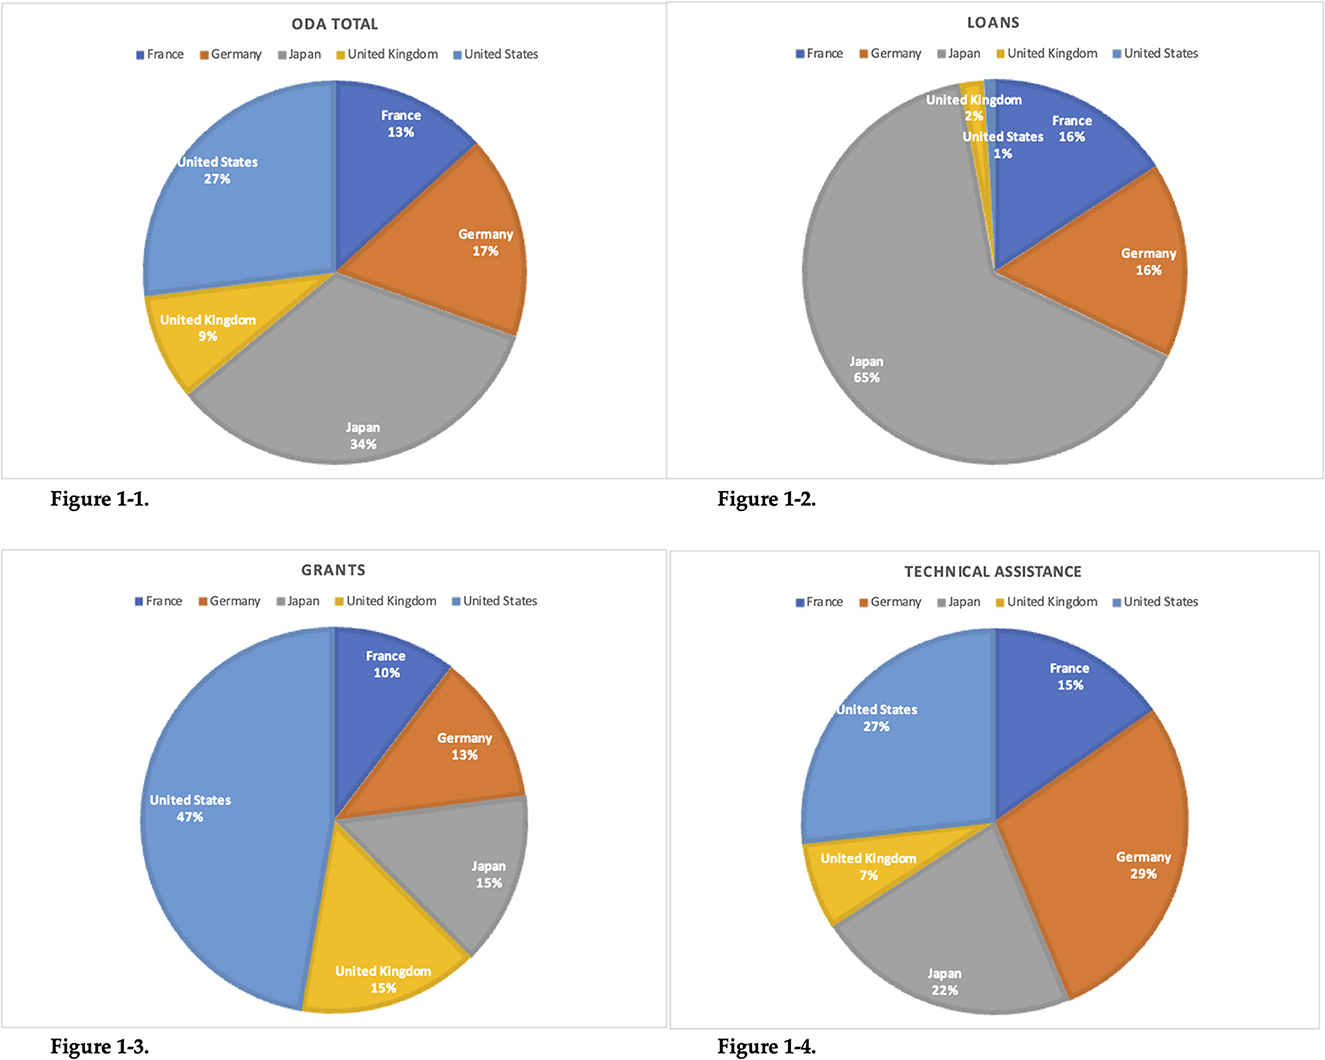
Figure 1. Percentage of donor countries by aid type. Sources: Created by the author on the basis of OECD.Stat.
5. Results
5.1. GMM estimation results
First, a gravity model was estimated by GMM for (1) the effects of ODA from all donors on FDI of the 5 donor countries by type of ODA, and (2) the effects of ODA from 5 donor countries on their respective FDI by type of ODA. Tables 1–8 show the coefficients, and the adjusted standard errors are shown in parentheses. In the tables, (p q) is shown when the period from t-p to t-q is used for the lag. For the Arellano-Bond and Hansen tests, p-values were shown on the tables. Multicollinearity in each model was also examined; if the Variance Inflation Factor (VIF) was not <10, there was a possibility that multicollinearity was present and distorted the estimation results.
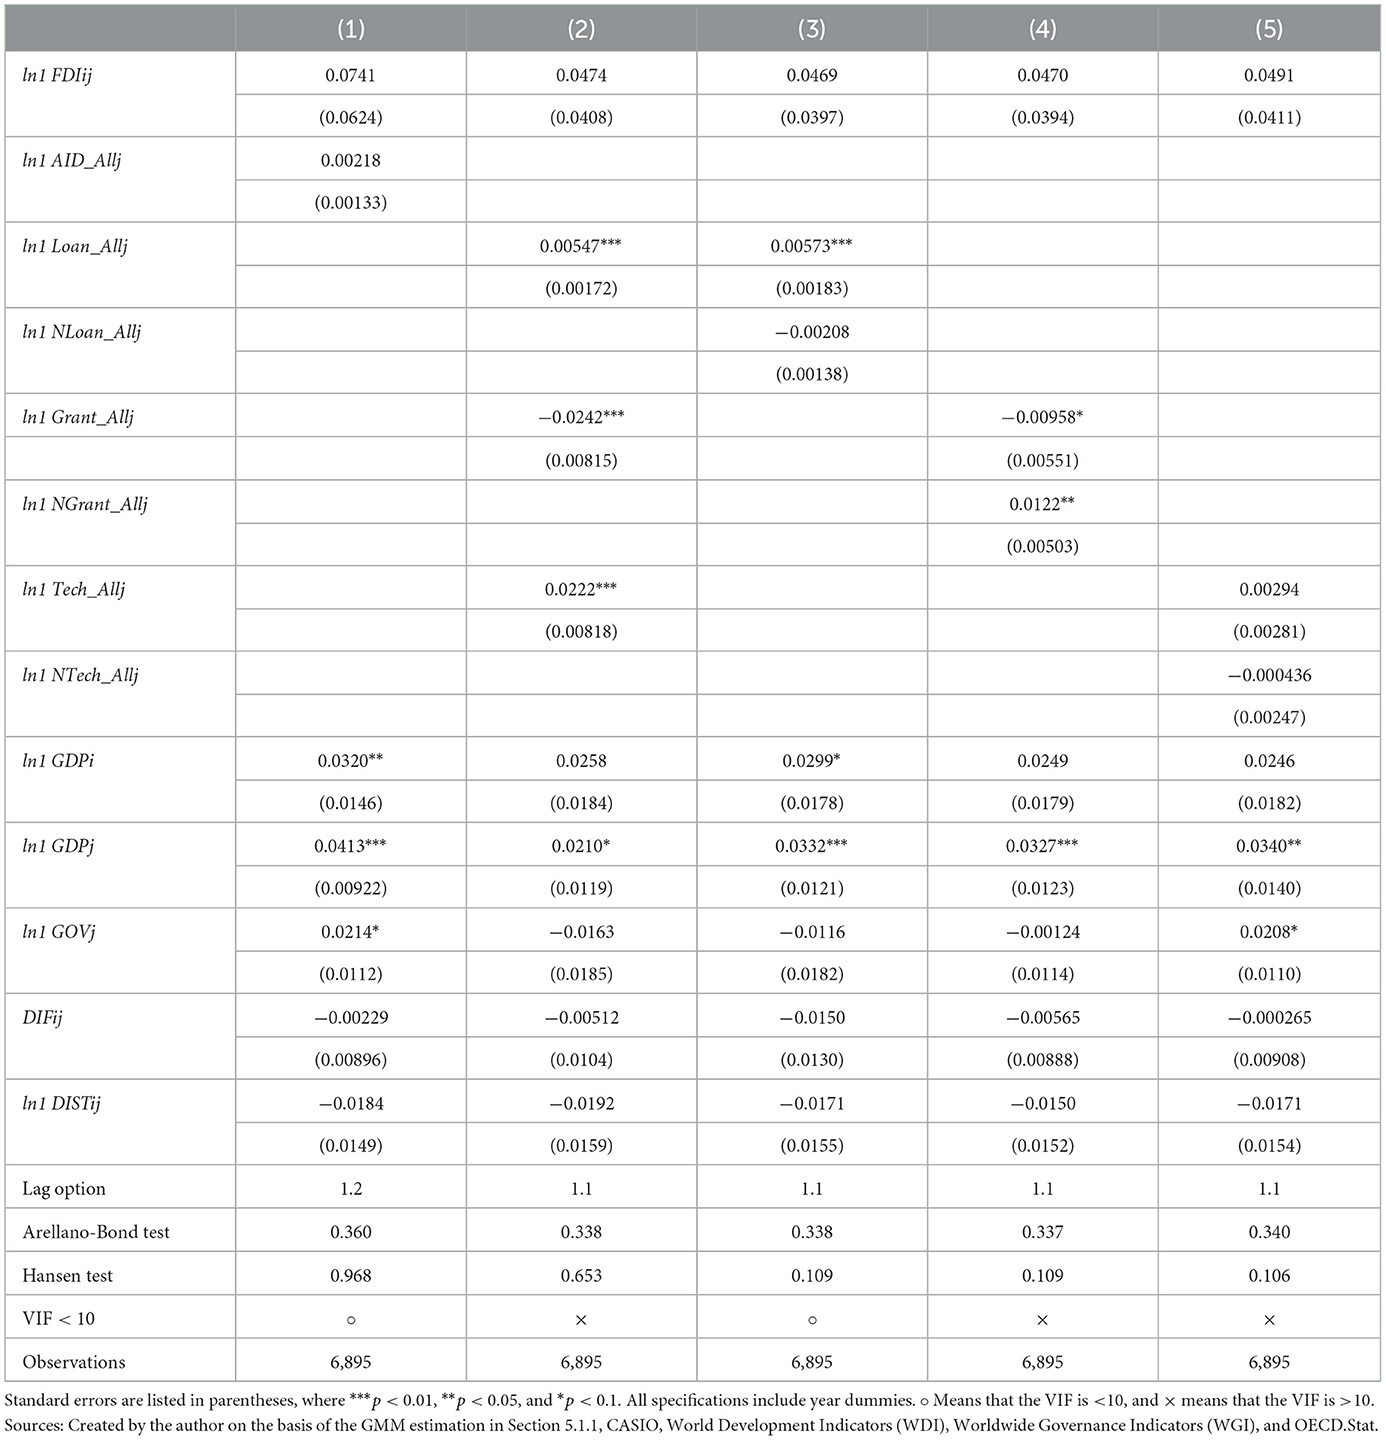
Table 1. Results of GMM estimation (1): Lag 1.
5.1.1. All donors' ODA
First, the impact of the total amount of ODA (AID_Allj), Loans (Loan_Allj), Grants (Grant_Allj), and Technical Cooperation (Tech_Allj) from all donors on FDI from major donor i to recipient country j (FDIij) was estimated. To control for the impacts of other forms of ODA, a variable subtracting each type of aid from the total ODA was also used (NLoan_Allj, NGrant_Allj, and NTech_Allj). The results are shown in Tables 1–4. Among them, only Table 3 (2) showed a rejected Hansen test at the level of <5%, indicating that the assumption of the GMM estimation was not met. Except for Table 3 (2), the p-values of both the Arellano-Bond and Hansen tests were >5% in any of the estimations, and the assumptions of the GMM estimation were satisfied. However, Tables 1, 2 (2), (4), and (5), Table 3 (2) and (4), and Table 4 (2) may have distorted the results because their VIF was >10. Therefore, Tables 2, 3 (1) and (3), Table 3 (1), (3), and (5), and Table 4 (1) and (3)–(5) show reliable results. The results reveal that among all the aid variables from Tables 1–4, only the positive effect of Loans is significant at a p-value of <5% [Tables 1–4 (3)].
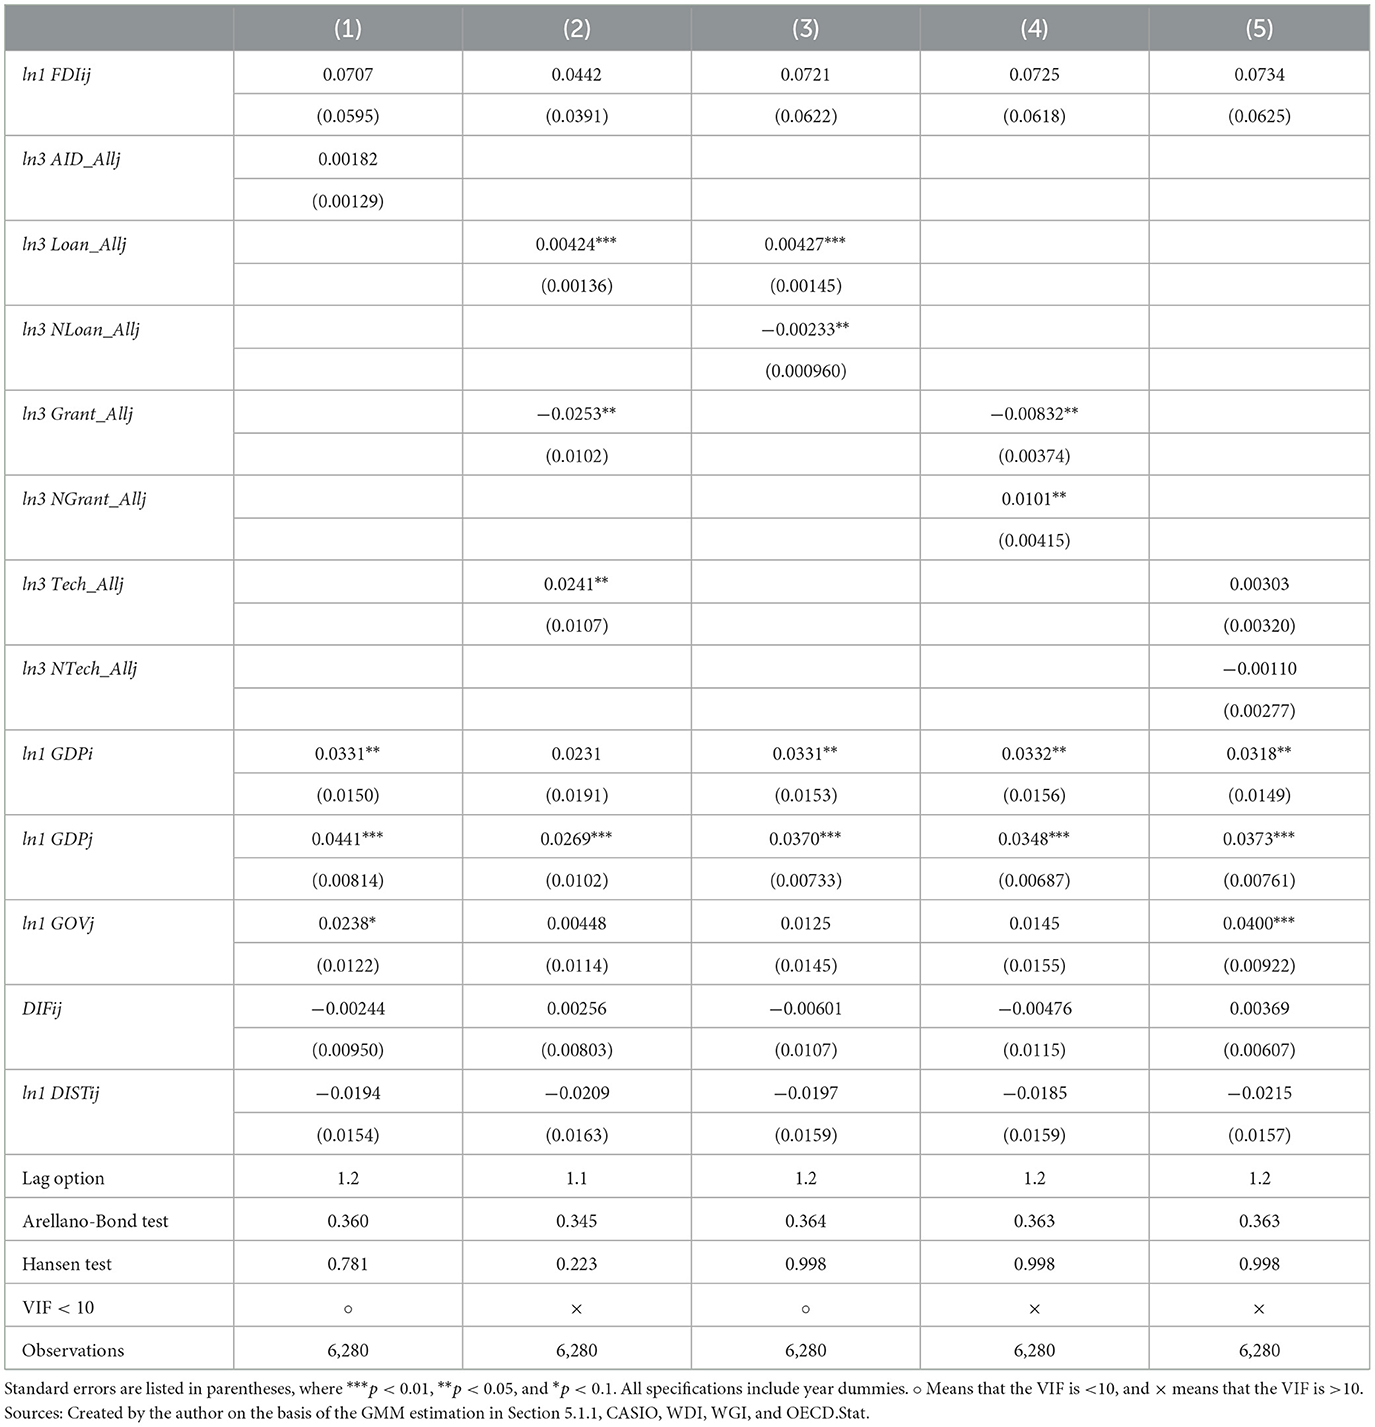
Table 2. Results of GMM estimation (2): Lag 3.
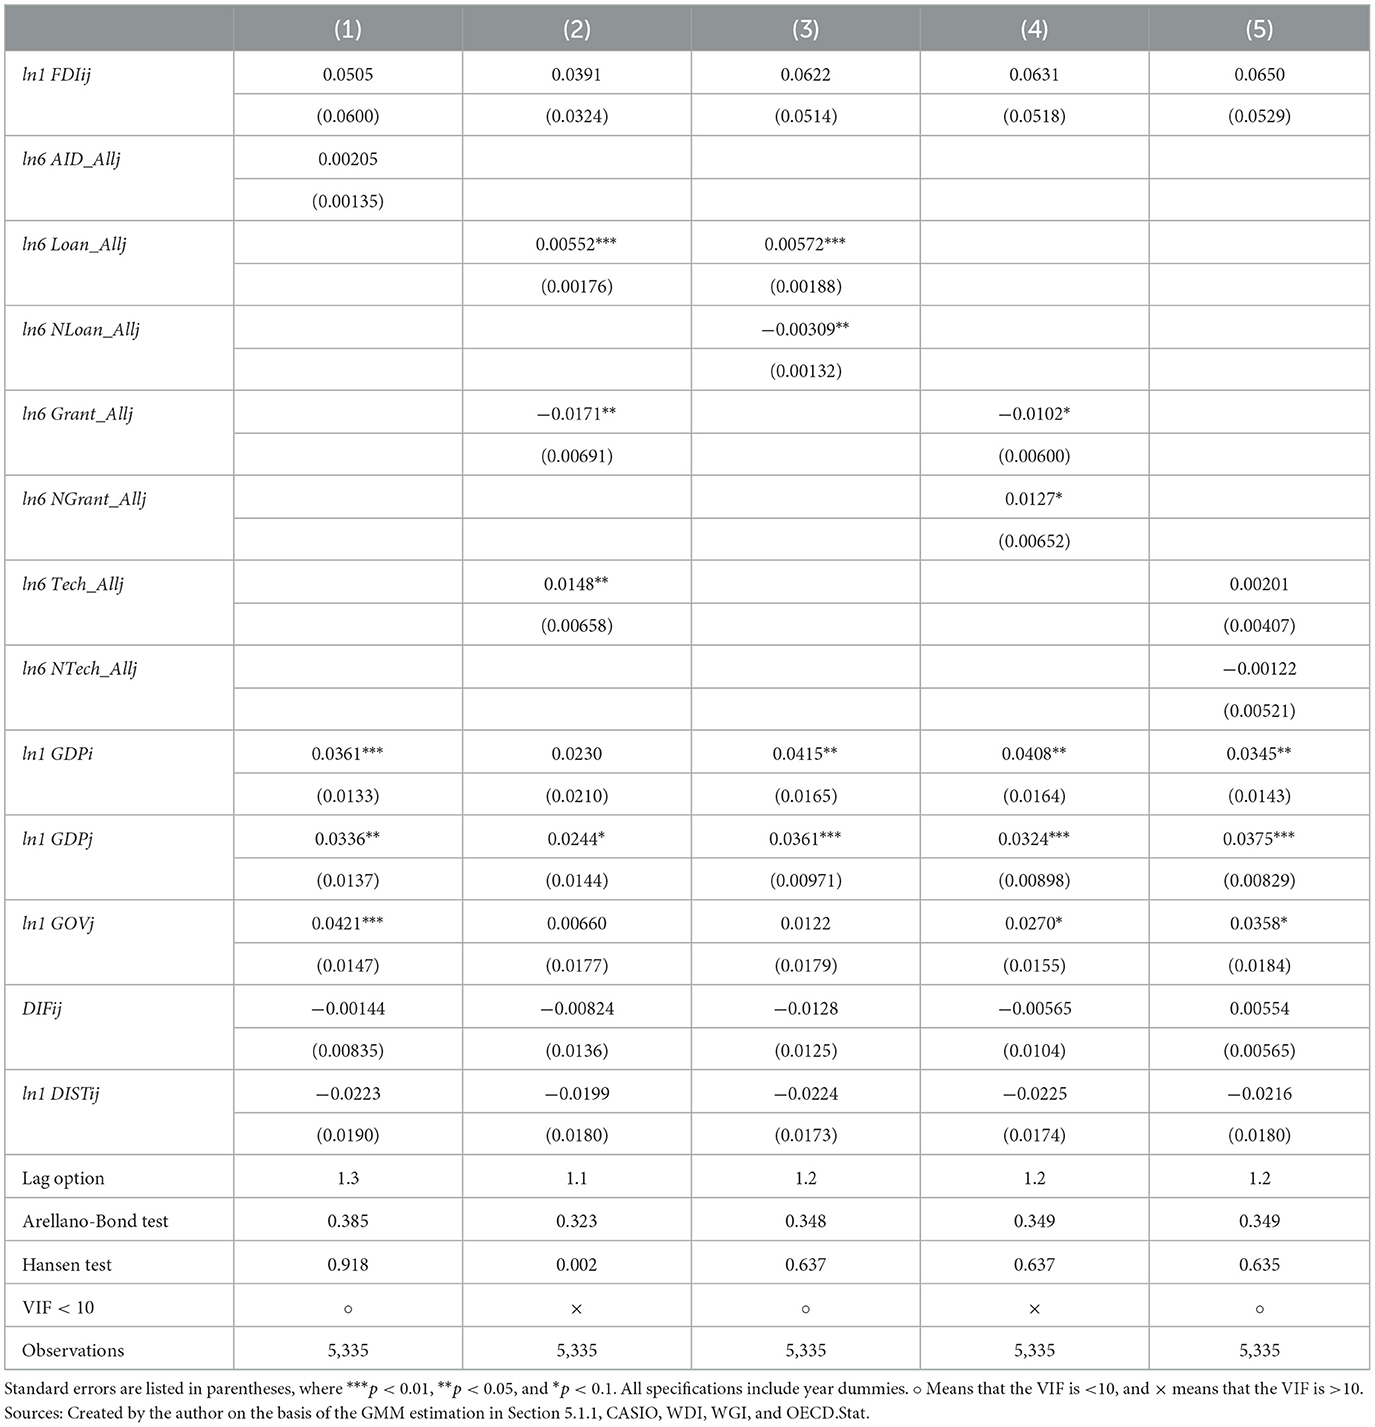
Table 3. Results of GMM estimation (3): Lag 6.

Table 4. Results of GMM estimation (4): Lag 9.
5.1.2. Five major donor countries' ODA
Next, this study estimated the impact of the total amount of ODA (AIDij), Loans (Loanij), Grants (Grantij), and Technical Cooperation (Techij) from major donor country i to country j on FDI from major donor country i to country j (FDIij). To control for the effects other than each type of ODA, a variable subtracting each type of ODA from the total ODA was also used (NLoanij, NGrantij, and NTechij). Additionally, a variable subtracting the total ODA of country i from the total ODA of all donors was also included in the estimation (NAIDij) for controlling the ODA impacts from donor countries other than country i. From Tables 5–8, the Hansen test in Table 7 (3) and (4) and Table 8 (1), (2), and (5) were rejected at a level of <5%, which means that the assumptions of the GMM estimation were not met. For the other estimations, the p-values of both the Arellano-Bond and Hansen tests were >5%, thus satisfying the assumptions of the GMM estimation. Additionally, all the estimates in Tables 5–8 had a VIF of below 10 and no collinearity problems. Therefore, Tables 5, 6 (1)–(5), Table 7 (1), (2), and (5), and Table 8 (3) and (4) show reliable results. The results show that in all of the aid variables from Tables 5–8, only the effect of Loans is positively significant at a p-value of <5% [Tables 5, 7 (2); Tables 6, 8 (3)].
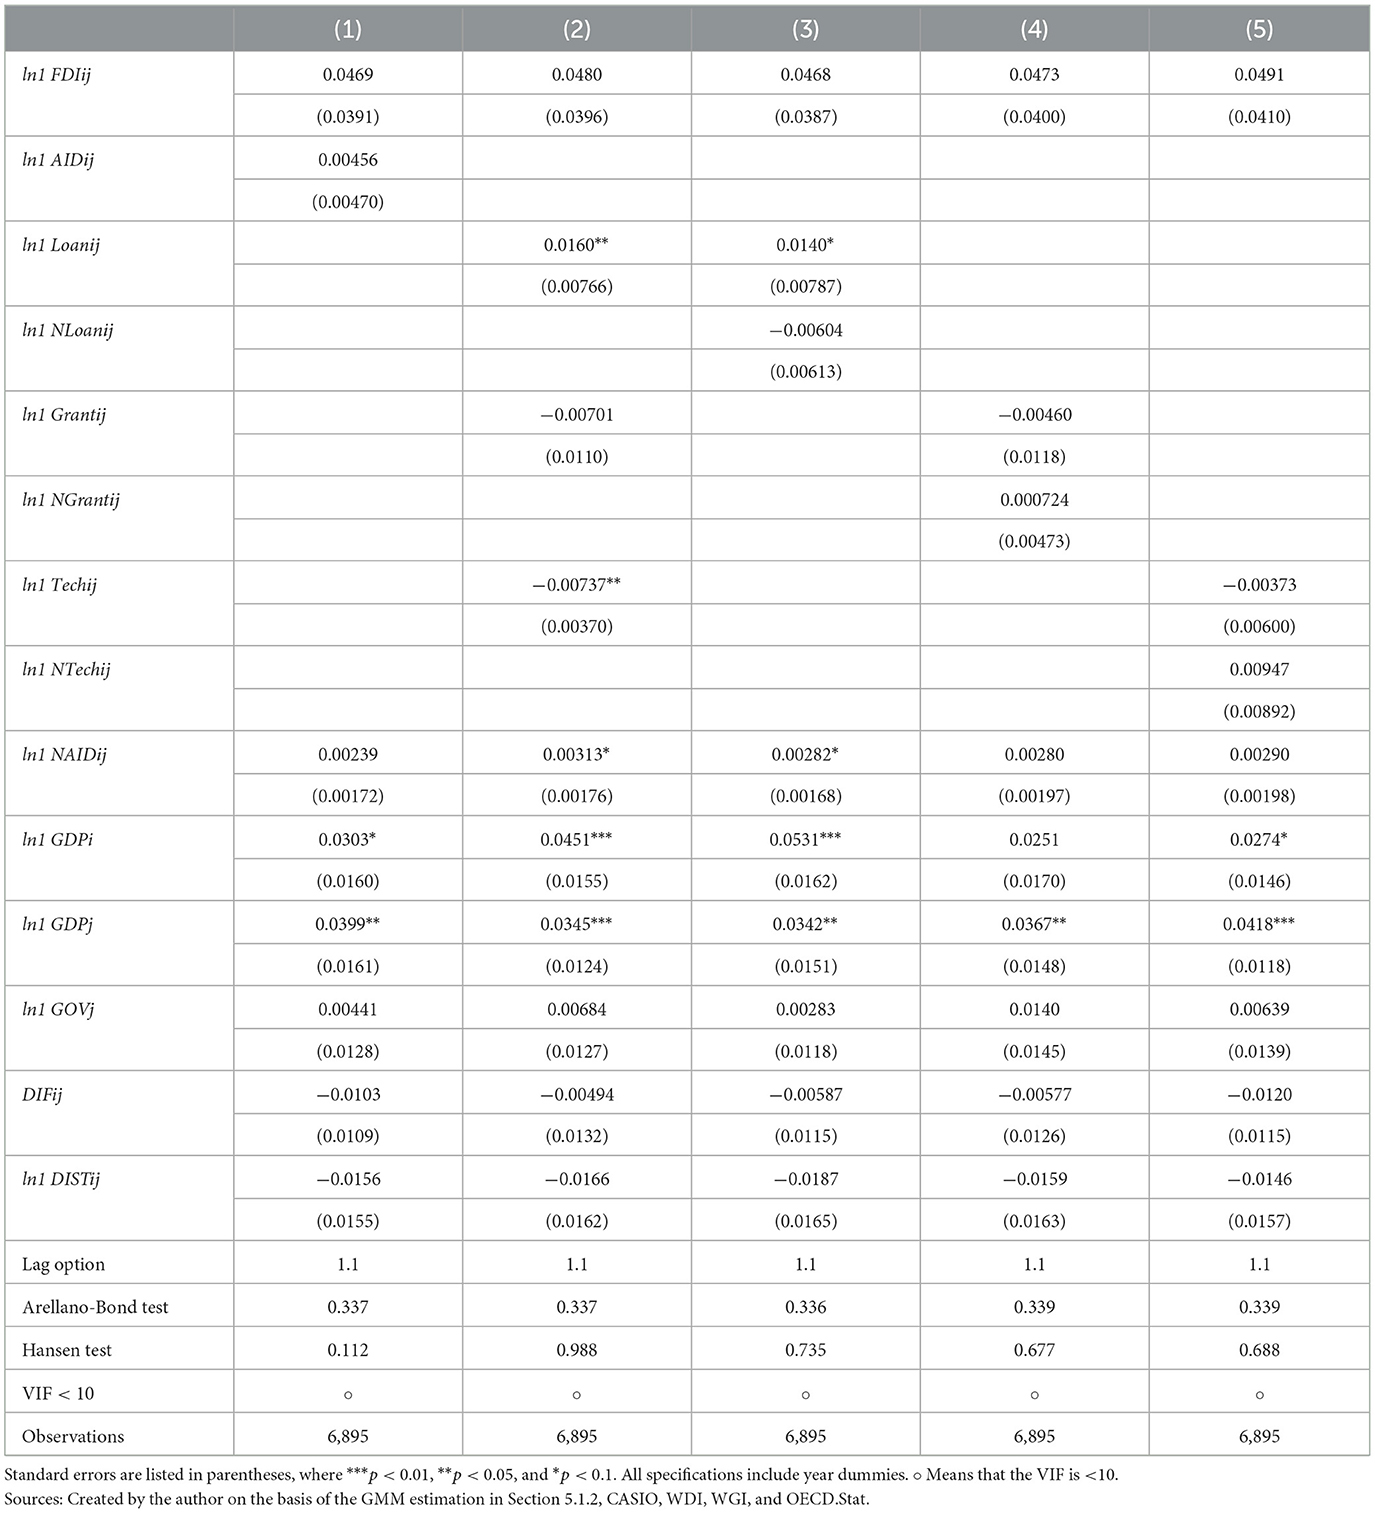
Table 5. Results of GMM estimation (5): Lag 1.

Table 6. Results of GMM estimation (6): Lag 3.

Table 7. Results of GMM estimation (7): Lag 6.

Table 8. Results of GMM estimation (8): Lag 9.
5.1.3. Each major donor country's ODA
In Section 5.1.2, the positive effect of major donor countries' Loans on FDI in recipient countries is significant. Therefore, to determine which country's Loans promote FDI, the effects of Loans from each major donor country on its FDI were estimated. However, since the results of the Arellano-Bond test were not reliable owing to the rejection of the p-value at the level of <5%, only the panel VAR model results are discussed in the next section of this study.
5.2. Verification by panel VAR model
To test whether the ODA identified in Section 5.1 has an effect on FDI, a panel VAR model was used. The results show:
• Loans from all donors (Loan_Allj) have a positive effect on FDI in the five major donor countries.
• Loans from five major donor countries (Loanij) have a positive effect on their FDI.
Additionally, estimates were also conducted for each donor country to determine which country's Loans promoted FDI.
5.2.1. Unit root test
Regarding panel unit root tests, Table 9 lists the results. P-value of every test was below 0.05. Therefore, all the variables were considered stationary.
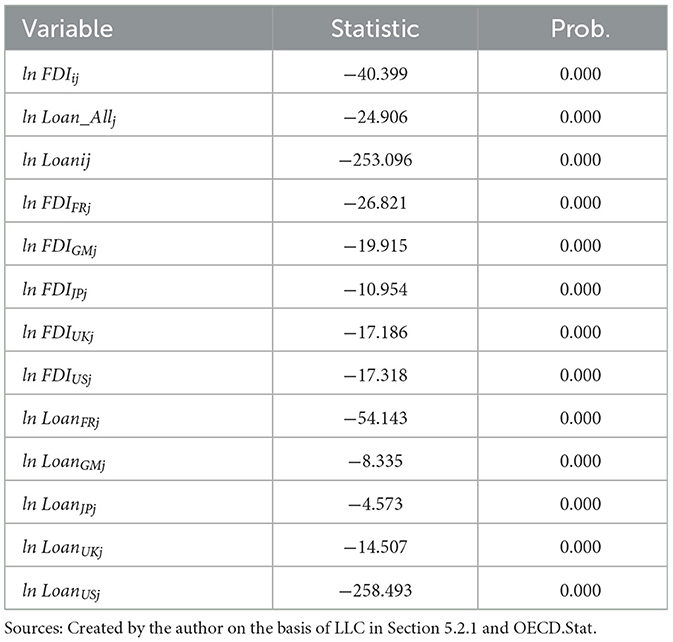
Table 9. Results of panel unit root tests.
5.2.2. Lag length test
Table 10 presents the AIC values. Lowest AIC value lag were used.
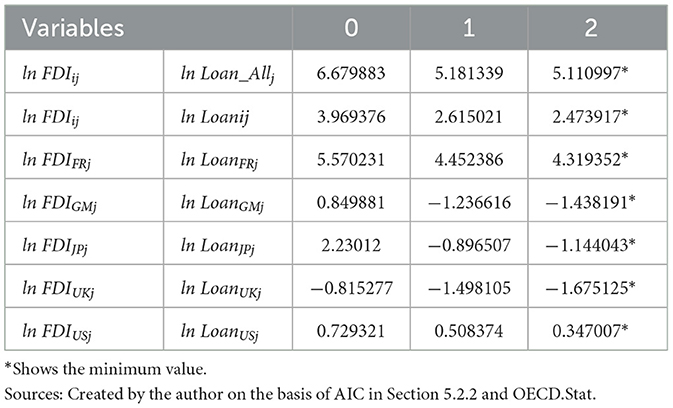
Table 10. Results of lag length selections.
5.2.3. Granger causality test
Regarding panel Granger causality tests, Table 11 presents the results. Table 11 indicates that the p-value of following effects were below 0.05:
• Granger causality from major donors' Loans to their FDI.
• Granger causality from Germany's Loans to its FDI.
• Granger causality from Japan's Loans to its FDI.
• Granger causality from UK's Loans to its FDI.
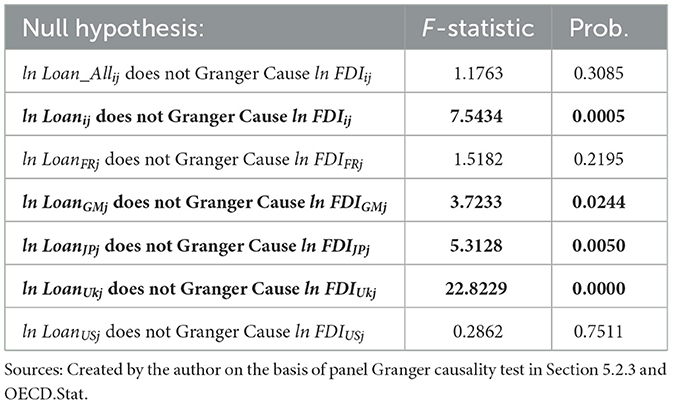
Table 11. Results of panel Granger causality tests.
5.2.4. Impulse response analysis
For the ODA that have effects on FDI according to Section 5.2.3 impulse response analyses were performed. The results are described in Figure 2. At the top of each graph in Figure 2, “variable x → variable y” is shown.

Figure 2. Response of y to x Cholesky One S.D. Innovation (x → y) 95% CI. Sources: Created by the author on the basis of impulse response analysis in Section 5.2.4.
The following results were significant from the impulse response analysis:
• Positive effects after the third year from Loans from major donor countries to FDI.
• Positive effects after the third year from Germany's Loans to its own FDI.
• Positive effects after the third year from Japan's Loans to its own FDI.
• Positive effects after the second year from UK's Loans to its own FDI.
5.2.5. Variance decomposition analysis
Variance decomposition analyses were also conducted for the ODA that have effects on FDI according to Section 5.2.3. The results are described in Table 12. Table 12 shows the percentage contribution of that a FDI variable and an aid variable to the change of the FDI variable. The following results were shown by the variance decomposition analyses:
• Loans from major donor countries contributed up to 0.16% to the change of their FDI.
• Loans from Germany contributed up to 1.56% to the change of its FDI.
• Loans from Japan contributed up to 1.50% to the change of its FDI.
• Loans from Germany contributed up to 6.37% to the change of its FDI.
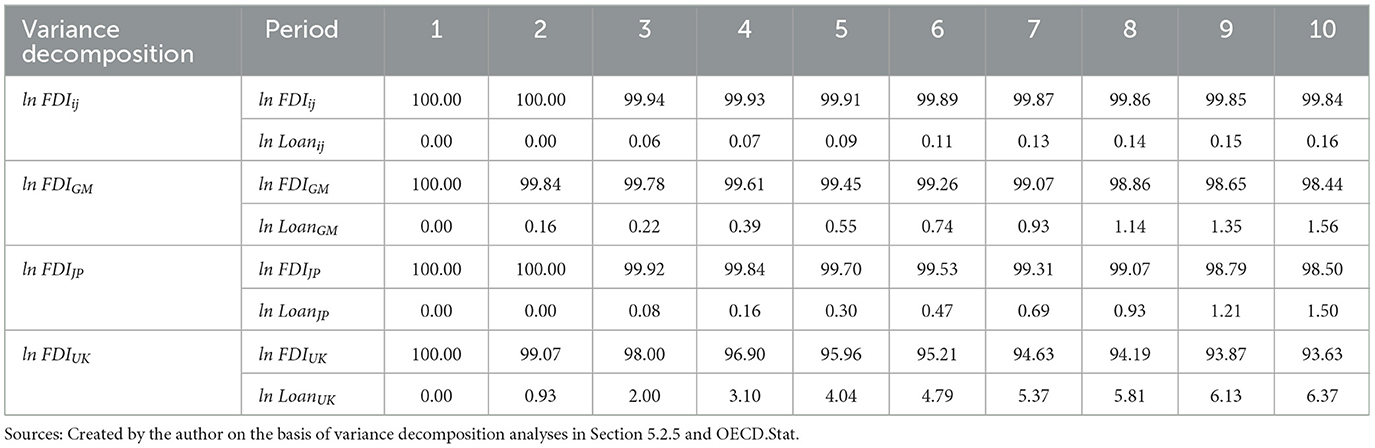
Table 12. Results of variance decomposition analyses.
6. Discussion
The ODA's impact on FDI by aid type was examined for ODA and FDI from five major donor countries to 63 recipient countries, between 1996 and 2020. In all estimations conducted in this study, the positive effect of major donors' Loans on their own FDI was significant. The country-specific analysis of the panel VAR model also found significant positive effects of Germany, Japan, and UK's Loans on their own FDI. Thus, the positive effect of major donor countries' Loans on their own FDI can be attributed to the Loans of Germany, Japan, and the UK. This section explores the reasons for the results.
6.1. Tied ratio of each donor country's loans
One possible reason why German, Japanese, and the UK Loans promote FDI is their high tied ratio. This is because tidal ODA can directly attract firms from the donor country. Figure 3 shows the share of tied ODA for each donor country between 1996 and 2020. However, Figure 3 shows that the UK and Germany had the lowest tied ratios among the five countries, with the UK at 0% and Germany at 4%. Therefore, it can be said that the main reason Loans promote FDI is not the high tied ratio.
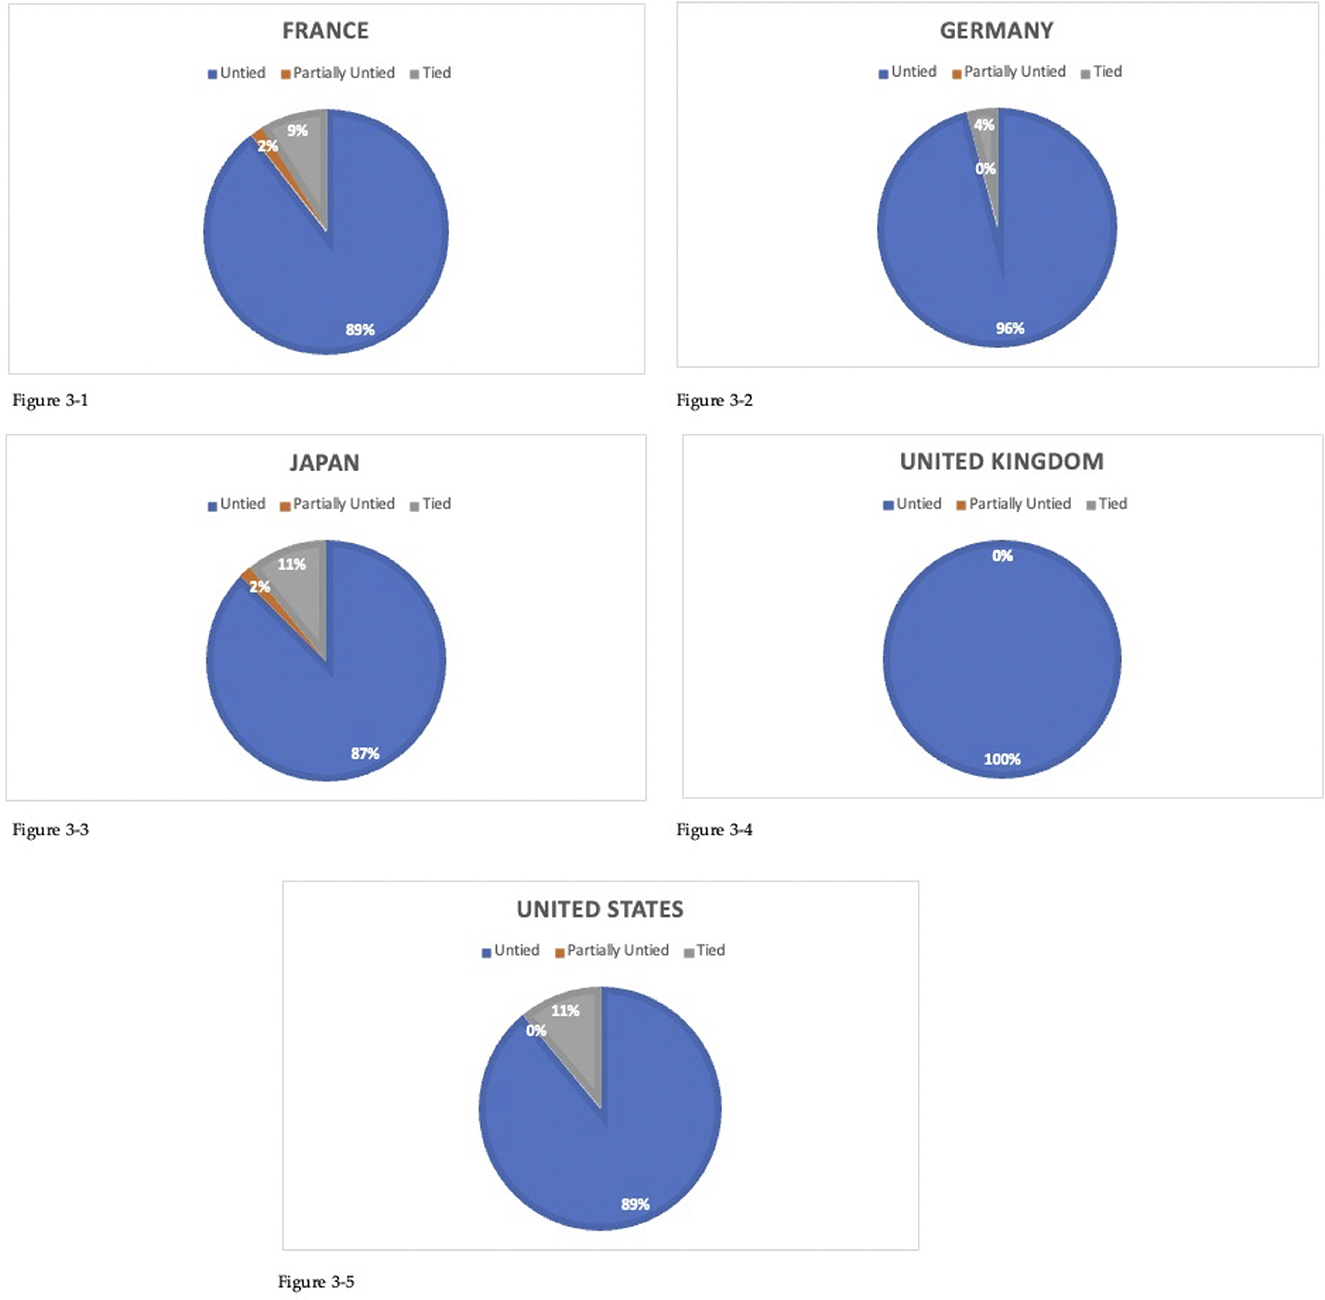
Figure 3. Tying status of ODA loan between 1996 and 2020. Sources: Created by the author on the basis of OECD.Stat.
6.2. Positive effects of economic infrastructure on FDI
Table 13 shows the breakdown of the major donor countries' Loans covered in this study by sector. Sector-specific data are available only after 2002, and Table 13 presents the total amounts from 2002 to 2020. For Germany, Japan, and the UK, where the positive effect on their FDI is significant in the VAR model analysis, Germany and Japan provide about half of the Loans to economic infrastructure, while the UK provides about half of the Loans to the productive and multi-sector, respectively (Table 13). The UK's ODA to the production sector includes the support for agricultural infrastructure (UKaid, 2022).
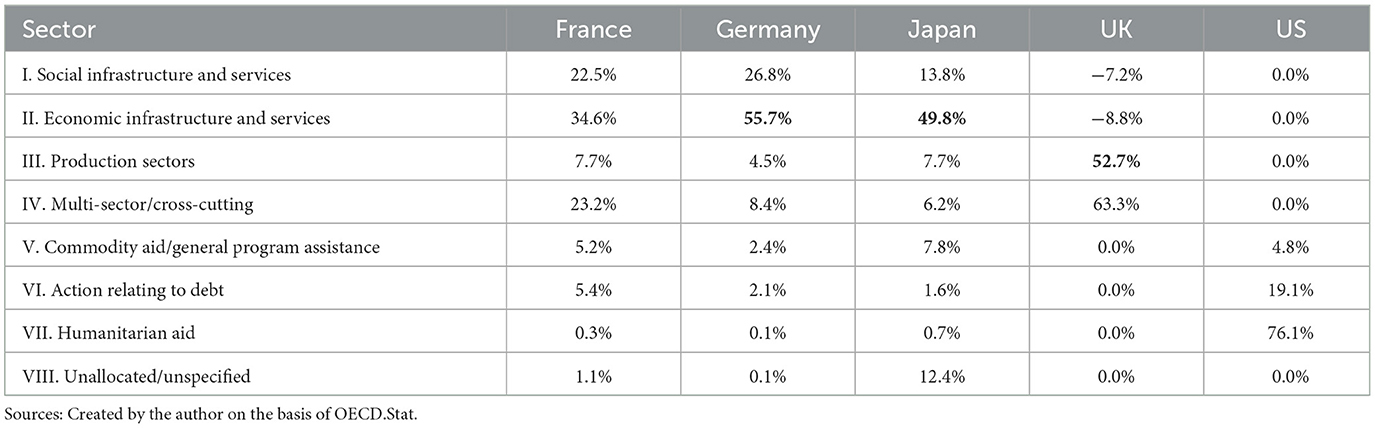
Table 13. Breakdown of loans for 63 countries by sector between 2002 and 2020.
However, Grants from the five major donor countries covered in this study are less likely to support the economic infrastructure and production sectors and are more likely to support social infrastructure and debt relief (Supplementary Table A4). Thus, as Donaubauer et al. (2016) demonstrate, ODA to economic infrastructure may promote FDI in recipient countries by providing transportation, communication, energy and financial infrastructure.
6.3. Limitations of this study
The effect of UK's Loans decreased after peaking in the fourth year in Section 5.2.4. However, the reasons for this decline are beyond the scope of this study and are not addressed in the discussion. Additionally, one possible reason why the positive effect of Loans on FDI was significant in this study is that countries with a certain level of GDP and growth rate are more likely to have Loans and FDI because they can repay their Loans, which may have led to erroneous results as if Loans promote FDI. However, this hypothesis is beyond the scope of this study and was not considered in the discussion. Furthermore, this paper alone could not provide a clear mechanism as to why ODA from German, Japanese, and the UK promotes FDI. It is expected that they will be clarified in future case studies.
Many recent studies in the aid literature have emphasized either different mechanism with respect to aid channels (whether aid is given directly to recipient governments or bypasses the government and goes directly to NGOs) and aid sectors (economic aid, soc./governance aid, and humanitarian aid). Some of these ways of disaggregating aid might prove especially fruitful given that certain types are more prone to corruption, which may influence investor decisions as well.
7. Conclusion
The impact of ODA on FDI by aid type was examined for ODA and FDI from five major donor countries to 63 recipient countries, between 1996 and 2020. In all estimations conducted in this study, the positive effect of major donors' Loans on their own FDI was significant. The country-specific analysis of the panel VAR model also found significant positive effects of Germany, Japan, and UK's Loans on their own FDI. Therefore, the positive effect of the major donor countries' Loans on their own FDI can be because of the Loans of Germany, Japan, and the UK. Their Loans may attract FDI in recipient countries by developing infrastructure such as transportation, telecommunications, energy and finance. The conclusions of this study are as follows:
• Germany, Japan, and UK's Loans are considered to promote their own FDI in recipient countries.
• Loans contributed up to 6% to the change of FDI.
• Loans may attract FDI in recipient countries by building infrastructure, such as transportation, telecommunications, energy and finance.
The results of this study may imply that increasing the weight of ODA to the economic infrastructure sector will promote FDI. This study is novel in that it clarifies the effects of major donor countries' ODA on FDI by aid type. However, the limitation of this study is that it only provides a judgment of existence a general trend at a level of statistical significance. Hence, it is expected that further research of individual cases using questionnaires and interviews will clarify the relationship between ODA and the investment decisions of individual companies. Further case studies on the mechanisms of the FDI-promoting effects of Loans from Germany, Japan, and the UK identified in this study would clarify what kind of ODA can induce FDI. This study is significant in that it clarified the mechanism by which ODA promotes FDI from a macro perspective. More detailed clarification of the mechanisms by which ODA promotes FDI in the future would help to make ODA policies more effective.
Data availability statement
The original contributions presented in the study are included in the article/Supplementary material, further inquiries can be directed to the corresponding author.
Author contributions
SO conceived the idea of the study, developed the statistical analysis plan, conducted statistical analyses, and drafted the original manuscript. TS supervised the conduct of this study. Both authors contributed to the interpretation of the results, reviewed the manuscript draft and revised it, and have read and agreed to the published version of the manuscript.
Funding
This work was supported by JST SPRING, Grant Nos. JPMJSP2110 and JSPS KAKENHI, Grant No. 20K01501.
Acknowledgments
We would like to thank Editage (www.editage.com) for English language editing.
Conflict of interest
The authors declare that the research was conducted in the absence of any commercial or financial relationships that could be construed as a potential conflict of interest.
Publisher's note
All claims expressed in this article are solely those of the authors and do not necessarily represent those of their affiliated organizations, or those of the publisher, the editors and the reviewers. Any product that may be evaluated in this article, or claim that may be made by its manufacturer, is not guaranteed or endorsed by the publisher.
Supplementary material
The Supplementary Material for this article can be found online at: https://www.frontiersin.org/articles/10.3389/fpos.2023.1149865/full#supplementary-material
References
Akaike, H. (1998). “Information theory and an extension of the maximum likelihood principle”, in Selected Papers of Hirotugu Akaike, Springer Series in Statistics, eds E. Parzen, K. Tanabe, G. Kitagawa (New York, NY: Springer), 199–213.
Aluko, O. A. (2020). The foreign aid–foreign direct investment relationship in Africa: the mediating role of institutional quality and financial development. Econ. Affairs 40, 77–84. doi: 10.1111/ecaf.12386
Beladi, H., and Oladi, R. (2006). Does foreign aid impede foreign investment? Economic Research Institute Study Papers. P. 332. Available online at: https://digitalcommons.usu.edu/eri/332
Blonigen, B. A., and Piger, J. (2014). Determinants of foreign direct investment. Canad. J. Econ. Revue canadienne d'économique 47, 775–812. doi: 10.1111/caje.12091
Blundell, R., and Bond, S. (1998). Initial conditions and moment restrictions in dynamic panel data models. J. Economet. 87, 115–143. doi: 10.1016/S0304-4076(98)00009-8
Bricongne, J.-C., Franco Bedoya, S., and Lopez Forero, M. (2022). The proximity-concentration trade-off with multi-product firms: are exports and FDI complements or substitutes? World Econ. doi: 10.1111/twec.13339
Donaubauer, J., Meyer, B., and Nunnenkamp, P. (2016). Aid, infrastructure, and FDI: assessing the transmission channel with a new index of infrastructure. World Dev. 78, 230–245. doi: 10.1016/j.worlddev.2015.10.015
Efron, B., and Tibshirani, R. J. (1993). An Introduction to the Bootstrap, Monographs on Statistics and Applied Probability. New York, NY: Chapman and Hall.
Garriga, A. C., and Phillips, B. J. (2014). Foreign aid as a signal to investors: predicting FDI in post-conflict countries. J. Confl. Resol. 58, 280–306. doi: 10.1177/0022002712467937
Harms, P., and Lutz, M. (2006). Aid, governance and private foreign investment: some puzzling findings for the 1990s. Econ. J. 116, 773–790. doi: 10.1111/j.1468-0297.2006.01111.x
Kang, S. J., Lee, H., and Park, B. (2011). Does Korea follow Japan in foreign aid? relationships between aid and foreign investment. Jpn. World Econ. 23, 19–27. doi: 10.1016/j.japwor.2010.06.001
Karakaplan, U., Neyapti, B., and Sayek, S. (2005). Aid and Foreign Direct Investment: International Evidence (Working Paper No. 2005/12). Discussion Paper.
Kaufmann, D., Kraay, A., and Mastruzzi, M. (2010). The Worldwide Governance Indicators: Methodology and Analytical Issues (SSRN Scholarly Paper No. ID 1682130). Rochester, NY: Social Science Research Network.
Kim, D.-W., Yu, J.-S., and Hassan, M. K. (2018). Financial inclusion and economic growth in OIC countries. Res. Int. Bus. Finan. 43, 1–14. doi: 10.1016/j.ribaf.2017.07.178
Kimura, H., and Todo, Y. (2010). Is foreign aid a vanguard of foreign direct investment? A gravity-equation approach. World Dev. 38, 482–497. doi: 10.1016/j.worlddev.2009.10.005
Levin, A., Lin, C.-F., and James Chu, C.-S. (2002). Unit root tests in panel data: asymptotic and finite-sample properties. J. Econometr. 108, 1–24. doi: 10.1016/S0304-4076(01)00098-7
Liao, H., Chi, Y., and Zhang, J. (2020). Impact of international development aid on FDI along the Belt and Road. China Econ. Rev. 61, 101448. doi: 10.1016/j.chieco.2020.101448
OECD (2002). Foreign Direct Investment for Development: Maximising Benefits, Minimising. Available online at: https://www.oecd.org/investment/investmentfordevelopment/foreigndirectinvestmentfordevelopmentmaximisingbenefitsminimisingcosts.htm (accessed December 20, 2021).
OECD (2013a). Grants Definition [WWW Document]. Glossary of Statistical Terms. Available online at: https://stats.oecd.org/glossary/detail.asp?ID=1143 (accessed October 26, 2022).
OECD (2013b). Technical Co-operation Definition [WWW Document]. Glossary of Statistical Terms. Available online at: https://stats.oecd.org/glossary/detail.asp?ID=2686 (accessed October 26, 2022).
OECD (2020). What Is ODA? Available online at: http://www.oecd.org/dac/financing-sustainable-development/development-finance-standards/What-is-ODA.pdf (accessed November 23, 2021).
OECD (n. d.). Official Development Assistance – Definition Coverage - OECD. Available online at: https://www.oecd.org/development/financing-sustainable-development/development-finance-standards/officialdevelopmentassistancedefinitionandcoverage.htm (accessed May 6 2023)..
Ono, S., and Sekiyama, T. (2022). Re-examining the effects of official development assistance on foreign direct investment applying the VAR model. Economies 10, 236. doi: 10.3390/economies10100236
Quazi, R., Ballentine, W., Bindu, F., and Blyden, L. (2019). Multilateral foreign aid, bilateral foreign aid, and foreign direct investment in latin America. Int. J. Econ. Finan. Issues 9, 284–290. doi: 10.32479/ijefi.7520
Rossi, B., and Wang, Y. (2019). VAR-based Granger-causality Test in the Presence of Instabilities. Economic Working Paper Series (1642), 15.
Selaya, P., and Sunesen, E. R. (2012). Does foreign aid increase foreign direct investment? World Dev. 40, 2155–2176. doi: 10.1016/j.worlddev.2012.06.001
Teng, L. (2021). Do foreign aid and concessional debts attract FDI flows into recipient countries? J. Dev. Areas 55, 49–59. doi: 10.1353/jda.2021.0078
UKaid (2022). India: Infrastructure Loan Fund - Small Loans to Bridge the Infrastructure Gap for the Poor [WWW Document]. Development Tracker. Available online at: https://devtracker.fcdo.gov.uk/projects/GB-1-202869/summary (accessed December 21, 2022).
Wooldridge, J. M. (2012). Introductory Econometrics: A Modern Approach 5th Edition. Mason: Cengage Learning.
World Bank (2021). Investment Policy and Promotion [WWW Document]. World Bank. Available online at: https://www.worldbank.org/en/topic/investment-climate/brief/investment-policy-and-promotion (accessed October 26, 2022).
Keywords: official development assistance, Foreign Direct Investment, Loans, panel data, gravity model, vector autoregressive model, Granger causality
Citation: Ono S and Sekiyama T (2023) Differences in impact of official development assistance on foreign direct investment by aid types. Front. Polit. Sci. 5:1149865. doi: 10.3389/fpos.2023.1149865
Received: 23 January 2023; Accepted: 06 April 2023;
Published: 19 May 2023.
Edited by:
Stephen Noakes, The University of Auckland, New ZealandReviewed by:
Miles Williams, Denison University, United StatesJohn Stephen Hoadley, The University of Auckland, New Zealand
Sarah Bradley, The University of Auckland, New Zealand, in collaboration with reviewer JH
Copyright © 2023 Ono and Sekiyama. This is an open-access article distributed under the terms of the Creative Commons Attribution License (CC BY). The use, distribution or reproduction in other forums is permitted, provided the original author(s) and the copyright owner(s) are credited and that the original publication in this journal is cited, in accordance with accepted academic practice. No use, distribution or reproduction is permitted which does not comply with these terms.
*Correspondence: Saori Ono, ono.saori.86c@st.kyoto-u.ac.jp