
- 1 Department of Biological Sciences, Macquarie University, Sydney, NSW, Australia
- 2 Department of Psychology, University of Alberta, Edmonton, AB, Canada
- 3 Department of Brain, Behaviour and Evolution, Macquarie University, Sydney, NSW, Australia
After learning a particular target stimulus, such as a location, humans’ judgments of whether a particular stimulus is the target or not is affected by the range of stimuli presented on tests. In such frequently found range effects, the peak of “yes” responses shifts toward the middle of the range of tested stimuli. Humans also code both the metric value and categorical information regarding a target stimulus, and use both forms of codes, such that responses are biased toward the category middle (category adjustment model, Duffy et al., 2010). Categorical codes should also affect range effects, with a test range crossing category boundaries producing less range effect than a test range within a category. We examined a set of past results presented in a review of range effects in humans (Thomas, 1993) for functional explanations in light of categorical coding, and found that all results could be reasonably explained. Additional experiments comparing range effects across vs. within a category found limited supporting evidence, perhaps because the range effects were weak. The adaptive functions of using (in part) categorical coding accounts for many seemingly peculiar biases in human cognition.
Introduction
Generalization is a ubiquitous phenomenon of learning found in all species examined so far. When an animal learns to respond to one specific stimulus (S+) to obtain an outcome, the animal also responds to perceptually distinguishable stimuli that are similar to S+ (Guttman and Kalish, 1956). It is textbook knowledge that generalization gradients are not fixed for a species and a stimulus domain, but depend crucially on the learning experience (Domjan, 2006; Bouton, 2007). Discrimination training on similar stimuli has large effects on the generalization gradient, often leading to peak shift. In peak-shift experimental paradigms, the subject is trained to respond to S+, but a similar stimulus to S+, the S− is also presented during training and responding to S− either goes unrewarded or sometimes is punished. When subsequently tested with a range of stimuli including S+ and S−, the stimulus eliciting the most responding is often not S+, but a stimulus shifted from S+ in the direction away from S− (Hanson, 1959). Peak shift has been found in a large range of species (Purtle, 1973; Rilling, 1977), including humans (Lewis and Johnston, 1999; Cheng and Spetch, 2002; Spetch et al., 2004). Functionally, peak shift might be adaptive in minimizing errors arising from uncertain signals, or signal-borne errors (Lynn et al., 2005).
Another phenomenon found especially in human generalization gradients is range effect, the topic of this paper. What this means is that after the initial learning experience, whether with a single S+ or discrimination training with S+ and S−s, the range of stimuli presented in a series of tests affects the generalization gradient. The peak of responding is often biased toward the middle of the range used on tests. In a thorough review of the human literature in 1993, Thomas (1993) concluded that almost all data purporting to show peak shift are better thought of as range effects. In some especially convincing cases, the peak shift was actually in the wrong direction (for peak shift), toward S− instead of away from it, if the range pushed well past S− (Thomas et al., 1991). Since that date, it should be added that definitive evidence for peak shift in humans has been found, in studies that controlled carefully for range effects (spatial memory: fCheng and Spetch, 2002; ace identification:Lewis and Johnston, 1999; Spetch et al., 2004).
Thomas (1993) has offered a mechanistic explanation for range effects, in terms of the use of an adaptation level (Helson, 1964). The adaptation level is the mean of the range of stimuli presented, and humans’ use of the adaptation level is thought to drive the generalization gradient. On a series of unrewarded tests without feedback, the typical conditions for showing range effects, the adaptation level shifts to the middle of the test range. If the memory of S+ is biased by the adaptation level, then the generalization gradient will shift toward the middle of the range, explaining range effects.
In this paper, we propose a functional account of range effects as well, in terms of the category adjustment model (CAM, Duffy et al., 2010), which is derived from a substantial body of research by Huttenlocher et al. (1991, 1994, 2000, 2004) and Newcombe et al. (1999). The basic premise is that if the exact metric memory of the particular stimulus (S+ in this case) is to some extent uncertain (which is almost always the case), then it is adaptive to bias the judgment toward the middle of the category to which the stimulus belongs. Although responses will then be systematically biased, the error will on the whole be smaller. The reason stems from Bayes’ theorem, and in brief, it comes down to using the maximal amount of information for making a judgment. Bias toward the category middle comes down to using two sources of information instead of one. Both the inexact metric memory and the category information (represented by the mean of the category) are combined in decision making. A large body of theoretical considerations and empirical evidence suggests a functional advantage for combining two sources of information (reviews: Deneve and Pouget, 2004; Cheng et al., 2007; Körding, 2007).
Much of the evidence for category adjustment processes come from the spatial domain, a reason why we are testing spatial range effects in this paper. Humans process space at both a metric (coordinate) level and a categorical level (Kosslyn, 1987; Trojano et al., 2002), and their tendency to naturally categorize space can bias spatial memory. Thus, Huttenlocher et al. (1994) had children of different ages remember a location along a linear dimension (on paper or in a long narrow sandbox). Toddlers of 16–24 months showed biases toward the center of the dimension, revealing the use of a single undifferentiated category of the entire space. By the time children entered school, they seemed to divide the space into two halves conceptually; their responses were biased toward the middle of the two halves of the dimension. Huttenlocher et al. (1991) presented human adults with a location on an unmarked circle to remember. Recall was biased toward the centroids of each quadrant, indicating a division of spatial categories into two halves along each of the vertical and horizontal dimensions. In a length reproduction task, Duffy et al. (2010) determined that the bias is toward the mean of the entire range of presented lengths (forming a single category), and not toward other measures of central tendency including the median and the mode. This is in line with the statistical theory behind the Bayesian considerations underlying the CAM.
In the “General Discussion,” we discuss in detail how the CAM can account for all the patterns of range effects reviewed by Thomas (1993). For the rest of the introduction, we put forth the motivation for the experiments. If category adjustment is affecting range effects, then category boundaries ought to limit the extent of range effects. Range effects should be more prevalent within a category than across a category boundary. Thomas (1993) reviewed one intriguing study showing this (Tomie and Thomas, 1974). Humans learned a bluish-green color as S+, with the color purportedly on the blue side of the blue/green color boundary. Range effects were larger toward the blue side (within color category) than to the green side (across the color boundary). The experiment lacked proper counterbalancing (no green S+ was presented) and a formal measure of the color boundary, so that the suggestive evidence is not the best for showing the predicted category effects. We test here the effects of category boundaries on range effects in a spatial memory task, in which previous research has firmly established a division of space conceptually into two sides (Huttenlocher et al., 1991, 1994). We institute conditions most conducive to obtaining spatial range effects, and compare range effect within spatial category (all test locations on one side of center) vs. across categories (range crosses the middle). Participants were presented with a single learning trial to remember the S+ location just on one side of center, on a vertical line or a horizontal line (separate conditions). Minimal learning experience should facilitate range effects (Thomas, 1993). They were then presented with many tests without feedback, another condition for maximizing range effects. Extreme ranges were used, in that S+ was at one end of the range. S+ location was counterbalanced across participants (either just to the left or just to the right of center horizontally, or else just above or just below center vertically). We compared generalization gradients for the range within one side vs. the range across the center boundary. If category information limits range effects, we predicted more generalization within category than across categories, with the category boundary limiting range effects.
We included both horizontal and vertical spatial locations in anticipation that different results might appear for these two dimensions, because gravity defines the vertical up-down axis. There is evidence from studies with both humans and non-humans to suggest that spatial perception and memory might differ for locations along the vertical and horizontal dimensions. For example, people are better at detecting bilateral symmetry when the axis of symmetry is vertical than when it is horizontal (Wenderoth, 1994; Evans et al., 2000), and they remember the vertical location of objects in an organized scene for longer than they remember the horizontal location of objects (Mandler and Parker, 1976). People appear to perceive line orientation as being categorical near the vertical axis but as continuous near the horizontal boundary (Quinn, 2004), and they sometimes show a downward bias that leads to better accuracy in remembering locations below eye level than locations above eye level (Wilson et al., 2004; Tlauka et al., 2007). Pigeons have also been found to show dimensional differences in remembering locations on a computer screen: they primarily used global information (location on the screen) in the vertical dimension but local information (location within the stimulus array) in the horizontal dimension (Legge et al., 2009). Finally, fish favored vertical over horizontal information in a Y-maze task (Holbrook and Burt de Perera, 2009). The authors suggested that hydrostatic pressure may provide an extra cue in the vertical dimension. Thus a difference between the effects of categorical information on range effects might appear for the vertical and horizontal dimensions.
Materials and Methods
Participants
Participants were recruited by advertisements posted on the campus of Macquarie University, and were paid for their participation. Each of four experiments used 40 participants of mixed sexes.
Materials
The task was presented on one of two LCD monitors (51 cm × 32 cm, 43 cm × 27 cm). In each task, the experimental space was delimited by a light gray square of 22.2 cm centered on the monitor. In two different tasks performed by each participant, either a horizontal or a vertical line segment (13.3 cm) was centered in the square, in effect defining a one-dimensional space for each task. Each task in each experiment was analyzed separately. A small open dot (2.1 mm) was presented just above (horizontal condition) or just to the right (vertical condition) of the line (2.1-mm distance) to indicate target or test locations (Figure 1).
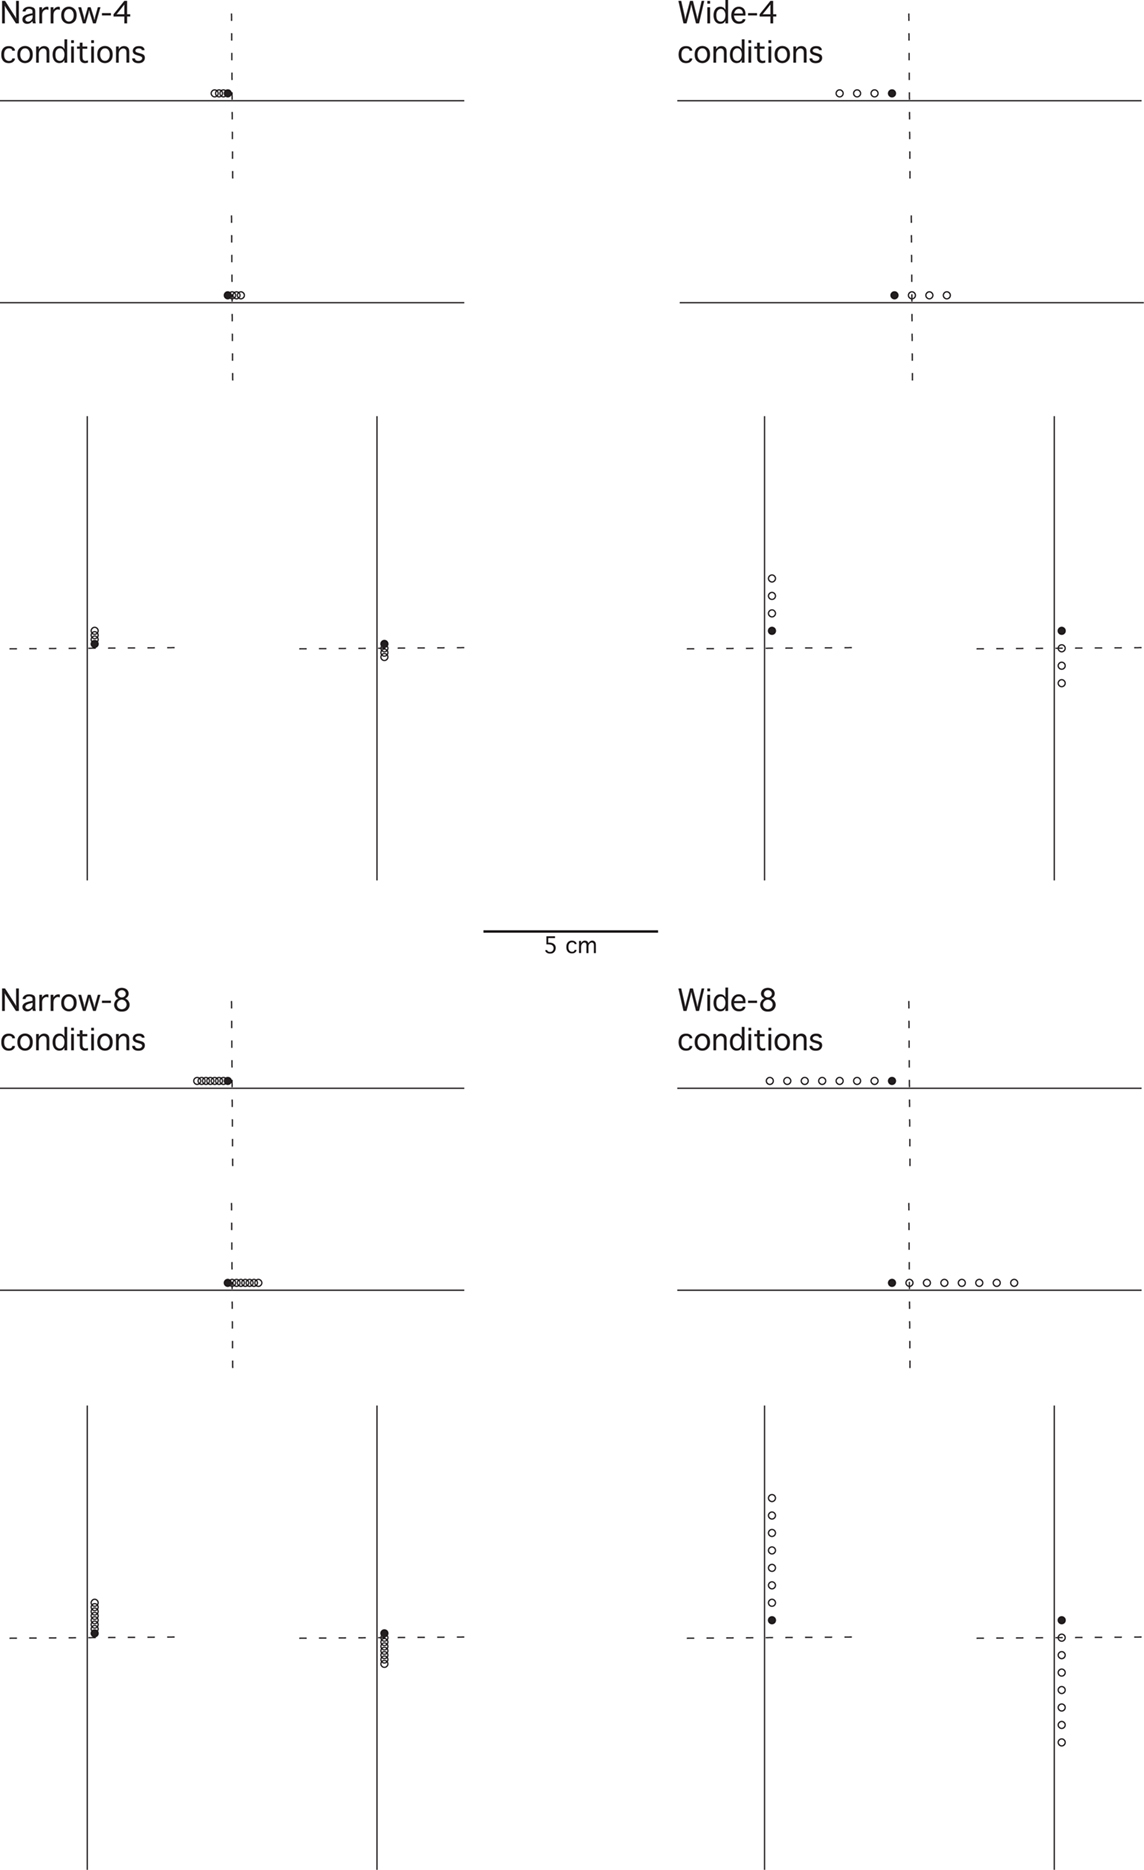
Figure 1. An illustration of the stimulus locations presented for the task in half the set ups used in the experiments. The dashed vertical or horizontal lines indicate the center, a line not shown to participants in the experiments. The location closest to the center, a filled dot, is the target (S+); the other locations shown as open dots are test locations. Shown are conditions in which the target is just to the left of center along the horizontal line, or just above the center along the vertical line. The other set ups have targets just to the right of center along the horizontal line, or just below the center along the vertical line, forming mirror images of the locations shown in the figure.
Design
Experiments differed in procedural details such as the number of trials given to participants and spacing and ranges of test stimuli, but each contained the same basic design, which applied to both horizontal and vertical tasks. Each experiment contained a number of test locations (four or eight) as a repeated-measures factor. The target location (S+) was always at one end of the range of test locations, a manipulation designed to maximize range effects. It was near the center of the line (just to the left or just to the right in the horizontal task, just above or just below in the vertical task). We will label the test locations S+, S1, S2, etc. The key factor (between-subjects) was that range of test locations either crossed the center or else ranged away from the center and stayed on one side. Other factors were counterbalanced across participants, but not entered into statistical analyses. These include the order of tasks (vertical first or horizontal first) and S+ location (left/above or right/below). In separate analyses, we examined sex differences, and report the few significant statistical effects found.
Procedure
The four experiments differed in the number and spacing of test stimuli (range) and the location of S+. As descriptions of each experiment apply to both tasks, we will speak of distance from center to encompass left, right, above, and below the center of the line. In the Narrow-4 experiment, S+ was 1.25 mm from center. The test range was four locations, 1.25 mm apart, spanning away from center or crossing the center. In the Narrow-8, S+ was also 1.25 mm from center, but the test range was eight locations, 1.25 mm apart. In the Wide-4 experiment, S+ was 5 mm from center; the test range consisted of four locations 5 mm apart. In the Wide-8 experiment, S+ was also 5 mm from center, but the test range consisted of eight locations 5 mm apart.
Upon arrival, participants filled out and signed consent forms and then were given brief instructions for the simple tasks. The target location was first presented, with the participant given one chance (of unlimited duration) to examine the location to be remembered. Most participants took less than a minute examining the location. She/he then pressed the space bar to continue. A series of test trials then ensued, each presenting one of the test locations in a random order. For each presented location, the participant pressed “1” for answering yes that is the target location or “0” for no. The test stimulus was removed only after the participant entered an answer. Intertest interval was 2.5 s. After all the tests, the participant received instructions that the second task would begin (vertical after horizontal or horizontal after vertical). As soon as the participant hit the space bar, the second task ensued, which followed the same procedure as the first task. After completing both tasks, the participant entered her/his gender and age and then was debriefed and thanked.
The Narrow-4 experiment consisted of 10 tests at each location, thus 40 tests in each of the horizontal and vertical tasks. The Narrow-8 experiment consisted of 10 tests at each location, thus 80 tests in each task. The Wide-4 experiment consisted of 20 tests at each location, thus 80 tests in each task. The Wide-8 experiment consisted of 10 tests at each location, thus 80 tests in each task.
Analysis
The horizontal and vertical tasks were analyzed separately, as was each experiment. The locations (repeated-measures factor) were coded in terms of distance from S+: S+, S1, S2… This in effect reflects the data for half the participants so that the range in all cases is going in the same direction. The independent between-subject variable was category crossing: the range either stayed within category (one side) or crossed categories (crossed center). A mixed analysis of variance (ANOVA) was performed in each case, ignoring counterbalancing factors. Two different dependent variables were analyzed: the proportion of “yes” answers, and reaction time (time taken to enter a response). As already mentioned, we analyzed the data with the gender factor added in separate analyses, and report them separately, as the few gender effects are tangential to the main account. Alpha level was set at p = 0.05.
Results and Discussion
Proportion of “Yes” Responses
A key comparison is the extent of generalization across category boundaries vs. within categories (range all on one side). If the category limits the extent of range effects, the generalization gradient should be steeper across categories than within categories. The proportion of “yes” responses shows a peak at the target (S+) location, and drops off in an orderly gradient in all experimental conditions (Figures 2–5). The spacing of test stimuli and the dimension, horizontal, or vertical, both seem to influence results. Differences in generalization gradients across vs. within category boundaries are most apparent for the horizontal dimension, and with wide spacing of test stimuli (Figures 2–5). Formal statistics confirm these impressions (Table 1). In every experimental task, strong generalization gradient effects were found in the form of a main effect of stimulus location. A significant interaction of stimulus location with category crossing (range across boundaries or within one side), however, was only found on the horizontal task and with wide spacing of stimuli. On the horizontal task, both the Wide-4 and the Wide-8 experiments showed this predicted effect. In each of these two cases, a main effect of Category crossing was also found: participants presented with a range all on one side made more “yes” responses than those presented with a range crossing the center.
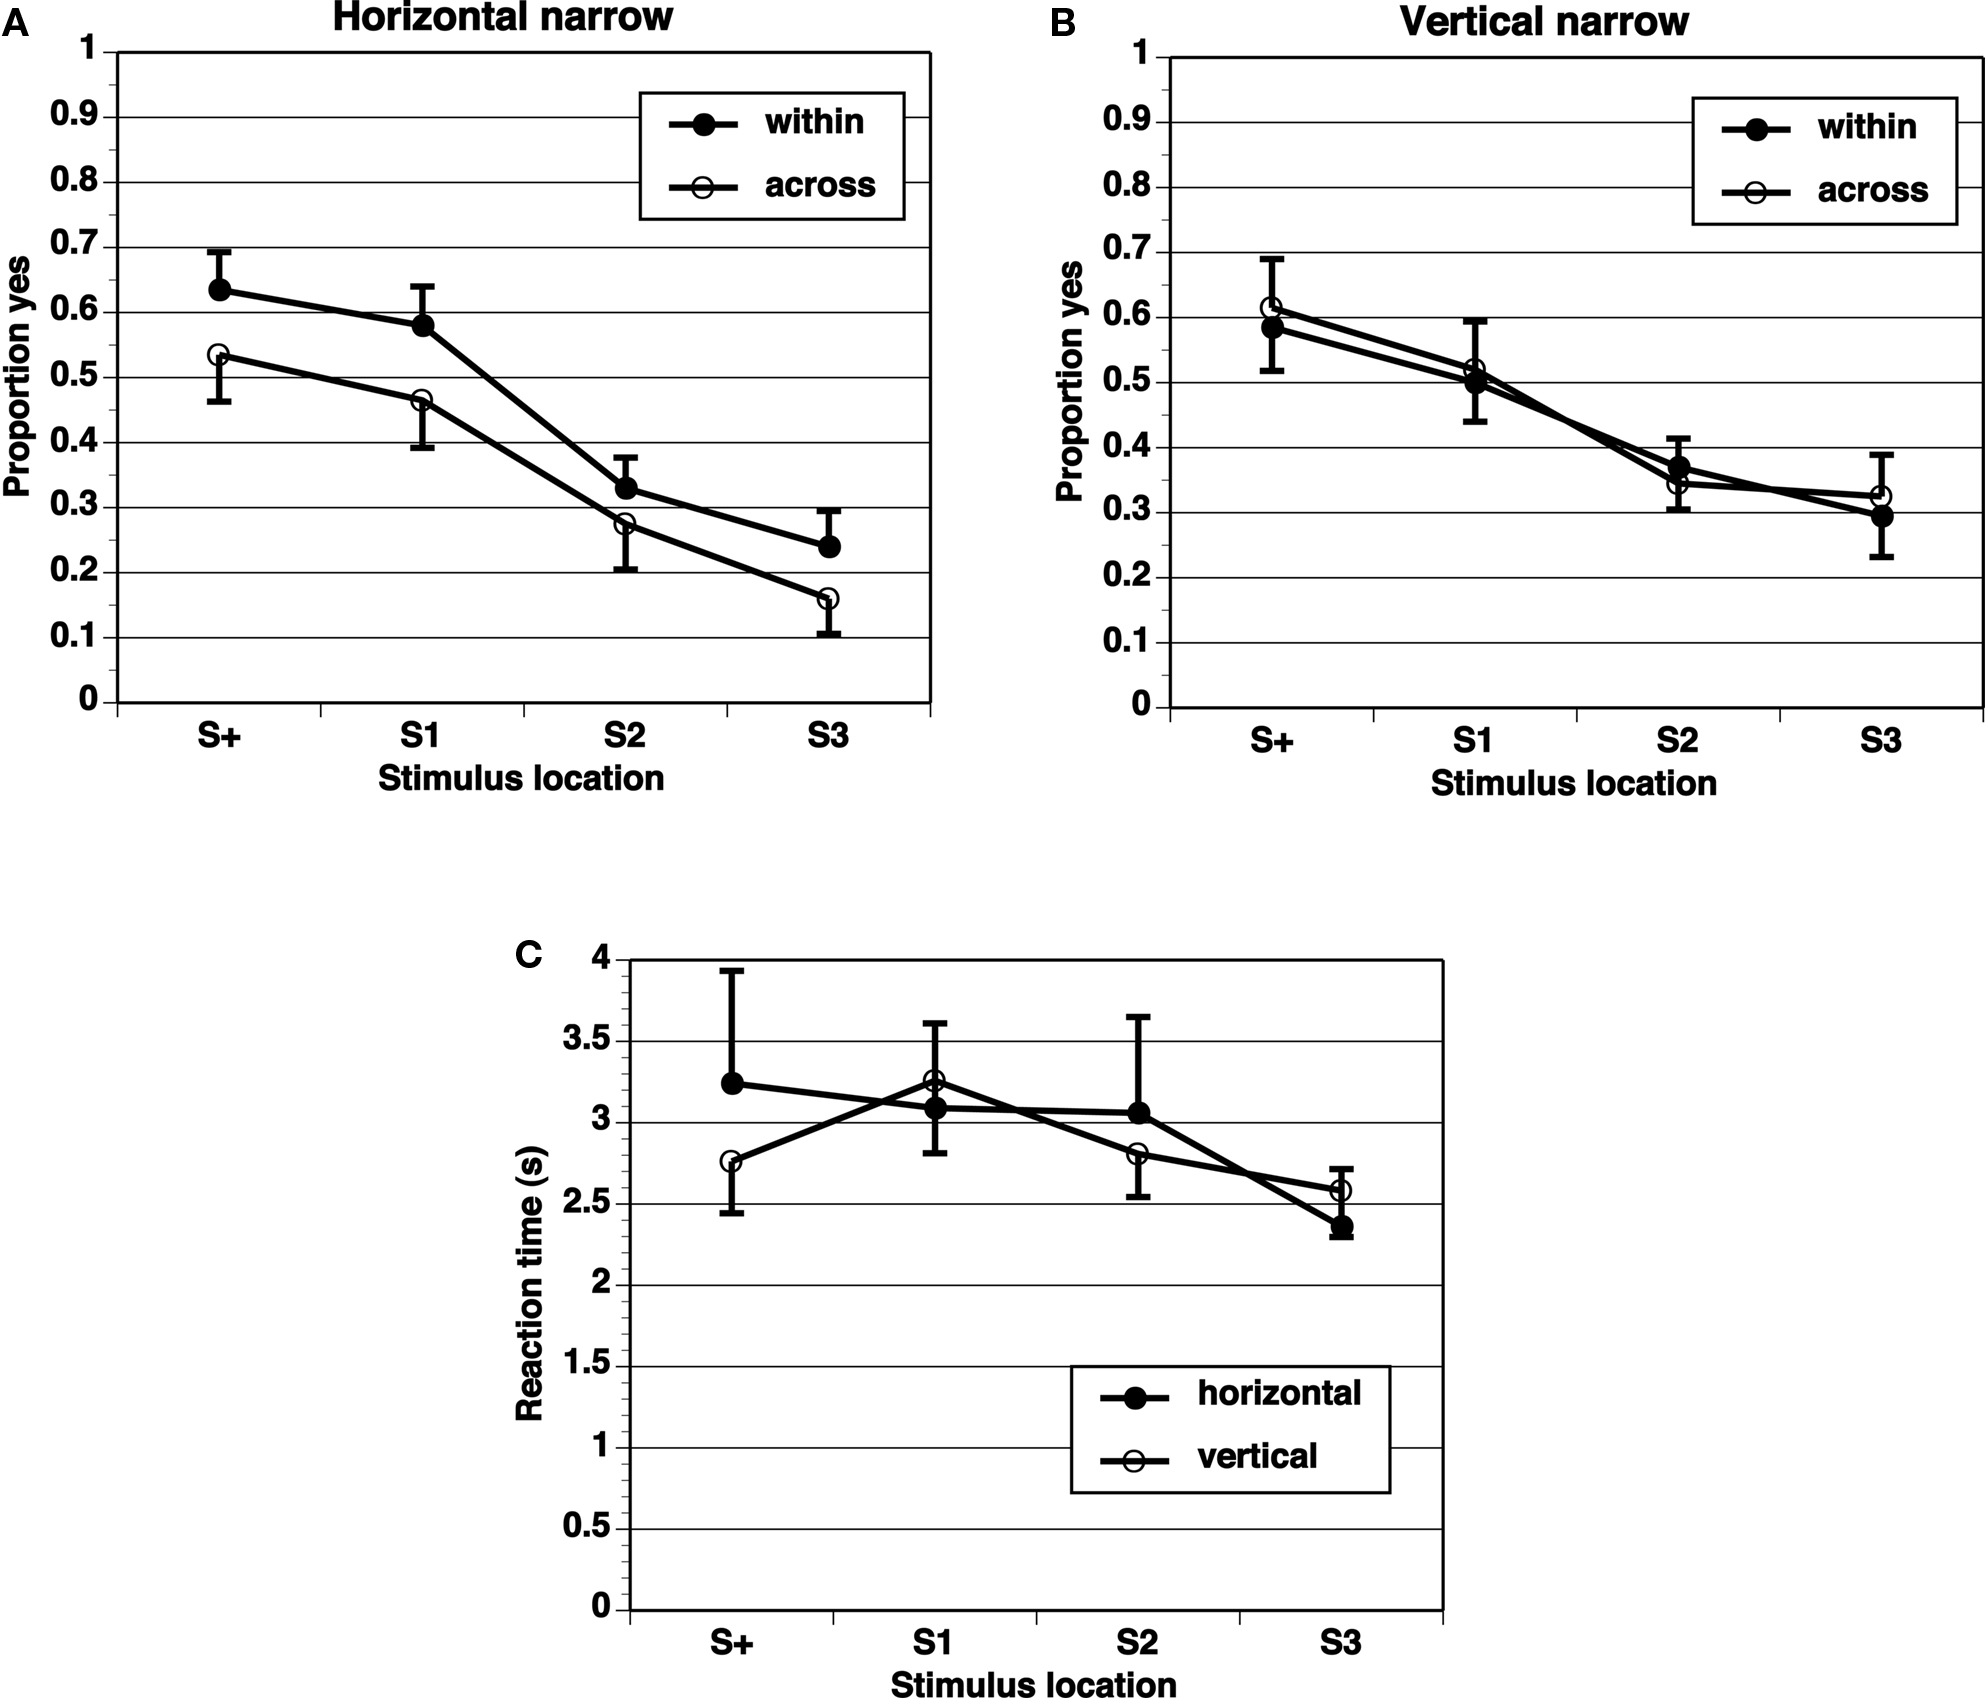
Figure 2. Proportion of “yes” responses (A, B, M ± SEM) and reaction times (C, M ± SEM) in the Narrow-4 experiment, with narrow spacing between stimulus locations and four test locations.
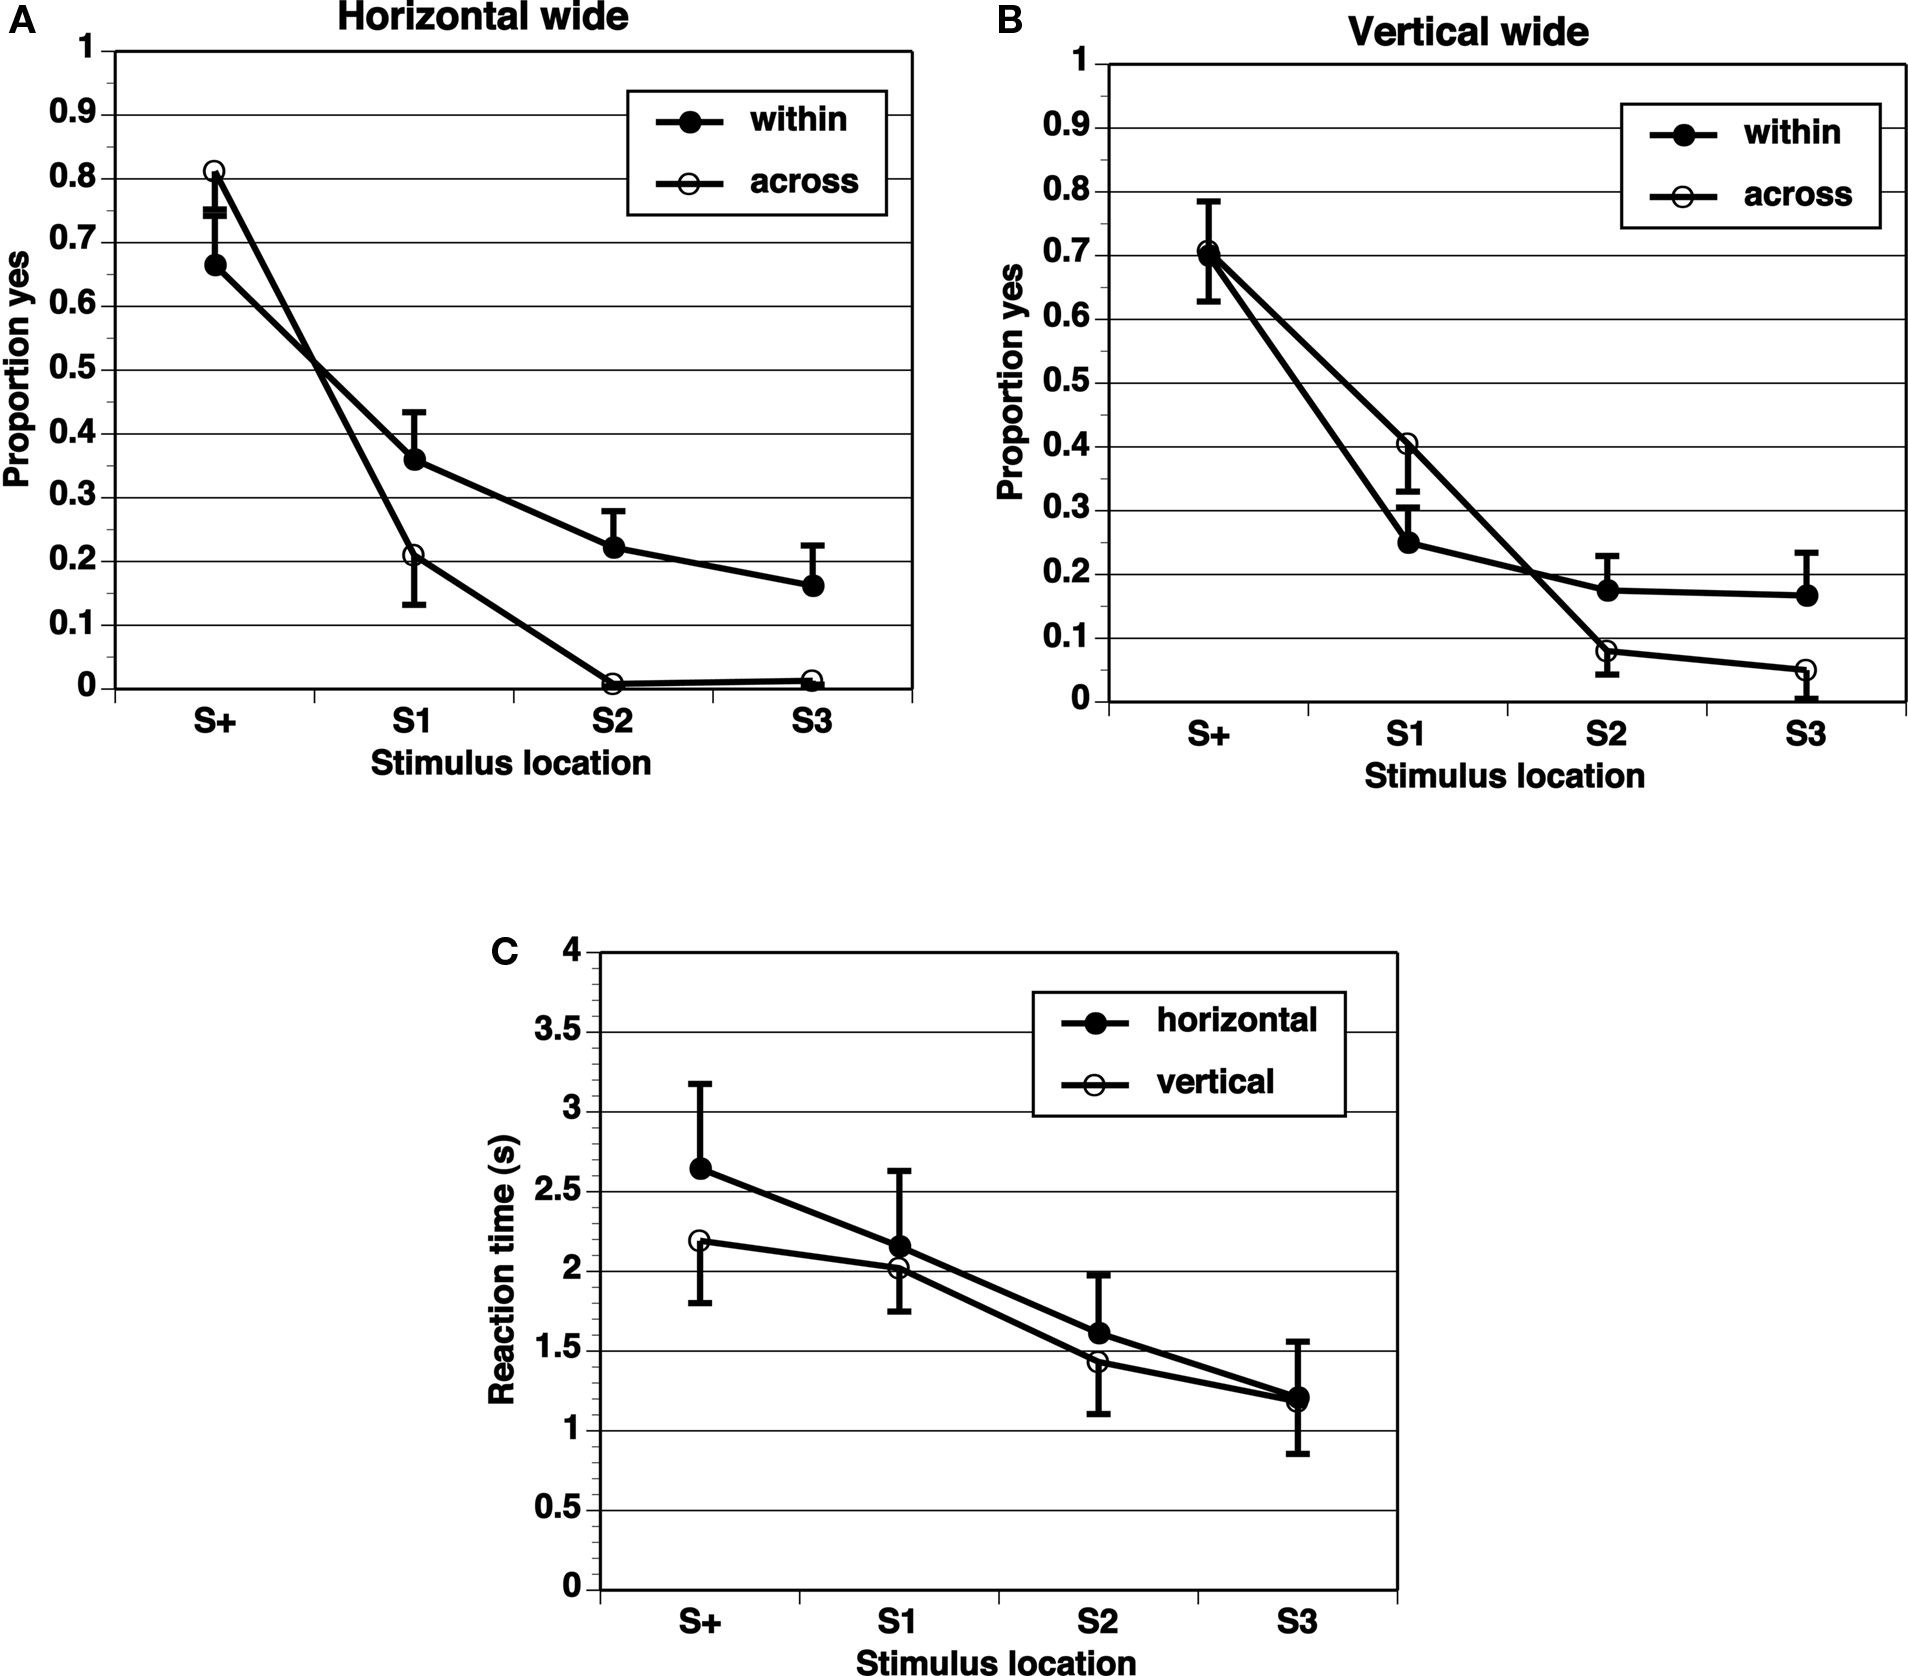
Figure 3. Proportion of “yes” responses (A, B, M ± SEM) and reaction times (C, M ± SEM) in the Wide-4 experiment, with wide spacing between stimulus locations and four test locations.
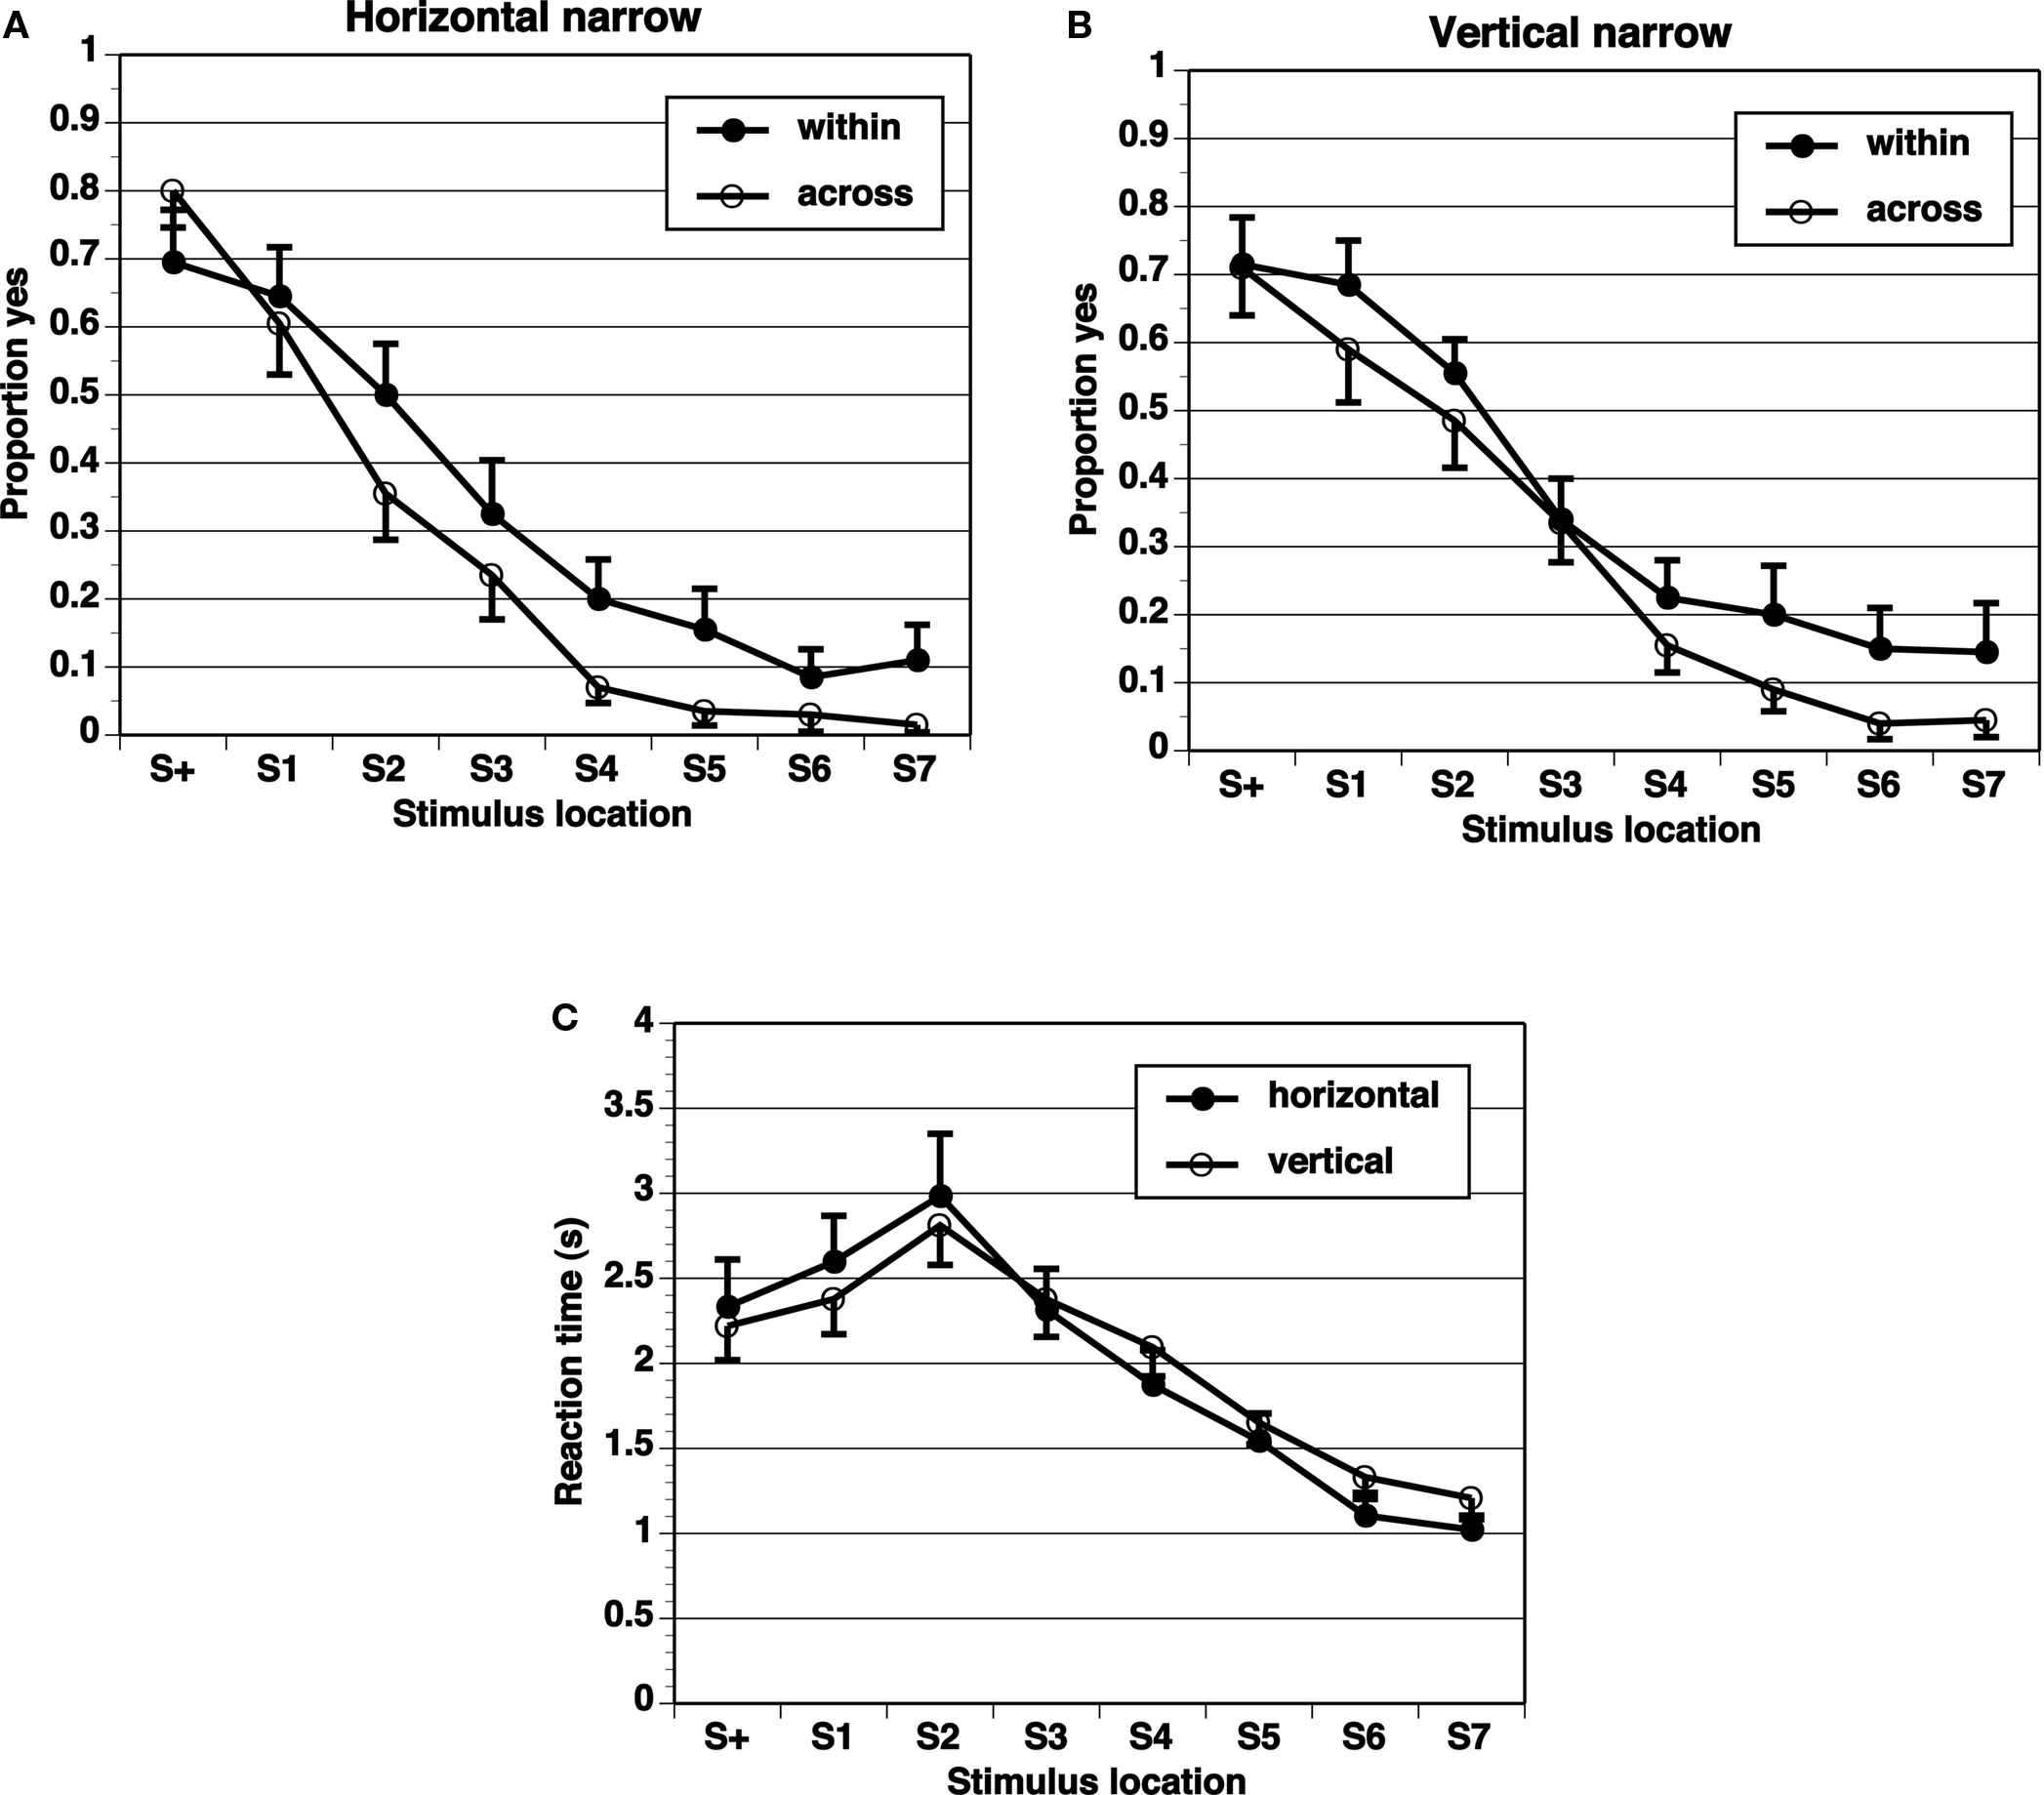
Figure 4. Proportion of “yes” responses (A, B, M ± SEM) and reaction times (C, M ± SEM) in Narrow-8 experiment, with narrow spacing between stimulus locations and eight test locations.
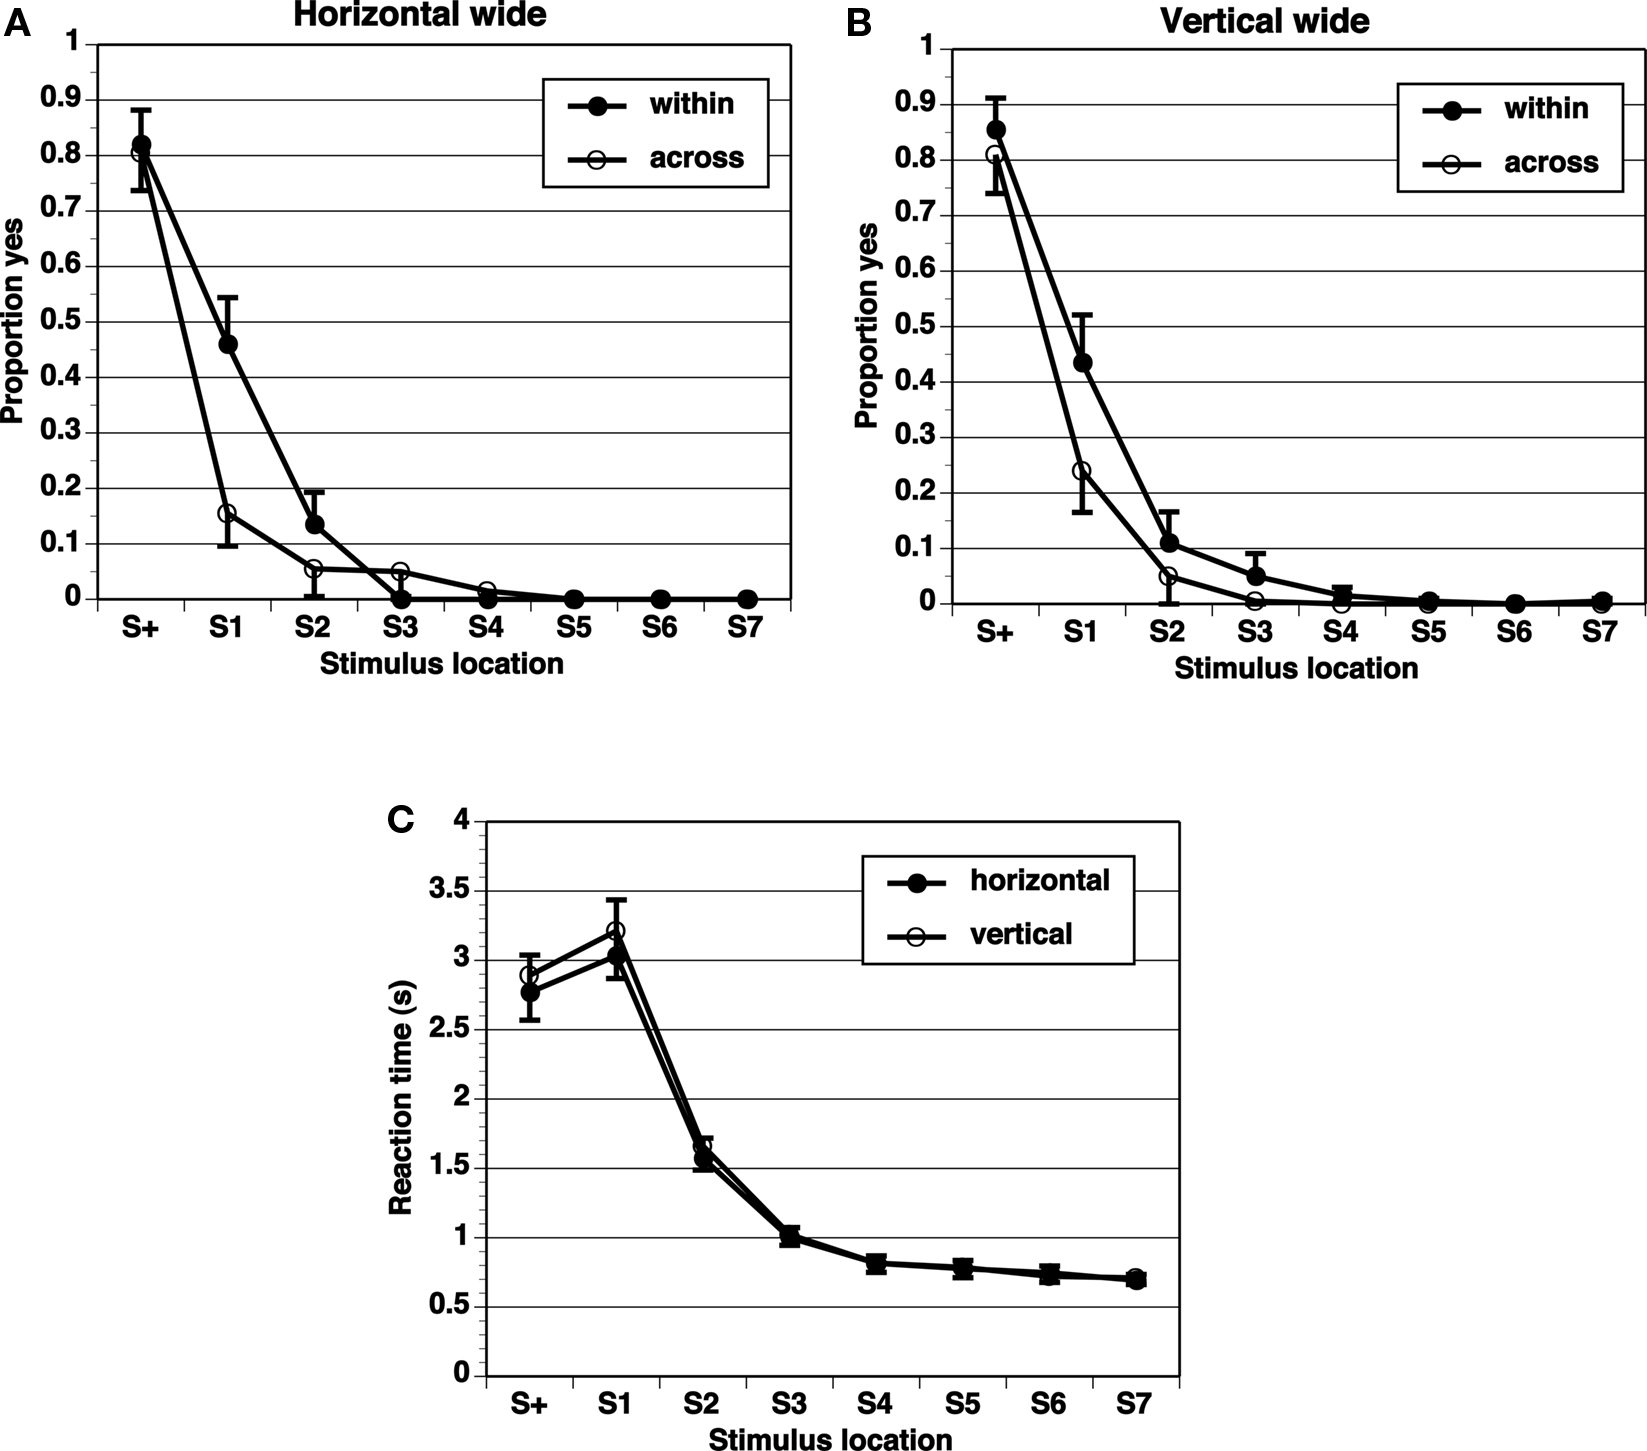
Figure 5. Proportion of “yes” responses (A, B, M ± SEM) and reaction times (C, M ± SEM) in Wide-8 experiment, with wide spacing between stimulus locations and eight test locations.
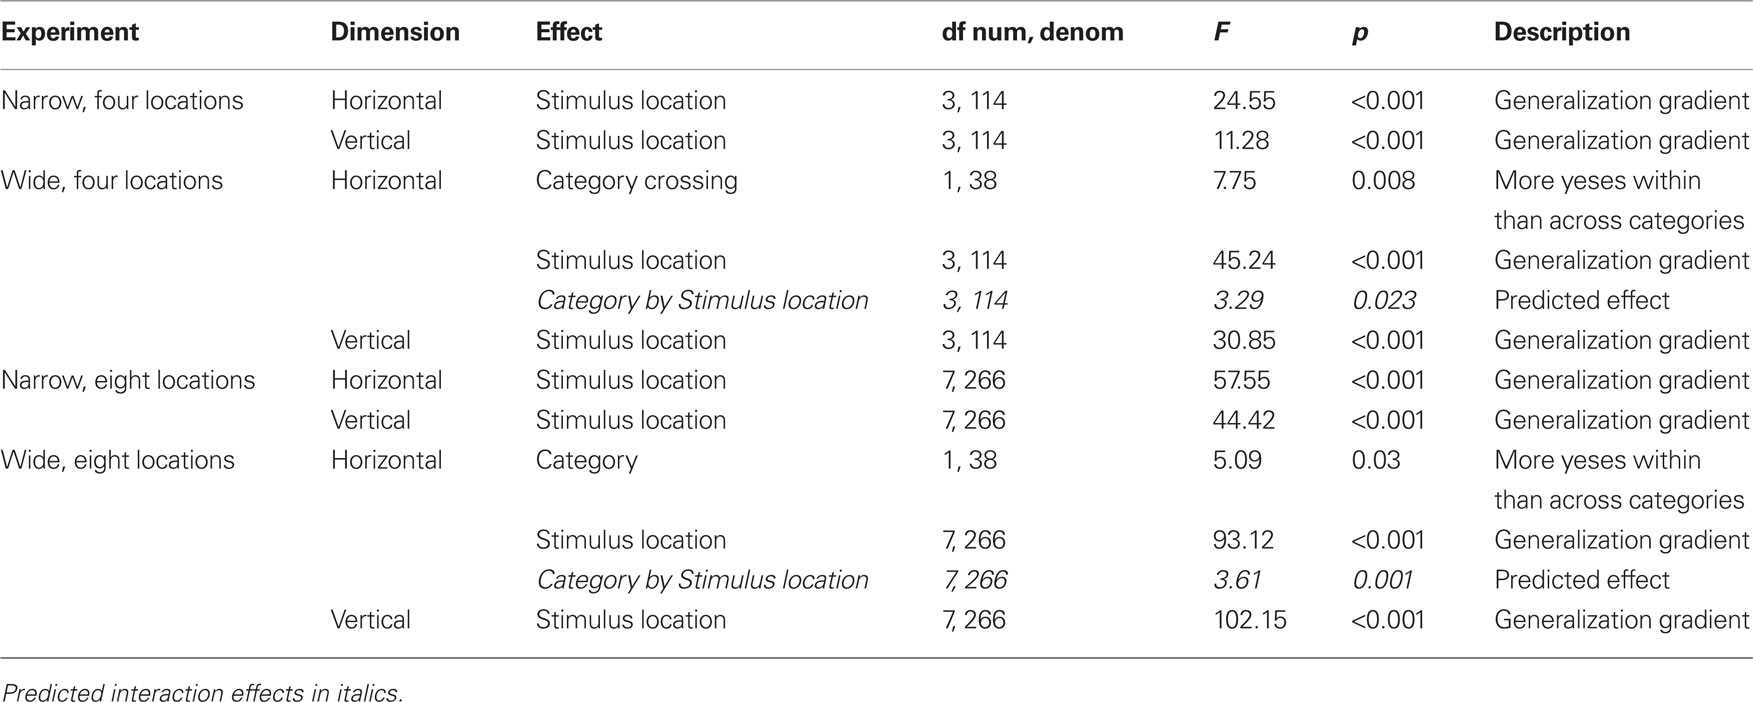
Table 1. Statistical effects for proportion of “yes” responses.
The following gender effects were found. In the Wide-4 experiment, males answered “yes” more often than females on the vertical task. In the Wide-8 horizontal task, males showed the predicted interaction effect (stimulus location by Category crossing) to a stronger extent than females (significant gender by stimulus location by Category crossing effect, F(7,252) = 3.22, p = 0.043).
The results show that differential generalization gradients across vs. within category boundaries were only found on the horizontal dimension, and with wide spacing increasing the span of the range. An effect of category boundary in the horizontal dimension but not in the vertical dimension is consistent with our expectation, based on the literature, that we might see differences in the effect across dimensions. The number of elements (presented locations) in the range was not crucial, as the Narrow-4 and Narrow-8 conditions both failed to reveal differential generalization gradients, while the Wide-4 and the Wide-8 conditions both did on the horizontal dimension. The target in the narrow spacing condition was very near the center and may have been categorized as falling in a center region rather than on the right or left side. This would in effect destroy the purported boundary at the center. The middle of a center region would be the center of the line, and adjusting for this prototype (averaging it with the metric memory of the target) would hardly have an effect on any range of stimuli. In contrast, the target in the wide spacing conditions clearly fell to one side or the other of the center and so would be more likely to be categorized as falling on the left or right side, whose centers are far from the target. We admit that this is a post hoc interpretation requiring corroborating evidence in its support.
Reaction Times
Reaction times (Figures 2–5) show a pattern in most conditions in which locations closer to S+ have slower latencies. Statistically, the effect of stimulus locations is strong and significant for all conditions except the vertical task of the Narrow-4 experiment (Table 2). No significant interactions with Category crossing (within one side or across the center) was found in any condition.
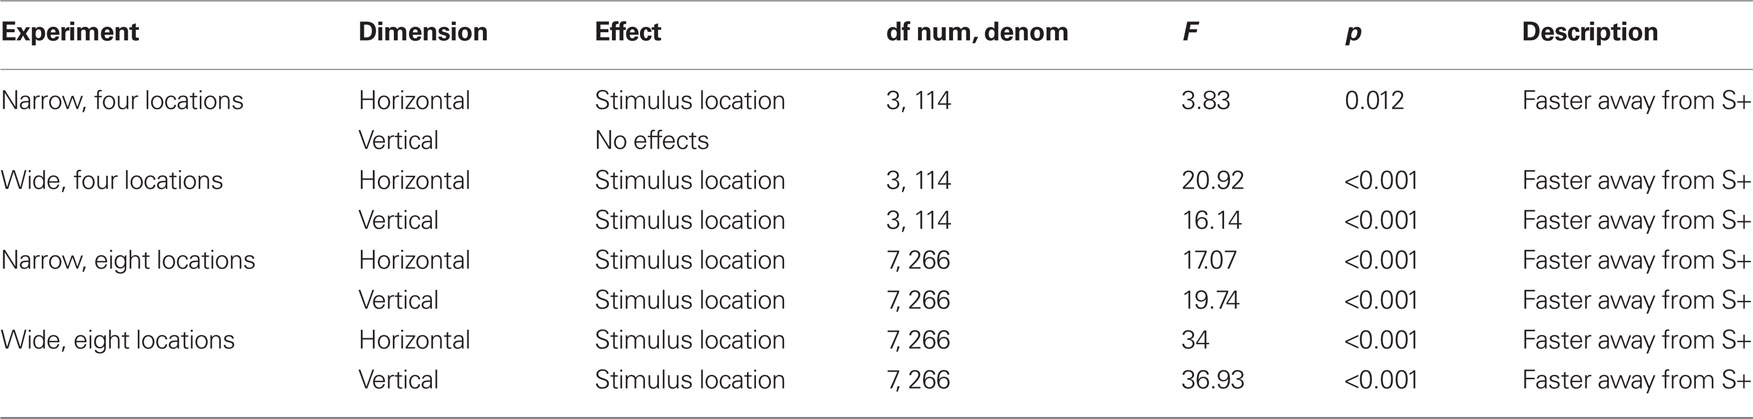
Table 2. Statistical effects for reaction times.
In terms of gender differences, in the Wide-4 experiment, a gender by stimulus location interaction was found (F(3,108) = 3.45, p = 0.019) on the vertical task, reflecting the fact the females were especially slow on the S+ test stimulus. In the Narrow-8 experiments, a gender by stimulus location interaction was also found (F(7,252) = 2.51, p = 0.017) on the horizontal task, reflecting the fact that males show larger differences in reaction time across locations. On the vertical task in the Narrow-8 experiment, a three-way interaction of gender by stimulus location by Category crossing was found (F(7,252) = 2.47, p = 0.018), reflecting the fact that males presented a range that crossed the center were especially slow on locations near S+.
The reaction time data are straight forward and present no surprises. Locations far from S+ are easy to classify as non-target, while those nearer S+ require some effort to distinguish whether they are the target location or not.
Testing for Range Effects
A final analysis was conducted to examine the extent of range effects. Peaks of “yes” responses at S+ suggest little by way of range effects, even though we effected manipulations to maximize the possibility of obtaining range effects. Very little training, extreme ranges with S+ at one end, and multiple tests without feedback all form part of the recipe for producing range effects. One prediction from past manipulations of ranges (Thomas et al., 1991; Thomas, 1993) is that with S+ at one end of the range, the larger the range, the larger should be the range effect. We thus compared across experiments, picking the conditions in which all locations were on one side of center, but comparing a range of 4 vs. a range of 8. The range of 8 should produce more range effect. We compared narrow- and wide-spacing separately, on the four locations common to both ranges, using mixed ANOVAs. The key prediction would be a range size (4 vs. 8) by location interaction. Although a location main effect was obtained for both narrow (horizontal: F(3,114) = 2.81, p = 0.043; vertical: F(3,114) = 3.52, p = 0.017) and wide spacing (horizontal: F(3,114) = 37.63, p < 0.001; vertical: F(3,114) = 42.55, p < 0.001), the interaction term was not significant in the narrow spacing (horizontal: F(3,114) = 1.41, p = 0.244; vertical: F(3,114) = 2.33, p = 0.078). The interaction term approached significance in the wide spacing (horizontal: F(3,114) = 2.47, p = 0.065; vertical: F(3,114) = 2.63, p = 0.054), suggesting a weak range effect found only for the wide spacing.
General Discussion
Discussion of Results
In these simple experiments, we predicted larger range effects for ranges within a category (one side of center) than across categories (crossing the center). Different interstimulus spacing and different dimensions (vertical or horizontal) were tested in different experiments. The results provide limited support for the predictions. When the spacing between stimulus locations was narrow (1.25 mm), with all locations in the central region, range effects were not different within category vs. across category boundaries. This lack of difference is perhaps not surprising given that we found no evidence for range effects at all in these conditions. For wide interstimulus spacing (5 mm between locations), different range effects were obtained in the horizontal dimension, but not the vertical dimension, consistent with the literature suggesting that spatial information may be processed differently in the horizontal and vertical dimensions. The significant effects obtained in the horizontal wide spacing conditions, although statistically significant, were not large in that the peak location for “yes” responding remained the S+ in all conditions. Nevertheless, the flatter generalization gradients in the within-boundary conditions than in the across-boundary conditions are clearly consistent with our prediction that category boundaries could reduce range effects.
The failure to find evidence for range effects at all with narrow spacing can be explained by the CAM, if we assume that participants were coding the target as belonging to a narrow center region. The narrowness of the category (i.e., the center location) serves to limit range effects. Evidence for such a limiting effect of a narrow category has been found in past research (Thomas and Thomas, 1974) reviewed below.
Functional Interpretations of Range Effects in Humans
The results obtained here should be considered in the light of how functional interpretations based on the CAM (Huttenlocher et al., 1991, 1994, 2000; Newcombe et al., 1999; Duffy et al., 2010) can account for extant results. We opted to discuss a sizeable impartial set of studies, those reviewed by Thomas (1993). Thomas did not cite any of the work of Huttenlocher and colleagues, with some key papers appearing after Thomas’s publication ( Huttenlocher et al., 2000; Duffy et al., 2010). The studies reviewed in Thomas’s review have not been cherry-picked with the CAM in mind.
We emphasize from the outset that we are not presenting an alternative mechanistic explanation in opposition to Thomas’s (1993) adaptation-level analysis. Functional explanations are a different type of explanation, a different why question from Tinbergen’s (1963) famous formulation of four different why questions. Mechanistic explanations focus on how such effects would arise from the brain and cognitive systems underlying humans’ task performance. We do not have a better mechanistic model than what Thomas (1993) presented, which, with some adjustments, accounted for the results well. Our functional interpretation, and those of Huttenlocher and colleagues as well, focus instead on why it would be adaptive that we should behave in such a fashion, and ultimately on why such seemingly peculiar biases would have been selected in evolution.
Range effects used to be called the central tendency effect or central tendency shift (Thomas and Jones, 1962; Helson and Avant, 1967). Subjects had to learn a target value along one stimulus dimension, and then were presented a range of stimuli along that dimension. The peak of responding “yes” tended to shift toward the middle of the test range presented, along dimensions of wavelength of light (Thomas and Jones, 1962) or sizes of squares (Helson and Avant, 1967). Subjects thus averaged their presumably uncertain memory of the target value with the mean of a category, the range presented on tests. These are the predictions that CAM would make.
Thomas (1993) mentioned that the peak of responding “yes” in Thomas and Jones’s (1962) study shifted gradually from the target stimulus value toward the mean of the test range. Such gradual shifting toward the category mean was documented in a number of other studies on other dimensions (visual brightness: Thomas et al., 1974; lifted weights: Hébert et al., 1974; wavelengths of light: Tomie and Thomas, 1974; brightness: Thomas et al., 1973). CAM predicts this effect. The weighting of cues (target memory vs. mean of category) should be in inverse proportion to reliability. As tests wear on, (1) the memory of the target would fade, making it less reliable, and (2) the range of the category and its middle become better defined. Weighting for the category mean should thus increase as testing continues.
Another prediction from Thomas’s (1993) adaptation-level model is “that greater asymmetry of the test series will produce a larger central tendency shift” (p. 662). Thomas and Jones (1962) and Helson and Avant (1967) both found this, and later Thomas et al. (1991) found this again with line angles as the stimulus dimension. Empirically, Duffy et al. (2010) showed that the category is represented by its mean. Theoretically, for Bayesian reasons, the averaging needs to be based on the category mean (Duffy et al., 2010). The memory of the mean is averaged with the memory of the target. Increasing the asymmetry of the test series amounts to moving its mean further from the target, increasing the central tendency shift.
If the category can be made very small around the target, and that category is well remembered, it ought to be given a hefty weight, and reduce errors of memory greatly. Thomas and Thomas (1974) gave subjects a line angle to remember. Under standard conditions, range effects were prominent. One group, however, was instructed to think of the line as a clock hand, and to remember the time it indicated. Thus a 60° angle may be coded as indicating 1 o’clock. Such a category is both narrow and well remembered, and should be relied on greatly. Most non-target stimuli could be rejected as not belonging to the correct category. Subjects given such clock-face instructions apparently did just that, producing no central tendency shift at all. Our participants in the narrow-spacing conditions might have shown such an effect.
Duffy et al.’s (2010) analysis shows that it is the mean of a category, not the mean of the range ends (or for that matter, the mode or median of the category) that should be (and was empirically) averaged. Two early studies by Hébert and Capeheart (1969) and Hébert et al. (1974) showed data on lifted weights consistent with this interpretation. The same range was presented on tests to different subjects, but for one group, the weights closer to the target were over-represented, while for a second group, weights further from the target were over-represented. The latter group showed a larger central tendency shift, consistent with Duffy et al.’s (2010) analysis.
Still on the topic of the mean of a category, psychophysical scaling ought to matter in determining the mean, and from there to affecting range effects. Duffy et al.’s (2010) linear size dimension was assumed to fall on a linear scale, an assumption that we think is justified (Cheng and Spetch, 2002). If the psychophysical scale is not linear, however, then linear averaging of the physical stimulus values will in general not deliver the psychophysical mean. Hébert et al. (1974) found that for lifted weights, range effects in the downward direction were larger than shifts in the upward direction. They interpreted their results as showing that the central tendency shift was not toward the arithmetic mean of the range, but toward what the authors calculated the subjective or psychophysical mean to be, an interpretation echoed by Thomas (1993). A similar interpretation was given by Thomas et al. (1974) for their results on the dimension of light intensity. CAM predicts such outcomes: the psychophysical mean, being the mean on the subjective or psychophysical scale, is the mean that should be used in a weighted average of remembered category mean and target value.
The amount of training on the target should affect range effects as well, according to adaptation-level theory and the functional predictions of CAM. Mechanistically, the more the training, the stronger that adaptation level for the training stimulus. Functionally, the more the training, the better the memory for the target stimulus, and the more it should be weighted. Results have been inconsistent, with one study finding no difference in range effect with 11 vs. 21 times of lifting a target weight (Hébert et al., 1972), and another study finding less range effect with more training (Giurintano, 1972), reported in (Thomas, 1974, 1993). Thomas (1993) reported a pilot experiment in which intentional learning conditions led to less range effect than incidental learning conditions (see his Figure 2). Thomas (1993) suggested that negative results might have arisen because participants had reached asymptotic performance levels in all conditions.
The CAM needs an extension to account for the next results discussed by Thomas (1993), those from Newlin et al. (1978). Newlin et al. used light intensities in generalization tests, but added the manipulation of pre-exposure, either to stimuli brighter than the training target or to dimmer stimuli. Then the target was presented, followed by generalization tests designed to elicit range effects, with the target at one or the other end of the range. One interpretation of the CAM is to put pre-exposure trials as part of the category formation process together with the post-target tests. This would predict that pre-exposure to dim lights should shift the peak of responding to dimmer values, while pre-exposure to bright lights should shift the peak of responding to brighter values, both by affecting the coding of the category mean. The results were in the opposite direction.
If categories are useful for retrieving memories, they may well be useful for coding memories as well. Thus, when a dim target is presented after pre-exposure to a series of bright stimuli, it would be adaptive to code it as being on the dim side of a category, much as adaptation-level theory would suppose (Figure 6). Functionally, this adds some extra information to the code: the target is both a particular brightness (metric information) and on the dim side of a category (categorical information). The functional advantage of using categorical information is that it adds another cue, the use of multiple cues adding accuracy even at the expense of systematic bias.
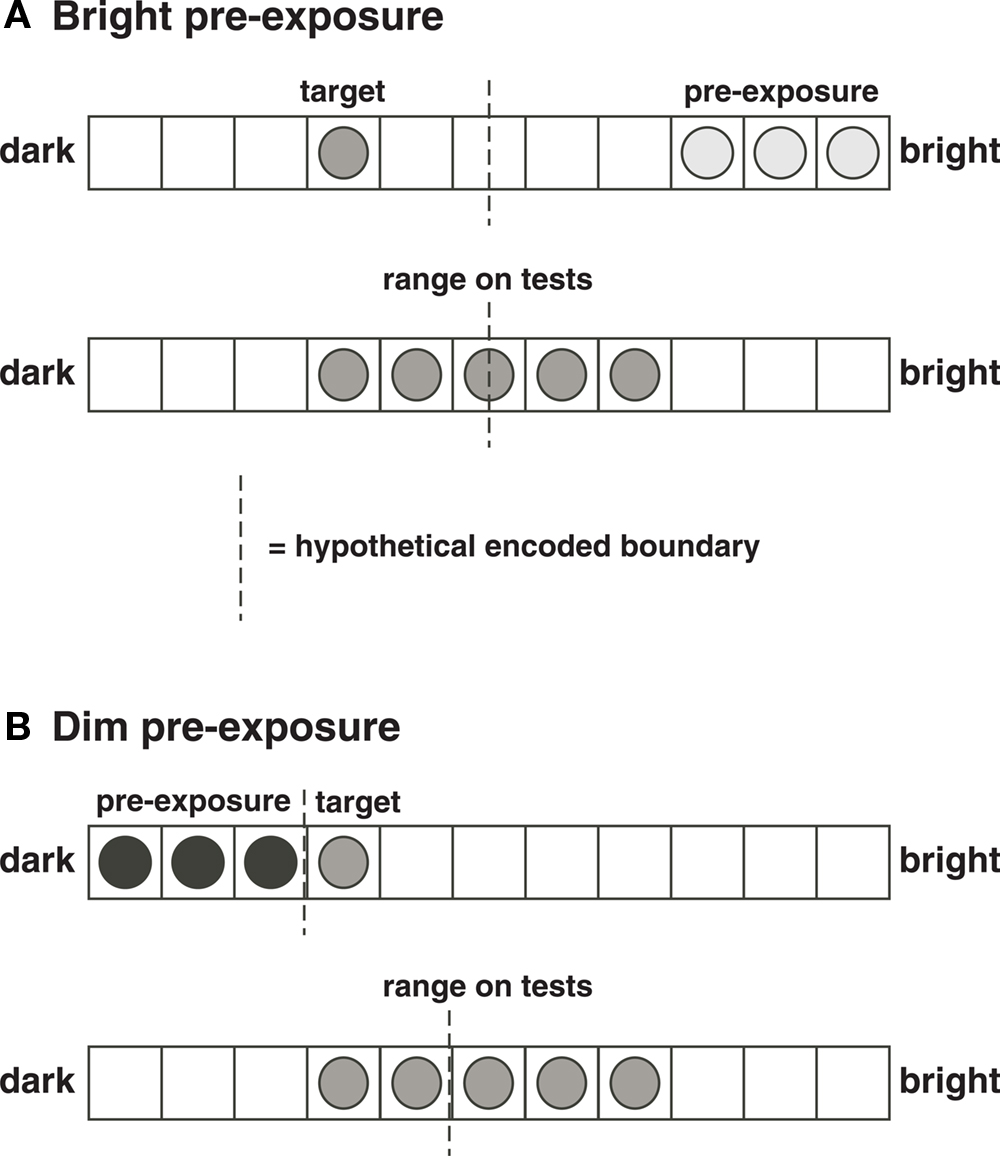
Figure 6. Explanation of some of Newlin et al. ’s (1978, Experiment 1) data. (A) A condition in which participants were first pre-exposed to bright stimuli, and then presented a target at brightness level 4 (top, 1 = dimmest, 11 = brightest). We suppose that the subjects encodes a boundary separating two categories, with the target coded as being in the dim category. The categorical code provides additional information to the encoding of the metric value of the target brightness. On tests (bottom), the range of stimuli is more or less centered on the category boundary, so that the boundary does not shift during tests, and a “correct” generalization gradient peaking at 4 is found (Newlin et al.’s Figure 1). (B) A condition in which participants were first exposed to dim stimuli, and then presented a target at brightness 4 (top). We suppose that the participant would encode a boundary somewhere between 3 and 4. On tests (bottom), the range serves to shift the encoded category boundary toward the brighter end, thus causing large range effects (Newlin et al.’s Figure 1). The shift occurs because the boundary was somewhere in the middle of the range before tests (in pre-exposure and target training), and the subject is relying on the “middle of the range” description (a categorical code) in part in determining the boundary during tests.
Thus, we may conceive of the participant as learning a discrimination in the pre-exposure and training, learning the target as S+ and the pre-exposure stimuli as S−s. We suppose that the metric value of a level of brightness is difficult to remember, in contrast to the target location in our study, so that the categorical information gathered at encoding would be weighted relatively more. The post-exposure experience then, shifts the memory of the category middle, relative to which the target stimulus is in part coded (Figure 6). Independent predictions from this interpretation deserve to be tested.
Peak-shift experimental paradigms in humans have provided strong support for adaptation-level theory (Thomas, 1993), often trumping interpretations in terms of gradients of excitation and inhibition based on absolute stimulus levels (Spence, 1937). In training in peak-shift experiments, the participant is presented with both a target stimulus, S+, and a number, typically one, of non-target, S− stimuli. In classic peak-shift results from pigeons (Hanson, 1959; Thomas, 1962), the peak of responding shifts beyond S+ in the direction away from S−. In humans in contrast, other effects irrelevant to or opposite to the peak-shift account based on absolute gradients are found. Thus, a larger test range beyond S+ leads to more peak shift (Thomas et al., 1992), an effect that needs to be interpreted as a range effect. This range effect is even found with two S+s, on either side of a single S− (Thomas et al., 1991, Experiment 3 on line angles). Even more strikingly, with a range extending a good ways beyond S− during tests without feedback, range effects predominate and the peak shifts toward or even beyond S− (Newlin et al., 1979; Thomas et al., 1991). This range effect is understandable on the basis of averaging the category mean, as already discussed. But it is pertinent to consider two further issues: (1) is it the memory for the metric value of S+ that has been averaged with the categorical mean, or is it instead a boundary between S+ and S−, and (2) why is the classic peak-shift effect found in some cases, for instance in our hands (Cheng and Spetch, 2002; Spetch et al., 2004)? We consider these issues in turn.
On issue (1), other results clearly implicate the boundary rather than the metric value, giving some credence to our interpretation of Newlin et al.’s (1978) results. The spacing between S+ and S− affects the extent of range effects, a result that only makes sense if it is the location of the boundary that is at play rather than the metric value of S+. Thus, with the same S+ and the same test range, an S− more distant from S+ leads to a greater range effect than an S− closer to S+ (brightness levels: Thomas et al., 1973, 1991). Such a result cannot be accommodated by assuming that it is the metric value of S+ that is being averaged with a category mean. In that scenario, the value of S− would not matter. The interpretation must invoke both a boundary and coding of S+ relative to the boundary. Consider an example from Thomas et al. (1973). Subjects in the 5-2 group were presented level 5 brightness as S+ and level 2 brightness as S−, while subjects in the 5-4 group were presented level 5 brightness as S+ and level 4 brightness as S−. All were then tested on the range 1–9, symmetric about S+. A group without S− showed a roughly symmetric generalization gradient with the peak at 5. Both the 5-2 and 5-4 groups showed peak shifts away from S− (i.e., peaks at values greater than 5), with the 5-2 group showing more shift. We, along with Thomas (1993) suppose that the subject codes the S+ in terms of its relation to a boundary (adaptation level), which serves to distinguish it from S−. For the 5-2 group, S+ is encoded as being a good deal beyond the boundary; for the 5-4 group, it is encoded as a little beyond the boundary. The boundaries would of course differ for the two groups, but we suppose that the memory for the exact boundary is weak while the memory for the amount beyond the boundary is much better. During tests then, the categorical mean of the test range biases the memory of the boundary. If the categorical mean is weighted a lot, which is predicted based on Bayesian grounds if the memory for the boundary is not good, then the bias will bring the boundaries for the two groups close together, both near 5, the mean of the test range. Because the 5-2 group remembered S+ as a good deal beyond the boundary, they would show a larger range effect.
A similar interpretation can be given to differential range effects arising from different ratios of S− to S+ during training (Thomas et al., 1985). If S− is overrepresented during training, the boundary is shifted toward S−, and S+ is coded as being a lot beyond the boundary. If in contrast S+ is overrepresented during training, the boundary is shifted toward S+ and S+ is remembered as a little beyond the boundary. In subsequent testing without feedback, the uncertainty about the boundary again means that the boundaries in both conditions shift to somewhere near the mean of the test range, for adaptive reasons. Because S+ is remembered as further from the boundary in the S− overrepresented group, this group should show a larger peak shift, which is precisely what Thomas et al. (1985, Experiment 1) found for the brightness dimension. If on the other hand, S+ and S− were presented equally often during training, but differentially during testing without feedback, then the results were opposite (Thomas et al., 1985, Experiment 2). In this case, as discussed previously, the differential ratio of S− to S+ on tests drives the category mean based on test experience differentially. Memory of the category mean is averaged with the memory of the boundary. Overrepresentation of S− drives this mean toward S−, and averaging with such a mean lessens the peak shift effect. A similar effect was obtained for line angle stimuli (Thomas et al., 1992), in this case overrepresenting one end or the other of the test range. This latter effect of the proportion of S− to S+ on tests cannot be explained by a signal detection account such as that presented recently by Lynn et al. (2005) for bumblebees. In the signal detection explanation, the point of peak shift is to avoid the error of misidentifying S−, or making false positives. With a higher proportion of S− on tests, this probability is increased, and the detection criterion should be more stringent, moving the generalization gradient in the opposite direction away from S−. This point cautions us that different functional accounts, both with the imprimatur of Bayesian analysis, can generate different predictions, and conditions under which each account may hold need very careful analysis. So does the issue of differentiating categorical encoding during stimulus learning and during tests.
On issue (2), conditions favoring better learning of the boundary ought to reduce range effects in peak-shift experiments, and as a consequence favor results in line with classic peak-shift effects. Thomas (1993, Figure 7) presented results showing that in a peak-shift experiment, more training with S+/S− discrimination led to smaller range effects on tests without feedback. This makes functional sense because if the boundary between S+ and S− is better learned, the participant should rely on it relatively more, and be less affected by the category mean on tests. To obtain peak shift effects, or at least to examine closely the conditions affecting peak shift, we have given ongoing training with S+/S− discrimination, only occasionally slipping in short blocks of tests without feedback (Cheng and Spetch, 2002; Spetch et al., 2004). These are conditions that minimize the weight given to the average found during testing. We also used symmetric test ranges to minimize any range effects. Both these factors understandably eliminate range effects, allowing us to examine conditions for peak shift.
The last kind of data that Thomas (1993) considered came from pigeons. Many studies have examined generalization gradients, but most present a single range in any condition that is more or less centered on the S+ (e.g., Guttman and Kalish, 1956; Blough, 1961), data that do not address the issue of range effects. In one case, well-trained pigeons have not shown central tendency shift (Thomas and Barker, 1964). Mechanistically, this might be expected because the pigeons had established a very strong adaptation level to the training stimulus. Functionally, a reliable encoding of the stimulus value should mean that it should be weighted most, with the categorical coding given little weighting. With far less training, it proved possible to obtain central tendency shift (Giurintano, 1972, as reported in Thomas, 1974). This was accomplished by first training pigeons extensively on one stimulus dimension (color), and then switching to a different stimulus dimension (line angle), which they could then learn quickly. Range effects have also been found on a successive discrimination task with flicker rate as the stimulus dimension (Hinson and Lockhead, 1986), quite a different experimental paradigm. Thus, with only a small amount of training, approaching the conditions of minimal training given to humans, the pigeons’ behavior resembled that of humans.
Conclusions
While the results from this study provide limited support for our predictions based on the CAM (Duffy et al., 2010), the larger picture of how the model accounts for a body of extant data impresses us. We have fitted every result reviewed in Thomas (1993) into the framework of functional explanation provided by averaging an uncertain metric value with a category mean. The metric value in question may be that of a particular target stimulus, or that of a boundary between the target stimulus and something else (the S−s). This large set of results was not selected for review with the CAM in mind. They were a comprehensive body of results that an adaptation-level theory, with some adjustments in some cases, can account for.
We suggest that future studies considering both mechanistic and functional analyses of human cognition would be highly fruitful, a movement championed by Huttenlocher and colleagues (Huttenlocher et al., 1988, 1991, 1994, 2000, 2004; Newcombe et al., 1999; Cheng et al., 2007; Duffy et al., 2010) and exemplified by those taking a Bayesian approach to human cognition (Deneve and Pouget, 2004; Cheng et al., 2007; Körding, 2007). We can make some evolutionary arguments based on our analysis. We doubt that the machinery of adaptation level in human cognition is a peculiarity that sometimes generates “mistaken” biases. The pattern of results seems to us too arcane to be a mistake in evolution. We would rather argue that this machinery is adaptive, for the Bayesian reasons given in CAM, and that it has been selected in the course of human evolution. The power of functional analyses lies in the additional understanding of why some peculiar characteristics might be found in human cognition, in the process resulting in a fuller psychology. The same reasons ought to apply to other animals that code categories and metric values of stimuli, so that a comparative approach (Shettleworth, 2010, ch. 2) is well worth taking, both in seeing how widespread such a pattern is, and to trace its evolutionary origins. We welcome a psychological science embracing all of Tinbergen’s (1963) why questions.
Conflict of Interest Statement
The authors declare that the research was conducted in the absence of any commercial or financial relationships that could be construed as a potential conflict of interest.
Acknowledgments
The research was supported by a grant from Macquarie University to Ken Cheng, a discovery grant from the Natural Sciences and Engineering Research Council to Marcia L. Spetch, and a graduate research fund from Macquarie University to Andros Hoan. We thank Bernd Kohler for programming assistance.
References
Blough, D. S. (1961). The shape of some wavelength generalization gradients. J. Exp. Anal. Behav. 4, 31–40.
Bouton, M. E. (2007). Learning and Behavior: A Contemporary Synthesis. Sunderland, MA: Sinauer Associates.
Cheng, K., Shettleworth, S. J., Huttenlocher, J., and Rieser, J. J. (2007). Bayesian integration of spatial information. Psychol. Bull. 133, 625–637.
Cheng, K., and Spetch, M. L. (2002). Spatial generalization and peak shift in humans. Learn. Motiv. 33, 358–389.
Deneve, S., and Pouget, A. (2004). Bayesian multisensory integration and cross-modal spatial links. J. Physiol. Paris 98, 249–258.
Domjan, M. (2006). The Principles of Learning and Behavior, 5th Edn. Belmont, CA: Thomson Wadsworth.
Duffy, S., Huttenlocher, J., Hedges, L. V., and Crawford, L. E. (2010). Category effects on stimulus estimation: shifting and skewed frequency distributions. Psychon. Bull. Rev. 17, 224–230.
Evans, C. S., Wenderoth, P., and Cheng, K. (2000). Detection of bilateral symmetry in complex biological images. Perception 29, 31–42.
Giurintano, L. P. (1972). Stimulus Generalization in Humans and Pigeons as a Function of Training and Test Parameters. Boulder: University of Colorado, Boulder.
Guttman, N., and Kalish, H. I. (1956). Discriminability and stimulus generalization. J. Exp. Psychol. 51, 79–88.
Hanson, H. M. (1959). Effects of discrimination training on generalization. J. Exp. Psychol. 51, 79–88.
Hébert, J. A., Bullock, M., Levitt, L., Woodward, K. G., and McGuirk, F. D. (1974). Context and frequency effects in the generalization of a human voluntary response. J. Exp. Psychol. 102, 456–462.
Hébert, J. A., and Capeheart, J. E. (1969). Generalization of a voluntary response as a function of presentation frequency of the training stimulus in testing. Psychon. Sci. 16, 315–316.
Hébert, J. A., Origlio, D. P., and McGuirk, F. D. (1972). Training and testing effects in the generalization of a voluntary response. Psychon. Sci. 26, 209–210.
Helson, H., and Avant, L. L. (1967). Stimulus generalization as a function of contextual stimuli. J. Exp. Psychol. 73, 565–567.
Hinson, J. M., and Lockhead, G. R. (1986). Range effects in successive discrimination. J. Exp. Psychol. Anim. Behav. Process 12, 270–276.
Holbrook, R. I., and Burt de Perera, T. (2009). Separate encoding of vertical and horizontal components of space during orientation in fish. Anim. Behav. 78, 241–245.
Huttenlocher, J., Hedges, L., and Prohaska, V. (1988). Hierarchical organization in ordered domains: estimating the dates of events. Psychol. Rev. 95, 471–484.
Huttenlocher, J., Hedges, L. V., Corrigan, B., and Crawford, L. E. (2004). Spatial categories and the estimation of location. Cognition 93, 75–97.
Huttenlocher, J., Hedges, L. V., and Duncan, S. (1991). Categories and particulars: prototype effects in estimating spatial location. Psychol. Rev. 98, 352–376.
Huttenlocher, J., Hedges, L. V., and Vevea, J. L. (2000). Why do categories affect stimulus judgement? J. Exp. Psychol. Gen. 129, 220–241.
Huttenlocher, J., Newcombe, N. S., and Sandberg, E. H. (1994). The coding of spatial location in young children. Cogn. Psychol. 27, 115–147.
Kosslyn, S. M. (1987). Seeing and imagining in the cerebral hemispheres: a computational approach. Psychol. Rev. 94, 148–175.
Legge, E. L. G., Spetch, M. L., and Batty, E. R. (2009). Pigeons’ (Columba livia) hierarchical organization of local and global cues in touch screen tasks. Behav. Process 80, 128–139.
Lewis, M. B., and Johnston, R. A. (1999). Are caricatures special? Evidence of peak-shift in face recognition. Eur. J. Cogn. Psychol. 11, 105–117.
Lynn, S. K., Cnaani, J., and Papaj, D. R. (2005). Peak shift discrimination learning as a mechanism of signal evolution. Evolution 59, 1300–1305.
Mandler, J. M., and Parker, R. E. (1976). Memory for descriptive and spatial information in complex pictures. J. Exp. Psychol. Hum. Learn Mem. 2, 38–48.
Newcombe, N. S., Huttenlocher, J., Sandberg, E. H., Lie, E., and Johnson, S. (1999). What do misestimations and asymmetries in spatial judgement indicate about spatial representation? J. Exp. Psychol. Learn Mem. Cogn. 25, 986–996.
Newlin, R. J., Rodgers, J. P., Dickson, J. F. J., Strub, H., and Thomas, D. R. (1978). The central tendency effect in stimulus generalization: effects of establishing a “preexperimental” frame of reference. Percept. Psychophys. 24, 161–167.
Newlin, R. J., Rodgers, J. P., and Thomas, D. R. (1979). Two determinants of the peak shift in human voluntary stimulus generalization. Percept. Psychophys. 25, 478–486.
Quinn, P. C. (2004). Visual perception of orientation is categorical near vertical and continuous near horizontal. Perception 33, 897–906.
Rilling, M. (1977). “Stimulus control and inhibitory processes,” in Handbook of Operant Behavior, eds W. K. Honig and J. E. R. Staddon (Englewood Cliffs, NJ: Prentice Hall), 432–480.
Shettleworth, S. J. (2010). Cognition, Evolution, and Behavior, 2nd Edn. New York: Oxford University Press.
Spence, K. W. (1937). The differential response in animals to stimuli varying within a single dimension. Psychol. Rev. 44, 430–444.
Spetch, M. L., Cheng, K., and Clifford, C. W. G. (2004). Peak shift but not range effects in recognition of faces. Learn. Motiv. 35, 221–241.
Thomas, D. R. (1962). The effects of drive and discrimination training on stimulus generalization. J. Exp. Psychol. 64, 24–28.
Thomas, D. R. (1974). “The role of adaptation-level in stimulus generalization,” in The Psychology of Learning and Motivation, ed. G. H. Bower (San Diego, CA: Academic Press), 91–145.
Thomas, D. R. (1993). A model for adaptation-level effects on stimulus generalization. Psychol. Rev. 100, 658–673.
Thomas, D. R., and Barker, E. G. (1964). The effects of extinction and central tendency on stimulus generalization in pigeons. Psychon. Sci. 1, 119–120.
Thomas, D. R., and Jones, C. G. (1962). Stimulus generalization as a function of the frame of reference. J. Exp. Psychol. 64, 77–80.
Thomas, D. R., Lusky, M., and Morrison, S. (1992). A comparison of generalization functions and frame of reference effects in different training paradigms. Percept. Psychophys. 51, 529–540.
Thomas, D. R., Mood, K., Morrison, S., and Wiertelak, E. (1991). Peak shift revisited: a test of alternative interpretations. J. Exp. Psychol. Anim. Behav. Proc. 17, 130–140.
Thomas, D. R., Strub, H., and Dickson, J. F. (1974). Adaptation level and the central tendency effect in stimulus generalization. J. Exp. Psychol. 103, 466–474.
Thomas, D. R., Svinicki, M. D., and Vogt, J. (1973). Adaptation level as a factor in human discrimination learning and stimulus generalization. J. Exp. Psychol. 97, 210–219.
Thomas, D. R., and Thomas, D. H. (1974). Stimulus labeling, adaptation level, and the central tendency shift. J. Exp. Psychol. 103, 896–899.
Thomas, D. R., Windell, B. T., Williams, J. L., and White, K. G. (1985). Stimulus presentation frequency in brightness discrimination and generalization: a test of adaptation-level and signal-detection interpretations. Percept. Psychophys. 37, 243–248.
Tlauka, M., Wilson, P. N., Adams, M., Souter, C., and Young, A. H. (2007). An investigation into vertical bias effects. Spatial Cogn. Comput. 7, 365–391.
Tomie, A., and Thomas, D. R. (1974). Adaptation level as a factor in human wavelength generalization. J. Exp. Psychol. 103, 29–36.
Trojano, L., Grossi, D., Linden, D. E. J., Formisano, E., Goebel, R., Cirillo, S., Elefante, R., and Di Salle, F. (2002). Coordinate and categorical judgements in spatial imagery. An fMRI study. Neuropsychologia 40, 1666–1674.
Keywords: range effect, category, category adjustment model, spatial memory, human
Citation: Cheng K, Spetch ML and Hoan A (2010) Categories and range effects in human spatial memory. Front. Psychology 1:231. doi: 10.3389/fpsyg.2010.00231
Received: 13 September 2010;
Accepted: 07 December 2010;
Published online: 21 December 2010.
Edited by:
Michael Platt, Duke University, USACopyright: © 2010 Cheng, Spetch and Hoan. This is an open-access article subject to an exclusive license agreement between the authors and the Frontiers Research Foundation, which permits unrestricted use, distribution, and reproduction in any medium, provided the original authors and source are credited.
*Correspondence: Ken Cheng, Department of Biological Sciences, Macquarie University, Sydney, NSW 2109, Australia. e-mail: ken.cheng@mq.edu.au