 Yixiong Cui
 Yue Zhao2*
 Miguel-Ángel Gómez
 Ran Wei
 Yuanlong Liu
- 1AI Sports Engineering Lab, School of Sports Engineering, Beijing Sport University, Beijing, China
- 2School of Physical Education, Beijing Sport University, Beijing, China
- 3Facultad de Ciencias de la Actividad Física y del Deporte–INEF, Universidad Politécnica de Madrid, Madrid, Spain
- 4College of Education and Human Development, Western Michigan University, Kalamazoo, MI, United States
- 5Department of Human Performance and Health Education, Western Michigan University, Kalamazoo, MI, United States
The performance of professional tennis players in the four major Grand Slam tournaments has always been an important research topic, which advances the understanding of the current development of tennis. However, there is little known about the difference between higher-ranked and lower-ranked players considering match performance statistics. The study was aimed to explore the technical, tactical, and physical performance indicators that best discriminate seeded and non-seeded male players in Grand Slams. A total of 549 matches played by 189 individual players during 2015–2017 Grand Slam men’s singles were sampled, with corresponding match statistics gathered for each player observation, concerning players’ serving, returning, net point, break point, efficiency, and physical performance. The results showed that the seeded players outperformed the non-seeded players in serve and return, break point, net point, and efficiency-related indicators, while the following indicators contributed most to the separation of two player categories: serve and return of serve points won (%), ace (%), peak serve speed, net points won (%), break point per return game, break point saved, winner and unforced error ratio, and dominance ratio. The research findings evidenced the decreased competitive balance in men’s competition during Grand Slams due to a rank-based seeding system, whereas coaches could use the information to fine-tune the training benchmarks and match planning.
Introduction
The annual four major tennis tournaments (Australian Tennis Open, French Open, Wimbledon, and US Open), also known as Grand Slams, represent the highest level of professional tennis in the world (Gillet et al., 2009; Cui et al., 2017, 2019a). They not only own the longest tournament history, but brings together the top-ranked professional tennis players that compete along a period of 2 weeks, aspiring for the highest tournament prizes and points (Ma et al., 2013; Prieto-Bermejo and Gómez-Ruano, 2016; Reid et al., 2016; Cui et al., 2018). Moreover, the competitiveness of Grand Slams is also characterized by its best of five sets (best of three sets for female players) match format and an intensive draw of 128 players (Goossens et al., 2015; Prieto-Bermejo and Gómez-Ruano, 2016). Therefore, analyzing the form and function of match performance, these influential events for tennis players may provide a better understanding on how tennis tactics and strategies have developed in the elite level, and inform coaches of the technical, tactical, and physical demands of the most competitive situation. Consequently, knowledge gained from the quantification of performance could serve as a catalyst for optimized training and match arrangements (Reid et al., 2016; Woods et al., 2018, 2019).
In professional tennis matches, relevant literature has investigated the performance of players during different Grand Slams (O’Donoghue and Ingram, 2001; Ma et al., 2013; Tudor et al., 2014; Cui et al., 2018; Smith et al., 2018), focusing on topics such as match activity profiles (O’Donoghue, 2005; Johnson and McHugh, 2006), physiological responses of both male and female players (Reid and Duffield, 2014; Smith et al., 2018), effects of experience and individual features (Cui et al., 2017, 2019a), stroke and movement characteristics (Hizan et al., 2015; Reid et al., 2016; Whiteside and Reid, 2017), and evolution of certain performance aspect (such as serve speed, serve efficiency) (Cross and Pollard, 2009; Gillet et al., 2009). It has been well established that tennis match strategies and performance in these major events are conditioned by a myriad of factors such as court surfaces (O’Donoghue and Ingram, 2001; Cui et al., 2018), temperature and induced fatigue (Sell et al., 2013; Smith et al., 2018), gender difference (Hizan et al., 2015; Reid et al., 2016), player’s experience, relative quality, and anthropometric attributes (Vaverka and Cernosek, 2013; Cui et al., 2019a). Specifically concerning the opposition quality, it was reported that more experienced and taller players outperformed their peers in all of Grand Slams, especially achieving higher serve points won and break points conversion rate (Cui et al., 2018, 2019a). This extensive range of work provides insights into nuance of elite tennis match performance indicators and inform evidence-based training. Based on the extant findings, other aspects may also warrant consideration as research remains inclusive about how players’ match behavior is influenced by tournament seeding.
A seed in a tennis tournament is a player who is assigned with a preliminary ranking within the draw prior to the event. The process of seeding is usually determined by the tournament committee, using official Association of Tennis Professionals (ATP) rankings of players in the last 52 weeks as selection criterion (del Corral, 2009). Under such arrangement, seeded players will not need to play against each other until late in the tournament (the first and second seeds will not play against each other until the final), and they match with lower-ranked players in the first two rounds (Scheibehenne and Bröder, 2007). In Grand Slams, the seeding system of a 128-player main draw has evolved from initially including 8 seeded players to the current 32 seeds (del Corral, 2009). It is claimed that seeding system influences the competitive balance among all players, and as a result of audience preferences, it protects higher-rank contestants from early elimination (Du Bois and Heyndels, 2007; del Corral, 2009). Nonetheless, not all top 32 ranked players are necessarily seeded players as their previous performance on the events’ playing surfaces would also be considered (Scheibehenne and Bröder, 2007). Despite the fact that seeding could determine how much further players (especially low-ranked seeded players and non-seeded players) might proceed within Grand Slams, to date, research pertinent to the match performance of seeded and non-seeded players is scarce. The study by Whiteside et al. (2016) assessed players’ performance based on rankings and found that top-ranked players achieved more aces, serve points won, faster serve returns, and deeper ball placement than lower ranked players in the Australian Open. Of further relevance, del Corral (2009) reported a higher competitive balance in male players than female players during Grand Slams. However, there is a need to comprehensively evaluate the difference in match performance between seeds and non-seeds across all Grand Slam tournaments.
Since tennis performance at the highest level could be instructive to a fine-tuned training and match preparation process, it would be helpful to consolidate the understanding of how seeding system influences competitive match-play characteristics and to provide more realistic implications for players, especially those underdogs—non-seeded players. Therefore, the study was set to assess the difference in match performance indicators between seeded and non-seeded players in four Grand Slams men’s singles and establish the performance profiles of two groups of players, using key performance indicators that most differentiate them. It was expected that seeded players outperformed the non-seeded ones in serve-and-return, break point, net, and efficiency performance, while covering less distance (Cui et al., 2017).
Materials and Methods
Sample and Data
The study included 189 male professional players from 594 matches from four Grand Slams during the 2015–2017 season, which were 1,188 player observations (Australian Open: 148 individual players; French Open: 69 individual players; Wimbledon: 108 individual players; US Open: 108 individual players). The number of matches performed by individual players ranged from 1 to 17 (see Table 1). In the Australian Open (AO1), there were 269 seeded player observations (ranking: 13.2 ± 10.3) and 223 non-seeded player observations (ranking: 94.5 ± 80.8), French Open (FO2): 106 seeded player observations (ranking: 8.9 ± 7.1) and 48 non-seeded player observations (ranking: 96.3 ± 52.1), Wimbledon (W3): 162 seeded player observations (ranking: 12.8 ± 10.5) and 118 non-seed player observations (ranking: 97.8 ± 82.9), and US Open (US4): 157 seeded player observations (ranking: 12.6 ± 9.6) and 105 non-seeded player observations (ranking: 93.3 ± 91.5). The relevant match statistics of these players were obtained correspondent with tournament organizers. To avoid incompleteness of dataset, matches with withdrawn players were excluded and only those played on courts equipped with Hawk-eye tracking system (Hawk-Eye Innovations, Basingstoke, United Kingdom) were selected, which screened out 549 matches. The reliability of the match data and data collection process were previously tested and proved to be highly reliable (Cui et al., 2017). The study was undertaken under the approval of the local University Ethics Committee (Approval number: BSU2020009H) and all procedures were subject to all international standards and Declaration of Helsinki.
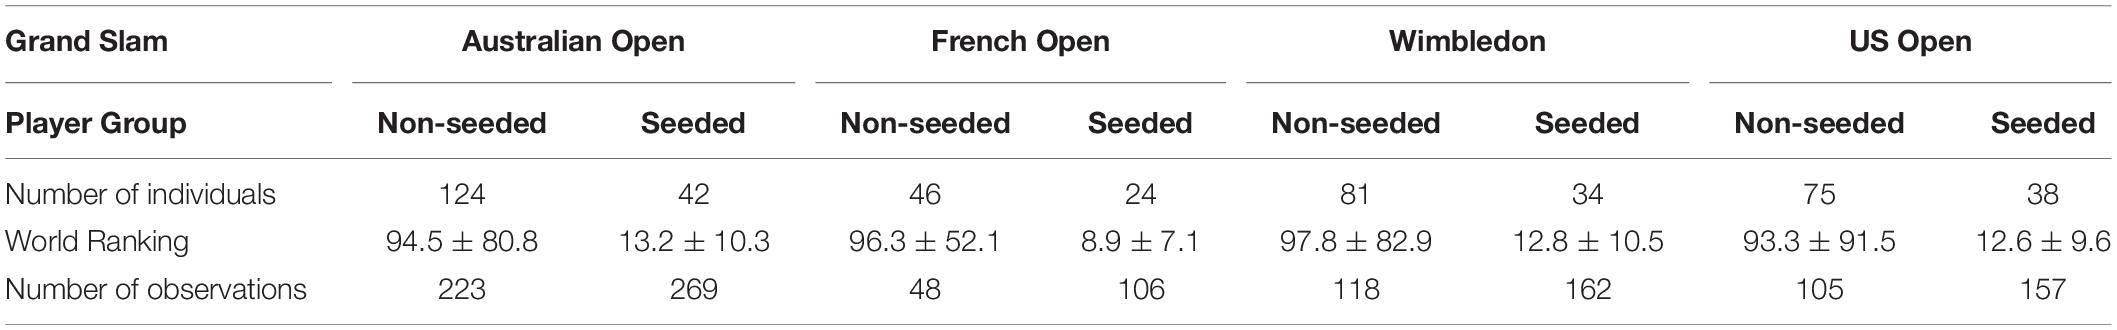
Table 1. Distribution and ranking (mean ± SD) of sampled players from four Grand Slams.
Performance Indicators
In this study, the seeded and non-seeded players were regarded as either independent or dependent variables in the following analysis. Match performance indicators related to players’ technical–tactical and physical behaviors in different Grand Slam tournaments were considered as dependent as well as independent variables. The raw match data were cleaned, organized, and computed to avoid misinterpretation of the player’s performance into 38 performance indicators after synthesizing from the previous literature (O’Donoghue, 2005; Gillet et al., 2009; Reid et al., 2016; Cui et al., 2018, 2019a). Table 2 shows each performance indicator according to the following categories: serving variables, returning variables, net point variables, break point variables, efficiency variables, and physical variables, and Supplementary Table 1 depicts their corresponding definitions.
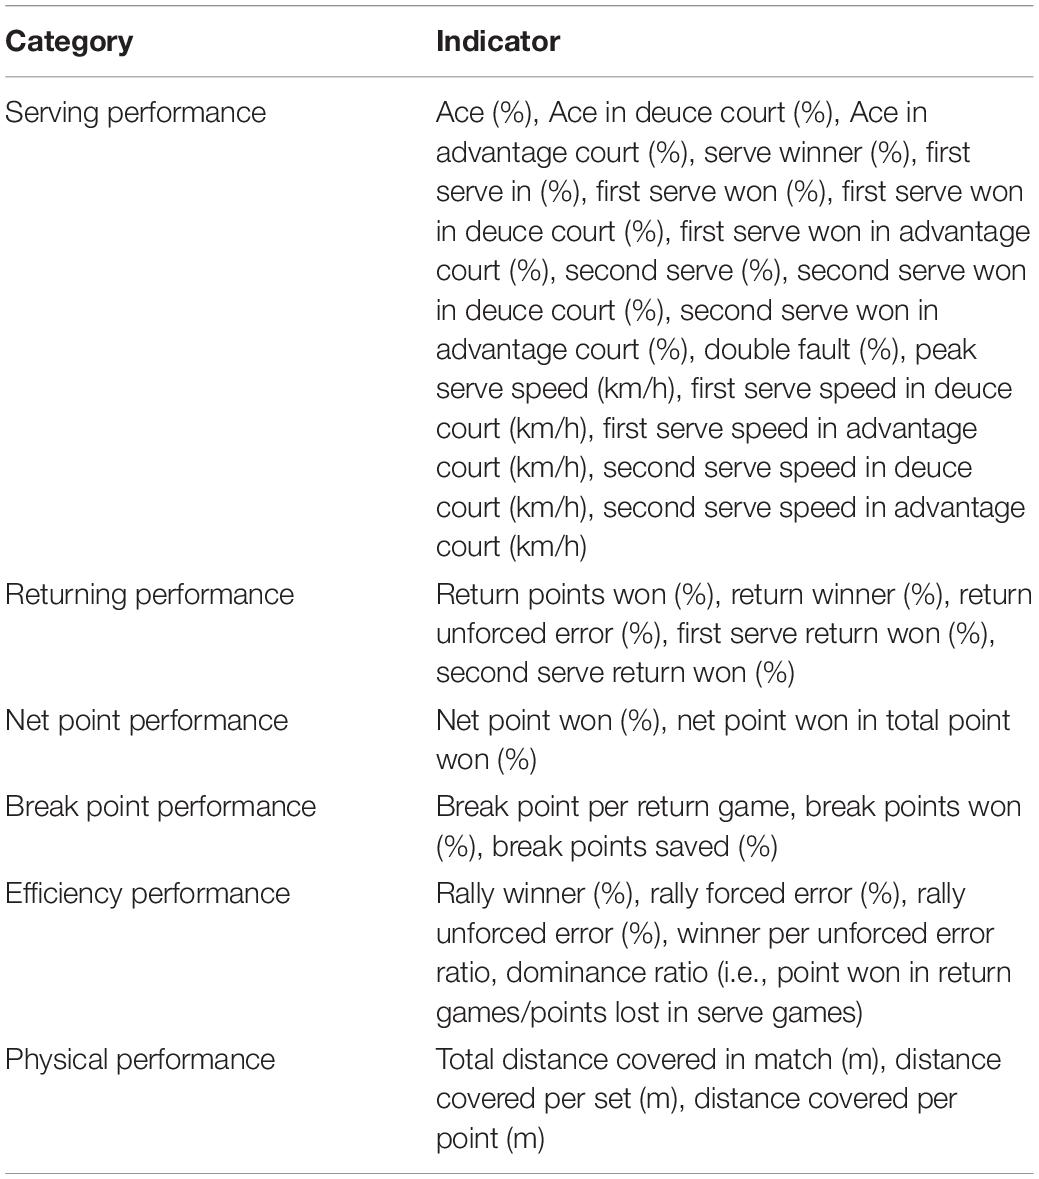
Table 2. List of performance indicators.
Statistical Analyses
Descriptive statistics (mean and standard deviation) were calculated for each performance indicator of seeded and non-seeded players, considering different tournaments. After testing the data normality distribution (Kolmogorov-Smirnov test), the independent t test was employed to compare the differences between seeded and non-seeded players in all indicators within distinct Grand Slam and while Mann–Whitney U test was run for other variables when the variables were not normally distributed. The meaningfulness of differences for t test was interpreted using standardized mean differences (Cohen’s d) as effect size statistics, which was calculated and interpreted by the following criteria: 0.2, trivial; 0.6, small; 1.2, moderate; 2.0, large; 4.0, very large; and ≥4.0, extreme large (Hopkins et al., 2009). For Mann–Whitney U test, r was used as effect size and interpreted according to the following thresholds: 0.3, small; 0.50, moderate; ≥0.5, large (Cohen, 1988).
Variables that were significantly different between two groups of players were then selected for the discriminant analysis, where seeded and non-seeded were taken as dependent variables. The analysis was to determine key performance indicators that best differentiate seeded and non-seeded players. Squared canonical correlation and partial eta square (ηp2) were used as the effect sizes for discriminant functions (Field, 2013; Cui et al., 2019a). The interpretation of was as follows: 0.09, small; 0.25, moderate; large, ≥0.25, while the strength of ηp2 was interpreted as follows: 0.06, small; 0.14, moderate; large, ≥0.14 (Cohen, 1988). In a significant discriminant function, performance indicators were considered a meaningful contributor to the differentiation of seeded and non-seeded players if their absolute value of the structural coefficient (SC) was greater than 0.30 (Sampaio et al., 2006). Afterward, the subsequent graphs of discriminant scores distribution were drawn using Matlab2018a (MathWorks, Inc., Natick, MA, United States) and the normative profiles of seeded and non-seeded players were plotted using means of key performance indicators in each Grand Slam (Figures 1, 2). The alpha level was set at p < 0.01 for all tests. All analyses were executed using Statistical Package for the Social Sciences 25 (SPSS Inc., Chicago, IL, United States).
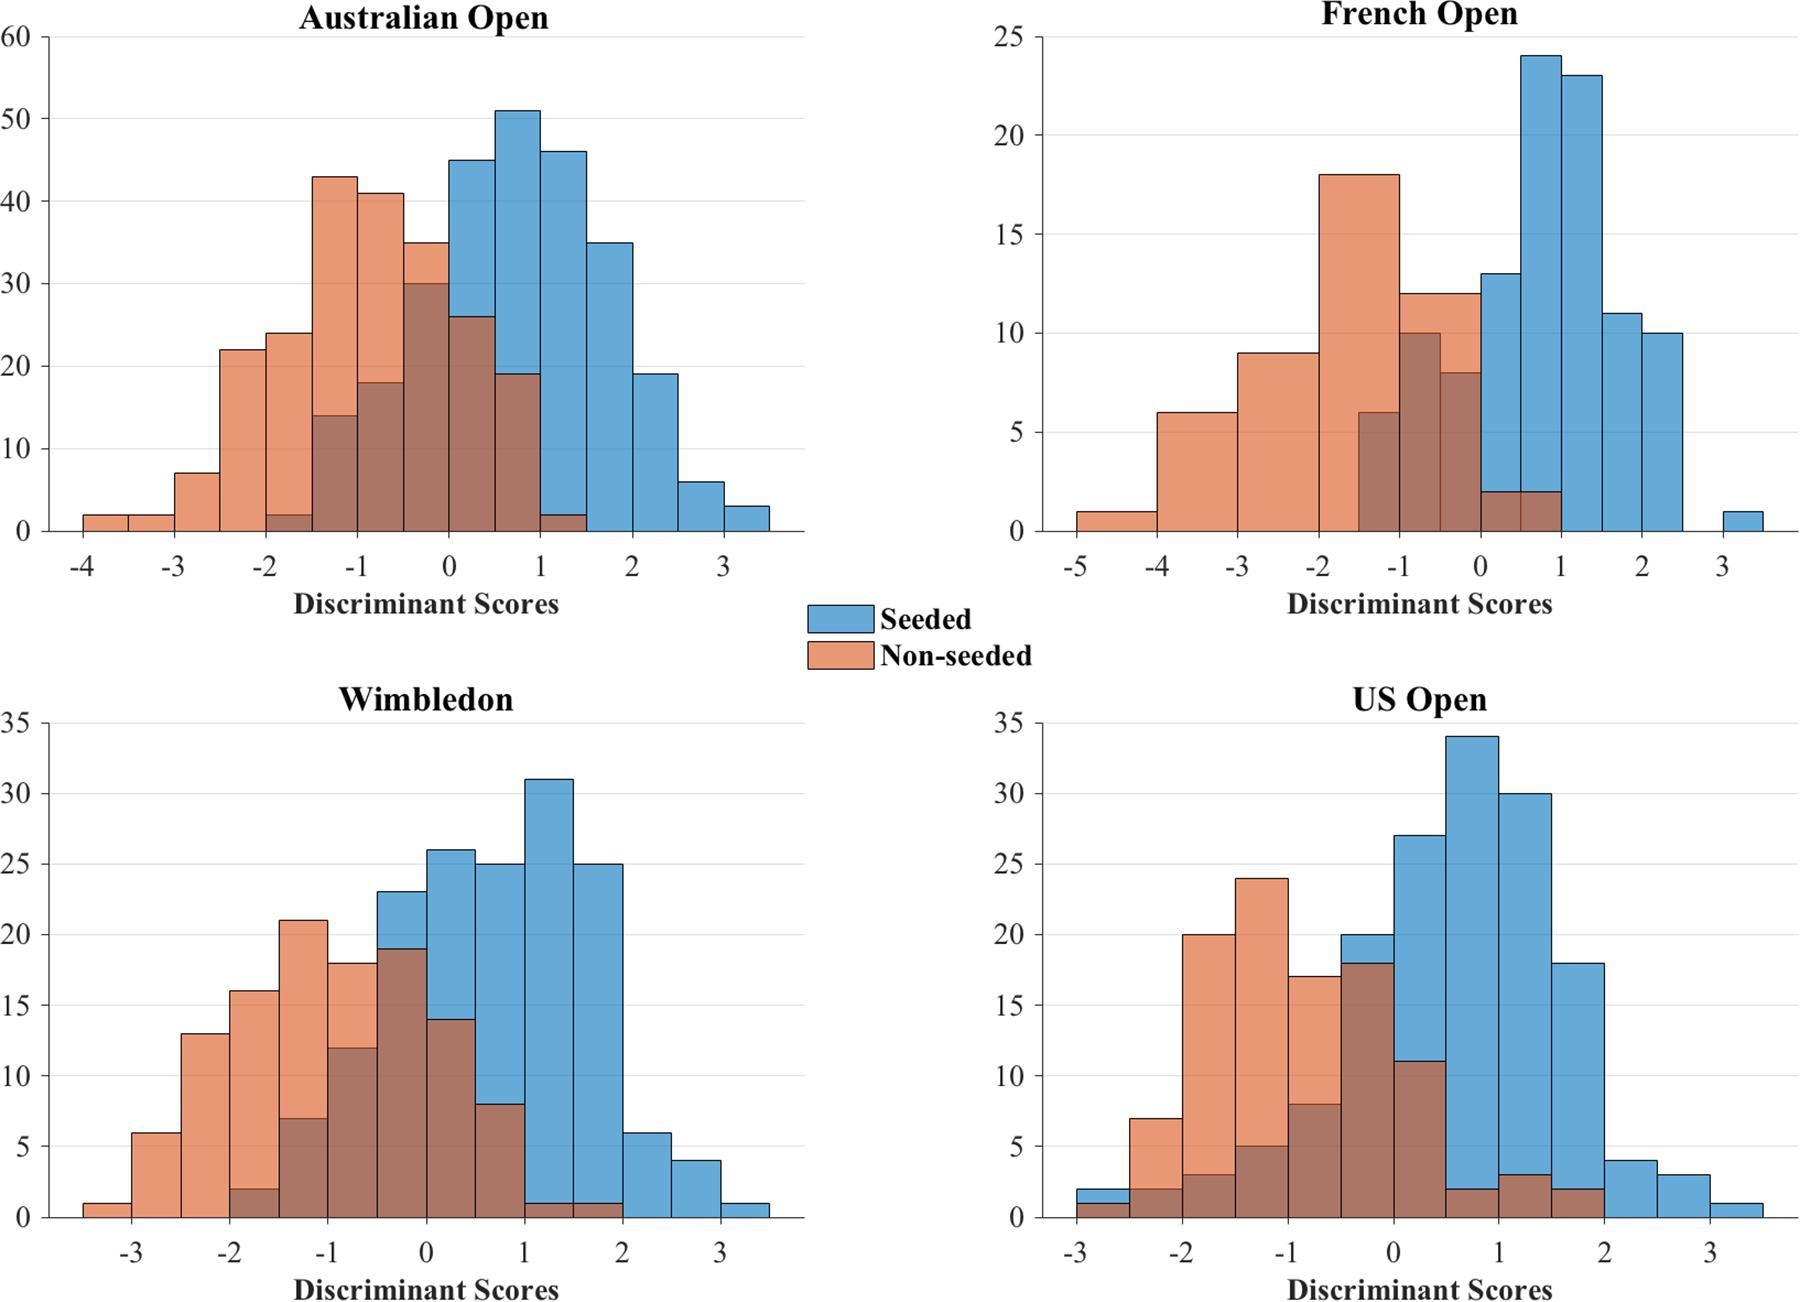
Figure 1. Distribution of discriminant scores for seeded and non-seeded player groups in the four Grand Slams.
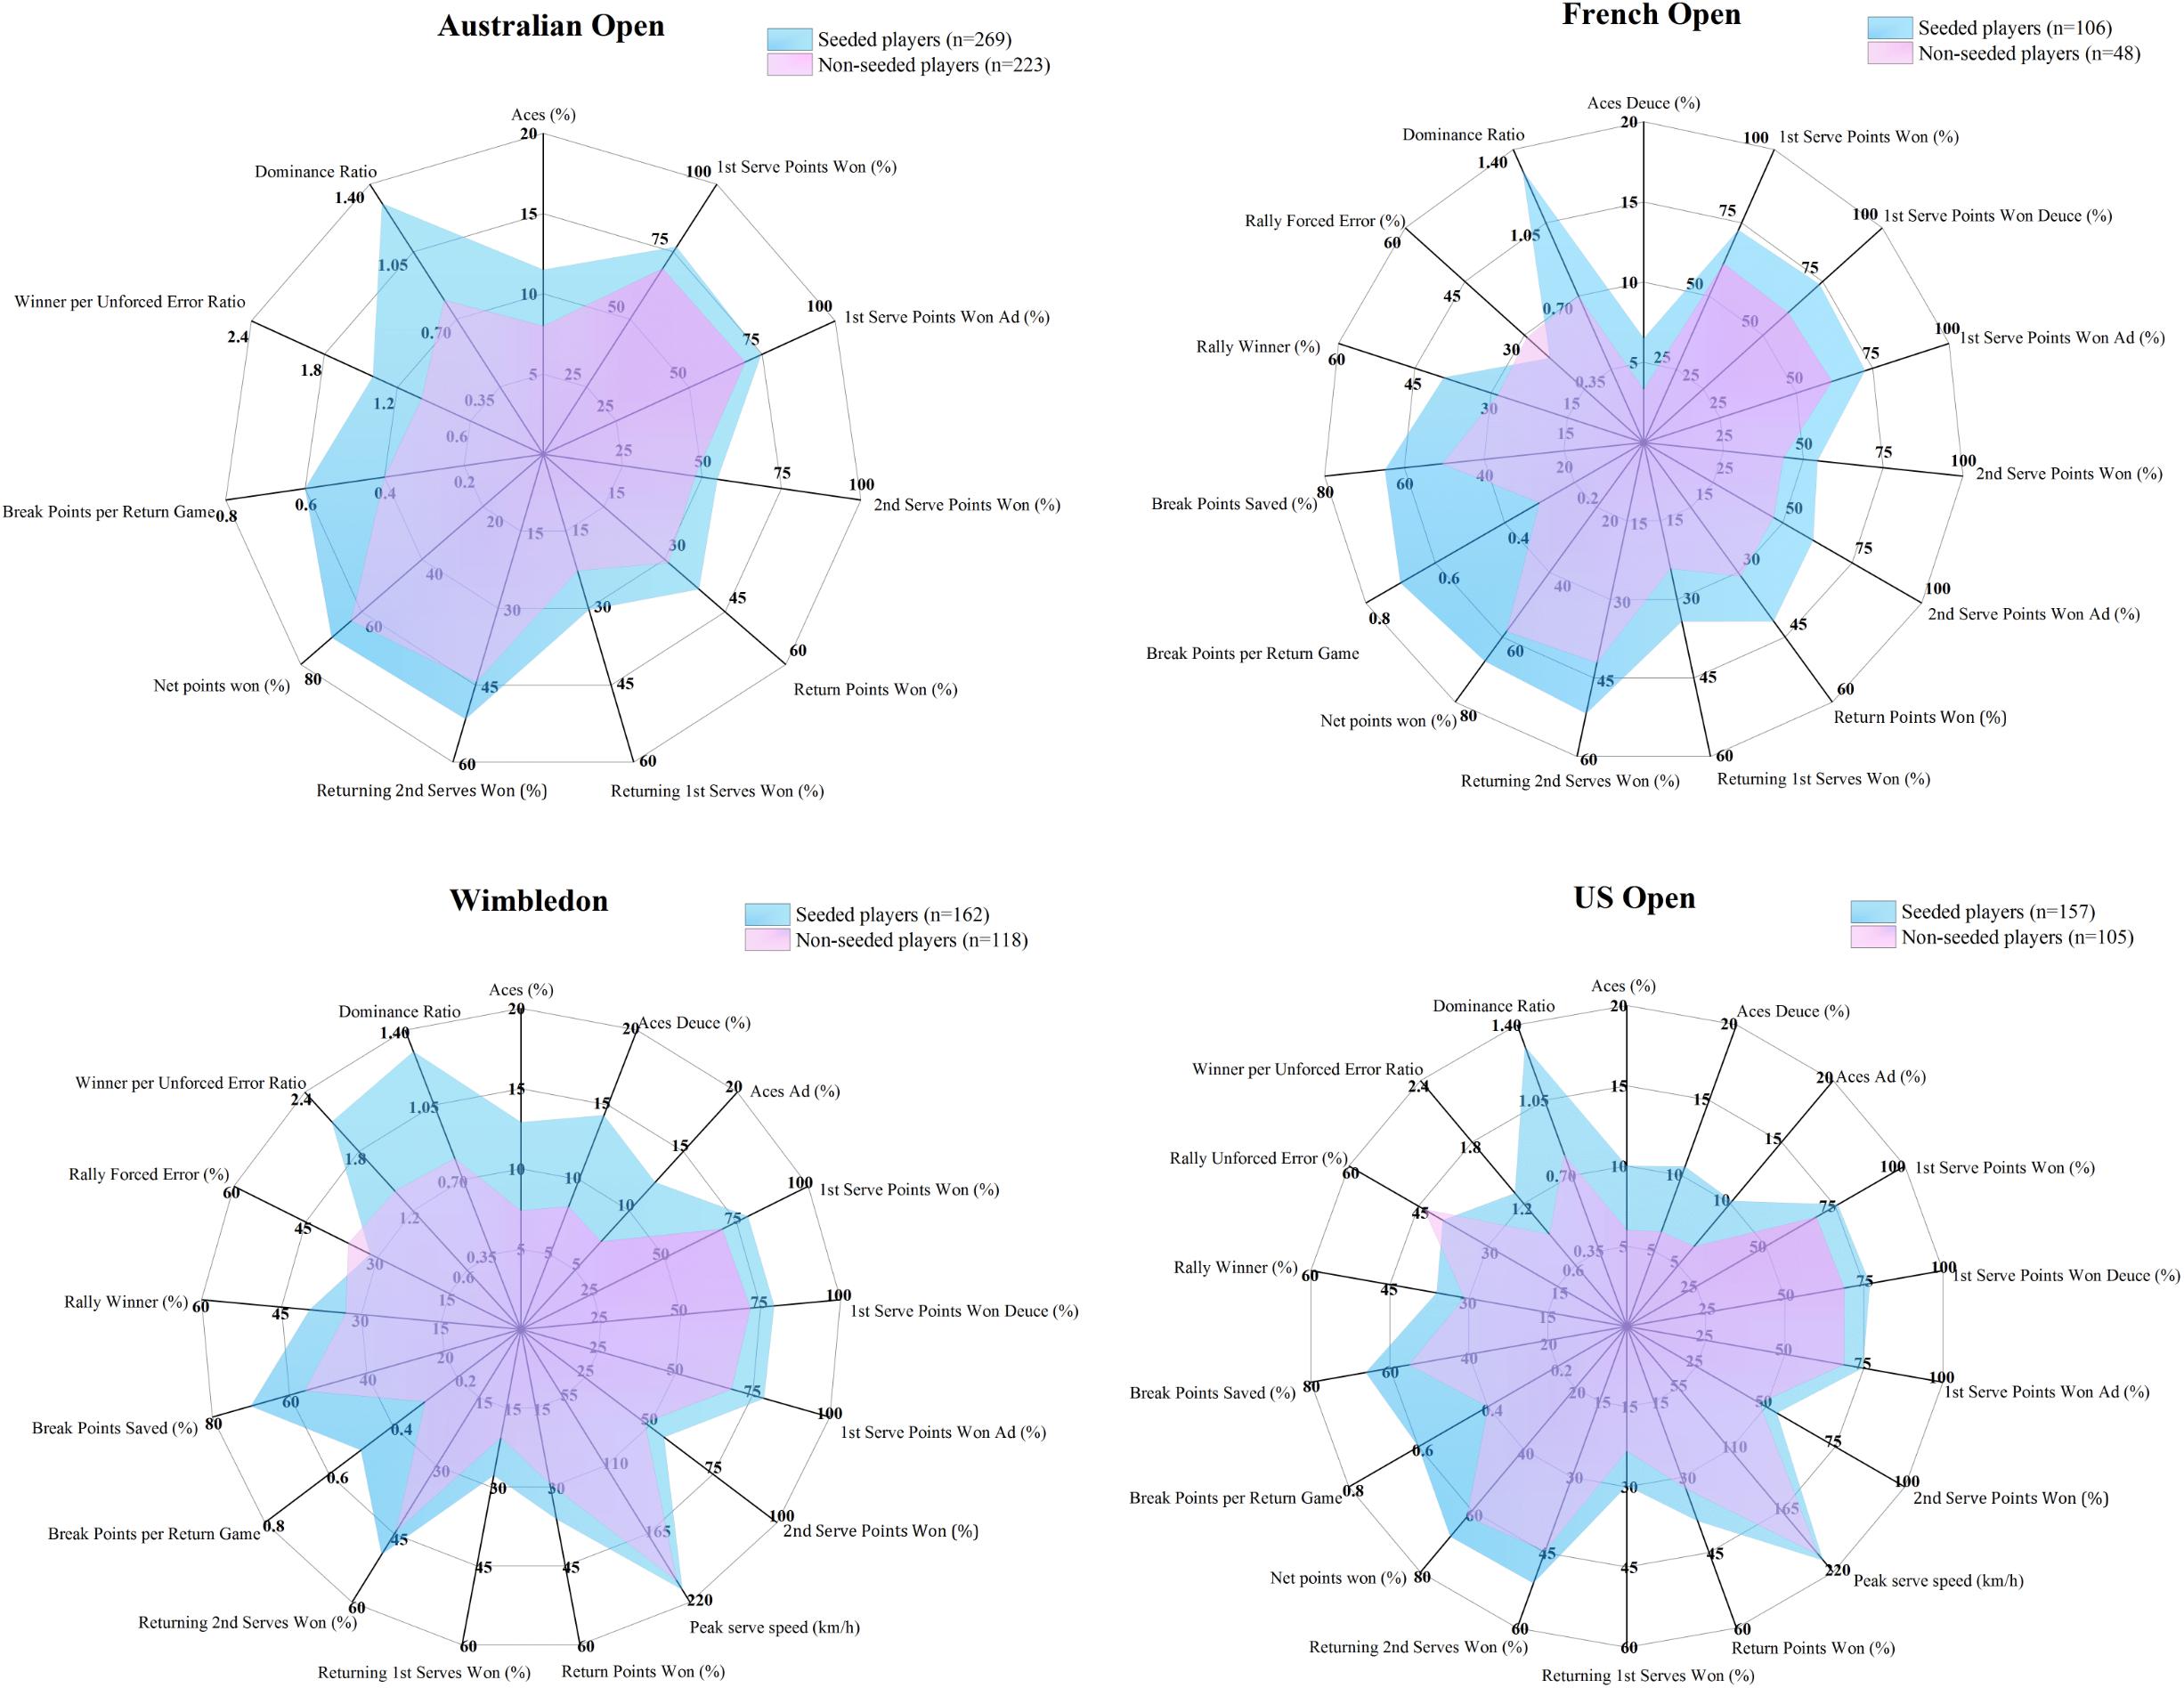
Figure 2. Performance profiles of two player groups using key indicators during the four Grand Slams. Each indicator was charted according to the corresponding scale.
Results
Tables 3, 4 show the descriptive data and comparisons of the technical, tactical, and physical indicators between two player groups during the four major Slams. It was demonstrated that seeded players outperformed the non-seeded in serve and return, net point, break point, and efficiency-related indicators (p < 0.01, Cohen’s d: 0.25–1.45, r: 0.13–0.62). No significant difference was shown between two groups in Average 2nd Serve Speed AD, Return Winner, Return UE, Net Point Won in Total Points Won, and Total Distance Covered in Match.
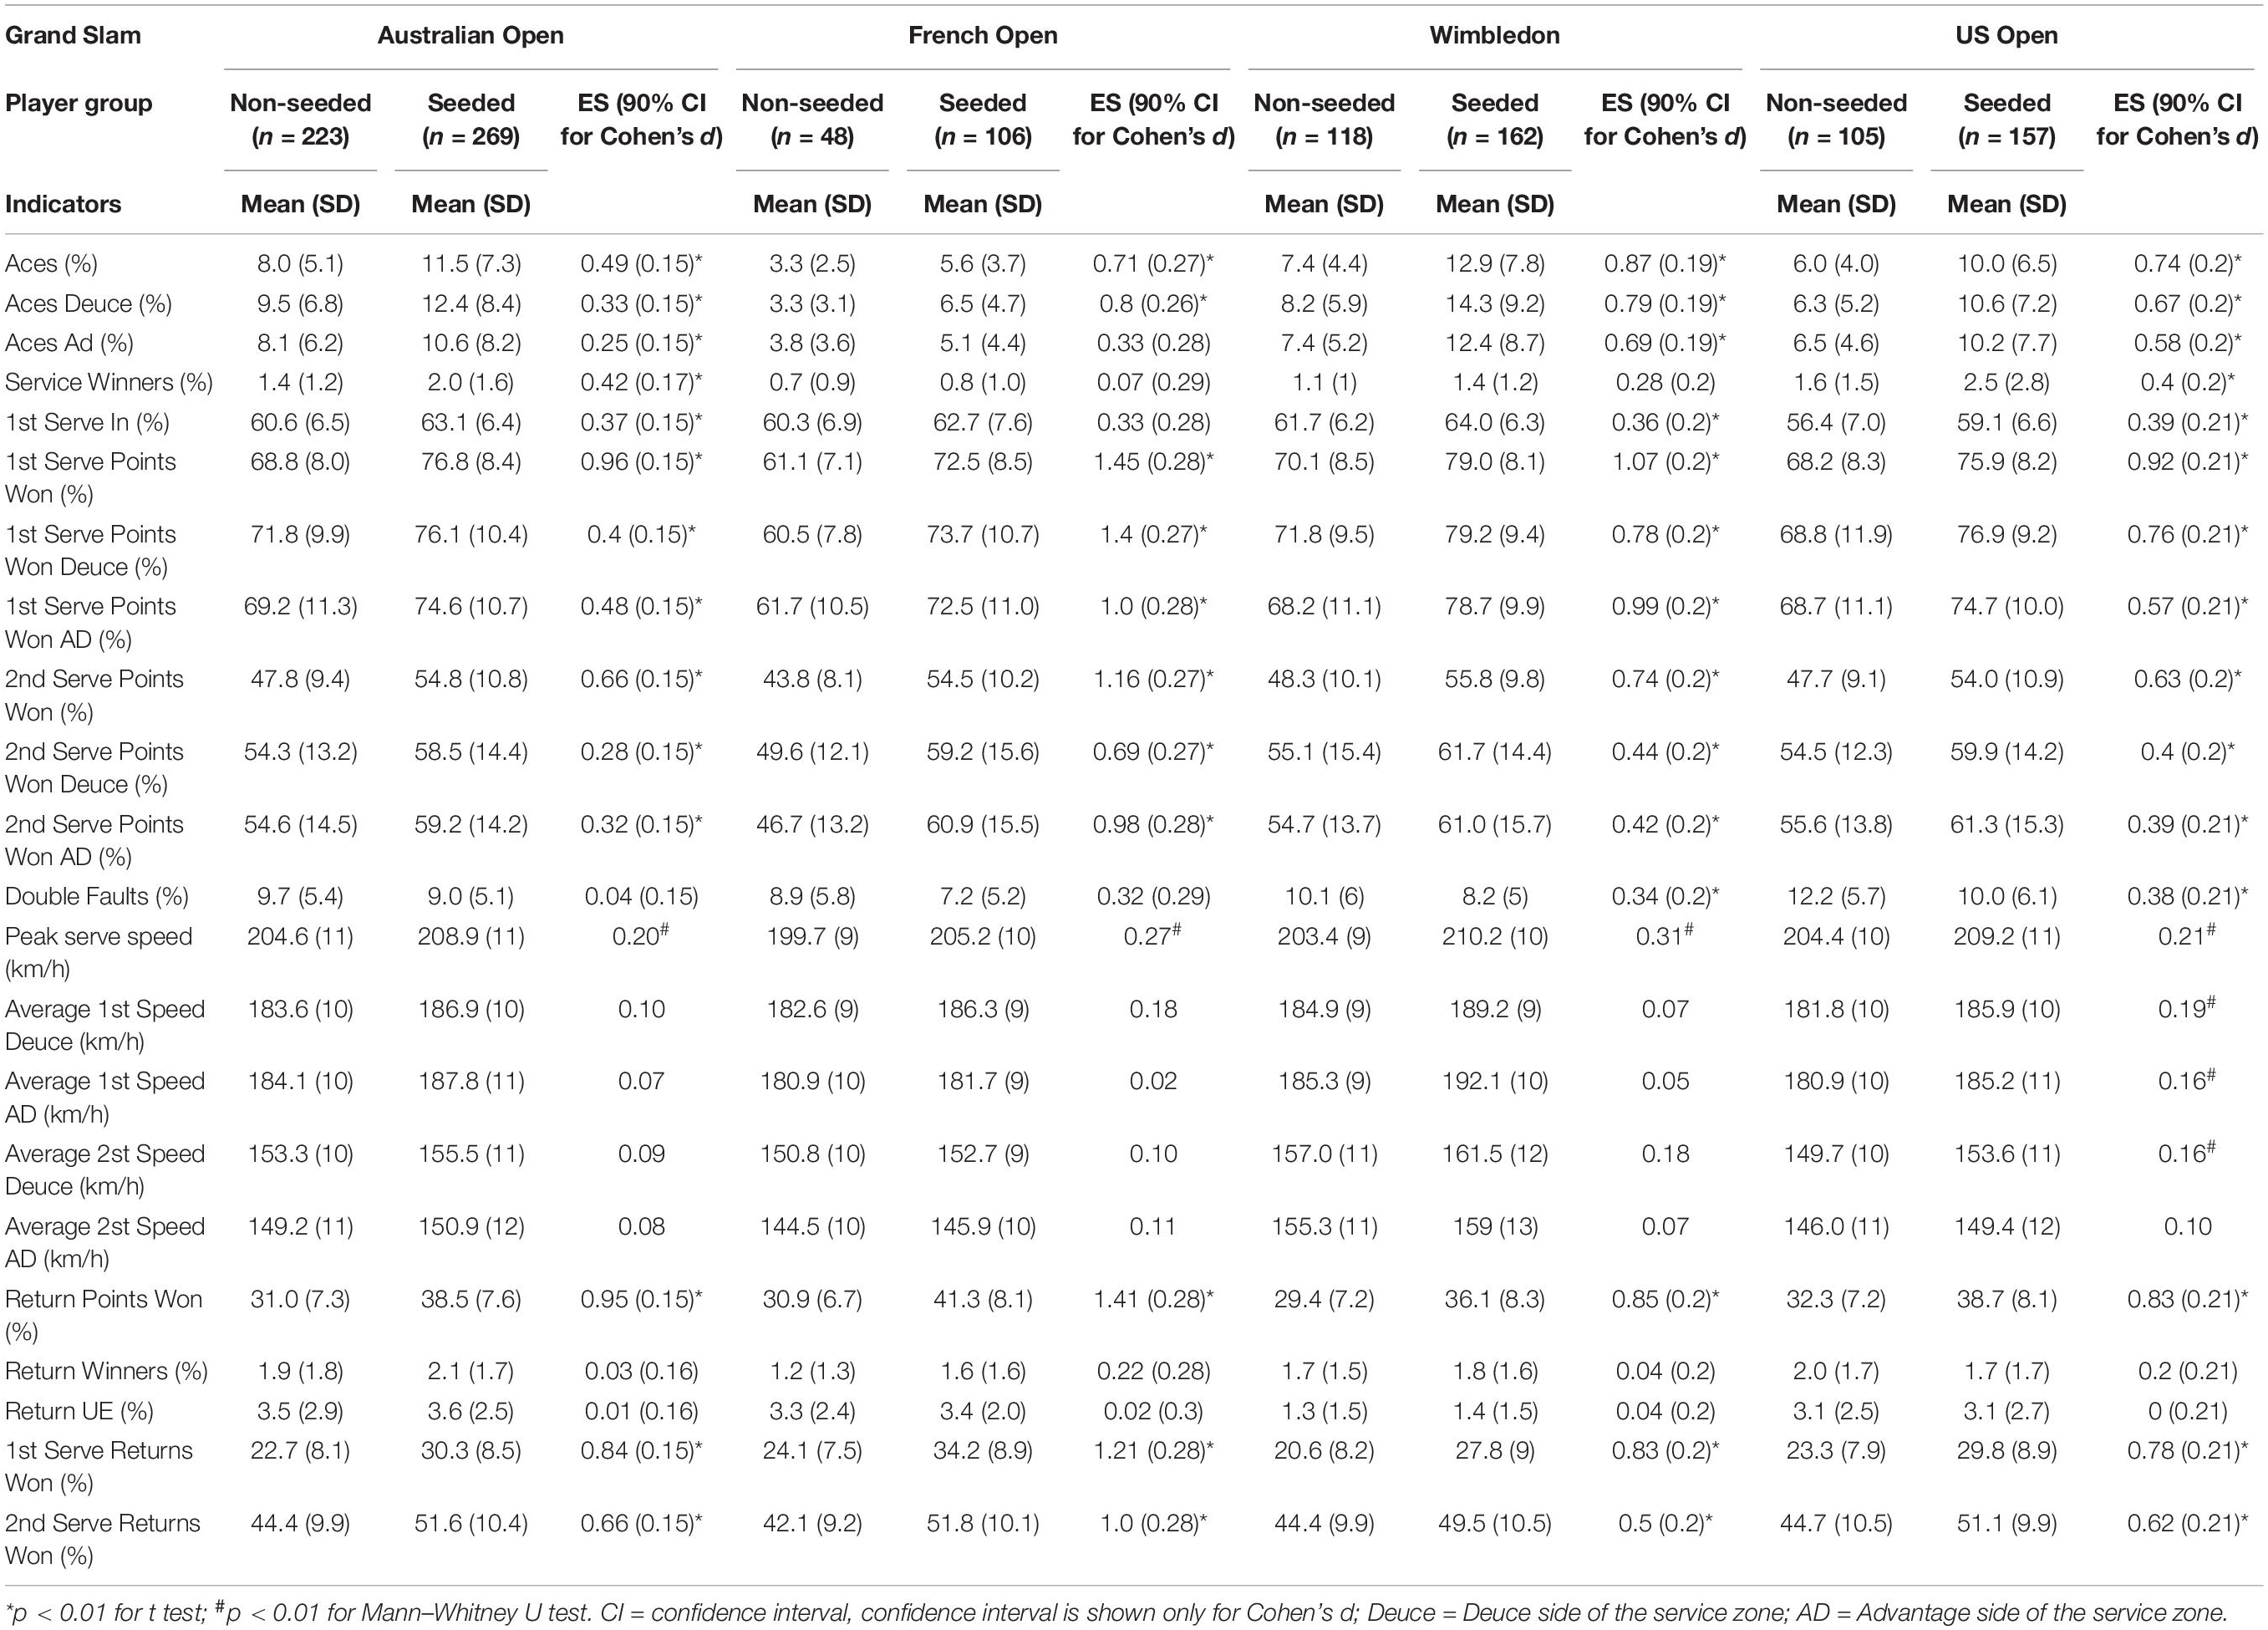
Table 3. Descriptive statistics and comparisons of serve and return performance indicators for seeded and non-seeded players during Grand Slams.
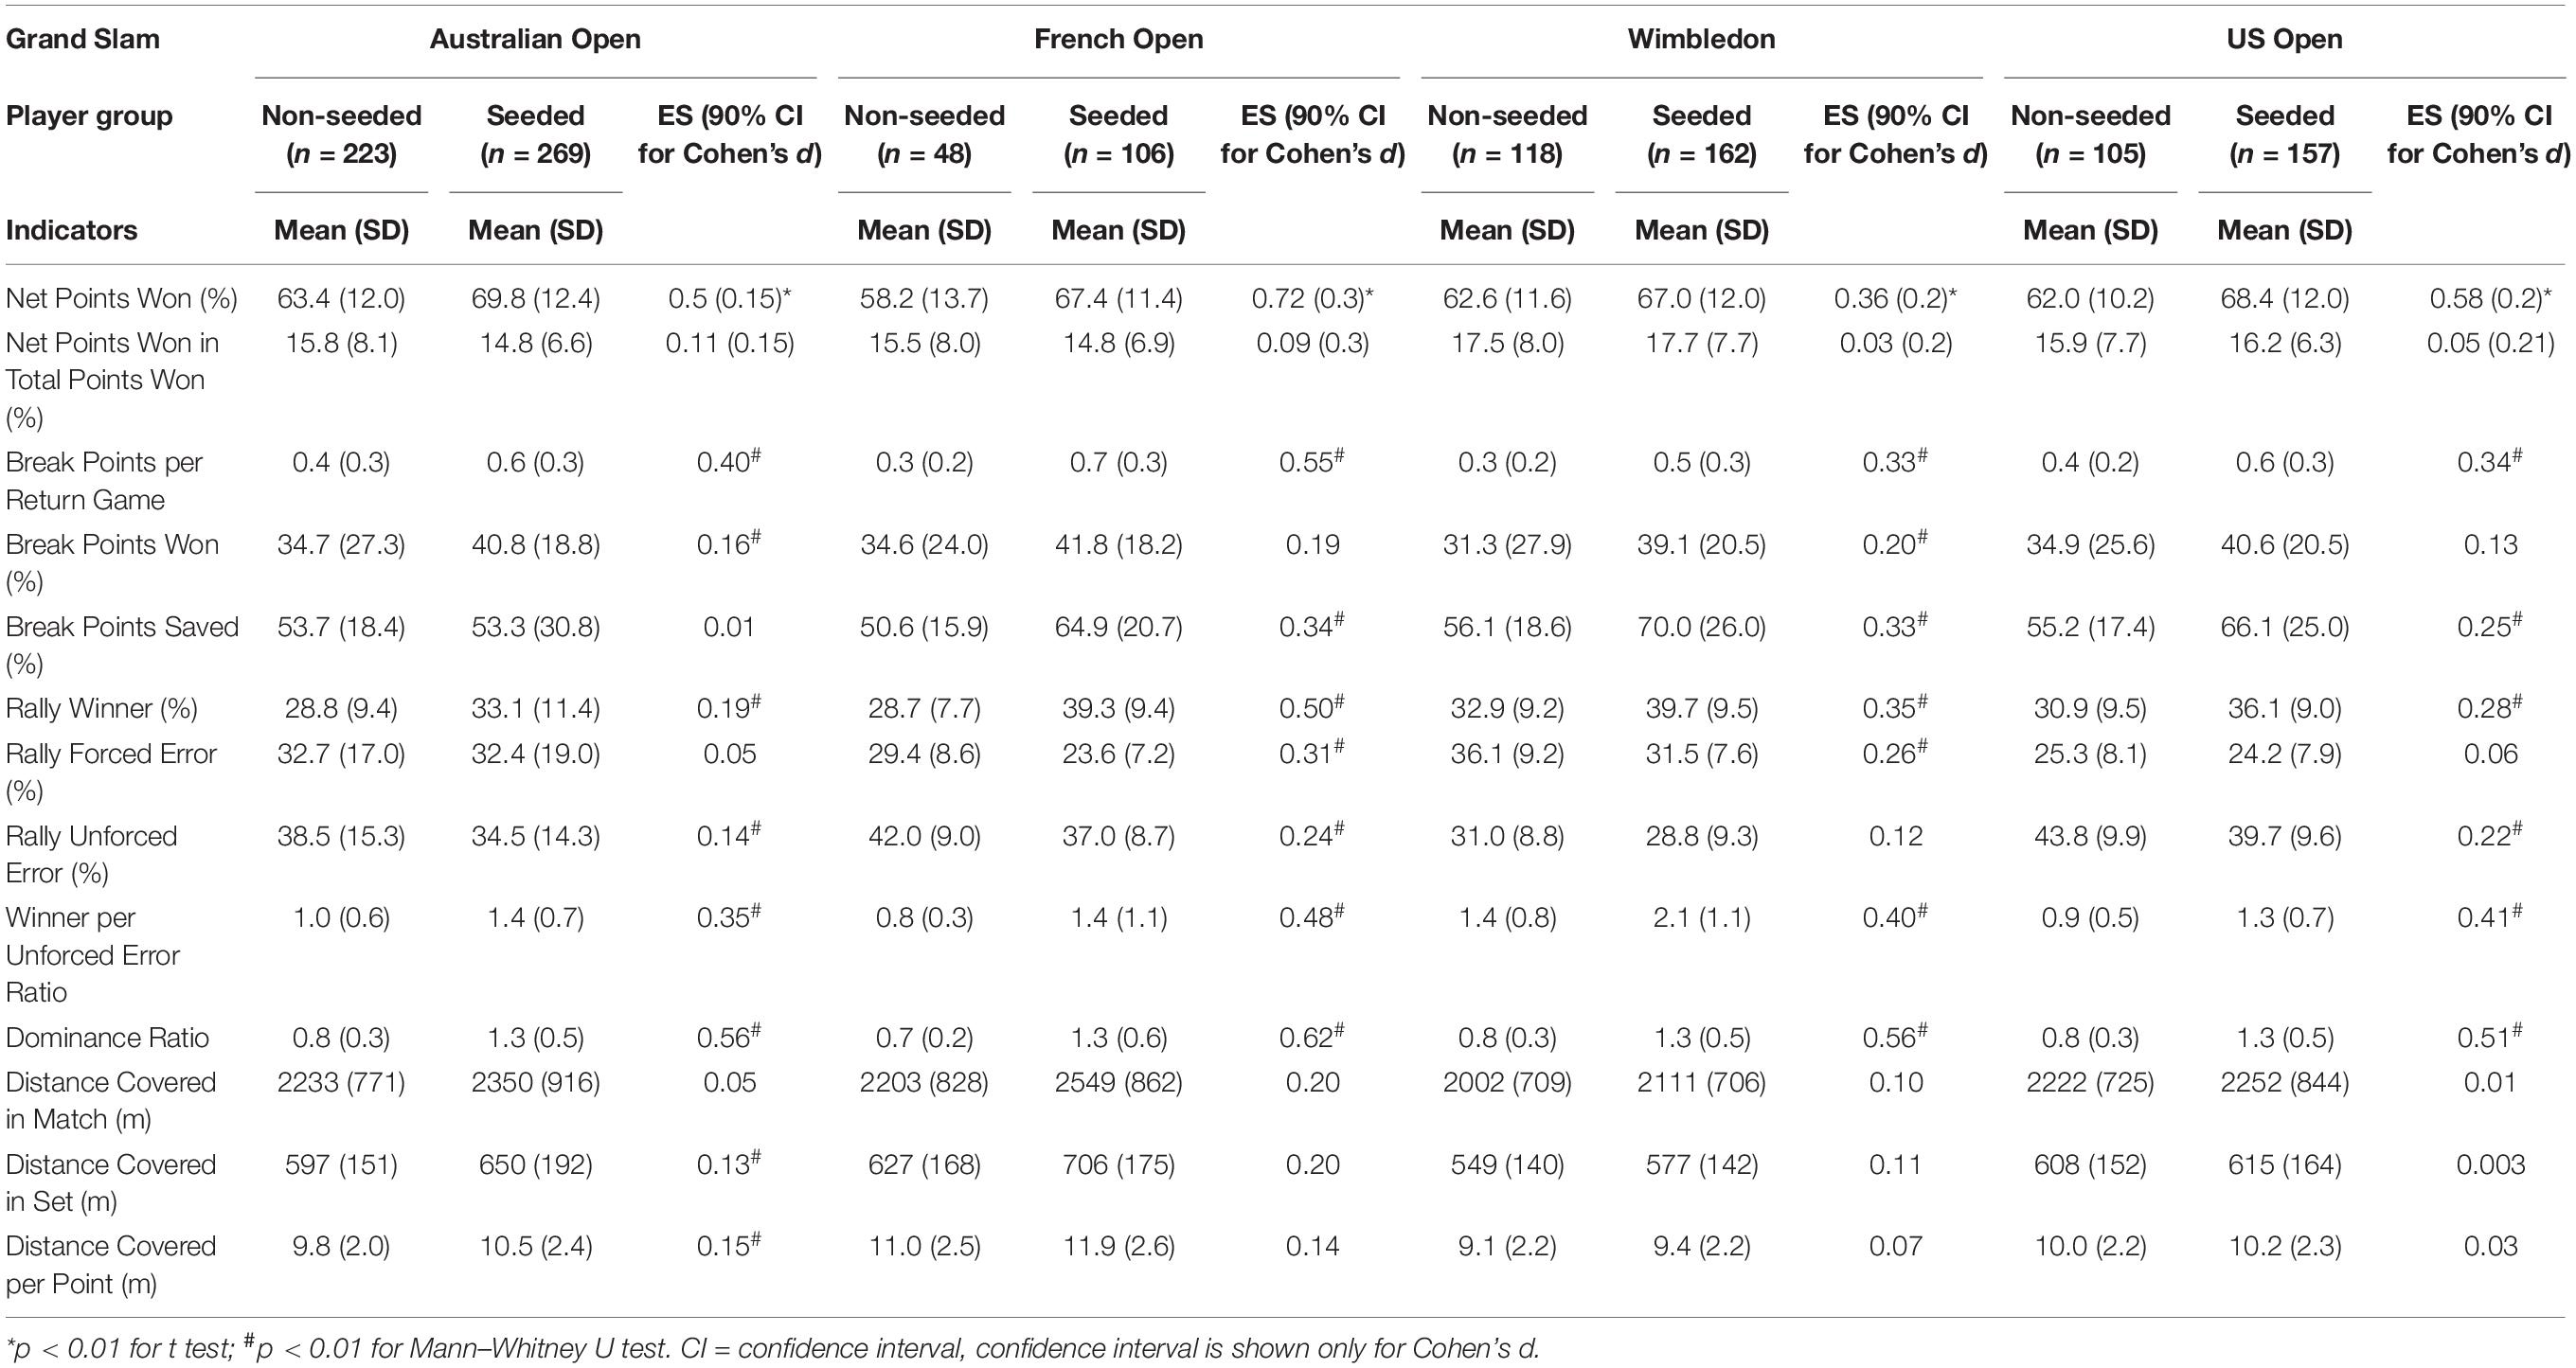
Table 4. Descriptive statistics and comparisons of net point, breakpoint, efficiency, and physical performance indicators for seeded and non-seeded players during Grand Slams.
Using performance indicators filtered from the previous analyses, the subsequent discriminant functions could effectively discriminate between the seed and non-seed players within each Grand Slam (p < 0.001, : AO = 0.39, FO = 0.57, W = 0.39, and US = 0.33; ηp2: AO = 0.15, FO = 0.25, W = 0.15, and US = 0.12, moderate to large effect sizes) and the reclassification rates are from 76.4 to 85.7%. Indicators that have meaningful contributions to the discriminant functions in distinct Slams are as follows: Ace, Ace Deuce, Ace AD, 1st Serve Points Won, 1st Serve Points Won Deuce, 1st Serve Points Won AD, 2nd Serve Points Won, 2nd Serve Points Won AD, Peak Serve Speed, Return Points Won, 1st Serve Returns Won, 2nd Serve Returns Won, Net Points Won, Break Points per Return Game, Break Points Saved, Rally Winner, Rally Forced Error, Rally Unforced Error, Winner per Unforced Error Ratio, and Dominance Ratio with |SC| s varying from 0.30 to 0.77 (see Table 5 for details on the results).
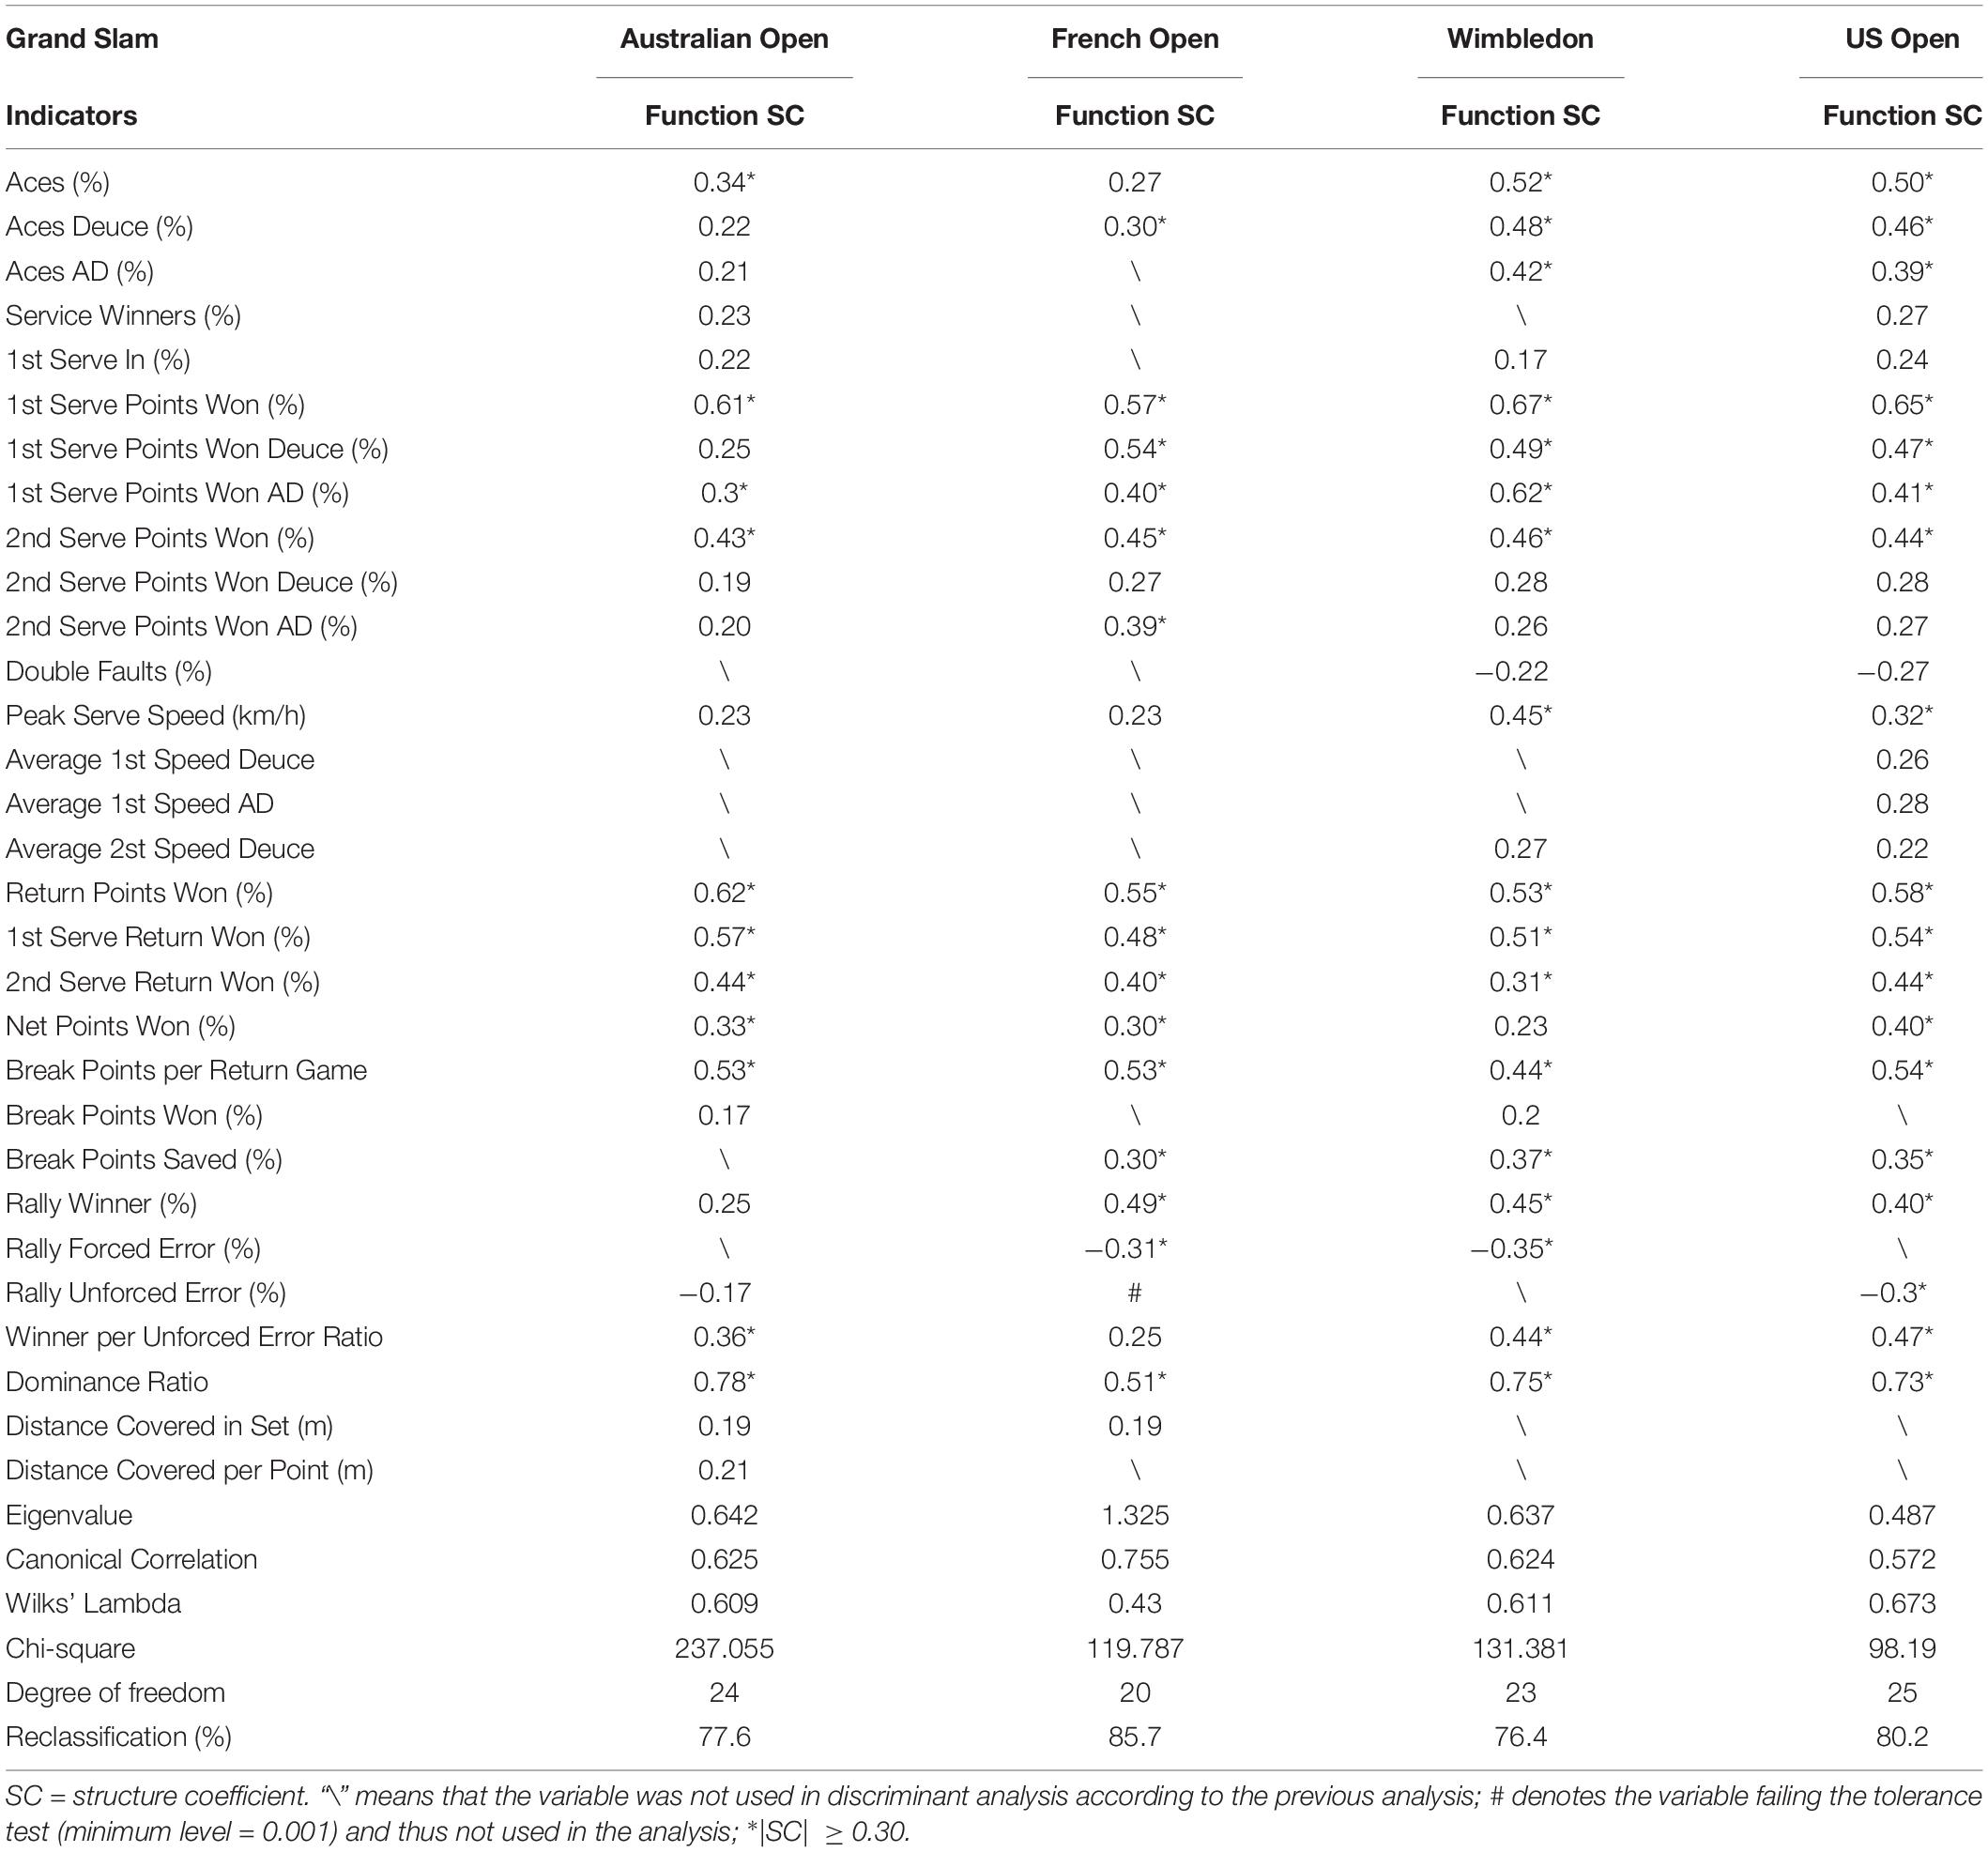
Table 5. Results of discriminant analysis and structure coefficients of input indicators for Grand Slams.
Figure 1 visualizes the distribution of the two groups of players in different Grand Slams using discriminant scores. The seeded players had higher discriminant scores in all competitions: Australian Open (seeded: 0.76 ± 1.04 vs. non-seeded: -0.92 ± 0.95), French Open (0.88 ± 0.95 vs. -1.95 ± 1.10), Wimbledon (0.88 ± 0.98 vs. -1.21 ± 1.03) and US Open (0.66 ± 1.03 vs. -0.98 ± 0.96). Finally, match performance profiles for both player groups are plotted using significant contributors to discriminant functions of different Grand Slams and are shown in Figure 2.
Discussion
The current study analyzed the effect of player strength (being seeded and non-seeded) on tennis match performance in Grand Slams. The main focus was exploring key performance indicators that discriminate seeded and non-seeded players on different match locations. By doing so, it was possible to build the quantitative performance profiles of both player groups and account for opposition quality during training and match preparation process. Previous studies found that experienced, highly ranked, and taller players had better overall match performance than their peers during Grand Slams (Cui et al., 2017, 2019a), but failed to consider what differs between seeded and non-seeded players. It was stated by Neale (1964) in his Louis–Schmelling paradox that competitive balance has a great influence on individual sports such as tennis so that tournament organizers could alter it by giving advantages to stronger competitors. Therefore, quantifying difference margins in key performance indicator helps understand the competitive disadvantage of non-seeded players in such major tournaments (Klaassen and Magnus, 2001; del Corral, 2009). The results justified the assumption of better performance for seeded players in serve and return, break point, net point, and efficiency performance. Nonetheless, seeded players covered more distance than non-seeded players during match-play, which was contrary to the hypothesis. Finally, court surfaces had an influence on the extraction of key performance indicators differentiating two player groups.
Serve and return performance plays the utmost important role in tennis match tactics, and most of the points are finished in three to five rallies after serving and receiving the ball (O’Donoghue and Ingram, 2001; Mecheri et al., 2016; Cui et al., 2019b). Consistent with the previous literature, the current results revealed that serve and return performance indicators not only are key performance indicators to determine the match outcome but also discriminate different levels of players. In general, the seeded players were able to maintain around 75 and 55% in first and second serve points won (%) and 30 and 50% in first and second serve returns won (%) during four Grand Slams, which outperformed the non-seeded players by 10%. When looking into the other serve-relevant aspects, it was shown that in AO, W, and US, seeded players could achieve nearly one ace out of 10 serves. While this statistic declined to around 6% in FO, it was still 3–4% higher than the non-seeded counterparts. In addition, it is noteworthy that the peak serve speed of seeded players was higher than non-seeded ones in all events. Finally, in terms of ball-returning, the seeded players also obtained more return points, especially during the second returns, where they could win around 50% of points. On the one hand, it is evident that the seeds have better familiarity with different court surfaces and adjust their techniques accordingly to maximize their advantage at the start of points. On the other hand, this proves that they possess more advanced psychological and technical attributes, which allow them to eliminate the opponent’s advantage at serve (Gillet et al., 2009; Cui et al., 2017).
Usually, the net point consists of three forms of point-ending, namely, volleying, smashing, and net-approaching. Although both seeded and non-seeded players had similar percentage of Net Points Won in Total Points Won during the four Grand Slams, the former showed better net point efficiency (winning over 67% of all net points) than the latter (58–63%). This reveals that seeded players could create and seize the timing of the net point and possess better net point techniques than ordinary professional players, which coincides with the results of a former study in that higher-ranked and experienced tennis players were more technically well-developed than their peers (Cui et al., 2017). Future research should inspect specific tactical scenarios of their net performance, such as net-approaching after rallies, serve and volley, return and volley, and being forced to approach the net, so as to provide in-depth feedback to representative training design.
In terms of the break point performance, the results suggest that the seeded players not only could get more break point opportunities in the opponent’s serve and achieve higher winning percentage, but also saved more break points than the non-seeded players. Moreover, the discriminant analysis underpins the importance of break point opportunities as discriminator of two player groups. It is evident that seeded players displayed better return performance in opponents’ service games, as well as more stable psychological status that endowed themselves with advantage in such critical points (O’Donoghue, 2012). Future study should further consider these performances in relation to the point outcome to unveil what behaviors seeded players demonstrate to succeed in this situation. Finally, it would be beneficial that more varied break point scenarios be simulated in training, forcing players to adjust their tactical solutions and to be mentally prepared (Meffert et al., 2019).
Previous findings highlighted that winner- and unforced error-related indicators are important in assessing high-level tennis players’ performance (Filipcic et al., 2015; Cui et al., 2017). Moreover, it was suggested that underdogs in major sports events (non-seeded players in this case) tend to use riskier strategies than favorites (seeded players) (del Corral, 2009). However, the current results showed that the seeded players achieved relatively higher number of winners during both whole match and rally, but also maintained lower unforced and forced errors than their non-seeded counterparts. It is evident that a rank-based seeding system decreases competitive balance in men’s game during Grand Slams (del Corral, 2009), and with technical–tactical superiority and mental tenacity during match-play (Cowden, 2016; Reid et al., 2016), seeded players are favored to play with more effective risky strategies.
Although an empirical comparison among the four major Slams reveals that players covered more running distances on French Open clay courts and less on Wimbledon grass courts, there is no significant difference between the seeded and non-seeded players. As knowing the average running distance of 2,000–2,500 m and 9.1–11.9 m within the entire match and a single point for all players would not necessarily advance our understanding of how two competing players move during ball-interchange, future studies should shed light on point-level running patterns such as change of directions, acceleration, and deceleration through ball/player tracking, so as to gain insights into difference of player levels in altering hitting direction, speed, and rhythm. As a practical application, our results could still set a benchmark for tennis training, where coaches are suggested to focus on building the offensive playing patterns of players under no more than five rallies with the intention to win each serving and receiving point as soon as possible. Furthermore, fitness-specific physical training (that centers on the development of player’s aerobic and anaerobic capacity and speed) and game-specific physical training (related to ball-striking and footwork drills) should be refined to include more high-intensity, short-interval bouts so as to induce better muscle and mental recovery at a point-to-point level.
Notwithstanding novel findings provided by the study, this study failed to further look into the influence of seeding system on match outcome, for example, analyzing players’ performance during different confrontations: seeded vs. seeded, seeded vs. non-seeded, and non-seeded vs. non-seeded. Meanwhile, including recent performance, e.g., represented by ELO rating (Kovalchik, 2020), rather than players’ rankings might offer more constant information about their competitive match-play. Finally, the current findings need to be verified in the female counterparts, as the match format of women’s game is comparatively shorter than the men’s (i.e., best of three sets) and the match pattern is more characterized by baseline performance (Cui et al., 2018).
Conclusion
Within the four major Grand Slam tournaments’ men’s singles matches, the seeded players outperformed non-seeded players in serve and return, net points, break points, and game efficiency-related indicators. Serve and return of serve points won (%), ace (%), peak serve speed, first serve speed, net points won (%), break point per return game, break point saved, winner and unforced error ratio, and dominance ratio turned out to be most meaningful discriminators of the two player groups and can be used as valid player assessment indices during practices.
Data Availability Statement
The datasets generated for this study are available on request to the corresponding author.
Ethics Statement
The studies involving human participants were reviewed and approved by Research commission of Beijing Sport University. Written informed consent for participation was not required for this study in accordance with the national legislation and the institutional requirements.
Author Contributions
YC, M-ÁG, and YZ: conceptualization and data curation. YC: formal analysis. YC, HL, YZ, and RW: investigation. YC and M-ÁG: methodology, software, writing – original draft preparation, and designing the experiments and performing the statistical analysis. YC and YZ: visualization. YC, RW, M-ÁG, HL, and YL: writing – review and editing. HL and YZ: funding acquisition. YC, YZ, HL, and RW: writing and revising the manuscript. M-ÁG, HL, and YL: supervising the design and reviewing the manuscript. All authors have made a substantial and direct contribution to manuscript, and approved the final version of the manuscript.
Funding
This work was supported in part by the National Key R&D Program of China (2018YFC2000600) and Ministry of Education of China Youth Project of Humanities and Social Sciences (Project No. 19YJC890064). The first author was supported by the China Postdoctoral Science Foundation and the Fundamental Research Funds for the Central Universities (2019QD033).
Conflict of Interest
The authors declare that the research was conducted in the absence of any commercial or financial relationships that could be construed as a potential conflict of interest.
The reviewer BG declared a past co-authorship with one of the authors M-ÁG.
Supplementary Material
The Supplementary Material for this article can be found online at: https://www.frontiersin.org/articles/10.3389/fpsyg.2020.01294/full#supplementary-material
Footnotes
References
Cohen, J. (1988). Statistical Power Analysis for the Behavioural sciences, 2nd Edn. Hillside, NJ: Lawrence Earlbaum Associates.
Cowden, R. G. (2016). Competitive performance correlates of mental toughness in tennis. Percept. Mot.Skills 123, 341–360. doi: 10.1177/0031512516659902
Cross, R., and Pollard, G. (2009). Grand Slam men’s singles tennis 1991-2009 Serve speeds and other related data. Coach. Sport Sci. Rev. 16, 8–10.
Cui, Y., Gómez, M. -Á, Gonçalves, B., Liu, H., and Sampaio, J. (2017). Effects of experience and relative quality in tennis match performance during four Grand Slams. Int. J. Perform. Anal. Sport 17, 1–19. doi: 10.1080/24748668.2017.1399325
Cui, Y., Gómez, M. -Á, Gonçalves, B., and Sampaio, J. (2018). Performance profiles of professional female tennis players in grand slams. PLoS One 13:e0200591. doi: 10.1371/journal.pone.0200591
Cui, Y., Gómez, M. -Á, Gonçalves, B., and Sampaio, J. (2019a). Clustering tennis players’ anthropometric and individual features helps to reveal performance fingerprints. Eur. J. Sport Sci. 19, 1032–1044. doi: 10.1080/17461391.2019.1577494
Cui, Y., Liu, H., Liu, H., and Gómez, M. -Á (2019b). Data-driven analysis of point-by-point performance for male tennis player in Grand Slams. Motricidade 15, 49–61. doi: 10.6063/motricidade.16370
del Corral, J. (2009). Competitive balance and match uncertainty in grand-slam tennis:effects of seeding system, gender, and court surface. J. Sports Econ. 10, 563–581. doi: 10.1177/1527002509334650
Du Bois, C., and Heyndels, B. (2007). Its a different game you go to watch: competitive balance in men’s and Women’s tennis. Eur. Sport Manag. Q. 7, 167–185. doi: 10.1080/16184740701353349
Filipcic, A., Zecic, M., Reid, M., Crespo, M., Panjan, A., and Nejc, S. (2015). Differences in performance indicators of elite tennis players in the period 1991-2010. J. Phys. ical Educ. Sport 15, 671. doi: 10.7752/jpes.2015.04102
Gillet, E., Leroy, D., Thouvarecq, R., and Stein, J. F. (2009). A notational analysis of elite tennis serve and serve-return strategies on slow surface. J. Strength Cond. Res. 23, 532–539. doi: 10.1519/JSC.0b013e31818efe29
Goossens, D. R., Kempeneers, J., Koning, R. H., and Spieksma, F. C. (2015). Winning in straight sets helps in grand slam tennis. Int. J. Perform. Anal. Sport 15, 1007–1021.
Hizan, H., Whipp, P., and Reid, M. (2015). Gender differences in the spatial distributions of the tennis serve. Int. J. Sports Sci. Coach. 10, 87–96. doi: 10.1260/1747-9541.10.1.87
Hopkins, W., Marshall, S., Batterham, A., and Hanin, J. (2009). Progressive statistics for studies in sports medicine and exercise science. Med. Sci. Sports Exerc. 41, 3–12. doi: 10.1249/MSS.0b013e31818cb278
Johnson, C. D., and McHugh, M. P. (2006). Performance demands of professional male tennis players. Br. J. Sports Med. 40, 696–699. doi: 10.1136/bjsm.2005.021253
Klaassen, F. J., and Magnus, J. R. (2001). Are points in tennis independent and identically distributed? Evidence from a dynamic binary panel data model. J. Am. Stat.Assoc. 96, 500–509.
Kovalchik, S. (2020). Extension of the Elo rating system to margin of victory. Int. J. Forecast. 1–13. doi: 10.1016/j.ijforecast.2020.01.006 [Epub ahead of print].
Ma, S. M., Liu, C. C., Tan, Y., and Ma, S. C. (2013). Winning matches in Grand Slam men’s singles: an analysis of player performance-related variables from 1991 to 2008. J. Sports Sci. 31, 1147–1155. doi: 10.1080/02640414.2013.775472
Mecheri, S., Rioult, F., Mantel, B., Kauffmann, F., and Benguigui, N. (2016). The serve impact in tennis: first large-scale study of big hawk-eye data. Stati. Anal. Data Min. ASA Data Sci. J. 9, 310–325. doi: 10.1002/sam.11316
Meffert, D., O’Shannessy, C., Born, P., Grambow, R., and Vogt, T. (2019). Tennis at tiebreaks: addressing elite players’ performance for tomorrows’ coaching. German J. Exerc. Sport Res. 49, 339–344. doi: 10.1007/s12662-019-00611-3
Neale, W. C. (1964). The peculiar economics of professional sports∗. Q. J. Econom. 78, 1–14. doi: 10.2307/1880543
O’Donoghue, P. (2005). Normative profiles of sports performance. Int. J. Perform. Anal. Sport 5, 104–119.
O’Donoghue, P. (2012). Break points in grand slam men’s singles tennis. Int. J. Perform. Anal. Sport 12, 156–165.
O’Donoghue, P., and Ingram, B. (2001). A notational analysis of elite tennis strategy. J. Sports Sci. 19, 107–115. doi: 10.1080/026404101300036299
Prieto-Bermejo, J., and Gómez-Ruano, M. Á (2016). Entering tennis men’s Grand Slams within the top-10 and its relationship with the fact of winning the tournament. [Acceder a los Grand Slams de tenis masculino desde el top-10 y su relación con el hecho de ganar el torneo]. RICYDE. Rev. Int. Cien. Deporte 12, 410–422. doi: 10.5232/ricyde
Reid, M., and Duffield, R. (2014). The development of fatigue during match-play tennis. Br. J. Sports Med. 48(Suppl. 1), i7–i11. doi: 10.1136/bjsports-2013-093196
Reid, M., Morgan, S., and Whiteside, D. (2016). Matchplay characteristics of grand slam tennis: implications for training and conditioning. J. Sports Sci. 34, 1791–1798. doi: 10.1080/02640414.2016.1139161
Sampaio, J., Janeira, M., Ibáñez, S., and Lorenzo, A. (2006). Discriminant analysis of game-related statistics between basketball guards, forwards and centres in three professional leagues. Eur. J. Sport Sci. 6, 173–178. doi: 10.1080/17461390600676200
Scheibehenne, B., and Bröder, A. (2007). Predicting Wimbledon 2005 tennis results by mere player name recognition. Int. J. Forecast. 23, 415–426.
Sell, K., Hainline, B., Yorio, M., and Kovacs, M. (2013). Illness data from the US open tennis championships from 1994 to 2009. Clin. J. Sport Med. 23, 25–32. doi: 10.1097/JSM.0b013e31826b7e52
Smith, M. T., Reid, M., Kovalchik, S., Wood, T., and Duffield, R. (2018). Heat stress incidence and matchplay characteristics in women’s Grand Slam tennis. J. Sci. Med. Sport 21, 666–670. doi: 10.1016/j.jsams.2017.11.006
Tudor, P. B., Zecic, M., and Matkovic, B. (2014). Differences between 2010 and 2011 performance indicators of tennis play at the grand slam tournaments. Kinesiology 46, 101–106.
Vaverka, F., and Cernosek, M. (2013). Association between body height and serve speed in elite tennis players. Sports Biomech. 12, 30–37. doi: 10.1080/14763141.2012.670664
Whiteside, D., Bane, M., and Reid, M. (2016). “Differentiating top-ranked male tennis players from lower ranked players using hawk-eye data: an investigation of the 2012–2014 Australian Open tournaments,” in Paper presented at the ISBS-Conference Proceedings Archive, Poitiers.
Whiteside, D., and Reid, M. (2017). Spatial characteristics of professional tennis serves with implications for serving aces: a machine learning approach. J. Sports Sci. 35, 648–654. doi: 10.1080/02640414.2016.1183805
Woods, C. T., McKeown, I., Shuttleworth, R. J., Davids, K., and Robertson, S. (2019). Training programme designs in professional team sport: an ecological dynamics exemplar. Hum. Mov. Sci. 66, 318–326. doi: 10.1016/j.humov.2019.05.015
Keywords: professional tennis, key performance indicator, seeded players, discriminant analysis, match demands
Citation: Cui Y, Zhao Y, Liu H, Gómez M-Á, Wei R and Liu Y (2020) Effect of a Seeding System on Competitive Performance of Elite Players During Major Tennis Tournaments. Front. Psychol. 11:1294. doi: 10.3389/fpsyg.2020.01294
Received: 01 March 2020; Accepted: 18 May 2020;
Published: 26 June 2020.
Edited by:
Juan Pedro Fuentes, University of Extremadura, SpainReviewed by:
Bruno Gonçalves, University of Evora, PortugalGema Torres-Luque, University of Jaén, Spain
Copyright © 2020 Cui, Zhao, Liu, Gómez, Wei and Liu. This is an open-access article distributed under the terms of the Creative Commons Attribution License (CC BY). The use, distribution or reproduction in other forums is permitted, provided the original author(s) and the copyright owner(s) are credited and that the original publication in this journal is cited, in accordance with accepted academic practice. No use, distribution or reproduction is permitted which does not comply with these terms.
*Correspondence: Yue Zhao, zhaoyue@bsu.edu.cn; Haoyang Liu, liuhaoyang@bsu.edu.cn