 Khurram Shehzad1*Liu Xiaoxing1Muhammad Arif2Khaliq Ur Rehman3Muhammad Ilyas2
- 1School of Economics and Management, Southeast University, Nanjing, China
- 2School of Economics and Finance, Xi’an Jiaotong University, Xi’an, China
- 3School of Management, Wuhan University of Technology, Wuhan, China
The novel coronavirus (COVID-19) has imperatively shaken the behavior of the global financial markets. This study estimated the impact of COVID-19 on the behavior of the financial markets of Europe and the US. The results revealed that the returns of the S&P 500 index have been greatly affected by a lockdown in the US owing to COVID-19. However, the health crisis generated due to the novel coronavirus significantly decreased the stock returns of the Nasdaq Composite index. The results also showed that the economic crisis generated from the pandemic in Spain has had more impact on the IBEX 35 as compared to the health crisis itself. On the other hand, in the long-run, Italy’s stock markets are more affected by the health crisis as contrasted with the economic crisis, while, in the short-run, both lockdown conditions and economic instability lower the stock returns of FTSE MIB. The UK stock markets witnessed that in the short-run, deficiency of health management systems imperatively damaged the stock returns of the London Stock Exchange. The investigation revealed that deficiency of health systems and lockdown conditions have imperatively damaged the structure of financial markets, inferring that sustainable development of these nations is at risk due to COVID-19. The study suggested that governments should allocate more of their budget to the health sector to overcome a health crisis in the future.
Introduction
Historically, countries affected by a pandemic or epidemic that have seen large loss of life also see an impact within the economy and in their financial markets; a specific example would be the spread of Ebola disease in 2013–2016, which caused a loss of 53 billion dollars in the US (Fernandes, 2020). However, the potential damages of the current virus are still largely unknown. Significantly, the Coronavirus (COVID-19) infection disease was first reported in Wuhan on December 31, 2019 and spread rapidly to almost the whole world within the next few months (Albulescu, 2020). Compared to Severe Acute Respiratory Syndrome (SARS), COVID-19 is more contagious, which has been indicated by a different fatality rate1. COVID-19 has infected 1,865,413 individuals, and 110,008 deaths had been documented throughout the globe until mid-April 2020 (Financial Times, 2020). In order to eradicate this pandemic, the World Health Organization (WHO) recommended maintaining social distance, which generated the severe lockdown situation on the globe (WHO, 2020). Accordingly, the economic circle in the whole world has been disturbed. Notably, the sale of Online Travel Agencies (OTAs), Airlines, and Hotels has unexpectedly declined (World Economic Forum, 2020). Even oil prices have nosedived due to the sudden outbreak of this pandemic (EIA, 2020). Due to globalization, the current coronavirus outbreak will aggravate the economic condition, which can pave the way toward financial meltdown (Huang et al., 2020). This pandemic has caused a severe psychological impact on the economy while agitating service industries and financial markets.
Moreover, the coronavirus outbreak has severely affected the financial markets while declining the value of stock index up to 10% in 1 day (Daube, 2020). Surprisingly, news or specific events can fluctuate stock values (Shehzad and Sohail, 2018). Figure 1 revealed the market value in the European, American, Chinese, and Hong Kong markets from January 1, 2020–March 18, 2020. The period is divided into three rounds for comparison purposes; the first time-lagged is from January 1, 2020 to January 23, 2020, the second time-lagged is from January 23 to March 6, and the third time-lagged denoted the period of March 6, 2020 to March 18, 2020. The results showed that the market values of these indices significantly declined in the third time-lagged as COVID-19 approached its peak in western countries. Spain’s stock market share value was decreased by 27.3% in the third time-lagged. COVID-19 tremendously shrank Greece stock markets.
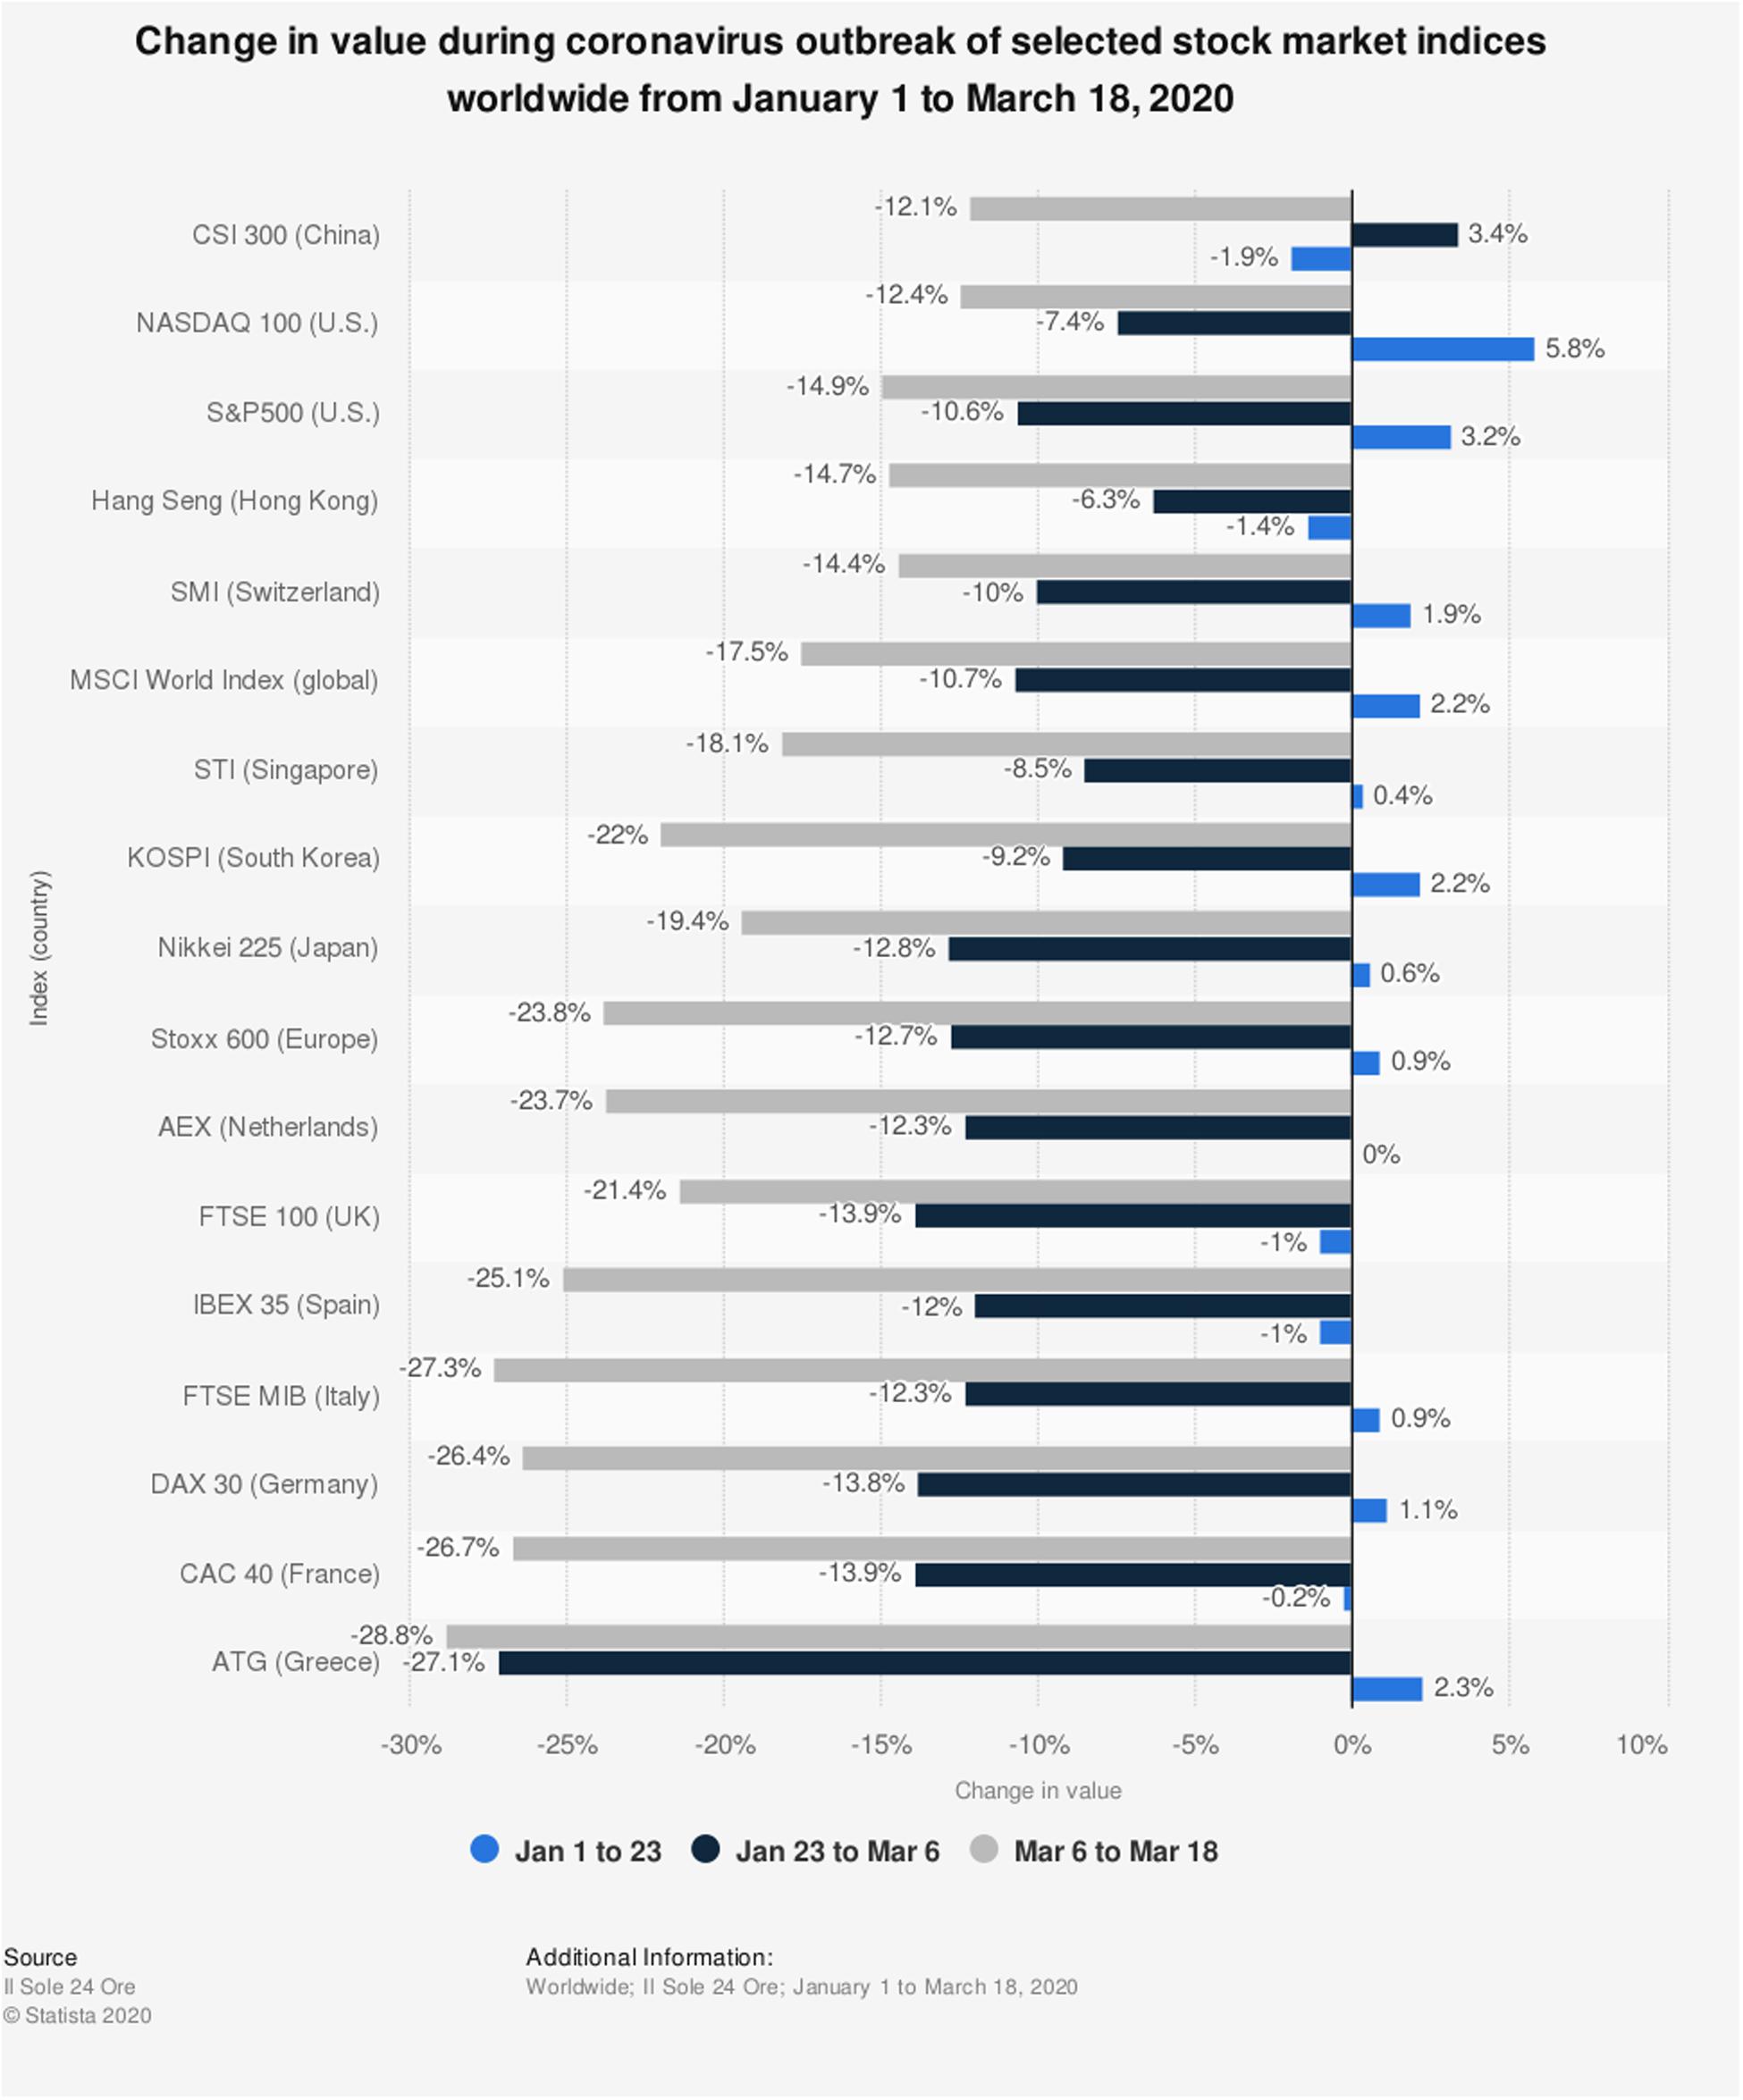
Figure 1. Deterioration in the stock markets owing to novel coronavirus.
Moreover, Figure 2 illustrates the volatility index (VIX) from January 2005–March 2020. It denotes that the world has faced severe financial crises in 2007–2009. The stock markets collapsed, and the economies went through enormous pressure. A similar scenario has been built up during the global pandemic COVID-19. The stock market variance is at its highest for the second time after the Global Financial Crises (GFC).
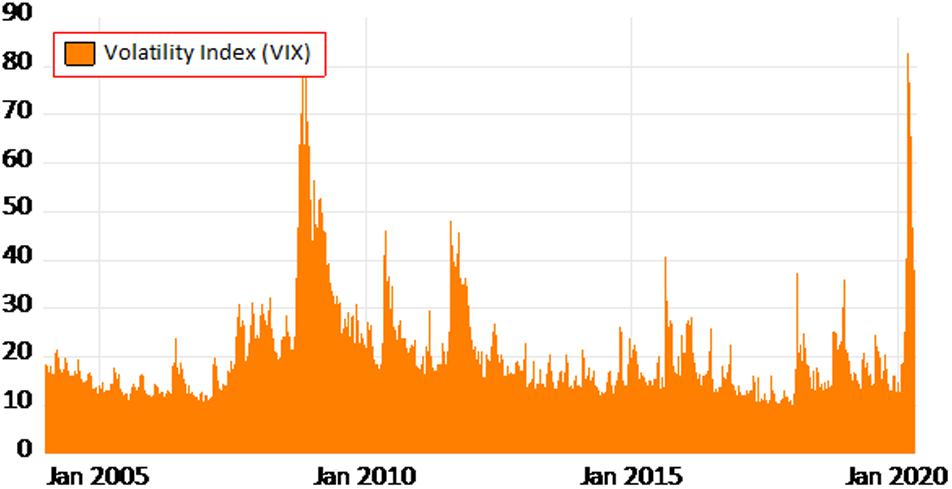
Figure 2. Variations in VIX due to Global Financial Crisis 2007–2009 and COVID-19 Crisis.
In this regard, the novel coronavirus’s impact is also detrimental, and pandemic behavior is unknown, so its effect on the stock return can last longer. Relevant to this, the US stock volatility has been agitated due to the enormous spread of this pandemic resulting in severe economic crisis (Sharif et al., 2020). In such circumstances, it is quite significant to analyze coronavirus short-term and long-term impacts on the advanced countries’ stock return. This investigation argued that as the confirmed patients of novel coronavirus increase, the lockdown conditions becomes stricter, which lead to a significant economic crisis and shocked the economic stability of one’s nations. Moreover, deaths that befell as a result of novel coronavirus specified the deficiency of health facilities, which had caused a substantial health crisis. Particularly, this examination analyzed the effects of the economic and health crisis due to the novel coronavirus on the behavior of financial markets of the United States (US), Germany, United Kingdom (UK), Italy, and Spain for the period of February 10, 2020 to April 9, 2020.
This study elucidates the effects by executing a Non-linear Autoregressive Distributed lagged (NARDL) model. This investigation provides remarkable policies on how to handle the impacts of COVID-19 on the financial market and answers the momentous queries of the researchers, policymakers, Government officials, and academicians, e.g., firstly, does COVID-19 have a non-linear impact on financial markets’ behavior? Secondly, does the health crisis or economic instability generated by COVID-19 have a more significant impact on the S&P 500 index? Thirdly, does the Nasdaq Composite index or S&P 500 index respond more critically to the COVID-19 crisis? Fourthly, does the economic crisis generated by COVID-19 or the health crisis have a more significant impact on stock returns? Fifthly, how does this suspended circle of economy, due to lockdown, begin again? According to the author’s best knowledge, this is the first study that examines the asymmetrical impact of COVID-19 on the psychology of stock markets of mostly infected nations of the world. Firstly, this project ascertained the stationary level of study variables and discovered that all the variables are stationary at I(0) and I(1), and no one is stationary at I(2). Hence, a Non-linear version of the Autoregressive Distributed Lag (ARDL) model can be applied.
Data and Methodology
Data
This study utilized the daily data of the number of confirmed patients and deaths due to COVID-19 and stock markets of the US, Spain, Italy, Germany, and the UK, from the period of February 10, 2020–April 9, 2020. This study has taken the data from the database of Yahoo Finance and the European Center for Disease Control and Prevention. Further, this investigation analyzed the daily returns of IBEX 35, FTSE MIB, DAX 30, and London Stock Exchange (LSE) for the nomination of Spain, Italy, Germany, and the UK. However, S&P 500 and Nasdaq Composite Index represents the US.
Methodology
This investigation utilized each stock market’s daily returns as the dependent variable and confirmed cases and deaths as the independent variable. The daily returns used in this study are computed as follows (Syllignakis and Kouretas, 2011; Shehzad and Sohail, 2018),
here Rti, CSt, and CSt–1 denote the return value at time t, closing price at time t, and previous day closing price at time t, for a stock market i, respectively. The linear association between these variables can be defined as;
where Δ signifies the first difference and β0β1β2 are the independent parameters. However, NSR, SPR, IBER, FTMR, DAXR, and LSER defines the return values of the Nasdaq Composite index, S&P 500, IBEX 35, FTSE MIB, DAX 30, and London Stock Exchange, respectively. Moreover, USC, SPC, ITLC, GERC, and UKC indicate the confirmed cases of COVID-19 in the US, Spain, Italy, Germany, and the UK, respectively. Further, USD, SPD, ITLD, GERD, and UKD refer to confirmed deaths due to COVID-19 in the US, Spain, Italy, Germany, and the UK, respectively.
To ascertain the short- and long-run asymmetries, this study employed the Non-Linear Autoregressive Distributed Lag (NARDL) model introduced by Shin et al. (2014). This model performs best with a small number of observations and can be applied on a mixed level of stationary data, i.e., I (0) and I(1). It evaluates the non-linearity and cointegration between variables in one equation; and shared the short-run variations to long-run asymmetries after taking the long-run parameters into account (Shin et al., 2014). The NARDL model is the extended form of the ARDL (Pesaran et al., 2001) model; hence, the full form of NARDL model for each stock market can be specified as,
here ϑ0ϑ1,ϑ2a,ϑ2bϑ3aand ϑ3b are the short-run factors, while γ1, γ2a, γ2b,γ3a, and γ3b indicates the long-run parameters. Whereas, i symbolizes the number of lag used by the model based on Akaik Information Criterion and Schwarz Information Criterion. The above stated equations Eqs 8–13 assumed that confirmed number of cases and deaths due to COVID-19 have asymmetrical impact on stock returns.
Thus, USC,USD,SPC, SPD,ITLC, ITLD,GERC, GERD, UKC, and UKD designates a positive shock, though USC, USD, SPC, SPD, ITLC, ITLD,GERC, GERD,UKC, and UKD implies a negative shock for each variable, and it is computed as follows,
here delineates the positive shock in a variable i and j denotes the asymmetric distributive lag. The error correction form for these factors can be written as follows,
here ECTt–1 directs the error correction term. The long-run cointegration among variables is examined through the bound test approach of Pesaran et al. (2001). This method relies on F-test to evaluate the null hypothesis, H0: γ1 = γ2a = + γ3a = 0. For this purpose, Pesaran et al. (2001) has defined two bounds, i.e., upper and lower bound. If the estimated F-statistics are the higher than upper bound limit then the null hypothesis of no cointegration is rejected. However, if the projected value of F-test is lower than lower bound limit then null hypothesis cannot be rejected; besides, if the value of F-test remains between both limits then the results are not conclusive. At the end, this project employed the Wald test to verify the asymmetric long-run, = asymmetric relationship between study variables.
Study Findings
The descriptive summary showed, in Table 1, during the COVID-19 era, the mean of stock returns is negative. Further, skewness values of these markets are also negative except LSER with high kurtosis, which predicts high chances of loss these days. Table 2 presents the results of the Augmented Dickey-Fuller (ADF) test (Dickey and Fuller, 1979) and Phillip Perron (PP) test (Phillips and Perron, 1988). It showed that the study variables have diverse stationary levels, i.e., I (0) and I (1), and no variable is cointegrated at I (2).
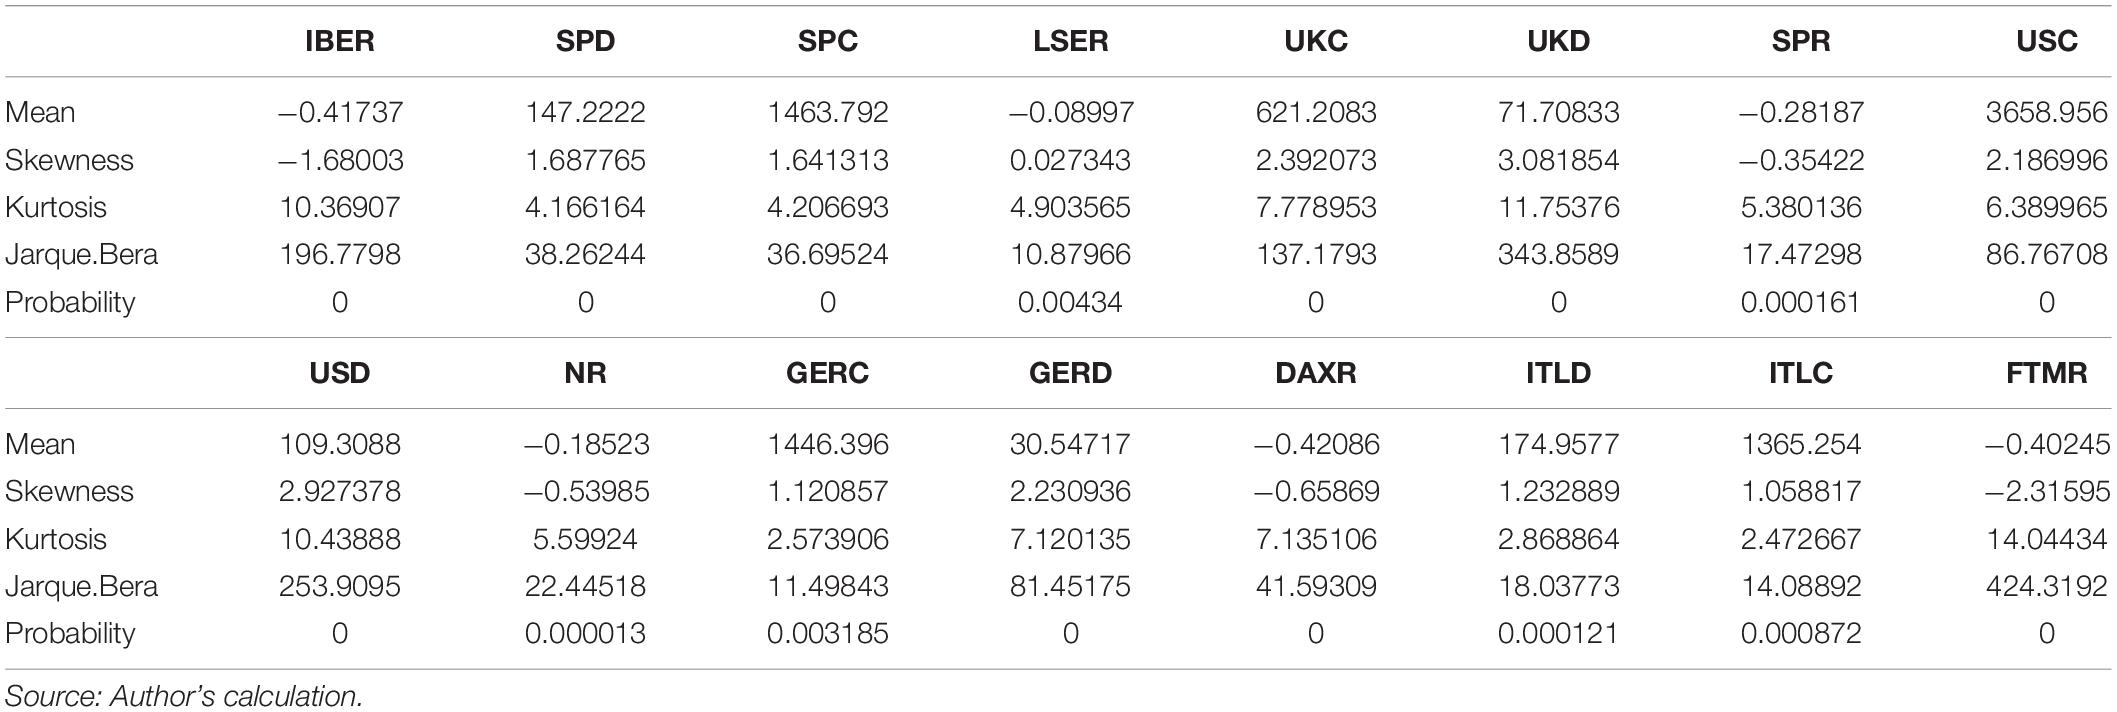
Table 1. Descriptive statistics.
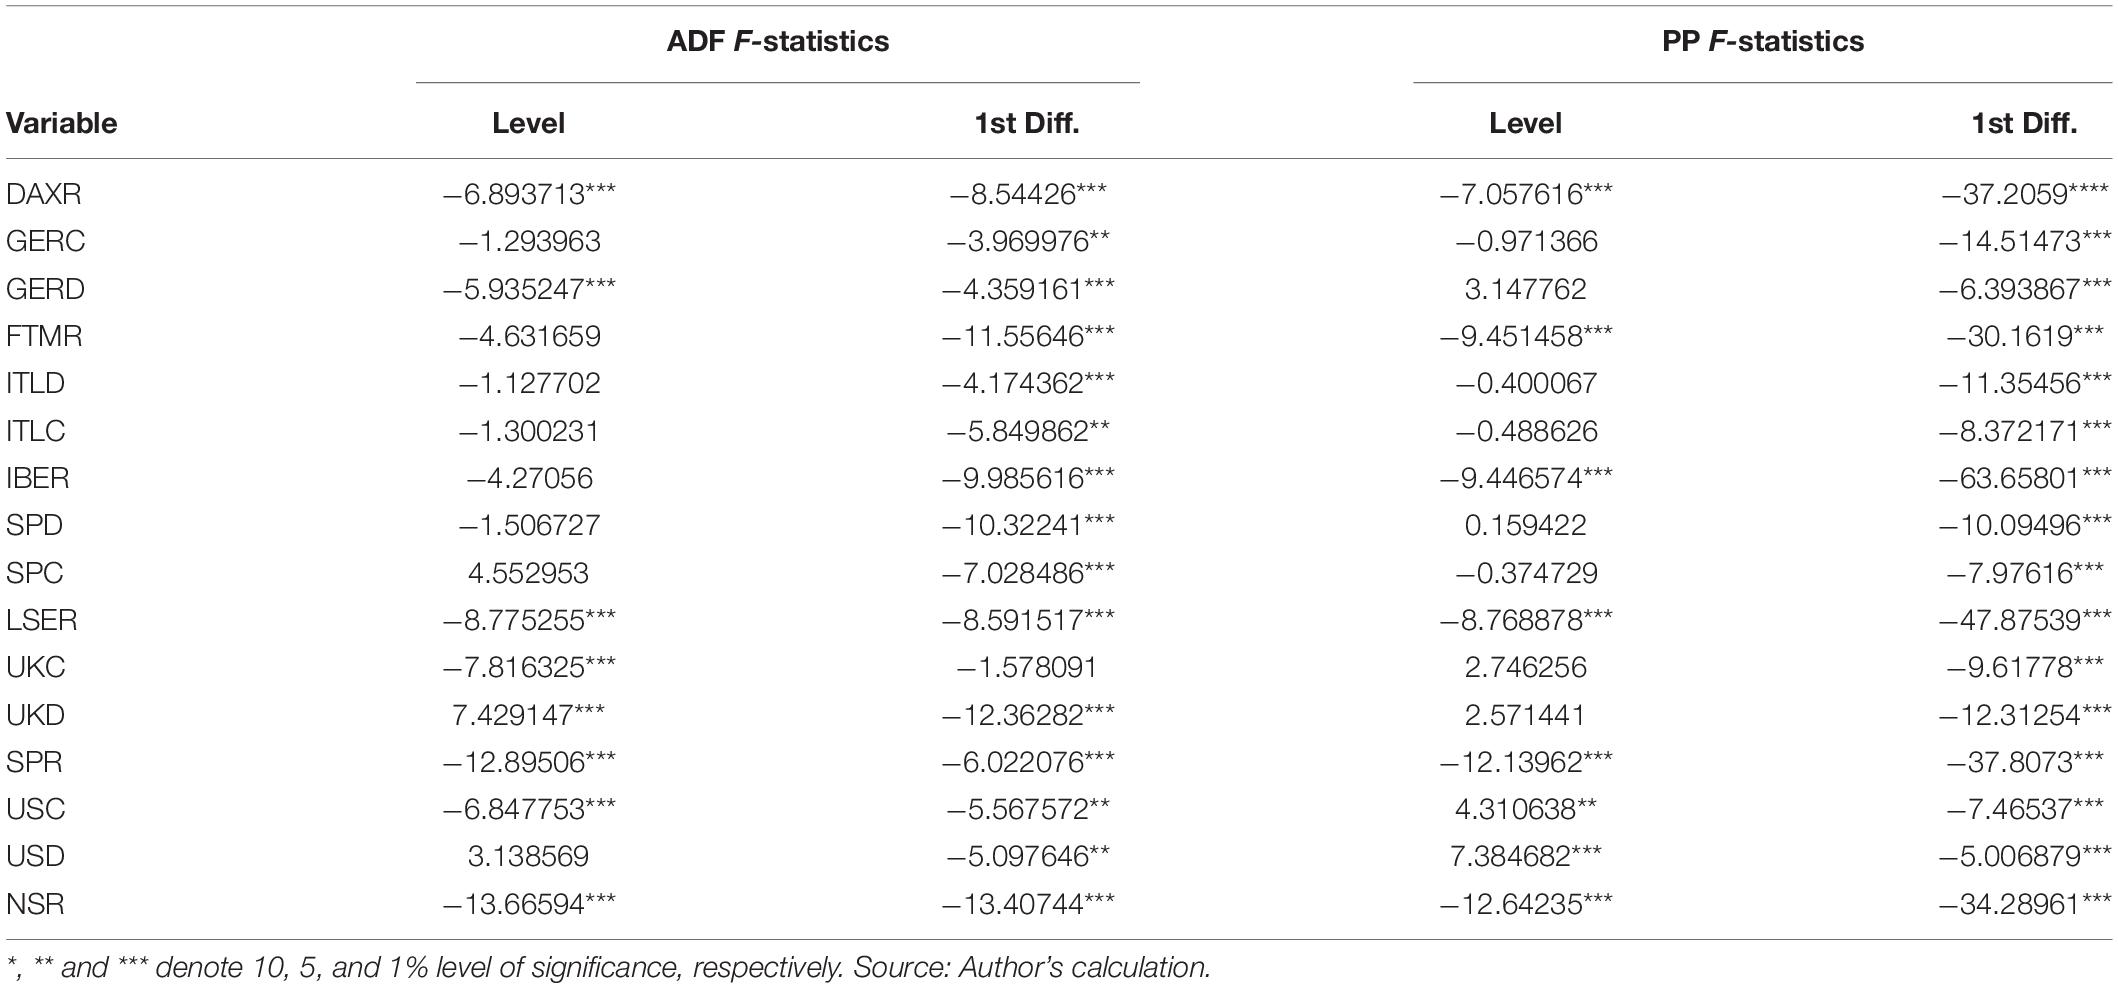
Table 2. Unit root test.
Bound Test Cointegration Fallouts
The outcomes of the Bound test displayed in Table 3 disclosed significant statistical evidence of a long-term association between study variables for each equation. The F-statistics for joint significance of lagged level parameters are stated as 63.02, 39.11, 5.4, 5.1, 38.2, and 14.03 for Eqs 1–6, respectively. These values surpass the upper bound limits of Shin et al. (2014), implying that long-run cointegration exists among economic crisis, health crisis, and financial markets of each equation.
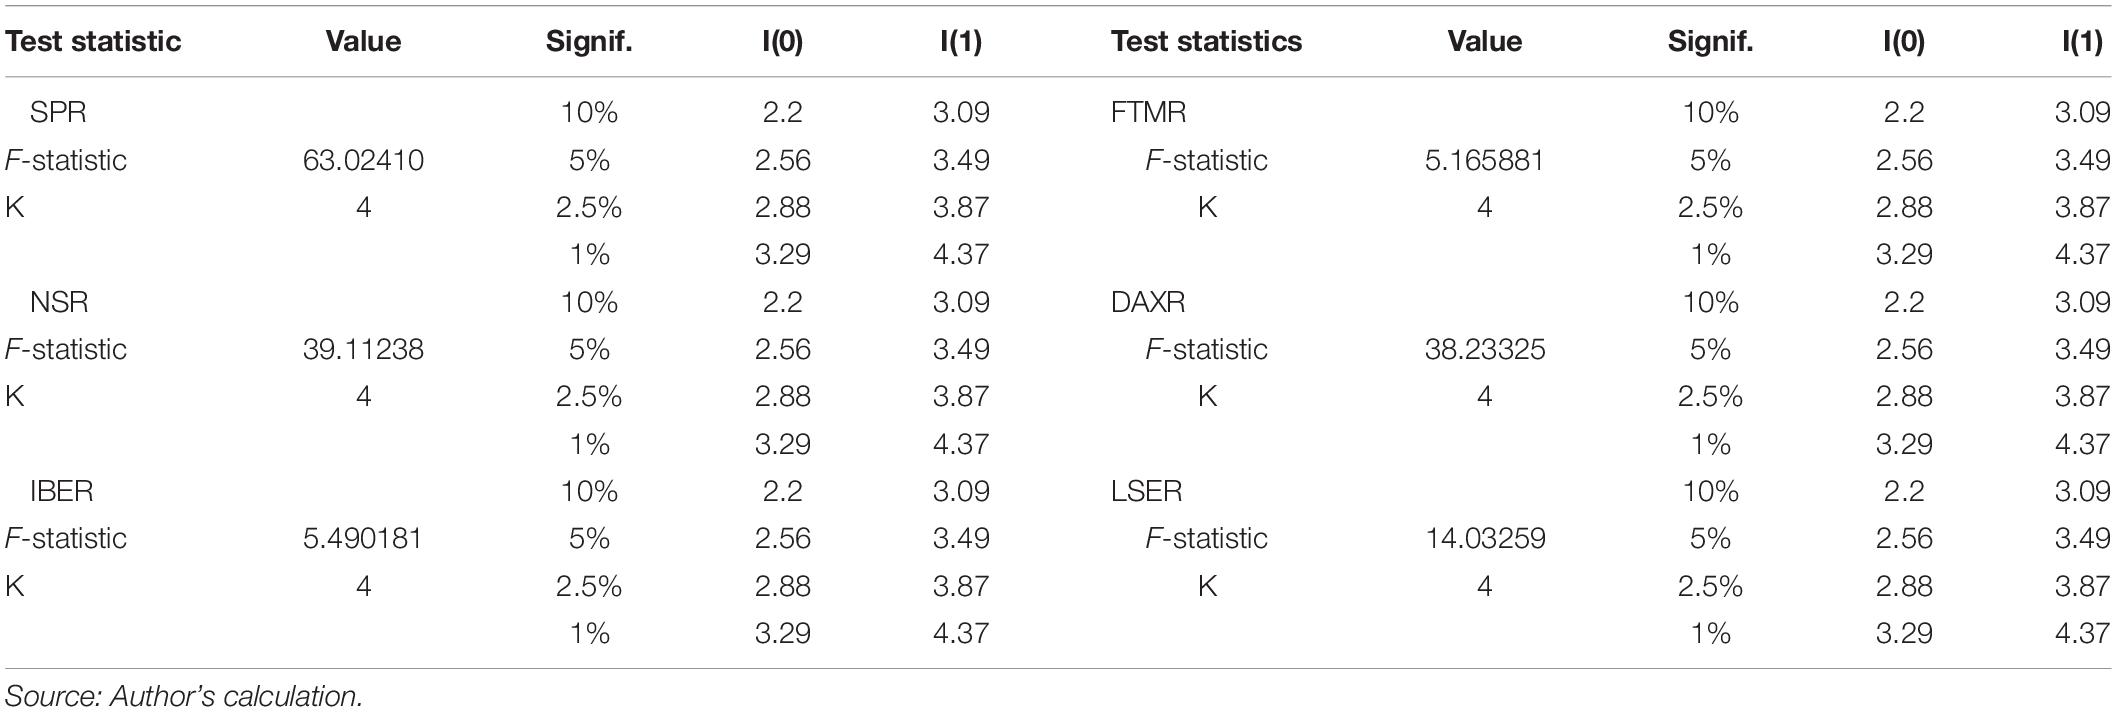
Table 3. Results of F-bound test.
Long- and Short-Run Asymmetric Cointegration Reckoning
Table 4 exhibited the upshots of the Wald-test. The statistics particularized that USC and USD have a non-linear association with SPR. However, USC revealed short-run asymmetric affiliation with NSR. Besides, SPD caused an asymmetric influence on IBER for both long-term and short-term periods, while SPC possessed short-run asymmetry only. Additionally, the results of FTMR designated that ITLD has a long-run asymmetric relationship with it. The Wald-statistics of GERC enlightened that it has both long and short-run non-linear impacts on DAXR, but GERD has a short-term non-linear affiliation with DAXR. Moreover, UKC denotes a long-run asymmetric liaison with LSER. Hence, the existence of non-linearity in the study variables led us to choose the NARDL model for computing long-and short-run factors.
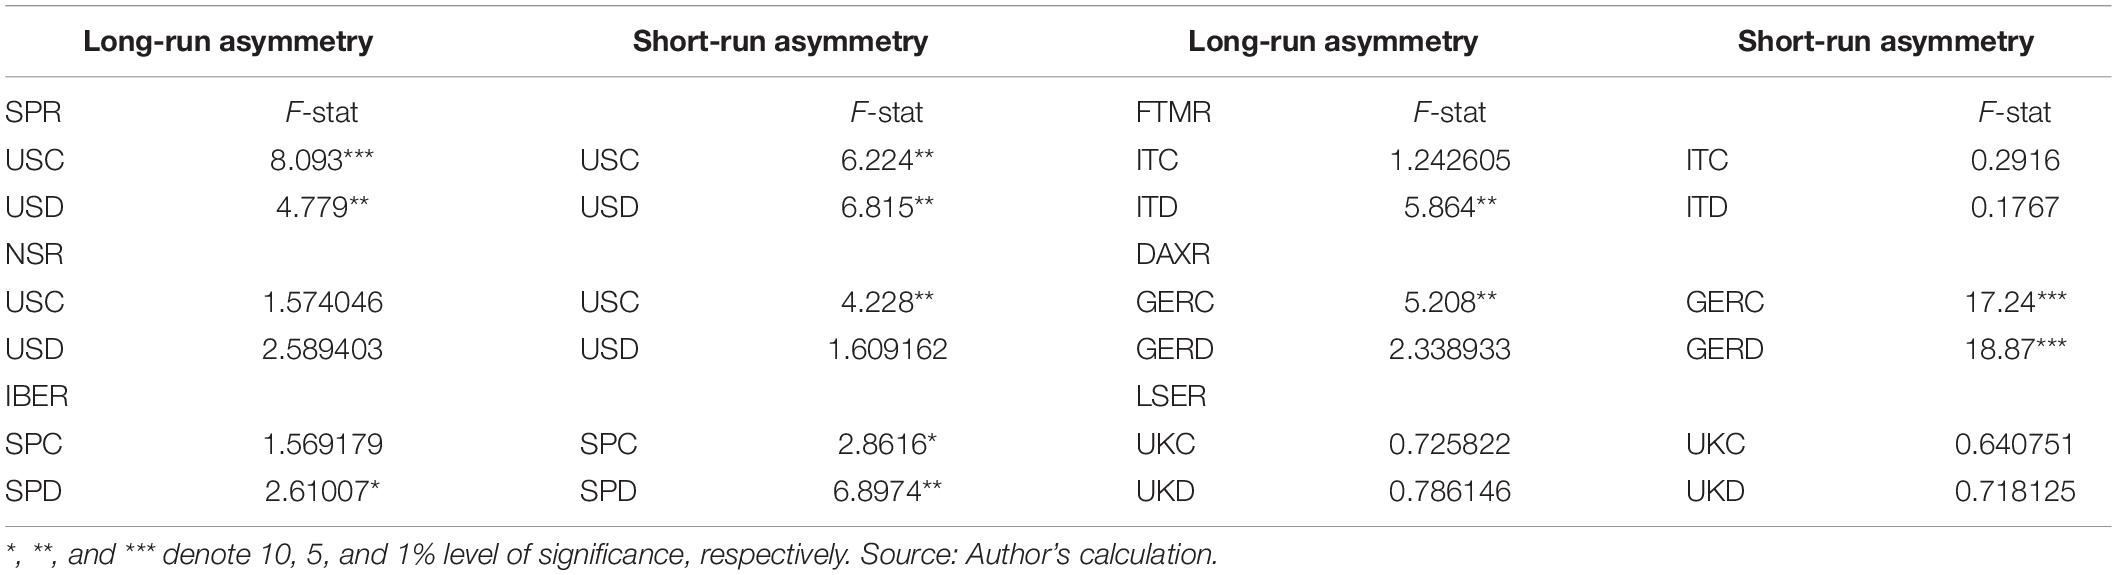
Table 4. Wald test.
Modeling NARDL Parameters
The non-linear fallouts of SPR, presented in Table 5, illustrated that expansion and contraction in USC brings a reduction and increase in SPR, respectively. It indicates that strict lockdown substantially decreases the market returns of the S&P 500 and vice versa. Further, a positive shock in USD caused a significant rise in SPR. In the short-run, lagged values specified that a negative shock in USC amplified SPR. Besides, all the lagged terms described that an uptick effect in USD improved the SPR. Also, a negative shock in USD and its second lag augmented the SPR, but the first and third lag represents the reverse impact. Furthermore, the negative and significant value of ECTt–1 stated that disequilibrium occurred in SPR today due to COVID-19 will adjust with the speed of 1.3 units on a subsequent day. The R-squared value indicated that the 91% volatility in SPR is owing to COVID-19.
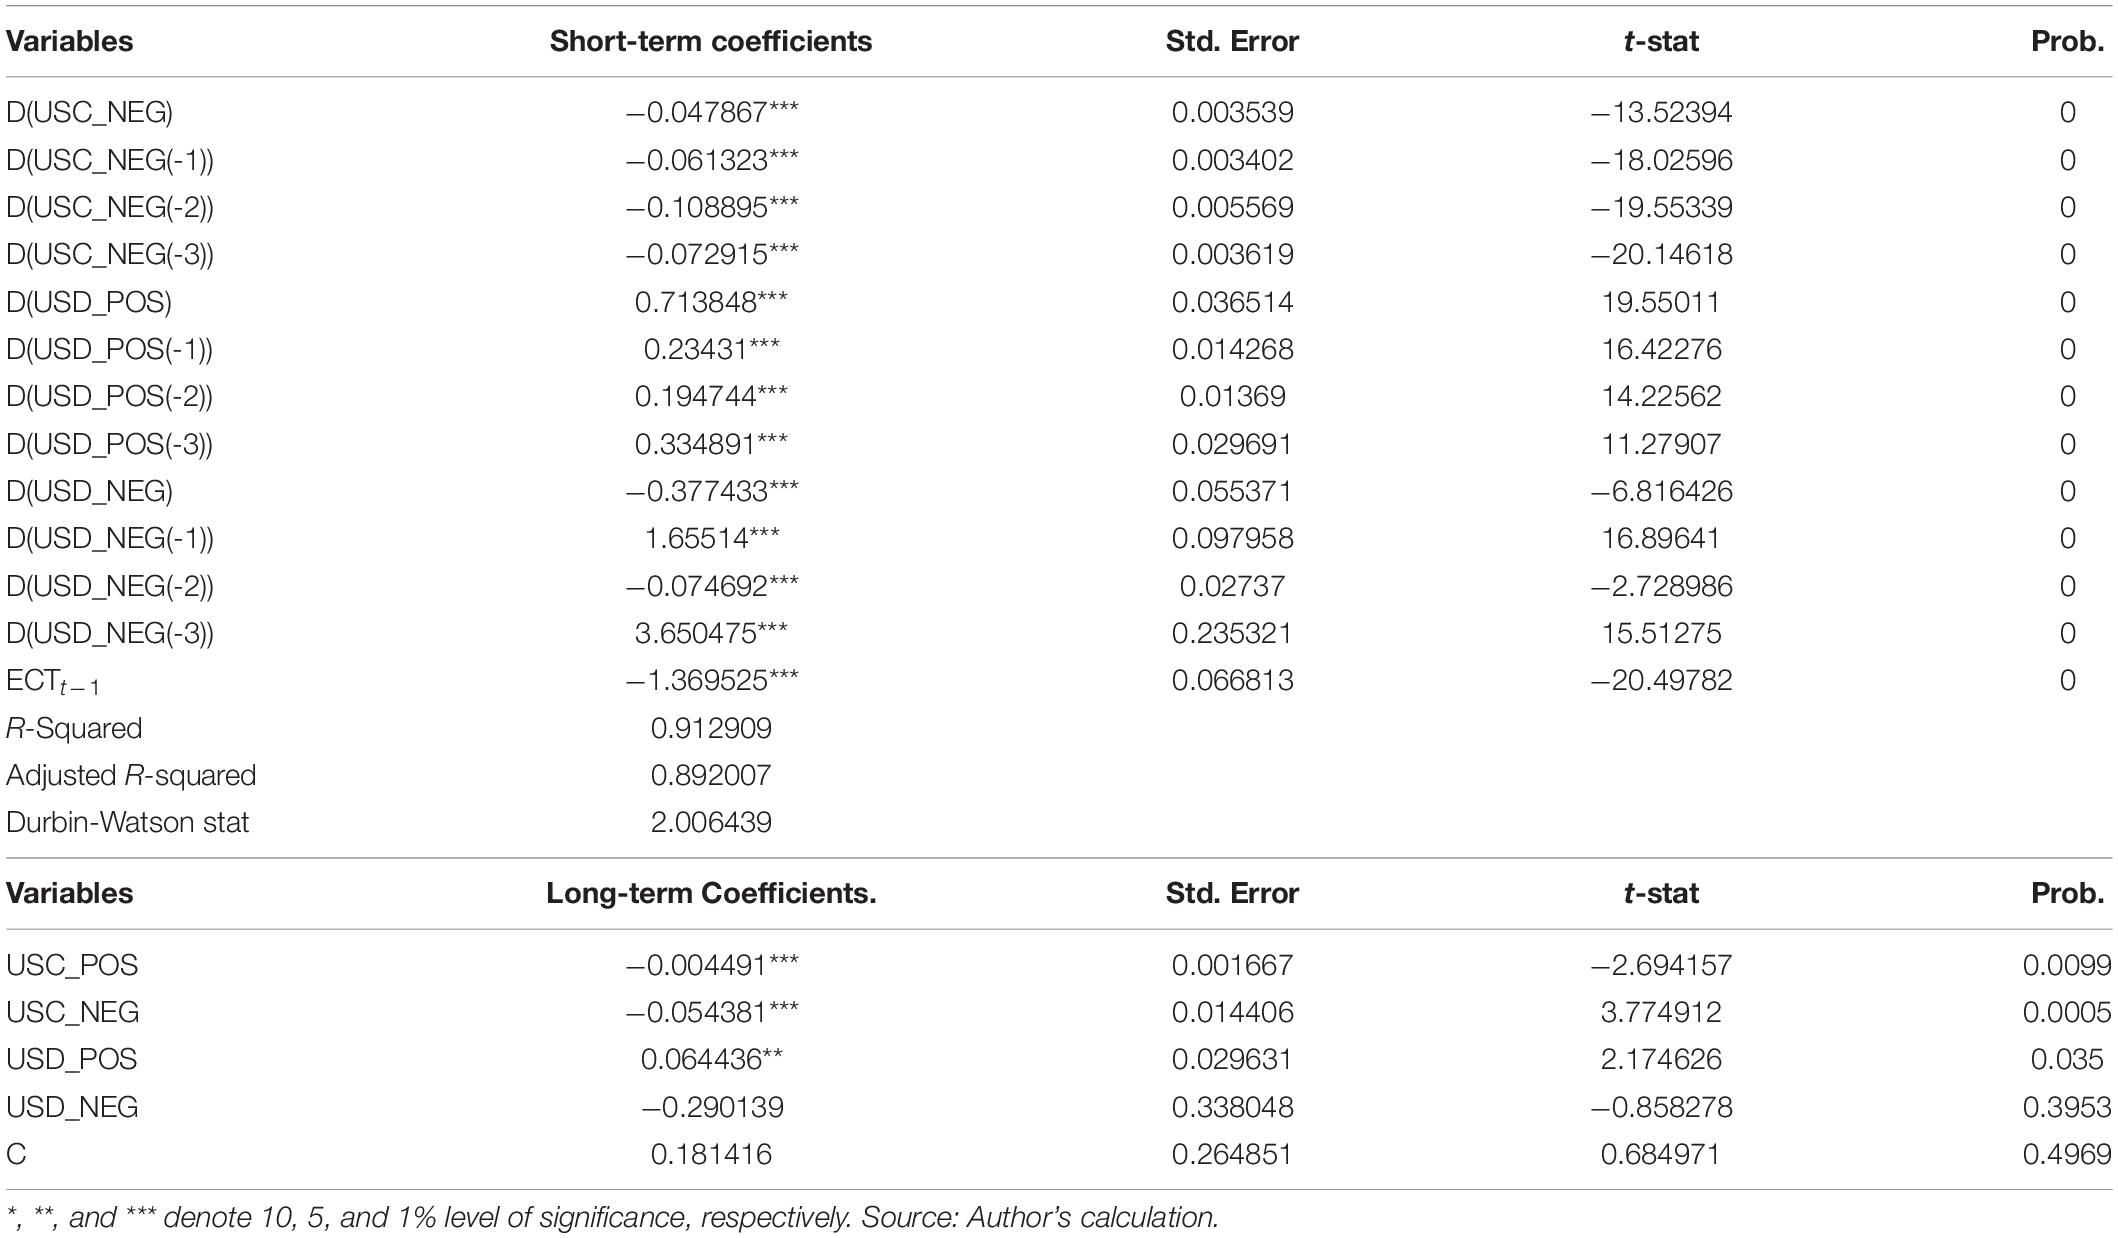
Table 5. Asymmetric parameters of SPR.
The NSR model results exhibited in Table 6, particularized that both positive and negative shocks in USC escalate the NSR, while enlargement (reduction) in USD instigate decrease (increase) in NSR. It specifies that an upsurge in the health crisis in the US expressively distressed the Nasdaq Composite Index and vice versa. Nonetheless, in the short-run, a negative shock in USD and USC demonstrated an imperative decrease in NSR, whereas an expansion in USC lessens the NSR. The negative and significant ECTt–1 parameter stated that financial instability generated due to COVID-19 would be settled with a speed of 1.5 units on the next day. The R-square value signified that 81% of instability occurring in NSR is the result of COVID-19.
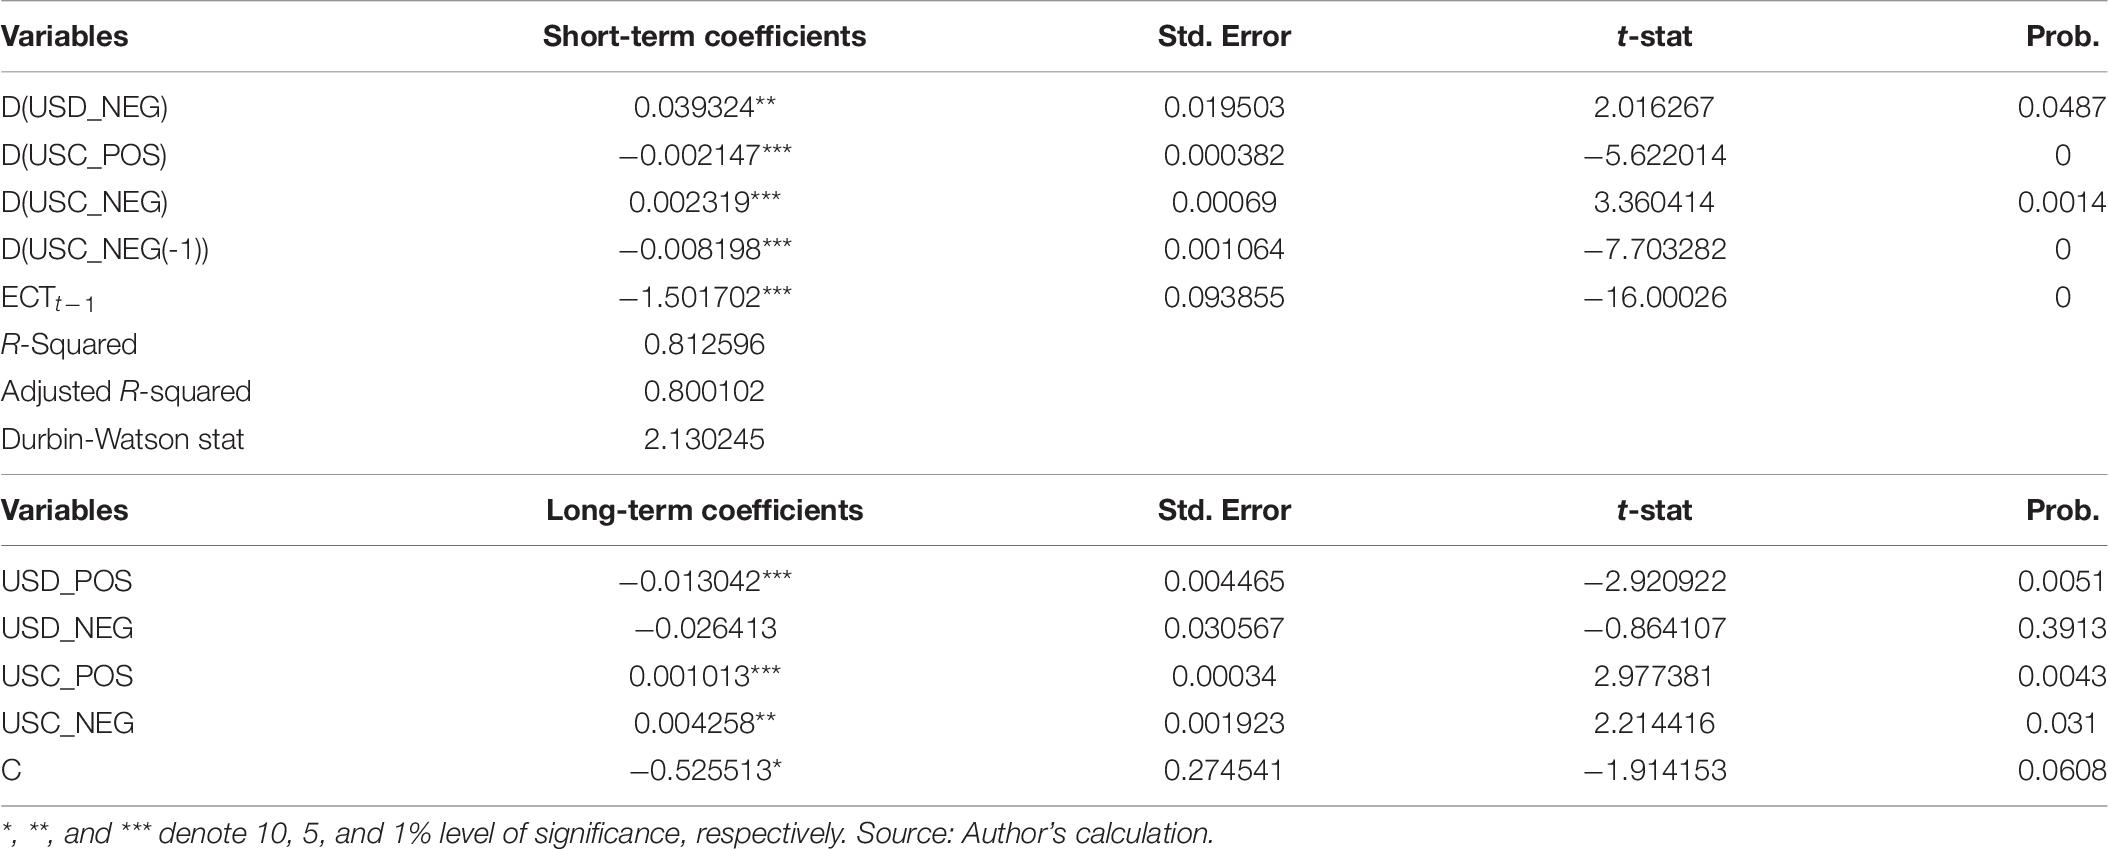
Table 6. Asymmetric parameters of NSR.
The finding parameters of the IBER model (Table 7) identified that an assertive shock in SPD has an encouraging effect on IBER. Besides, adverse shocks remain insignificant. On the other hand, an escalation (decline) in SPC has a negative (positive) influence on IBER, implying that strict lockdown considerably caused the financial crisis in Spain for the long term period. In the short term period, an intensification in SPC, SPD, and a decline in SPC, SPD increased the IBER. The negative and significant value of ECTt–1 elucidated that today’s disequilibrium in IBER will adjust on the next day with a speed of 0.82 units. The coefficient of R-square stated that 72% of variations in IBER are owing to COVID-19.
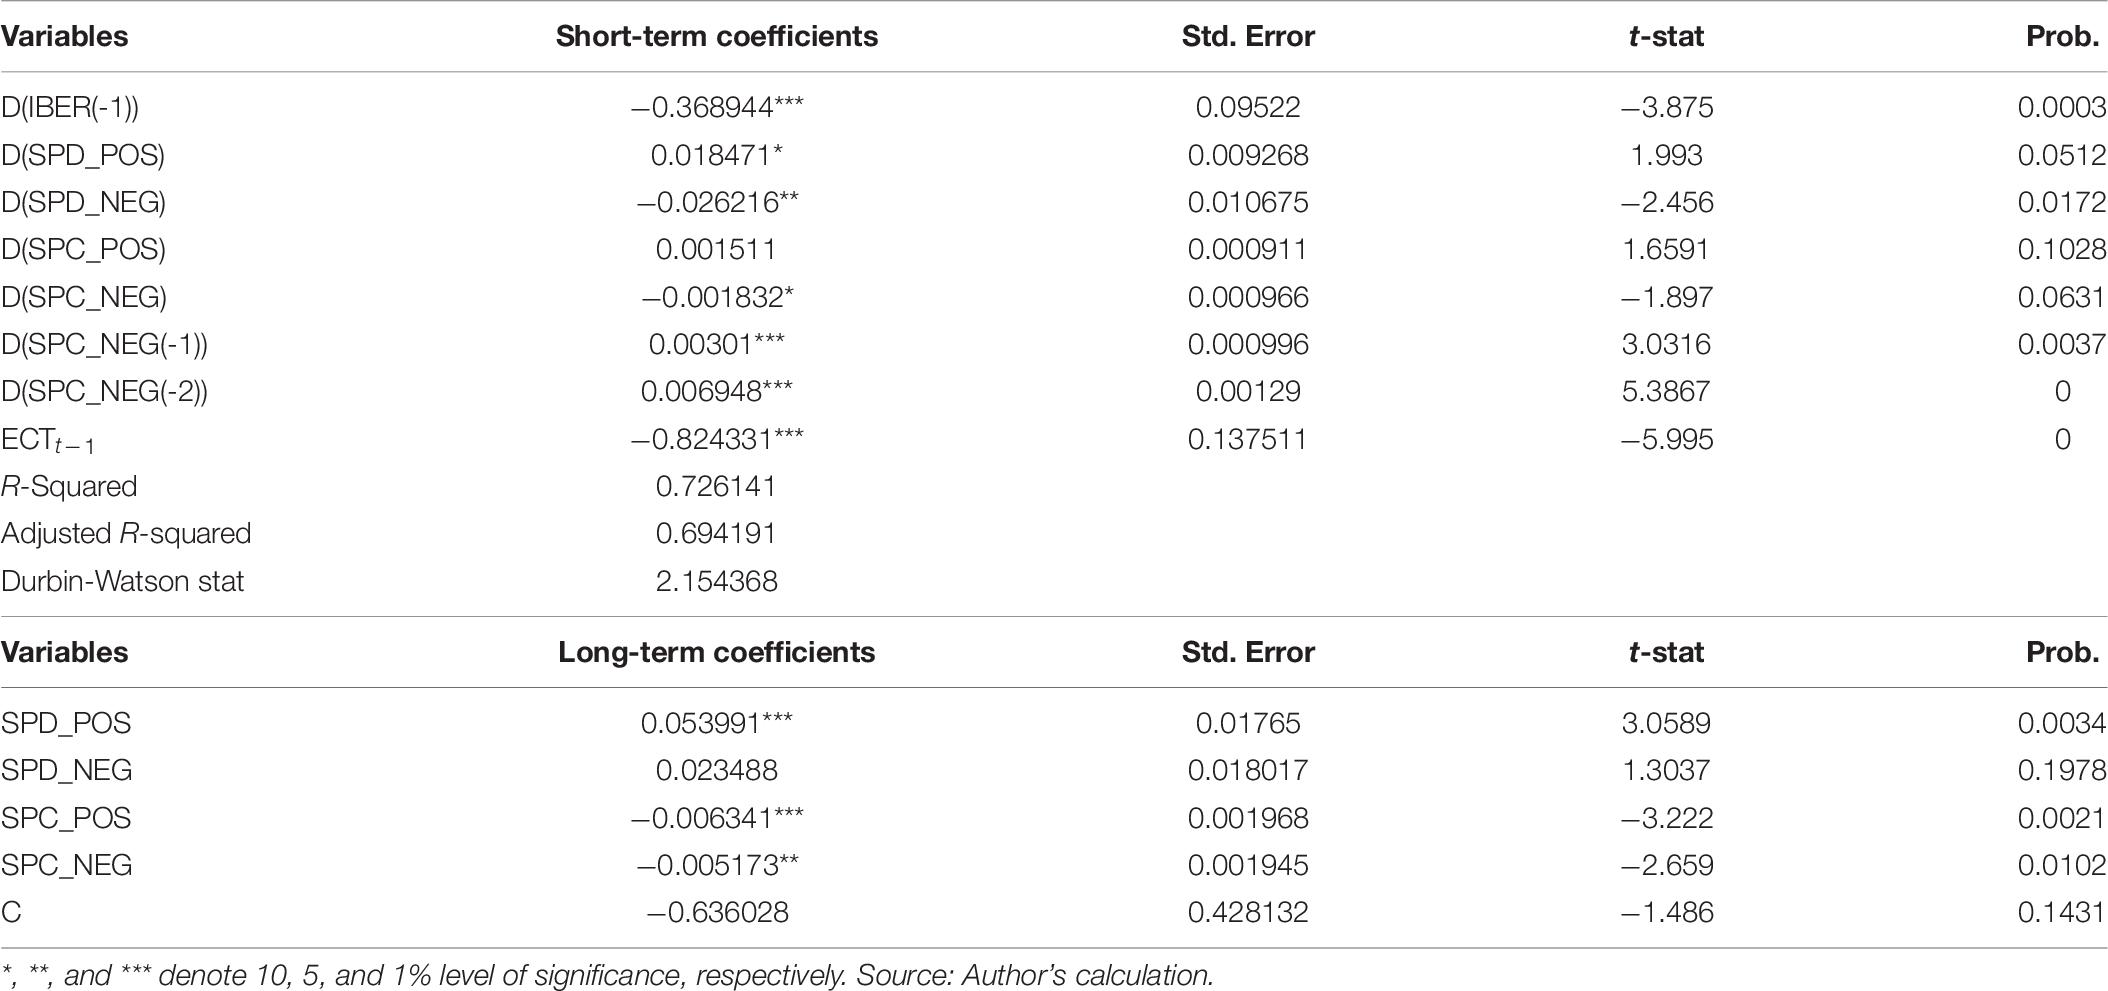
Table 7. Asymmetric parameters of IBER.
Table 8 displayed the fallouts of the FTSE MIB stock market. The condition of COVID-19 on Italy’s stock markets exposed that rise (reduction) in ITLD diminished (amplified) the FTMR, inferring that heath crisis imperatively contributes to Italy’s financial instability for the long term period. In addition, growth in ITLC enlarged the FTMR imperatively. The sort-run condition in Italy denoted that first, second, and third lag values of FTMR harmed its own returns. Also, growth in ITLC has a negative impression on FTMR. Nonetheless, a negative shock in the second lag value of ITLC indicated an encouraging effect on FTMR. The consequences of ITLD symbolized that proliferation in ITLD possess negative sway on FTMER, but the first and second lag value have definite sway on it. Furthermore, a decline in ITLD has a direct influence on FTMR. The negative and significant figure of ECTt–1 itemized that FTMR will readjust the equilibrium with a speed of 0.95 units each day. The R-squared parameter denoted that 85% uncertainty generated in FTMR caused by COVID-19.
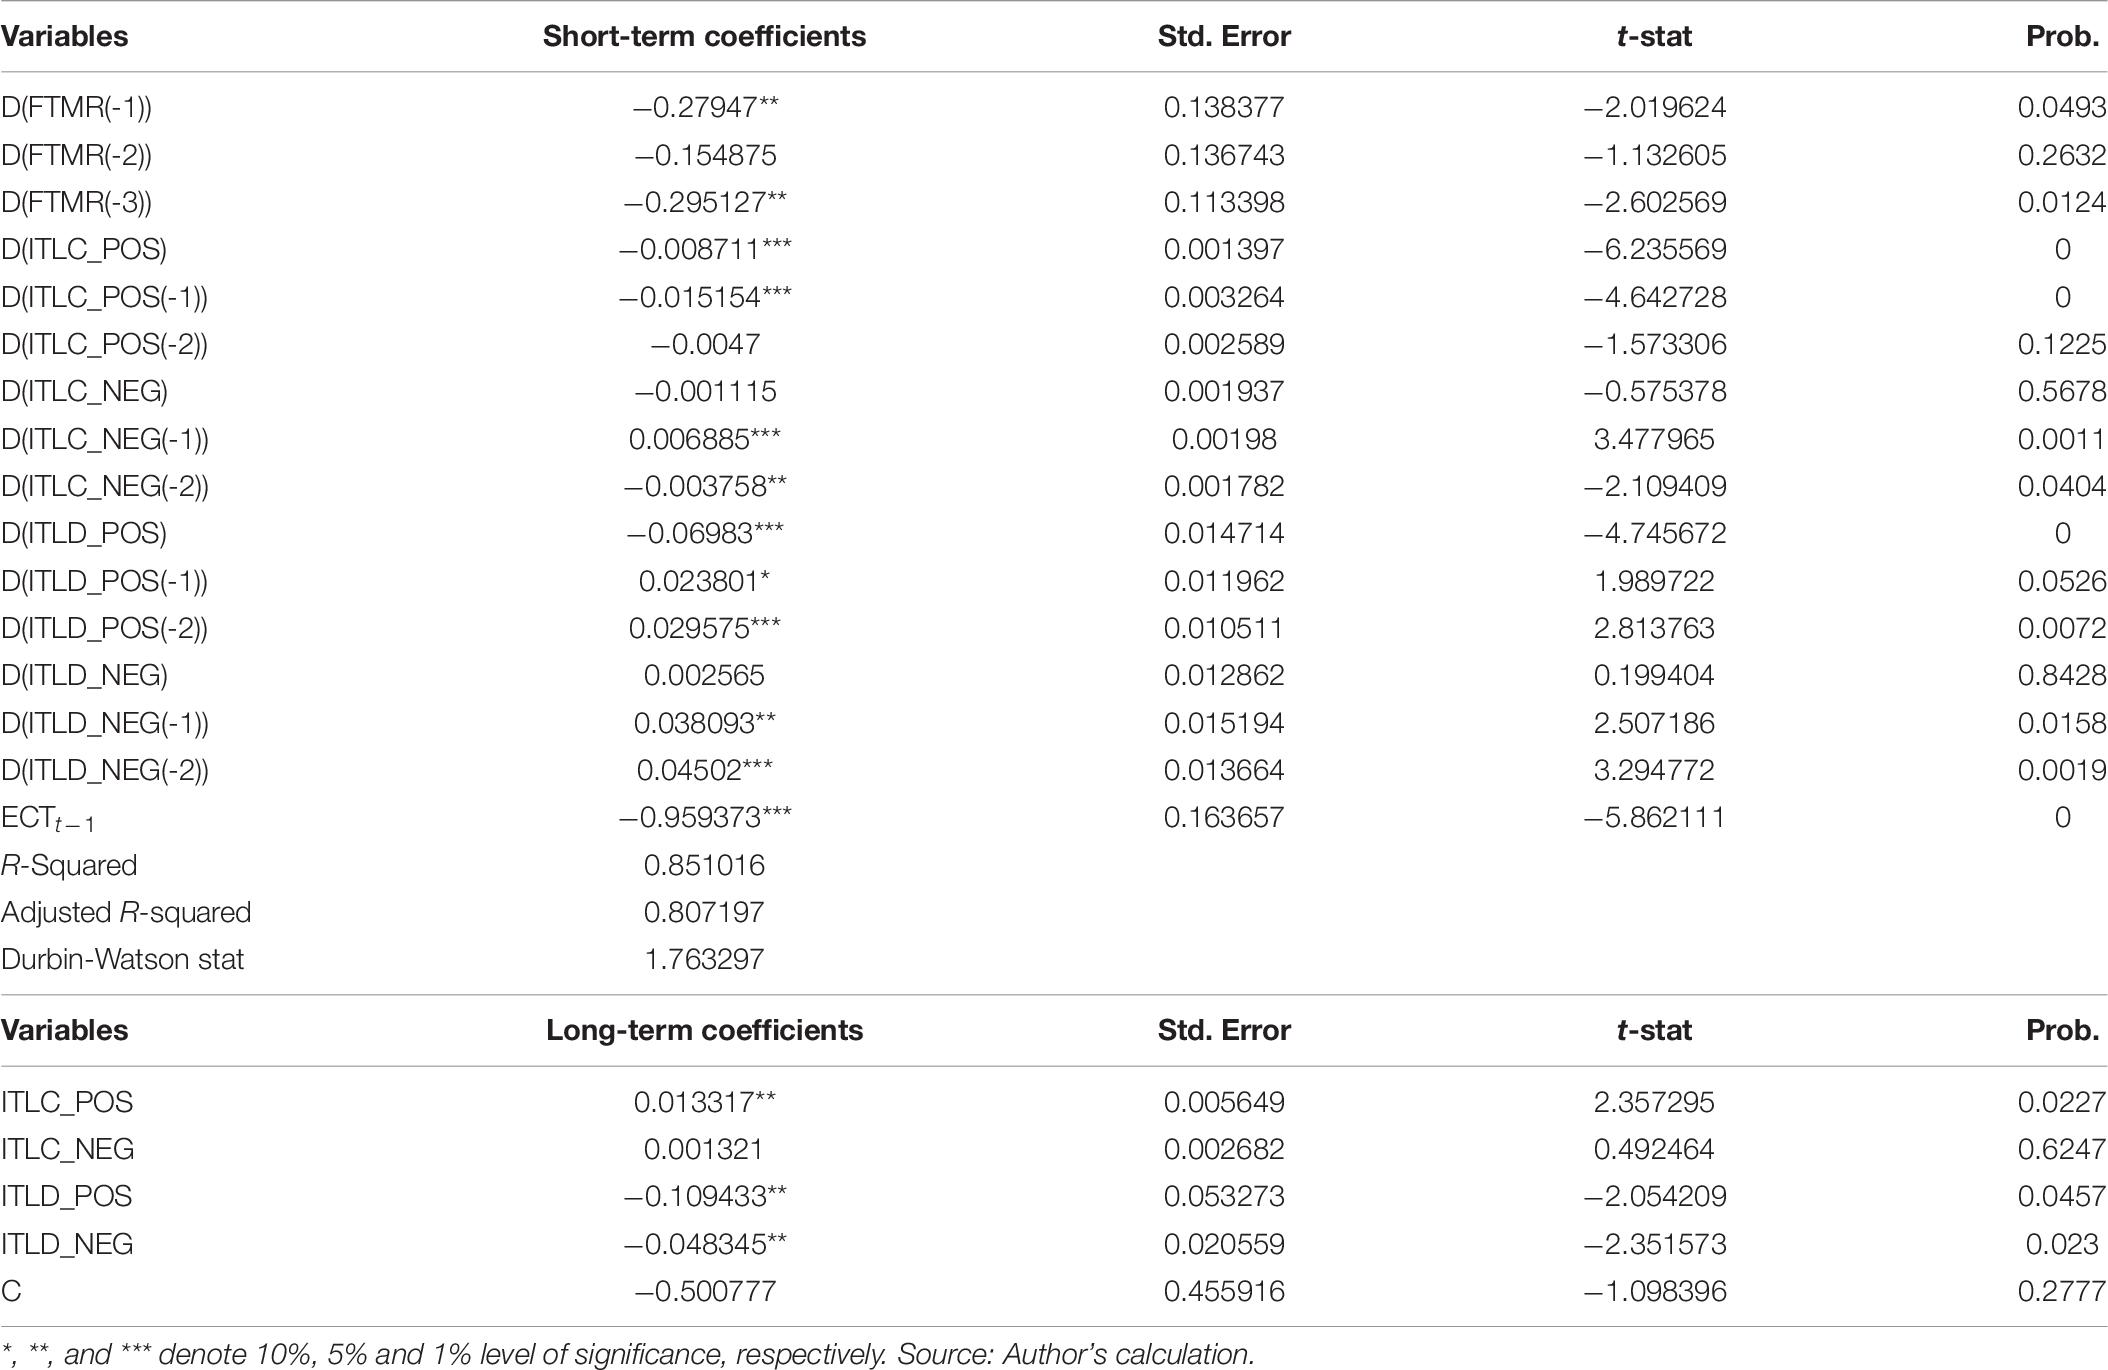
Table 8. Asymmetric parameters of FTMR.
The parameters of DAX 30 (Table 9) directed, in the long run, an upsurge (diminution) in GERD compacted (enlarge) the DAXR. Moreover, the decline in GERC also improves DAXR. These findings revealed that both lockdown and health crises are harmful to the stock markets of Germany. The short-term findings described that second, third, and fourth lag of positive shocks in GERC has a lessening impact on DAXR. However, a negative shock in GERC and other lag values except the first lag indicated an indirect association with DAXR. Additionally, positive shocks in GERD quantified mixed impact on DAXR, while a short term decline in GERD has negative, but first lag, second lag, and third lag values point out positive linkage with DAXR. These effects are because of instability generated due to COVID-19. The R-squared coefficient diagnosed that the 94.5% instability in DAXR is because of COVID-19.
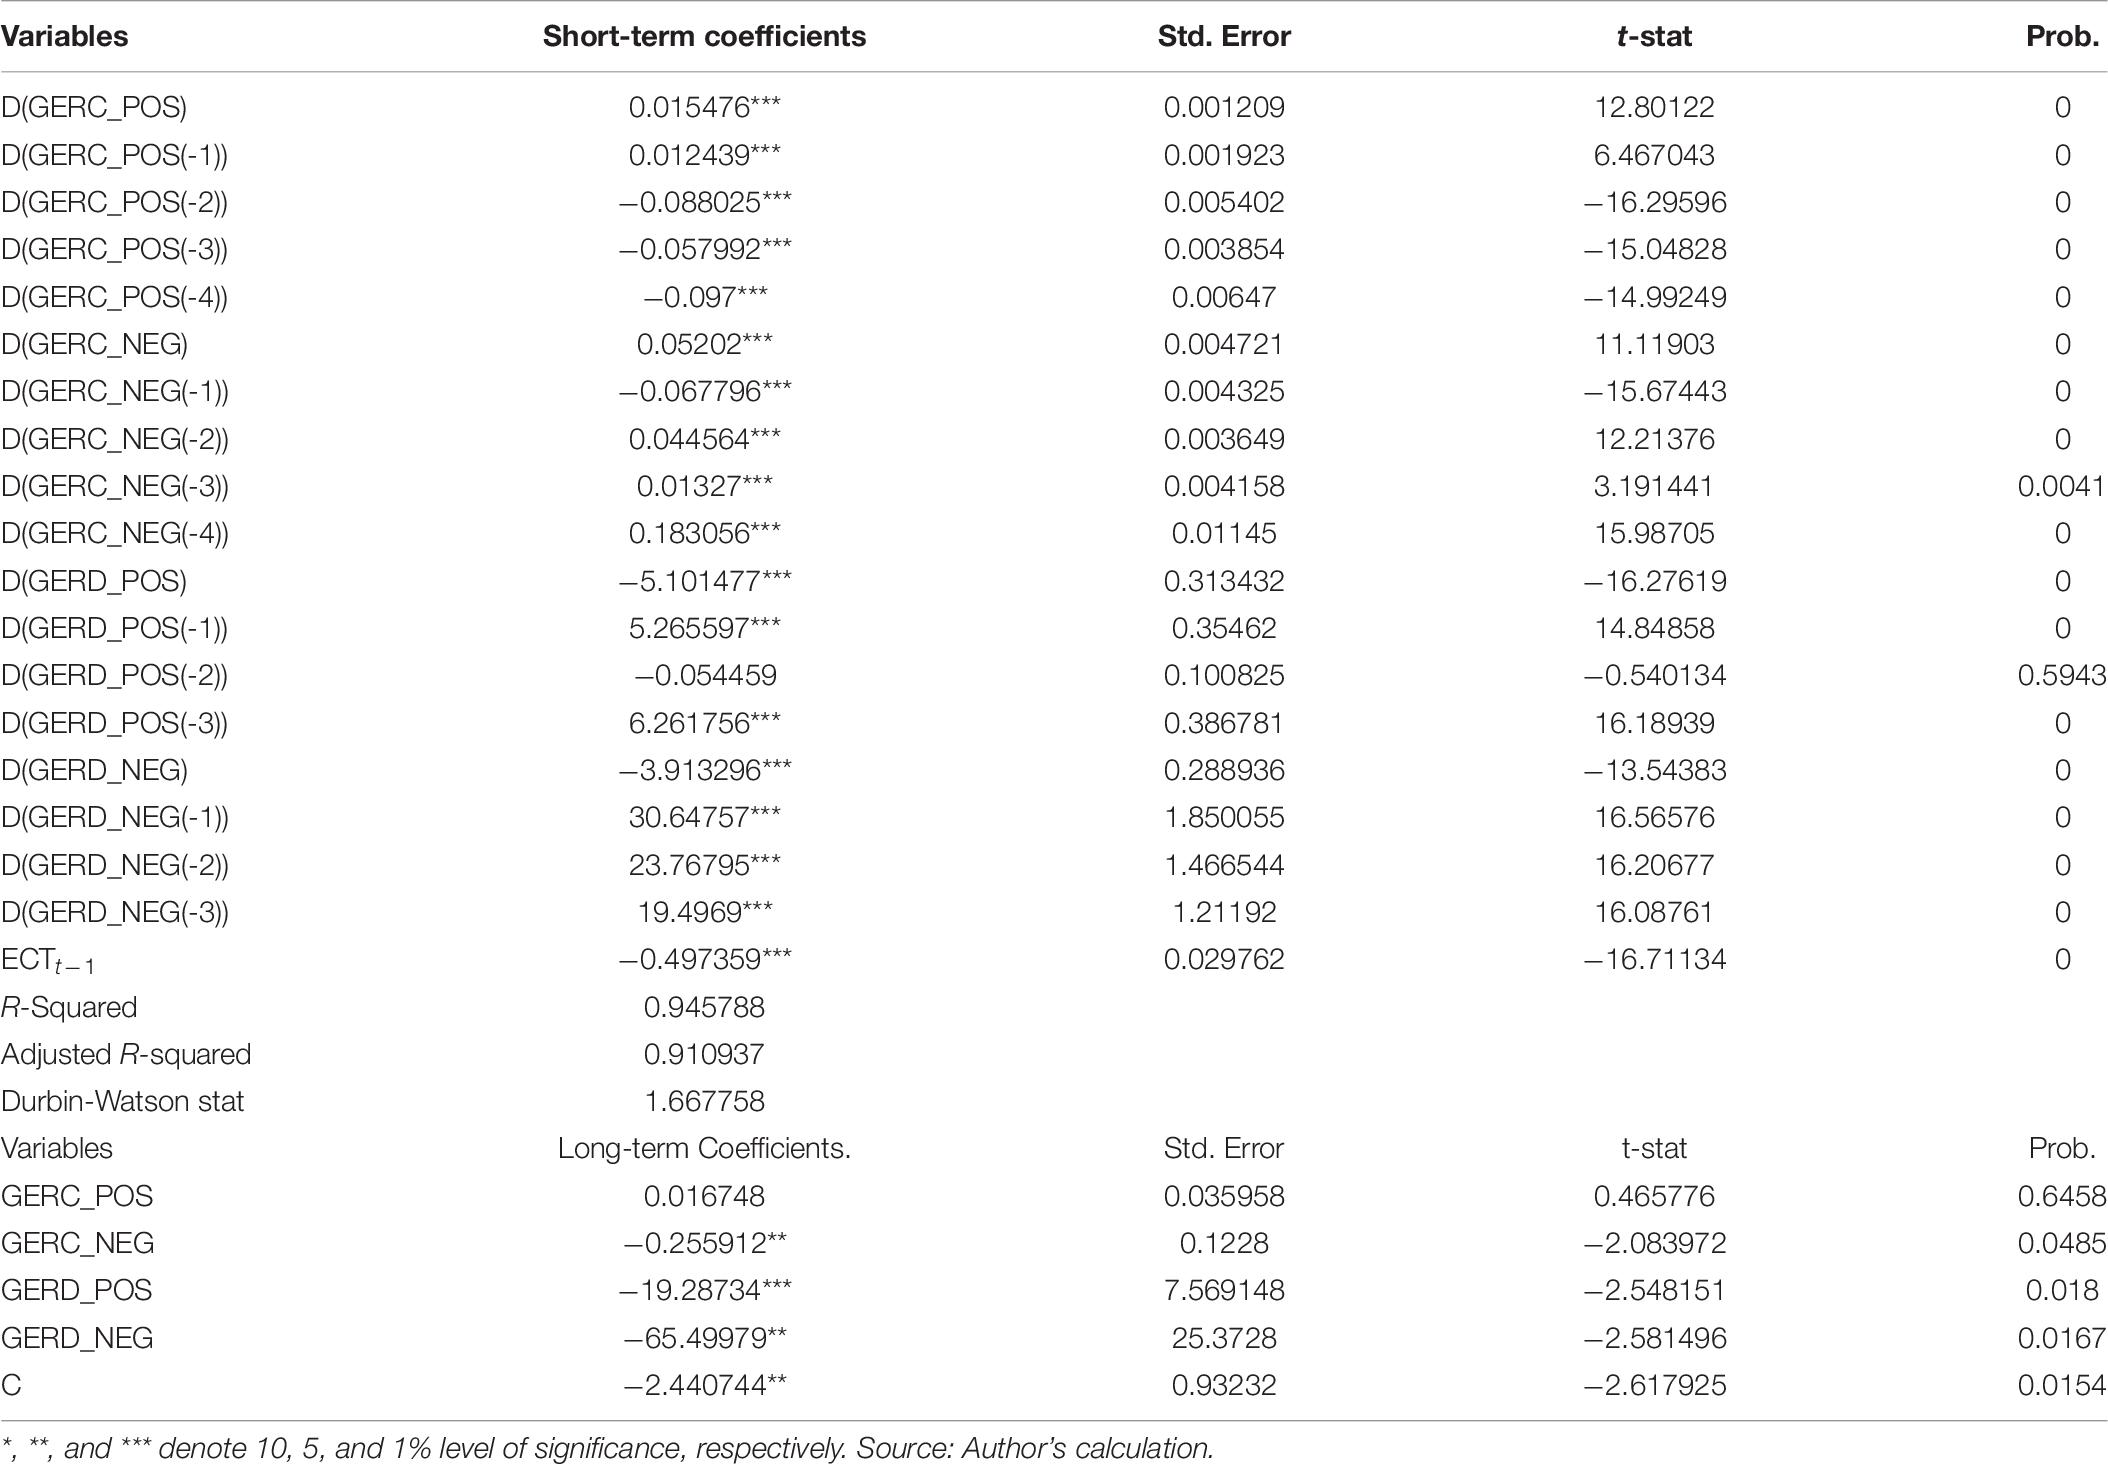
Table 9. Asymmetric parameters of DAXR.
Table 10 represents the results of the London Stock exchange. The concluding coefficients of the UK explored that augmentation in UKD improved the LSER, while diminution in UKD reduces the LSER in the long term period, although the growth of UKC brought a significant decrease in LSER. The short term period outlined that positive shocks in UKC reduced the LSER, but the first lag value of positive shock in UKD showed an alternate impression. Additionally, an upturn in UKD possesses a diminishing impact on LSER. These outcomes designated that lockdown and health crises generated due to COVID-19 negatively impact the financial markets of the UK for the short term period. The value of ECTt-1 showed that fluxes occurred today in LSER will get equilibrium with the speed of 1.1 units on the next day. The R-square value reported a 65% variation in LSER due to COVID-19. Figure 3 depicts the adjustment of asymmetric effect in the existing long-run equilibrium, once moved to a new long-run equilibrium as a result of positive and adverse shocks. The asymmetric plots denote the alliance of dynamic multipliers owing to positive and adverse shocks in S&P 500, DAX 30, FTSE MIB, Nasdaq Composite index, IBEX 35, and LSE markets. The outcomes revealed that these markets tremendously respond to the positive and negative shocks befallen due to COVID-19.
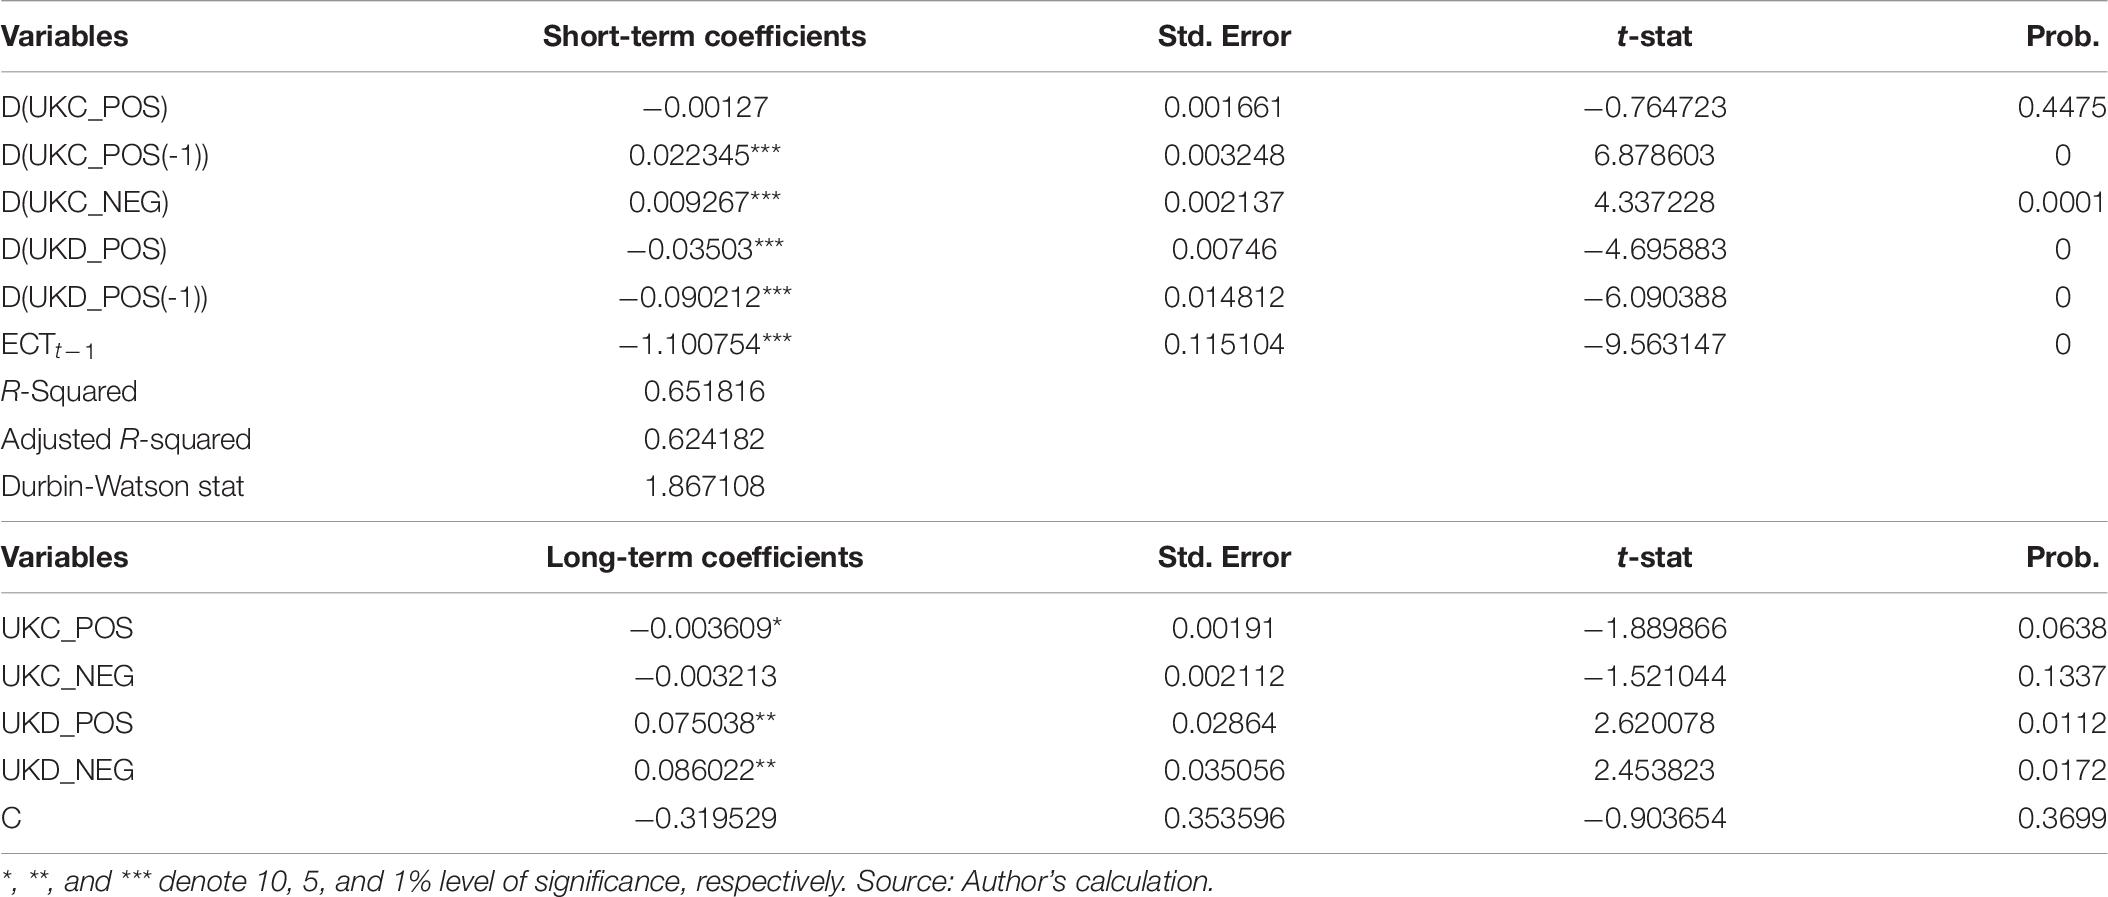
Table 10. Asymmetric parameters of LSER.
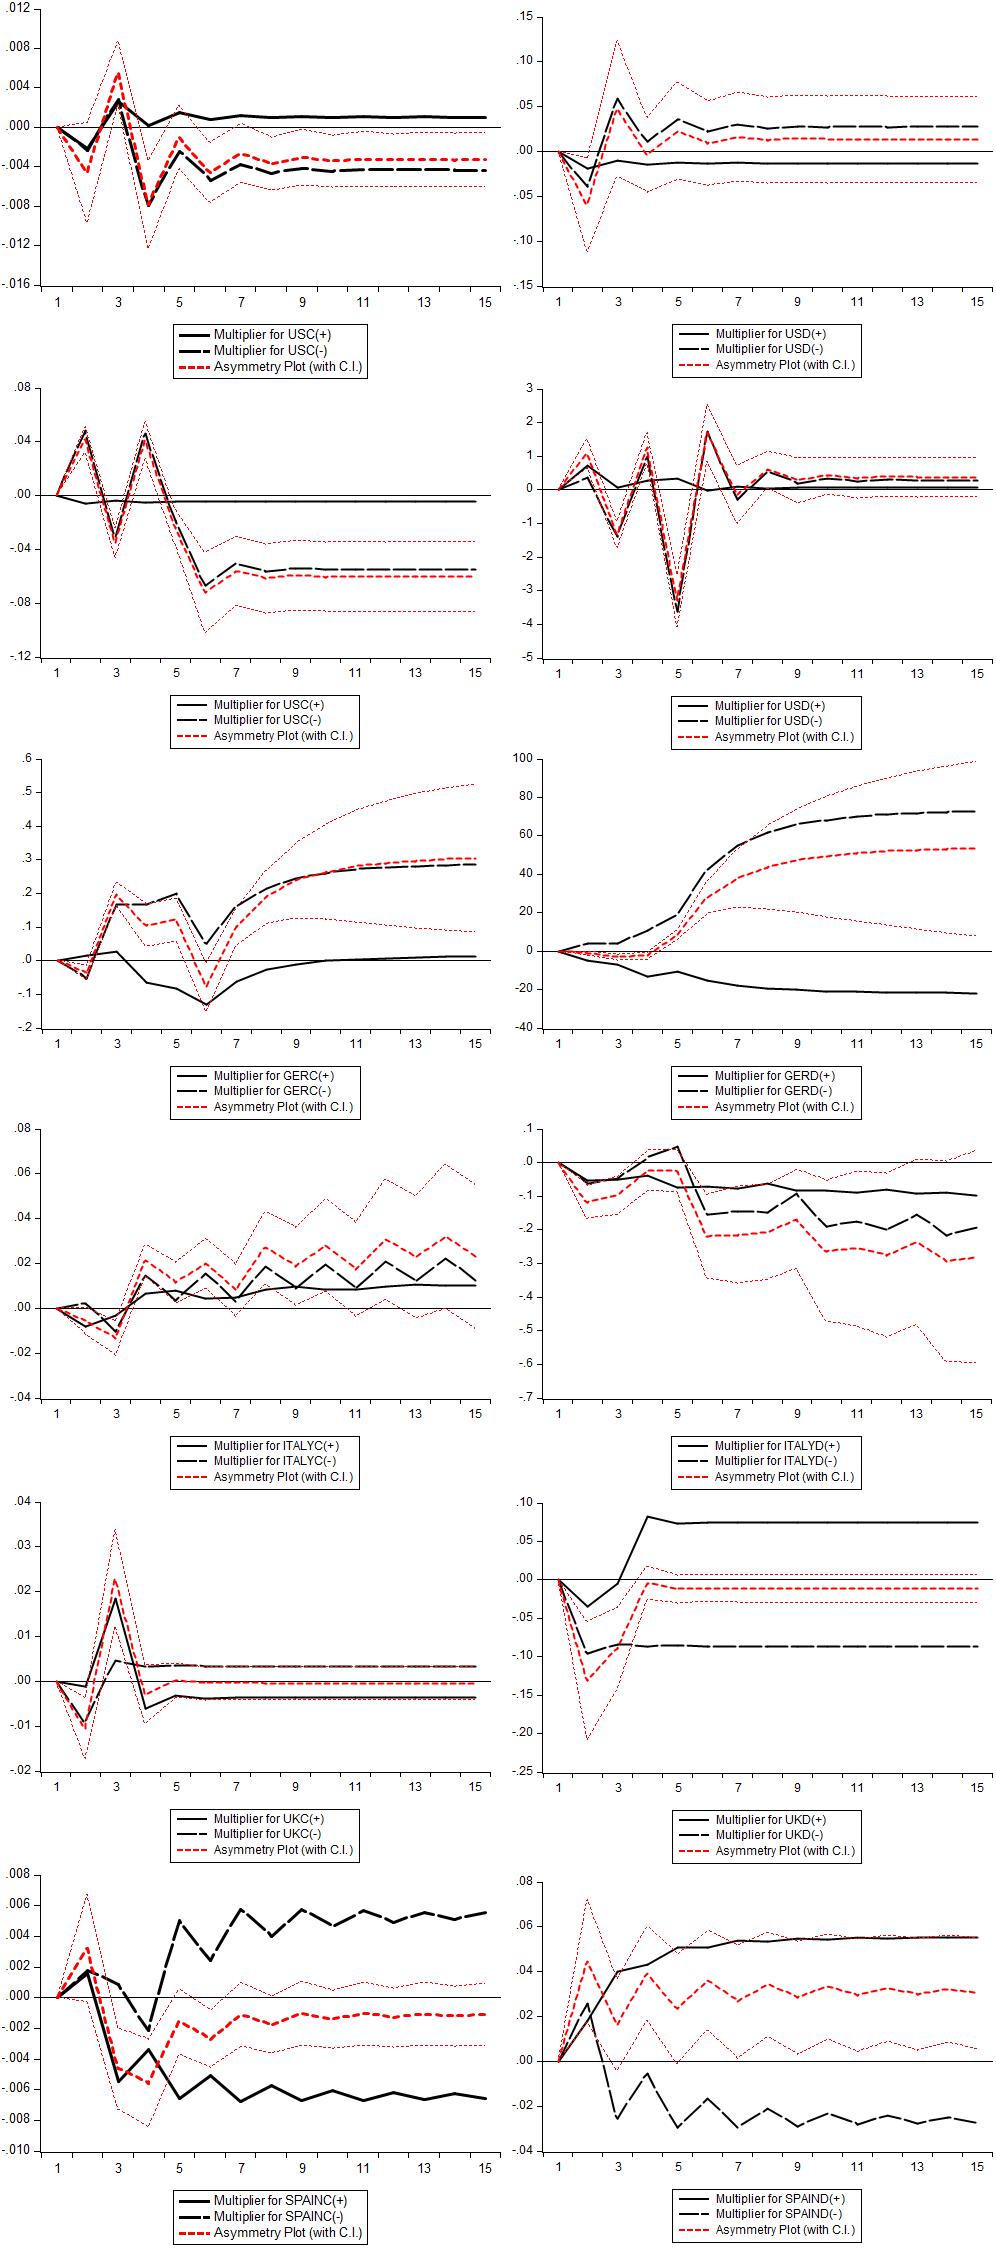
Figure 3. The dynamic multiplier plots.
Diagnostic Parameters Evaluation
The examination employed the Breusch and Pagan (2006) test to diagnose the Serial Correlation and Heteroskedasticity in each model’s residuals, Ramsey RESET technique, to ascertain functional misspecification, CUSUM, and CUSUMSQ (Ploberger and Kramer, 2006) test to define the reliability of parameters. The conclusions of these tests given in Table 11, nominated that there was no serial correlation and Heteroskedasticity in the residuals of each model. Besides, the plots of CUSUM and CUSUMSQ presented in Figure 4 remain within the 5% critical boundaries, inferring that coefficients of the NARDL model are stable.
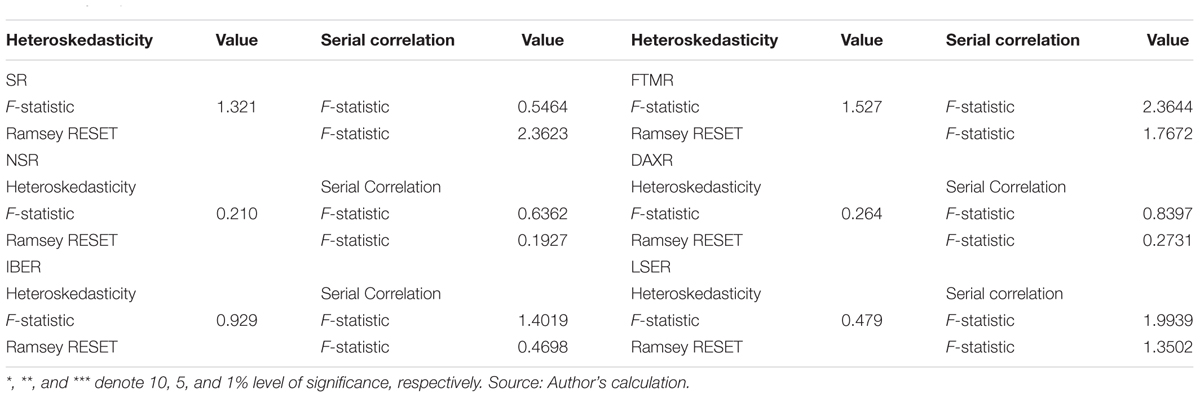
Table 11. Diagnostic test results.
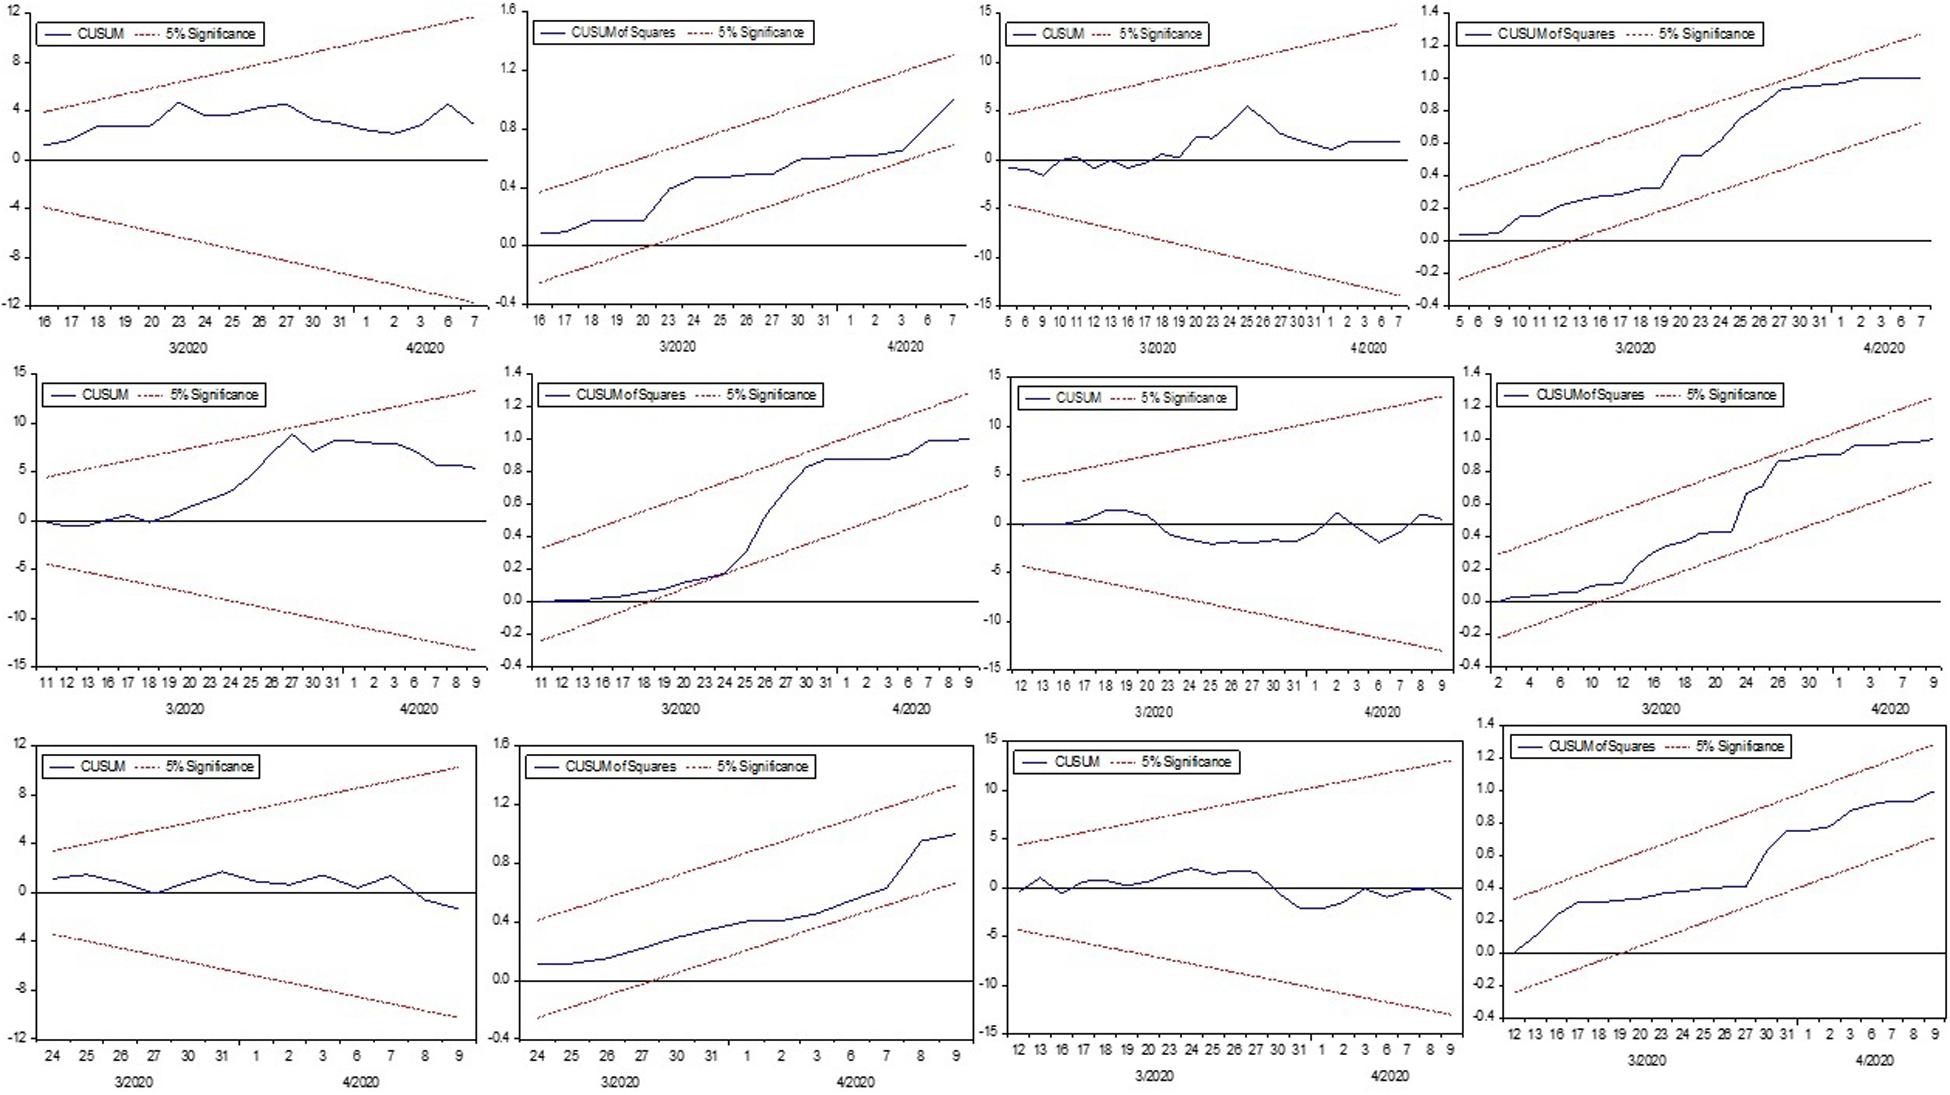
Figure 4. The CUSUM and CUSUMSQ graph.
Conclusion
COVID-19 has imperatively shaken the economic indicators, primarily the financial markets of the globe. The number of patients and deaths as a result of COVID-19 are increasing day by day, and economic conditions have become entirely uncertain. Moreover, the financial markets of the world fronted a sudden crash in their market values. This investigation utilized the Non-linear Autoregressive Distributed Lag (NARDL) approach to estimate the non-linear impact of economic crisis and health crisis generated as a result of the COVID-19 pandemic on the behavior of financial markets of the most infected territories of Europe and the US. The analysis stated that the returns of the S&P 500 index are greatly affected by the economic crisis generated because of COVID-19 in the US. However, an accession in the health crisis, because of COVID-19, significantly decreased the Nasdaq Composite Index returns. These results confirmed that economic instability and the health management system have an imperative control over the financial markets’ behavior. The verdicts elaborated that the economic crisis produced as a result of lockdown circumstances in Spain has more impact on IBEX 35 as compared to the health crisis that resulted in Spain. In the long-run, Italy’s stock markets are more affected by the health crisis than the economic crisis, while, in the short-run, economic uncertainty also lowered the stock returns of FTSE MIB. Nevertheless, the health crisis in Germany pointing to a significant upsurge in the economic crisis intimated an unimportant impression on the FTSE 100 index. The stock markets of the UK recorded that, in the short-run, an upsurge in the health crisis imperatively damages the stock returns of the LSE index, but in the long run, this influence was left to reverse. Therefore, this research authenticated that the health crisis begun with COVID-19 has devised another global financial crisis, and almost every nation is fighting with these crises today. Moreover, the study disclosed that economic uncertainty generated by COVID-19 is highest in the German stock markets, while the S&P 500 index is on the second-ranking, and Italian stock markets are on the third-ranking. The study concluded that the health crisis and economic crisis ominously affected the stock markets of the globe. Consequently, a significant amount should be allocated in the budget to explore and prevent these pandemics in the future. Further, a complete lockdown strategy does not prove to be an excellent remedy as it harms the financial markets, so other strategies should be developed, i.e., smart/partial lockdown. These suggestions are essential for policymakers, Government officials, researchers, and the general public.
Data Availability Statement
Publicly available datasets were analyzed in this study. This data can be found here: https://www.ecdc.europa.eu/en.
Author Contributions
KS: conceptualization, analysis, and methodology. LX: supervision. MI: introduction. MA: results and discussion, and conclusion. KR: revising work, proofreading, and visualization. All authors contributed to the article and approved the submitted version.
Funding
This investigation was supported by the National Natural Science Foundation of China, No. 71673043.
Conflict of Interest
The authors declare that the research was conducted in the absence of any commercial or financial relationships that could be construed as a potential conflict of interest.
Footnotes
- ^ The SARS fatality rate was 11% while the fatality rate by novel coronavirus is 4% all around the globe.
References
Breusch, T. S., and Pagan, A. R. (2006). A simple test for heteroscedasticity and random coefficient variation. Econometrica 47, 1287–1294. doi: 10.2307/1911963
Daube, C. H. (2020). The Corona Virus Stock Exchange Crash. Kiel: Leibniz Information Centre for Economics.
Dickey, D., and Fuller, W. (1979). Distribution of the estimators for autoregressive time series with a unit root. J. Am. Stat. Assoc. 74, 427–431. doi: 10.1080/01621459.1979.10482531
EIA (2020). U.S. Energy Information Administration (EIA). Available online at: https://www.eia.gov/ (accessed April 20, 2020).
Fernandes, N. (2020). Economic Effects of Coronavirus Outbreak (COVID-19) on the World Economy. Pamplona: University of Navarra.
Financial Times (2020). Coronavirus: US Death Toll Passes 16,000 Level | Financial Times. Available online at: https://www.ft.com/content/55a136c0-05f1-39f4-b946-9e099dd05256 (accessed April 13, 2020).
Huang, Y., Lin, C., Wang, P., and Xu, Z. (2020). Saving China from the Coronavirus and Economic Meltdown: Experiences and Lessons. London: SSRN.
Pesaran, M. H., Shin, Y., and Smith, R. J. (2001). Bounds testing approaches to the analysis of level relationships. J. Appl. Econ. 16, 289–326. doi: 10.1002/jae.616
Phillips, P. C. B., and Perron, P. (1988). Testing for a unit root in time series regression. Biometrika 75, 335–346. doi: 10.1093/biomet/75.2.335
Ploberger, W., and Kramer, W. (2006). The cusum test with ols residuals. Econometrica 60, 271–285. doi: 10.2307/2951597
Sharif, A., Aloui, C., and Yarovaya, L. (2020). COVID-19 pandemic, oil prices, stock market and policy uncertainty nexus in the US economy: fresh evidence from the wavelet-based approach. Int. Rev. Finan. Anal. 70:101496. doi: 10.1016/j.irfa.2020.101496
Shehzad, K., and Sohail, N. (2018). An evidence of calendar effects on the stock market of Pakistan?: a case study of (KSE-100 index). NFC IEFR J. Eng. Sci. Res. 6, 46–56. doi: 10.24081/nijesr.2018.1.0006
Shin, Y., Yu, B., and Greenwood-Nimmo, M. (2014). “Modelling asymmetric cointegration and dynamic multipliers in a non-linear ARDL framework,” in Festschrift in Honor of Peter Schmidt, eds R. Sickles and W. C. Horrace (New York, NY: Springer), 281–314. doi: 10.1007/978-1-4899-8008-3_9
Syllignakis, M. N., and Kouretas, G. P. (2011). Dynamic correlation analysis of financial contagion: evidence from the Central and Eastern European markets. Int. Rev. Econ. Finance. 20, 717–732. doi: 10.1016/j.iref.2011.01.006
World Economic Forum (2020). The Long Economic Reach of COVID-19 | World Economic Forum. Available online at: https://www.weforum.org/agenda/2020/02/economic-toll-coronavirus-manufacturing-tourism-china-asia/ (accessed April 11, 2020).
Keywords: COVID-19, financial stability, financial markets psychology, sustainable development, global development, health crisis, economic crisis
Citation: Shehzad K, Xiaoxing L, Arif M, Rehman KU and Ilyas M (2020) Investigating the Psychology of Financial Markets During COVID-19 Era: A Case Study of the US and European Markets. Front. Psychol. 11:1924. doi: 10.3389/fpsyg.2020.01924
Received: 26 May 2020; Accepted: 13 July 2020;
Published: 03 September 2020.
Edited by:
Ilhan Ozturk, Çağ University, TurkeyCopyright © 2020 Shehzad, Xiaoxing, Arif, Rehman and Ilyas. This is an open-access article distributed under the terms of the Creative Commons Attribution License (CC BY). The use, distribution or reproduction in other forums is permitted, provided the original author(s) and the copyright owner(s) are credited and that the original publication in this journal is cited, in accordance with accepted academic practice. No use, distribution or reproduction is permitted which does not comply with these terms.
*Correspondence: Khurram Shehzad, khurramscholar64@hotmail.com