 María Auxiliadora Robles-Bello1
 David Sánchez-Teruel2Óscar Gavin Chocano1Alfonso González Luque3José Antonio Camacho Conde4*
- 1Faculty of Humanities and Education Sciences, University of Jaén, Jaén, Spain
- 2Faculty of Psychology, University of Granada, Granada, Spain
- 3Faculty of Sciences, National University of Distance Education (UNED), Madrid, Spain
- 4Faculty of Education, Economy and Technology of Ceuta, University of Granada, Ceuta, Spain
It is necessary to understand the measurement of academic satisfaction (AS) in a variety of cross-cultural contexts. The first aim was to evaluate the psychometric properties of AS scale, to explore its structural validity, to assess its differential item function, including gender and age invariance in university students. Study 2 aimed to assess whether AS improved after the application of a teaching instructional approach based on cooperative learning (CL), while a cross-sectional study was performed in several stages. Descriptive, confirmatory, and scale reliability analyses were carried out with indices for goodness-of-fit, such that a new scale was obtained with a single-factor structure. A reduction to 6-items in this sample exhibited better psychometric properties. Configural invariance by gender and age indicated that men and women had a similar understanding of the new scale. Given significant differences between groups, the CL group scored higher in AS.
Introduction
Academic satisfaction (AS) is a dynamic process, influenced by the characteristics of the educational institution and by how students perceive their learning environment (Ramos et al., 2015). It has been studied in the university setting with a variety of conceptual approaches, based on quality of service and/or psychological wellbeing (Shin and Jung, 2014). From this perspective, satisfaction refers to students’ comparison of their aspirations with their achievements (Medrano et al., 2014). These assessments may be made considering our general lives and specific domains, including the academic experience (Osorio-Alvarez and Parra, 2015). According to Medrano et al. (2014), satisfaction in academia is seen as the enjoyment students have with experiences linked to their role. For Insunza et al. (2015), it also refers to students’ favorable subjective assessments of their education-related experiences and results. As such, AS can be considered a cognitive–affective variable, involving students’ excitement with the learning process and evaluating their experiences. It is a key influence in the adaptation to the academic environment (Righi et al., 2006), social integration (Medrano and Pérez, 2010), consistency in academic performance (Merino-Soto et al., 2016), and psychological wellbeing (Abarca et al., 2013); this construct is linked to positive mental health (Lukat et al., 2016), which contributes to reducing the negative effects with unpleasant experiences while maintaining an adaptive response to stressful situations (Iasiello et al., 2019). At present, there are few evaluation instruments for AS, although different studies corroborate the positive relationship with life satisfaction through the Satisfaction with Life Scale (SWLS) Instrument (Diener et al., 1985). Based on this approach, linked to wellbeing and positive feelings (Muñoz-Campos et al., 2018), it is fundamental to an individual’s aspirations, where variables such as self-efficacy (SE), a strategic resource that favors study and learning, and emotional affects attributed to success or failure, which have a direct impact on academic activity (Fiori and Vesely-Maillefer, 2018). Life satisfaction for students is geared to assess why those with the same skills present different behaviors and results (Feldman and Kubota, 2015).
The AS of university students has become vital for institutions in recent decades, which is conditioned by how students are a guaranteed factor in educational organizations (Huebner and Gilman, 2006; Lodi et al., 2017). Some studies find that the result is the sum of the student’s academic, emotional, and social experiences, with perceptions and expectations evolving (Méndez-Vera and Gálvez-Nieto, 2018). AS is a multidimensional and complex phenomenon, which acquires value along with other variables, such as emotional intelligence (EI) (Ferrero et al., 2021). The AS Scale from Lent et al. (2005) uses 7 items with a 5-point Likert scale; they form a single factor that measure perceptions of enjoyment as well as the role of being a student (Medrano et al., 2014). Various applications of the scale have produced scores with a high level of reliability, with Cronbach’s alpha coefficients falling between 0.86 and 0.94 (Lent et al., 2005, 2007). Application of the scale in Argentina (Medrano et al., 2014) and Chile (Vergara-Morales et al., 2018) demonstrate adequate construct validity, yet in both cases there were large numbers of female students, as in the original version. The two Spanish versions of the AS scale (Medrano et al., 2014; Vergara-Morales et al., 2018) adapted the original AS scale, modifying items 1, 2, 5, and 6 to contextualize the measurement with a university degree. The Likert scale was modified in the original, offering 7 response options from only 1 (completely disagree) to 7 (completely agree). All adaptations of the scale found methodological issues depending on the country of application. This implies it could be useful in translating and validating the scale for the Spanish university population with sex and age invariance: this also ensures that the evaluation instrument is measuring the same construct, regardless of sex or age (Cheung and Rensvold, 2002).
The AS scale correlates with SE, academic persistence, and life satisfaction (Lent et al., 2007: SE is a domain specific, social-cognitive variable, which can predict overall satisfaction (Gallagher et al., 2020): It is future-oriented with goal-directed behavior. Moreover, it involves how one can perform specific behaviors to achieve a desired outcome. SE emphasizes personal agency, or one’s influence over events. While it includes a perceived capacity to perform the actions to achieve a certain goal, it does not emphasize intention or determination, as would be the case with agency thinking, or the ability to produce the steps to accomplish a goal, the case with pathway thinking (Rand, 2017): it is also related to EI (Morales-Rodríguez and Pérez-Mármol, 2019).
On the other hand, cooperative learning (CL) is understood as an instructional approach based on teamwork and builds knowledge, SE, and the acquisition of competence and social skills; it is also associated with the development of students’ cognitive, metacognitive, and motivational skills, which promote self-regulated learning (Fernandez-Rio et al., 2017). Early studies on CL emerged in the 1960s (Slavin, 2011), which are now being studied while focusing on work techniques, academic performance, and its link with affective and social variables; this acts as a positive methodology for students. As a learning technique, CL is probably the best-documented an instructional approach, the one with the most research (Trianes, 2014). CL’s benefits in higher education have been confirmed in numerous studies (García et al., 2001; Torrego, 2019) and are characterized by its link to SE, increased social skills, supporting others, and autonomous group interaction. CL enhances the development of strategies that encourage teachers to create dynamic classes and promote university and high-school participation (Fernández-Espínola et al., 2020). We must understand if modifying university courses toward this instructional approach will improve students’ AS—as they have a special interest in cooperative work, using a team value, one of the relevant motivational variables in group SE (León del Barco et al., 2017), as well as effective when learning objectives are intended for students’ social development.
This research consists of two studies. The aim of Study 1 is to evaluate the psychometric properties of AS, with differential item functioning and invariance of the measure by sex or age. The aim of Study 2 is to determine whether AS improves following a teaching methodology based on CL. This effort tests whether SE and EI predict AS, based on CL in students.
Method study 1
Participants
The Study 1 sample consisted of 284 participants (see Table 1), in which 146–51.41% were female and 138–48.59% were male, as well as 18–23-years-old (M = 20.8, SD = 1.36).
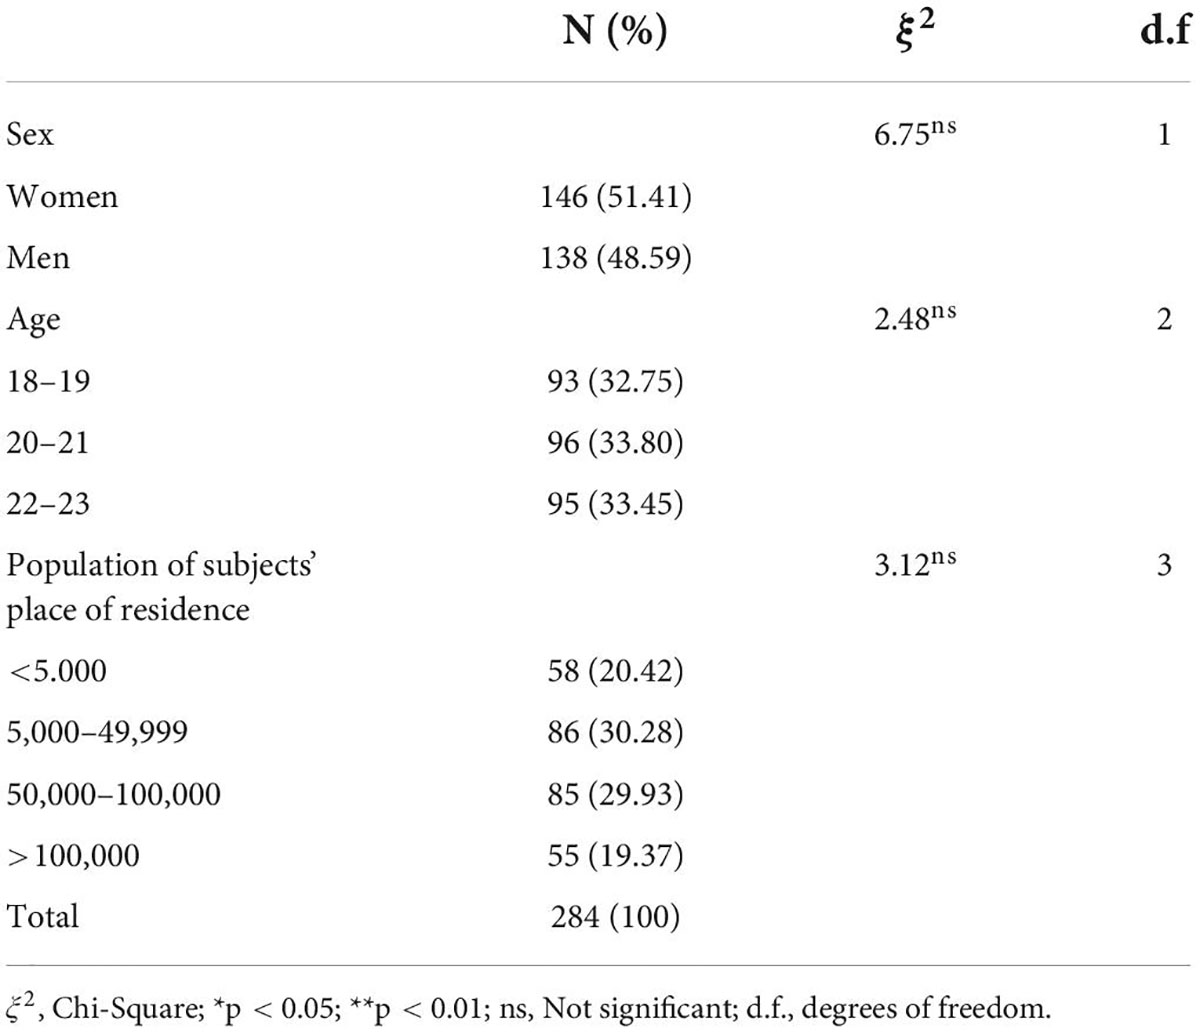
Table 1. Sociodemographic data for the Study 1 sample.
Instruments
Sociodemographic data sheet
We prepared a fact sheet for this study to encapsulate information on sex, age, and location.
AS from Lent et al. (2005). This is a seven-item scale that evaluates the level of AS through a Likert-type response from 1 (strongly disagree) to 5 (strongly agree), where the higher the score, the higher the AS. It demonstrates a unidimensional structure and a high level of internal consistency via alpha (0.90) in university students (Lent et al., 2005).
Positive Mental Health (PMH) from Lukat et al. (2016) measures positive psychosocial wellbeing, where the higher the score, the more positive the mental health. This unidimensional scale is made up of 9 items with a 4-point Likert-type response (e.g., “I enjoy my life:” 0 = I disagree up to 3 = I agree). It demonstrates high levels of reliability in the original version for university students and the general population of Germany (alpha = 0.92, alpha = 0.93). In this study, we found an alpha of 0.96.
Procedure
First, we requested approval of the study by the Research Ethics Committee of the University of Jaen, and sought permission to adapt the original author’s scale for AS. We asked two outside bilingual translators (English-Spanish) to produce a Spanish translation of AS. This translation was subsequently revised and translated into English by another bilingual student with a Ph.D in Psychology, who had no connection to this study, but who made appropriate adjustments in the terminology: there had been disagreement with previous translators, and then the final version of the instrument was produced in Spanish (AS-S). We followed all guidelines for adaptation of evaluation instruments in psychology (Muñiz et al., 2013; Muñiz and Fonseca-Pedrero, 2019).
The instrument maintained a Likert-type scale ranging from 1 (strongly disagree) to 5 (strongly agree).
Ethical considerations
Participants completed the informed consent and questionnaires in Spanish. The Ethics Committee of the University of Jaen approved the study (Code: MAR.20/15.PRY), following guidelines of the Declaration of Helsinki (World Medical Association, 2013). Participation was voluntary and subjects could withdraw at any time. All data were treated per the UE Regulation 2016/679 of the European Parliament and the Council of 27 April 2016, for both Personal Data and The Organic Law 3/2018 of 5 December, related to a guarantee of digital rights.
Data analysis
Missing data accounted for less than 1%, and the Hot-Deck Multiple-Inputation method for network inference was applied (Lorenzo-Seva and Van-Ginkel, 2016). We first produced a descriptive analysis of the items and performed a confirmatory factor analysis (CFA) using SPSS 23 AMOS (IBM Corporation, 2013) to confirm the structure of AS. The CFA was generalized least squares (GLS) due to multivariate non-normality and sample size (Olsson et al., 2000; Byrne, 2010; Ferrando et al., 2022). The fit indices were the χ2/df ratio, the root mean square error of approximation (RMSEA), the Comparative Fit Index (CFI), and the Tucker-Lewis Index (TLI). The goodness-of-fit of the model was considered satisfactory when the TLI and CFI ≥ 0.95, and the RMSEA approached 0.06 (Kline, 2016). We also analyzed whether there were differences in the invariance of the measure by sex or age, using multi-group CFA with AMOS. We specified two nested models for sex and three for age. A configural invariance analysis (reference model) was able to check whether the groups (gender and age) associated the same subsets of items with the construct. Metric invariance was analyzed to check if the factor loadings between each item and the factor itself were the same in all groups. Scalar invariance could assess if the differences between groups, indicated by the items, were the same for all items (Cheung and Rensvold, 2002; Van de Schoot et al., 2012). We used the Satorra-Bentler scale (χ2) and its p-values, along with RMSEA with 90% CI and CFI for invariance of the measure as an incremental adjustment index (Hooper et al., 2008). There is invariance of the measure when p > 0.05 for Δχ2 (considering sample size bias); RMSEA ≤ 0.05 and the ΔCFI value of the models compared is < 0.01 (Byrne, 2016). We used descriptive analyses of the scale, with convergent validity measured by calculating the Pearson correlation coefficient with the PMH scale, and reliability measured by means of internal consistency (Cronbach’s alpha and McDonald’s omega coefficients). Statistical significance required all tests to be at a minimum of p < 0.05.
Results study 1
Table 1 presents the sociodemographic data of this sample.
The mean scores of the AS items were higher than the theoretical midpoint of the scale (i.e., 2). The lowest mean was in item 1 (M = 3.20; SD = 0.92). The correlation between item and total was low and negative for item 1 (–0.26). Reliability of internal consistency, estimated by the ordinal alpha, was 0.70 for the total sample; this improved with the removal of element 1 (Table 2); we maintained it in the confirmatory factor analysis (Table 3).

Table 2. Descriptive statistics, skewness and kurtosis indices, and item analysis for AS.
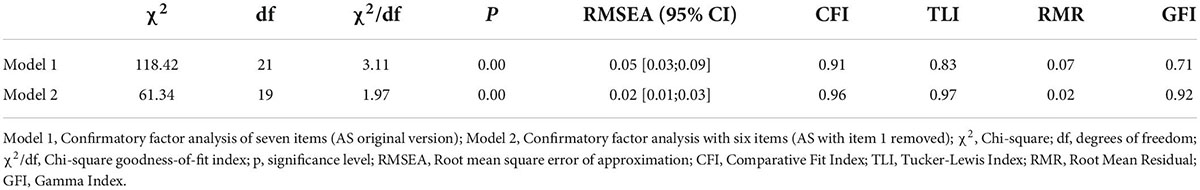
Table 3. Goodness-of-fit indices for AS (original version and version with item 1 removed) in Spanish university students.
Confirmatory factor analysis
The results from the univariate and multivariate normality analyses showed there was neither univariate nor multivariate normality in the item distribution in this sample (Mardia = 731.32; Mardia, 1970). Figure 1 (AS original version) shows a negative factorial load for item 1 with other items presenting factorial loads below 0.50. However, Figure 2 (eliminating item 1) shows high factorial loads (> 0.50) for most items in the AS path diagram and values of the normalized loads (coefficients from β) ranging from a minimum of 0.67 for item 2, to a maximum of 0.96 for item 6. These results indicate acceptability and goodness of fit of a six-item Model 2, as data confirm a unidimensional structure with 6 elements in a sample of university Spanish students.
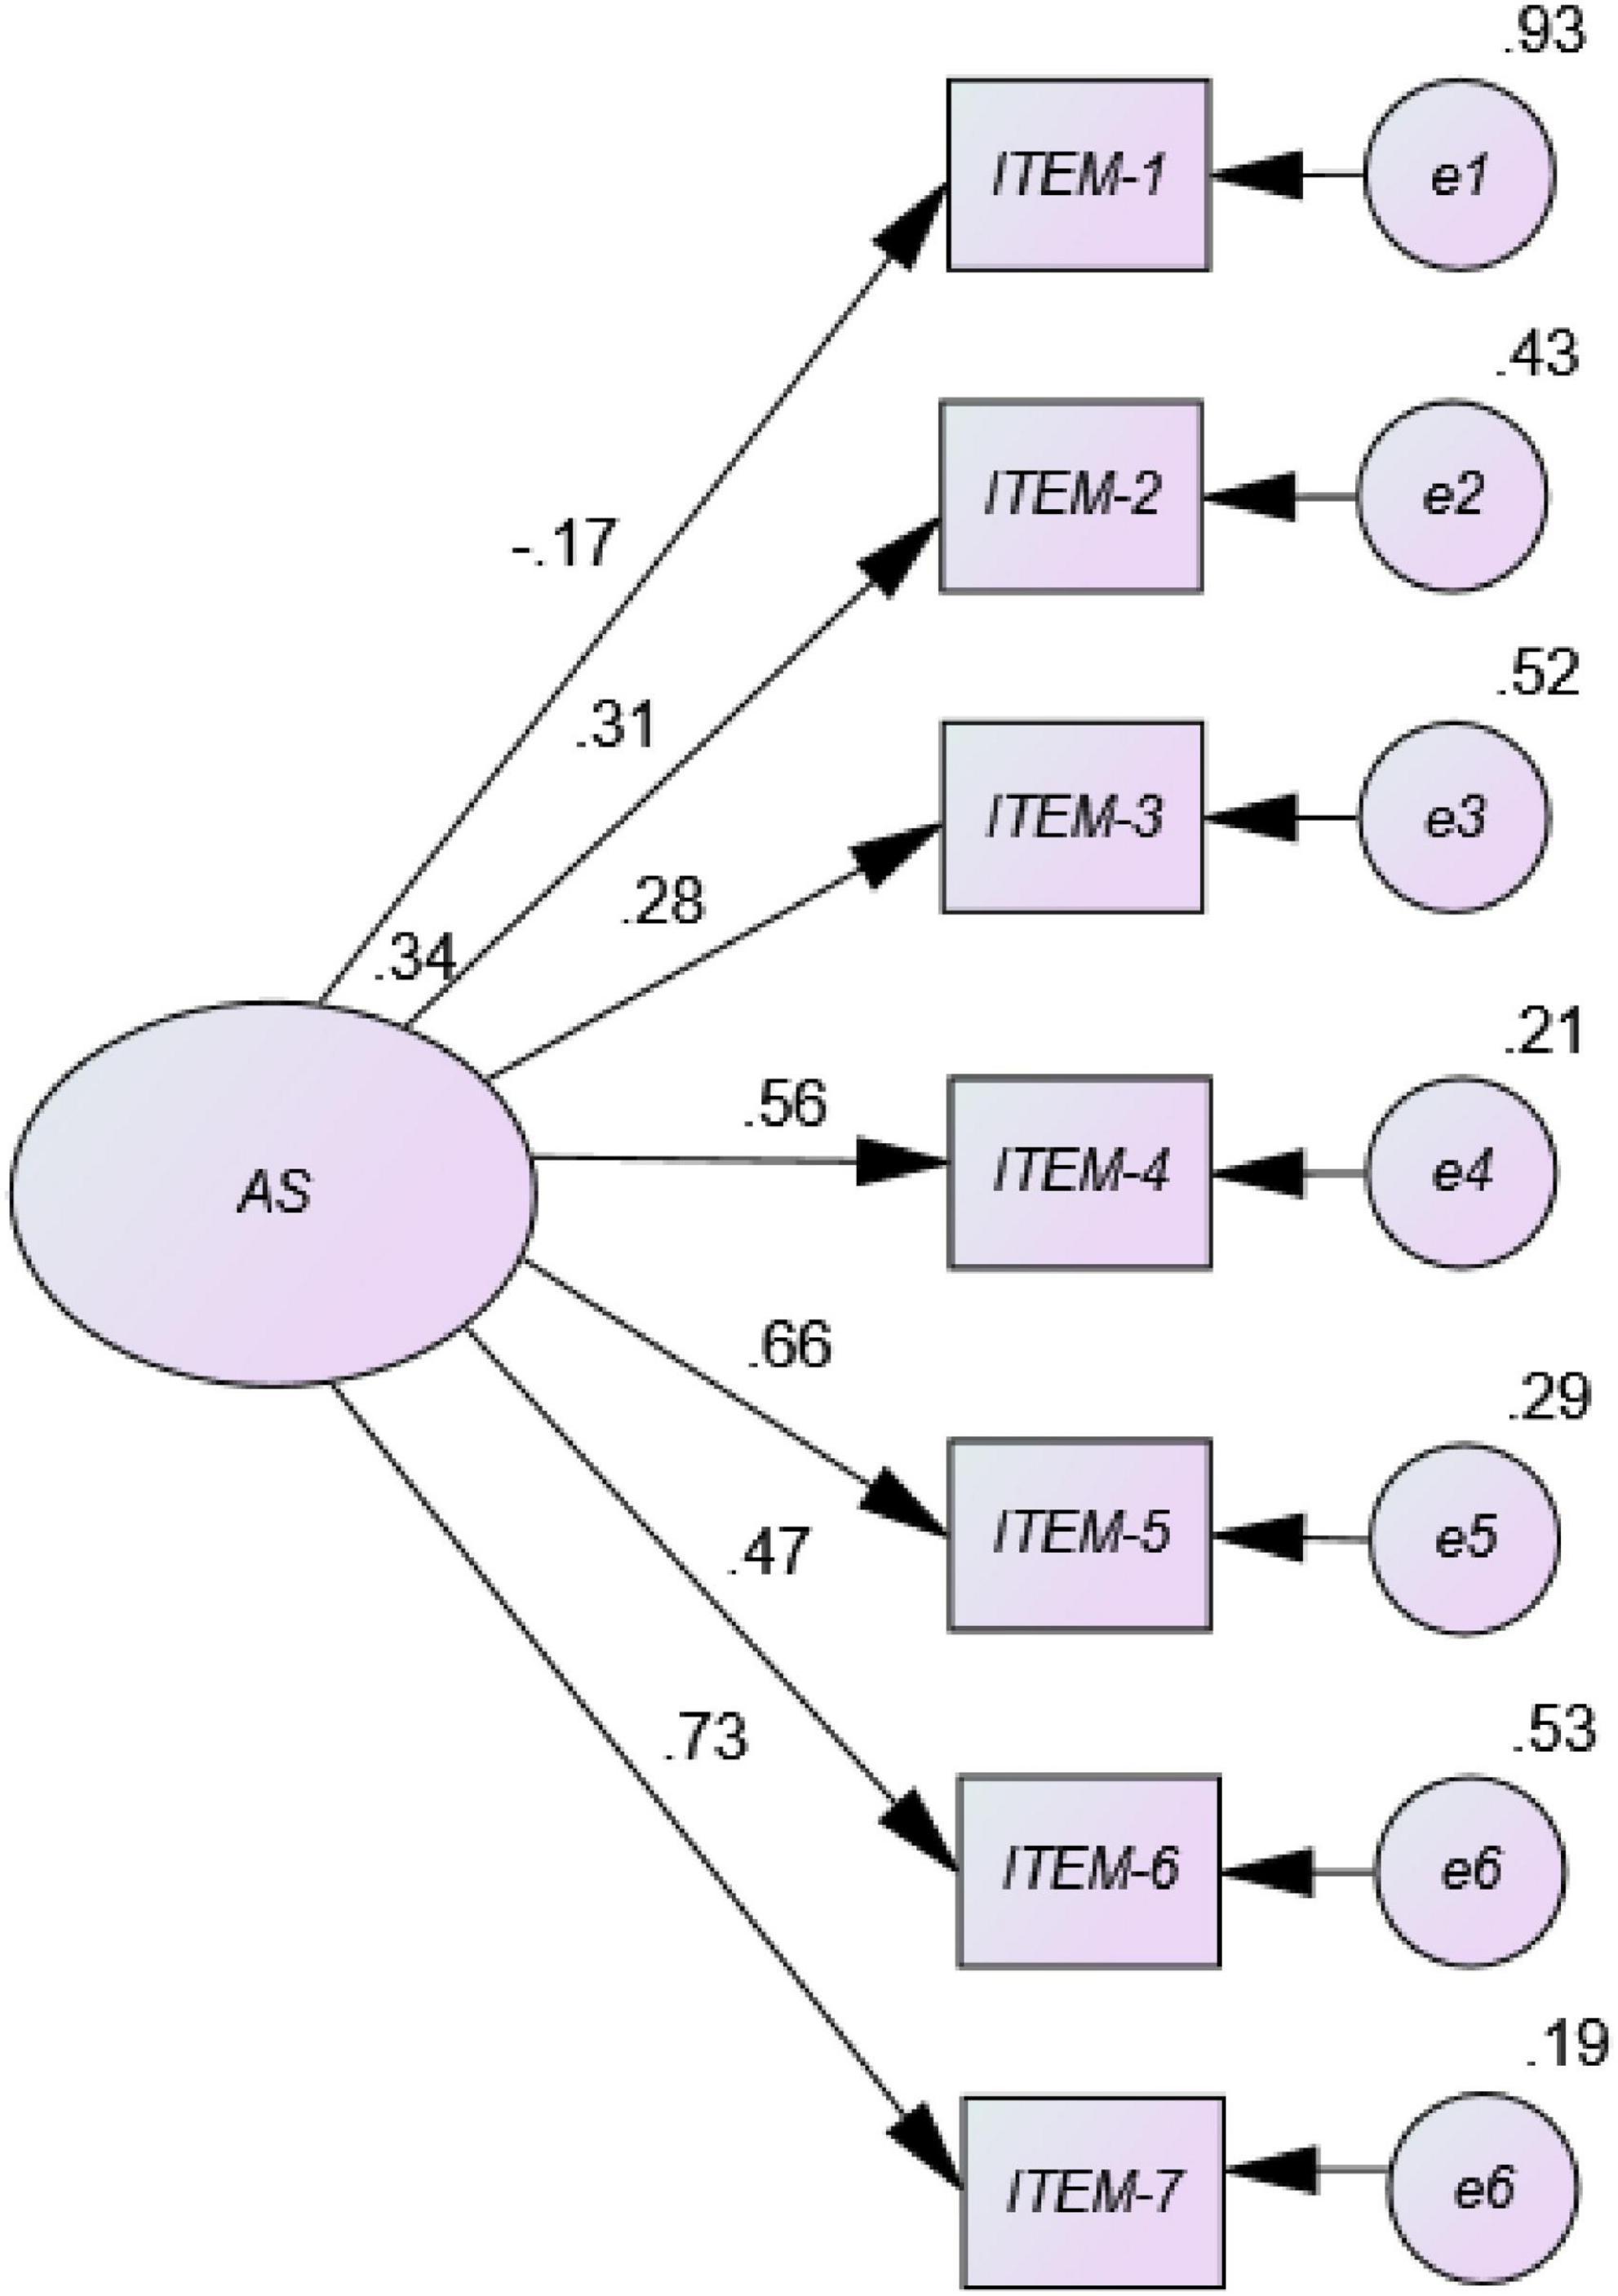
Figure 1. Path diagram of the unidimensional model corresponding to AS in Spanish university students (Model 1 = Original version).
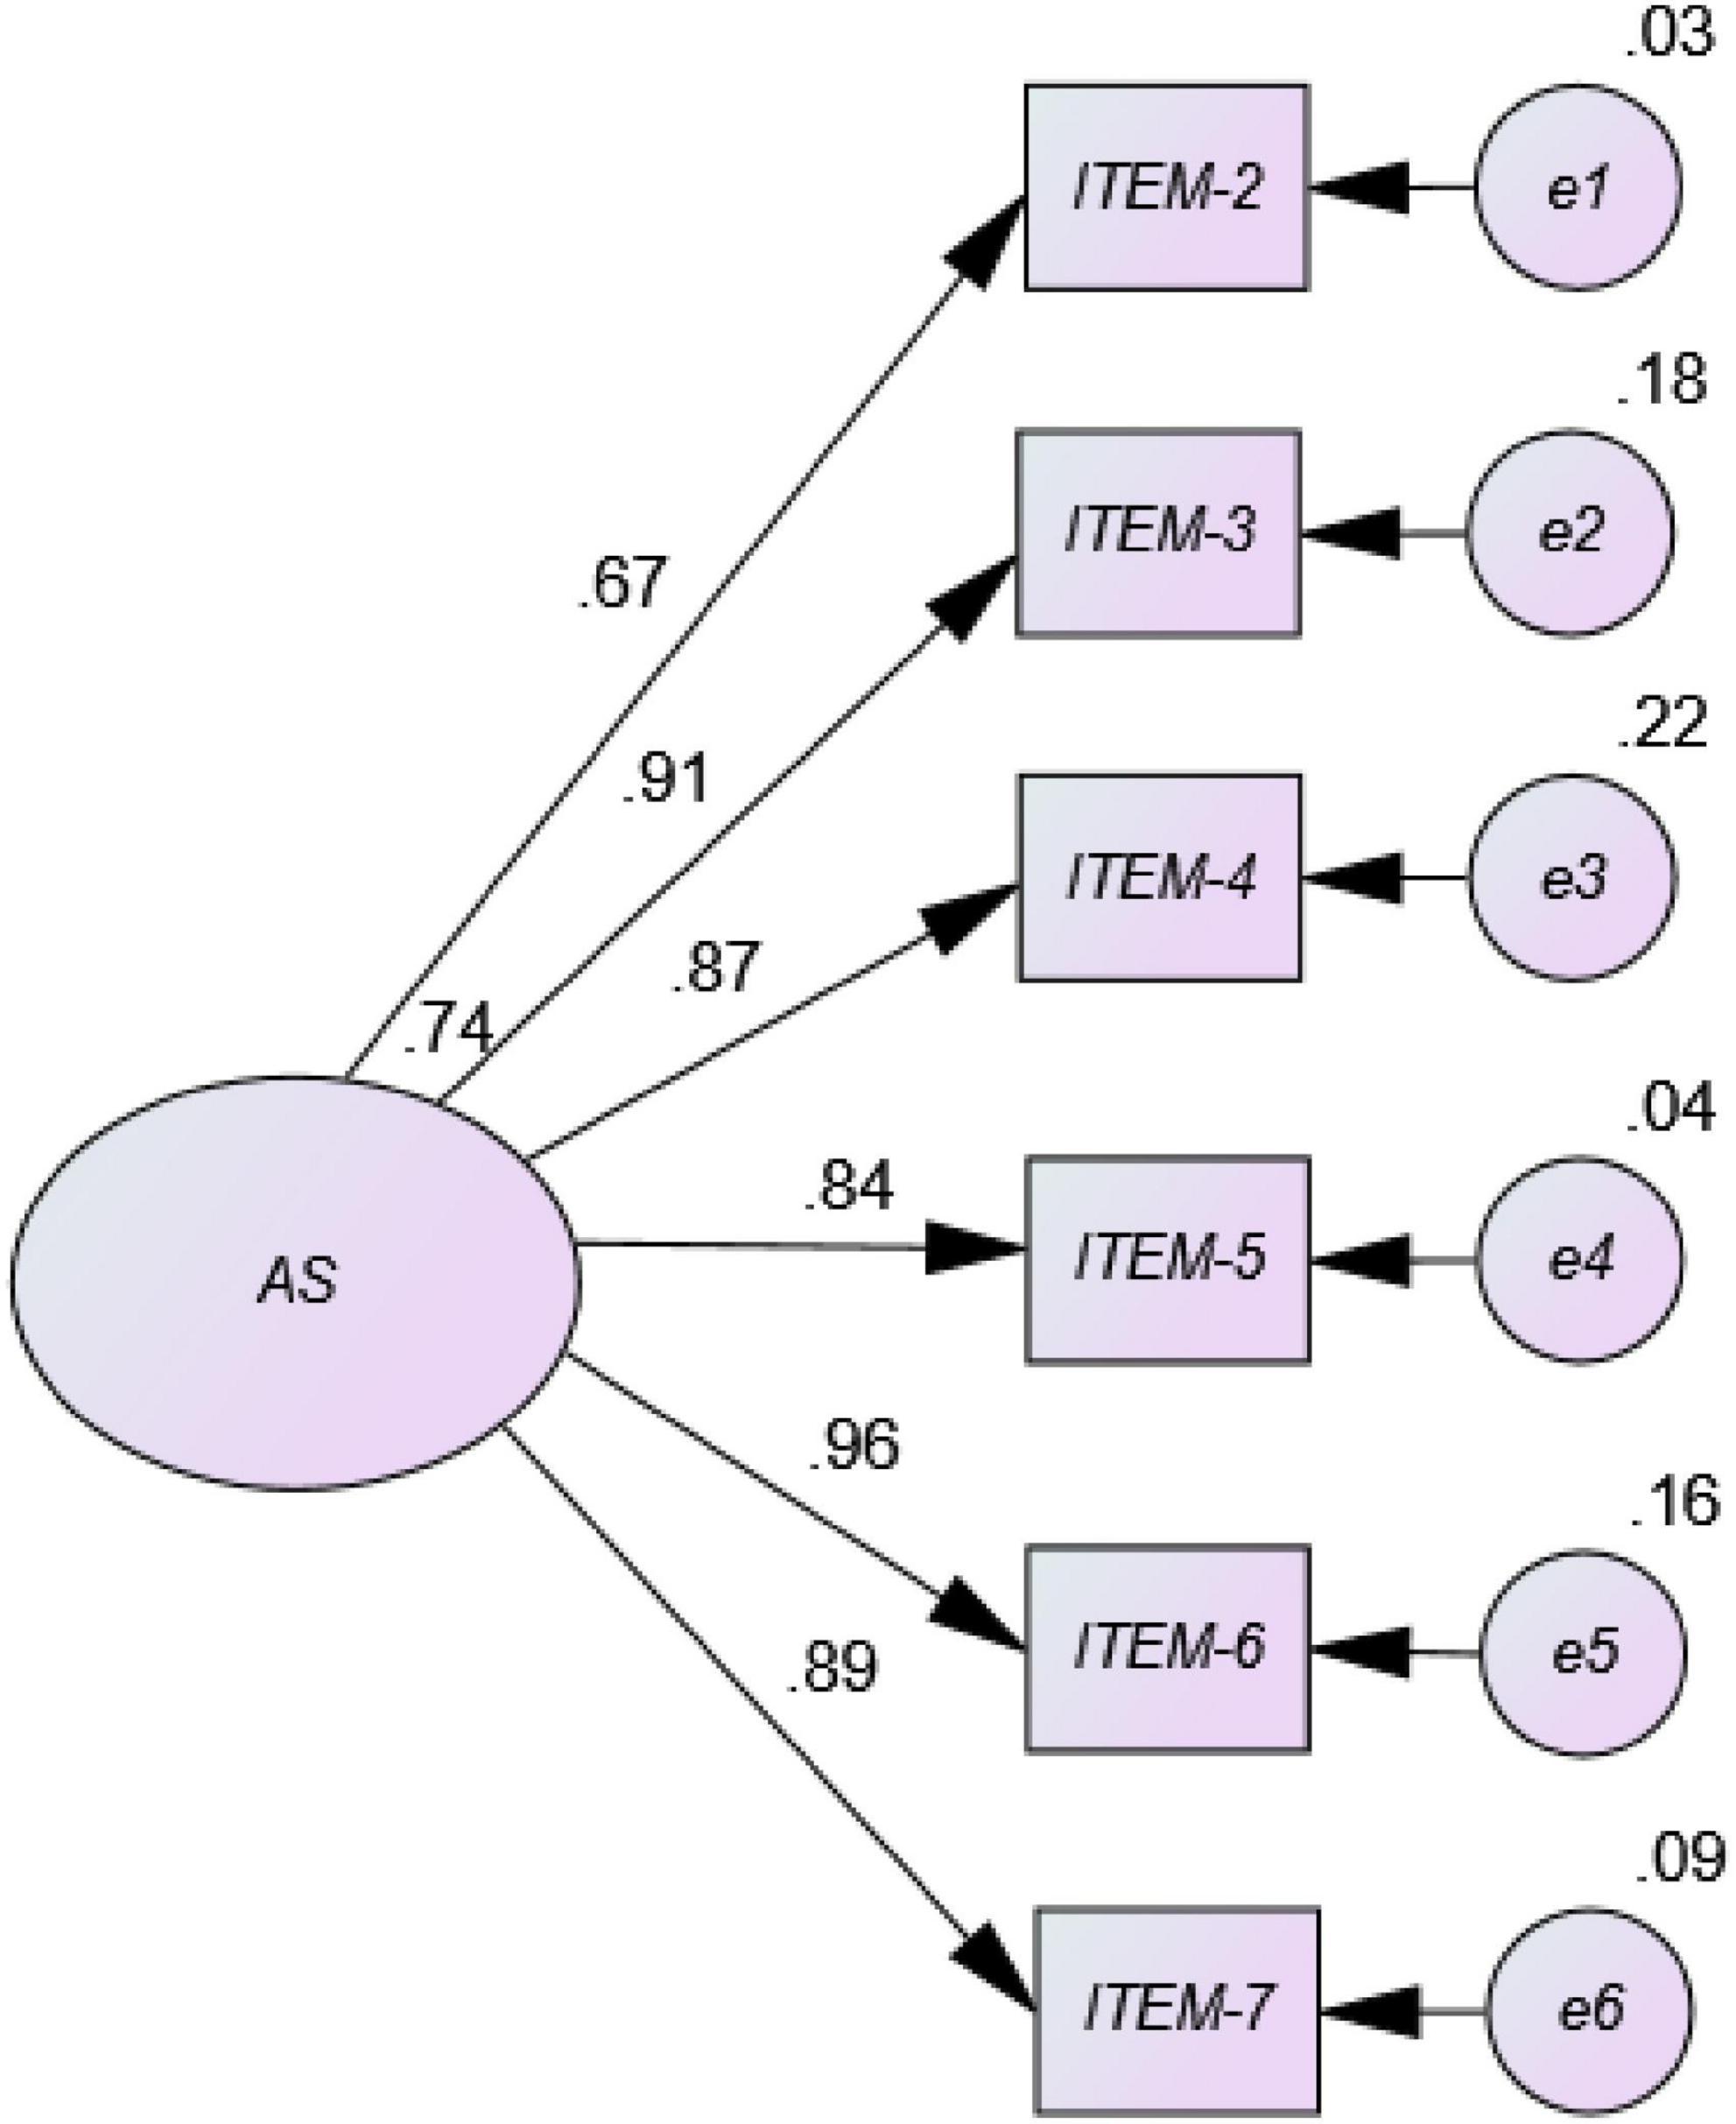
Figure 2. Path diagram of the unidimensional model corresponding to AS in Spanish university students (Model 2 = eliminating item 1).
Measurement invariance
Table 4 yields results of measurement invariance, showing that the CFA models specified for men and women and each age group demonstrated a good fit, indicating that a multiple group CFA was appropriate. The metric invariance and scalar invariance by sex showed that men and women understood the AS-Spanish items (AS-S) (Appendix Table A1) in the same way, demonstrating good levels of fit [Δχ2(1) = 1.11; p > 0.05; Δχ2(1) = 1.08; p > 0.05]. The comparison of groups by age showed there was no variation in AS-S according to age brackets (Δχ2(2) = 1.16; p > 0.05; Δχ2(2) = 1.22; p > 0.05).
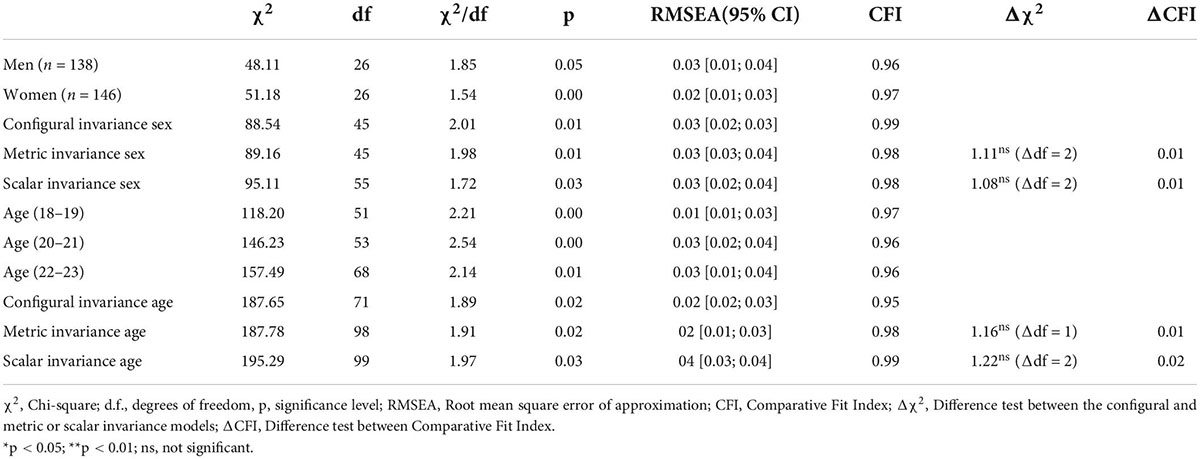
Table 4. Indices of fit for invariance tests by sex and age.
Reliability and convergent validity
The results for internal consistency (Cronbach’s alpha and the Omega coefficient) were adequate, with a strong positive correlation between AS-S and positive mental health, confirming its convergent validity (Table 5).
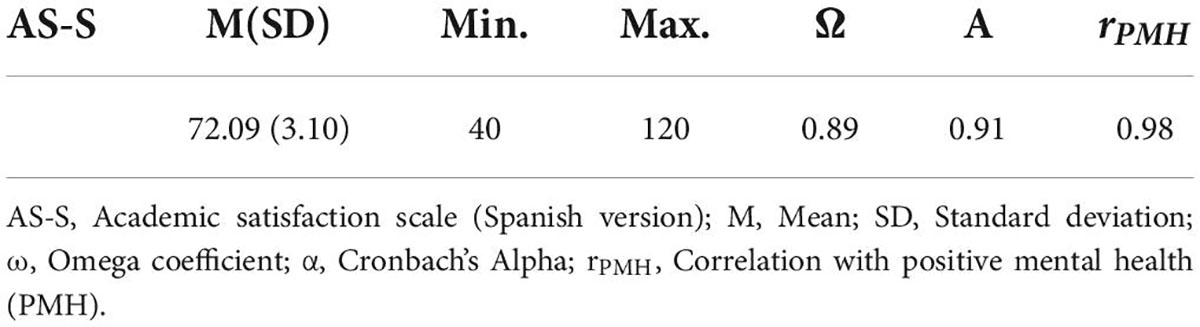
Table 5. Descriptive statistics, reliability, and convergent validity.
Method study 2
Participants
Study 2 consisted of 261 undergraduate students for 2 years of the psychology degree program. Almost three quarters (186; 71.26%) were female, and 75 (28.74%) were male. We randomly divided the sample into a control group (CG) and an experimental group (EG) (Mondo et al., 2021). Table 6 shows its sociodemographic data.
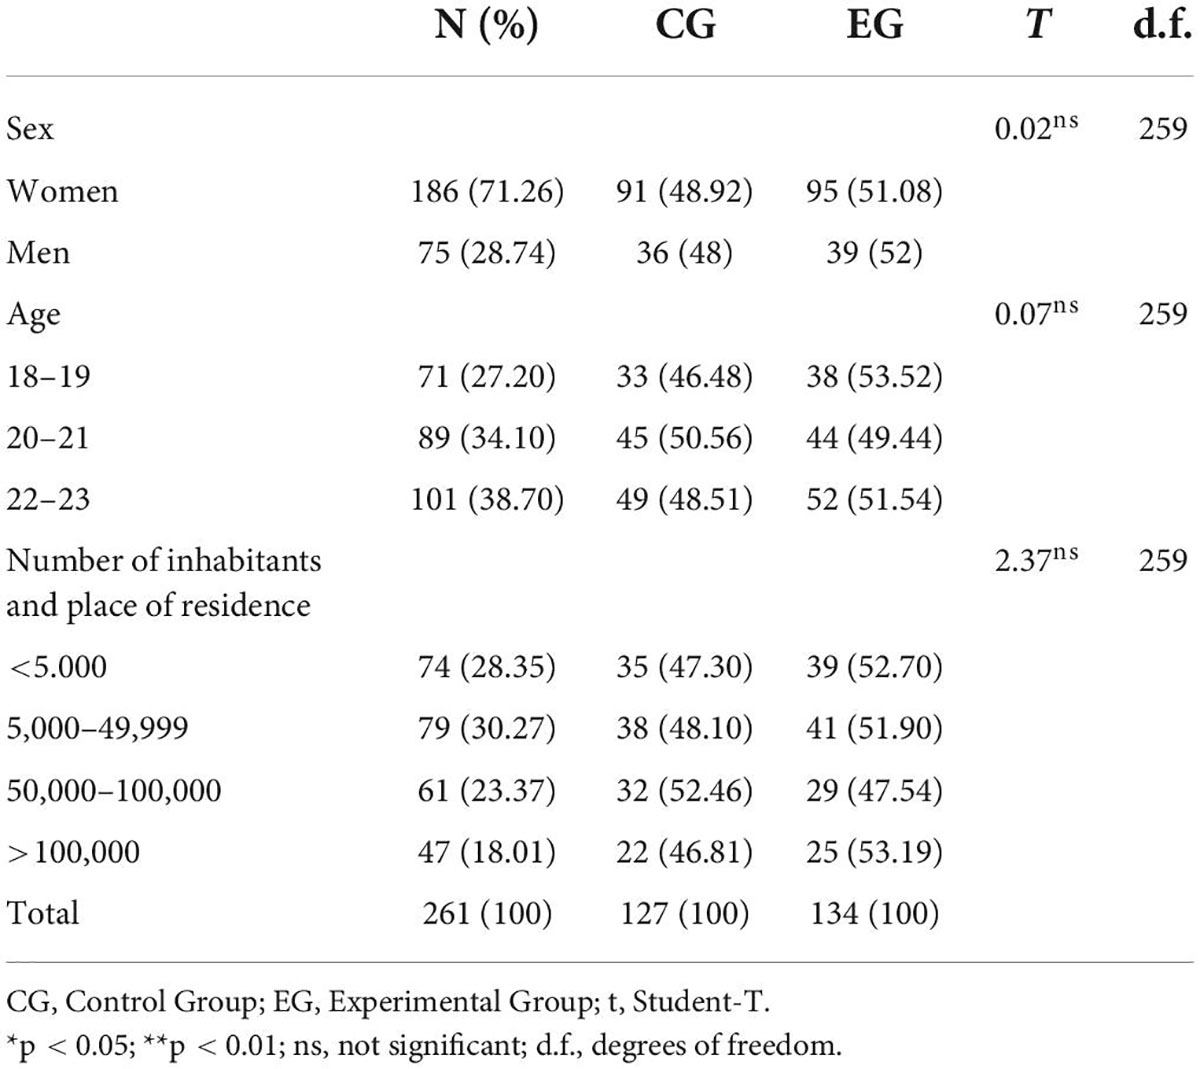
Table 6. Sociodemographic data for the sample in Study 2.
Instruments
Academic satisfaction
The original scale is developed by Lent et al. (2005). This was adapted to Spanish in Study 1. It is a scale with six elements that assess the level of AS through a Likert-type response from 1 (strongly disagree) to 5 (strongly agree), where the higher the score, the higher the AS. It demonstrated a unidimensional structure, high levels of internal consistency (ω = 0.89; α = 0.91), and a strong correlation with PMH (r = 0.98) in Spanish university students.
General self-efficacy scale-GSE
The self-efficacy scale was created by Schwarzer and Jerusalem (1995), then Bäßler and Schwarzer (1996) translated it into Spanish in 1996, but the psychometric properties in the general Spanish population are from Sanjuán et al. (2000). It measures general SE, the belief that one’s actions create successful outcomes, and is made up of 10 items with a scale from 1 (not at all true) to 4 (completely true). There are no cut-off points, scores vary from 10 to 40 points, and the higher the score, the greater the overall perceived SE. Internal consistency of the Spanish version was 0.84—while in this study, Cronbach’s alpha was 0.93.
Wong-law emotional intelligence scale
The original scale is developed by Wong and Law (2002). We used the Spanish version from Extremera et al. (2019) for university students. This scale consists of 16 items that measure four aspects of EI: assessment of one’s own emotions (EAE), assessment of other people’s emotions (OEA), use of emotion (UOE), and regulation of emotion (ROE). The instrument uses a seven-point Likert-type response, ranging from 1 (completely disagree) to 7 (completely agree). The reliability of the Spanish version via Cronbach’s alpha was excellent for the total scale (α = 0.91) with subscales demonstrating satisfactory internal consistency (Cronbach’s α ranged from 0.79 to 0.84). In this study, the reliability through Cronbach’s alpha was 0.90.
Procedure
We adapted a test for AS for Spanish university students (Study 1) (Appendix Table A1). Then we used a conventional teaching methodology at the beginning of practical classes for students in psychology degree subjects for both experimental and CGs. The methodology wanted the teacher to explain the practical activity, so students in the subsequent session could ask questions which had been resolved. Halfway through the practical sessions, the teachers changed to a CL-based instructional approach in the EG, while the CG continued unchanged. We applied evaluation tests at the beginning and end of the process.
Ethical considerations
This study follows the guidelines of the Declaration of Helsinki (World Medical Association, 2013) and the Ethics Committee of the University of Jaen approved the study (Code: MAR.20/15.PRY).
Data analysis
We began by analyzing differences in all the psychosocial variables and the result variable (AS) between the two time points using the parametric Student t-test. We also calculated indices of statistical power and effect size; this refers to the magnitude of the differences found in the study, and statistical power refers to the level of validity of the findings (Cohen, 1988; Grissom and Kim, 2012). Following that, we performed a hierarchical regression analysis to determine which sociodemographic and psychosocial variables could predict higher levels of AS in university students in the EG. The level of statistical significance for all tests was a minimum of p < 0.05. Statistical analyses used SPSS version 22.0 (IBM Corporation, 2013), and the statistical power and effect sizes were determined using G*Power 3.1.9.7 (Faul et al., 2009). According to Cohen (1988), when d = 0.2, the effect size is small, when it is 0.5, the effect size is moderate, and when it is 0.8, the effect size is large.
Results study 2
Results of the comparison (t) between time points for both groups (control and experimental) (Table 7) showed that there were notable differences in mean scores for AS in the EG but not in the CG. This was particularly notable in the scale total [t(259) = 9.12; p < 0.01; (8.27–10.02)]. We also saw differences in SE [t(259) = 8.61; p < 0.01; (7.11–9.26)], but not in EI [t(259) = 4.32; p > 0.05; (3.75–4.89)] post-training. The effect size was large, while the statistical power was high for AS (d = 0.92; Pow = 97) and other variables.
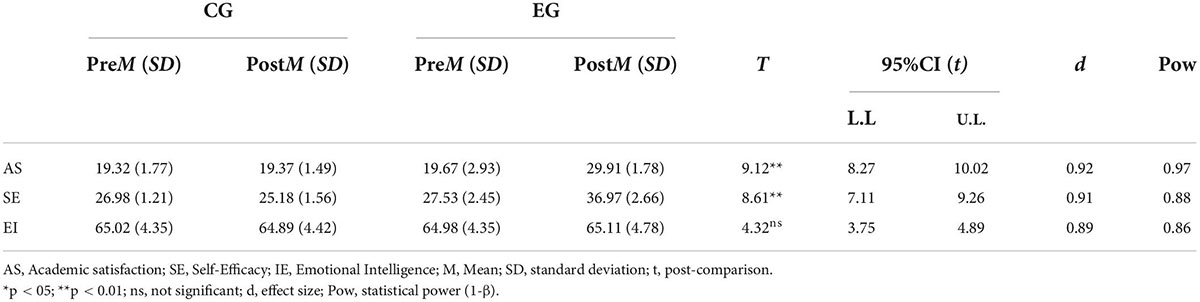
Table 7. Differences in academic satisfaction between two time points for both groups (Study 2).
Initially, the criteria for suitability and goodness of fit of the blocks for each model were partially met. In particular, the independence of errors through the Durbin-Watson test indicated that this assumption of suitability was only met in the outcome variable AS in model three (DWblock1 = 0.04; DWblock2 = 0.05; DWblock3 = 1.95) (Yoo et al., 2014). The assumption of non-multicollinearity was also inadequate for AS in two of the three predictive blocks, as the value was below 5 (Kleinbaum et al., 1988) (Variance Inflation Factor—VIFblock1 = 7.65; VIFblock2 = 5.96; VIFblock3 = 1.95). The hierarchical regression applying to block 3 showed that sociodemographic and psychological variables predicted a higher level of AS in a sub-sample of Spanish university students (Table 8). Block 3 (set of independent variables) was significant and explained 91.7% of resilience [R2adj = 0.917; F(1.261) = 3169.12; p < 0.01] (Table 8). This block indicates variables (sociodemographic and psychological) that predict a high level of AS: Ages 22–23 [β = 9.11; (95%) CI = 8.22–9.98; p < 0.01], with a high level of SE [β = 8.62; (95%) CI = 8.11–8.29; p < 0.01], and high emotional regulation [β = 7.96; (95%) CI = 6.45–8.13; p < 0.01].
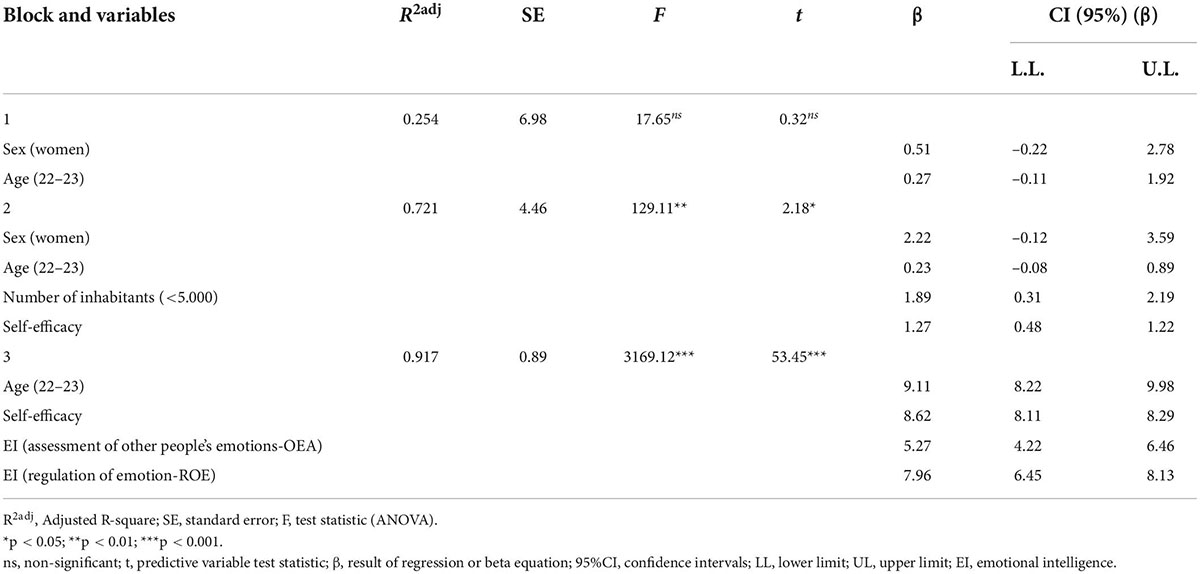
Table 8. Hierarchical prediction models of sociodemographic and psychological variables in Study 2 (EG = 134).
Discussion
The aim of Study 1 was to evaluate the psychometric properties of AS, and differential function of items, with invariance by sex or age in university students.
Despite authors who studied AS, such as Medrano et al. (2014), and relating it to student wellbeing, previous measures were not sought for AS focused on psychological wellbeing: In a university context, it is positively related to quality of learning, diversifying instruments with adequate psychometric properties as a good measure for this variable. Methodological problems may be conditioned by the existence of bias in the responses, as evidenced by different levels of error, that would probably be linked to response error if they had been described in another way.
Results from the EFA support the single-factor structure of the AS scale, although with the removal of item 1. This item measures satisfaction, although in the general realm of psychology, adapting it to a university course after being translated signified that it lost some meaning. There is a difference in specializing in psychology vs. choosing a specific subfield, indicating that the translation by Vergara-Morales et al. (2018) was unsuitable for a university setting (item 1: I am satisfied with the decision to take this subject), as neither of the subjects was optional, but the translation implied they were.
In addition, we determined that the results had good reliability in the Spanish higher education context, with adequate scores for internal consistency and a good relationship with the theoretical construct of AS. We can conclude that the single-factor solution is consistent compared to the original model, considering the adaptation of 6 items (AS-S) to a Spanish context. We were unable to replicate the original factor structure, as it is likely that issues with the measurement model fit were due to biases in the questionnaires for item 1, as it did not discriminate appropriately.
None of the studies in the literature had examined the age or sex invariance of AS, and no studies found differences in it due to these variables. Our results for measurement variance, with the CFA models for men and women as well as for each age group demonstrating a good fit, found that a multigroup CFA was appropriate. The invariance of measurement by sex demonstrated that men and women understood the items in the AS-S scale in the same way, as it found no variation in AS responses due to the age brackets presented. We conclude that there is a measurement of invariance in terms of age and sex in this specific population of Spanish university students.
The results of Study 1 resolved what might have been a significant issue for the validity of Study 2. Many more women took part in Study 2 than men, which is a common limitation in psychology research, as female participation tends to be greater than that of males. In addition, more women use psychology degrees than men. This might be because women are more likely to deal with problems and ask for help (Liddon et al., 2017). This is no longer a limitation, as Study 1 showed that men and women had similar understandings of the items in our satisfaction scale.
In Study 2, we aimed to determine whether the CL improved student satisfaction. We found that satisfaction increased significantly and that there were no differences between the two test time points in either SE or EI. In addition, the more satisfied students were those with higher levels of SE, who scored higher in emotional regulation (within EI); this is consistent with studies linking these variables together (Fernandez-Rio et al., 2017; Morales-Rodríguez and Pérez-Mármol, 2019).
Consequently, we can now realize the clinical benefits of these findings. The results indicate that university students who are more satisfied with the implementation of CL have higher self-efficacy and greater emotional regulation, so it seems that the change in the way of carrying out academic practice in the subjects has benefited them.
Limitations and future research
One study limitation is the convenience sampling method we used, which limits the generalizability of the findings. Future studies must consider a more representative sample. The division into experimental and CGs in Study 2 presents problems of causal interpretation regarding the manipulation. However, we believe it is a way of comparing the variability in a methodology that would otherwise have been more difficult. Additional aspects of validity (e.g., local independence between items; rating scale threshold disorder) should also be considered before concluding about the validity evidence of a given test. There are other models in modern test theory that could have been used to explore the data further. However, given our review of previous studies, and including findings from this study, methodological analysis seems to influence the results of a validity study, and must be included in the interpretation of empirical findings. The integration of theoretical implications of a construct has methodological assumptions in our data analysis, including empirical findings from diverse populations and groups; this is a complex, critical process that must be monitored consistently to support quality control in instrument development.
Conclusion
A reduced 6-item AS scale from the study sample demonstrates better psychometric properties (unidimensionality) and a similar level of precision to the original 7-item scale. The original AS was translated into Spanish and tested for reliability and validity with a convenience sample. To our knowledge, this is the first study attempting to assess these variables, exploring structural characteristics and confirming the most appropriate structure in the sample. We examined invariance by sex and age. The AS-S demonstrated good internal consistency and met requirements for psychometric properties. The practical implication of this study is that AS-S is a reliable instrument to assess AS in men and women ages 18–23. This study shows that student satisfaction increased after CL, given the circumstances of this study.
Data availability statement
The data analyzed in this study is subject to the following licenses/restrictions: The data that support the findings of this study are available from the corresponding author upon reasonable request. Requests to access these datasets should be directed to MR-B, marobles@ujaen.es.
Ethics statement
The studies involving human participants were reviewed and approved by University of Jaen (Spain): Code: MAR.20/15.PRY. The patients/participants provided their written informed consent to participate in this study.
Author contributions
MR-B and DS-T: conceptualization, data acquisition, data management, data analysis, data interpretation, manuscript preparation, and writing – original draft preparation. ÓG and AG: writing – original draft preparation, critical review, commentary, and revision. JC: conceptualization, data acquisition, writing, critical review, commentary, revision, and editing. All authors contributed to the article and approved the submitted version.
Funding
This research has received specific support from University of Jaen PIMED55_201921.
Conflict of interest
The authors declare that the research was conducted in the absence of any commercial or financial relationships that could be construed as a potential conflict of interest.
The reviewer SL declared a shared affiliation with the authors ÓG and MR-B to the handling editor at the time of review.
Publisher’s note
All claims expressed in this article are solely those of the authors and do not necessarily represent those of their affiliated organizations, or those of the publisher, the editors and the reviewers. Any product that may be evaluated in this article, or claim that may be made by its manufacturer, is not guaranteed or endorsed by the publisher.
References
Abarca, S., Cáceres, S., Jiménez, E., Moraleda, V., and Romero, B. (2013). Satisfacción de los alumnos con la institución universitaria y el rendimiento académico [Satisfaction of students with the university institution and academic performance]. Reidocrea 2, 48–53.
Bäßler, J., and Schwarzer, R. (1996). Assessment of self-efficacy: spanish adaptation of the measuring geralizated self-efficacy scale (Measuring geralizated self-beliefs). Anxiety Stress J. 1, 1–8.
Byrne, B. M. (2010). Structural Equation Modeling with AMOS: Basic Concepts, Applications, and Programming, 2nd Edn. New York, NY: Routledge.
Byrne, B. M. (2016). Structural Equation Modeling with AMOS: Basic Concepts, Applications, and Programming, 3rd Edn. New York, NY: Routledge, doi: 10.4324/9781410600219
Cheung, G. W., and Rensvold, R. B. (2002). Evaluating goodness-of-fit indices for testing measurement invariance. Struct. Equ. Model. 9, 233–255. doi: 10.1207/S15328007SEM0902_5
Cohen, J. (1988). Statistical Power Analysis for the Behavioral Sciences, 2nd Edn. Mahwah, NJ: Lawrence Erlbaum Associates, doi: 10.4324/9780203771587
Diener, E., Emmons, R. A., Larsen, R. J., and Griffin, S. (1985). The satisfaction with life scale. J. Personal. Assess. 49, 71–75.
Extremera, N., Rey, L., and Sánchez-Álvarez, N. (2019). Validation of the Spanish version of the wong law emotional intelligence scale (WLEIS-S). Psicothema 31, 94–100. doi: 10.7334/psicothema2018.147
Faul, F., Erdfelder, E., Buchner, A., and Lang, A. G. (2009). Statistical power analyses using G*Power 3.1: Tests for correlation and regression analyses. Behav. Res. Methods 41, 1149–1160. doi: 10.3758/BRM.41.4.1149
Feldman, D. B., and Kubota, M. (2015). Hope, self-efficacy, optimism, and academic achievement: Distinguishing constructs and levels of specificity in predicting college grade-point average. Learn. Individ. Differ. 37, 210–216. doi: 10.1016/j.lindif.2014.11.022
Fernández-Espínola, C., Abad-Robles, M. T., Collado-Mateo, D., Almagro, B. J., Castillo Viera, E., and Giménez Fuentes-Guerra, F. J. (2020). Effects of cooperative-learning interventions on physical education students’ intrinsic motivation: A systematic review and meta-analysis. Int. J. Environ. Res. Public Health 17:4451. doi: 10.3390/ijerph17124451
Fernandez-Rio, J., Cecchini, J. A., Méndez-Gimenez, A., Mendez-Alonso, D., and Prieto, J. A. (2017). Self-regulation, cooperative learning, and academic self-efficacy: Interactions to prevent school failure. Front. Psychol. 8:22. doi: 10.3389/fpsyg.2017.00022
Ferrando, P. J., Lorenzo-Seva, U., Hernández-Dorado, A., and Muñiz, J. (2022). Decalogue for the factor analysis of test items. Psicothema 34, 7–17. doi: 10.7334/psicothema2021.456
Ferrero, M., Vadillo, M. A., and León, S. P. (2021). A valid evaluation of the theory of multiple intelligences is not yet possible: Problems of methodological quality for intervention studies. Intelligence 88:101566. doi: 10.1016/j.intell.2021.101566
Fiori, M., and Vesely-Maillefer, A. K. (2018). “Emotional intelligence as an ability: Theory, challenges, and new directions,” in Emotional Intelligence in Education, eds K. Keefer, J. Parker, and D. Saklofske (Cham: Springer), 23–47.
Gallagher, M. W., Long, L. J., and Phillips, C. A. (2020). Hope, optimism, self-efficacy, and posttraumatic stress disorder: A meta-analytic review of the protective effects of positive expectancies. J. Clin. Psychol. 76, 329–355. doi: 10.1002/jclp.22882
García, R., Traver, J. A., and Candela, I. (2001). Aprendizaje Cooperativo. Fundamentos, características y técnicas [Cooperative learning, Fundamentals, Characteristics and techniques]. Madrid: CCS-ICCE.
Grissom, R. J., and Kim, J. J. (2012). Effect Sizes for Research: Univariate and Multivariate Applications. New York, NY: Routledge, doi: 10.4324/9781410612915
Hooper, D., Coughlan, J., and Mullen, M. (2008). Structural equation modelling: Guidelines for determining model fit. Electron. J. Bus. Res. Methods 6, 53–60.
Huebner, E. S., and Gilman, R. (2006). Students who like and dislike school. Appl. Res. Qual. Life 1, 139–150. doi: 10.1007/s11482-006-9001-3
Iasiello, M., van Agteren, J., Keyes, C. L. M., and Cochrane, E. M. (2019). Positive mental health as a predictor of recovery from mental illness. J. Affect. Disord. 251, 227–230. doi: 10.1016/j.jad.2019.03.065
Insunza, B., Ortiz, L., Pérez, C., Torres, G., McColl, P., Meyer, A., et al. (2015). Estructura factorial y confiabilidad del Cuestionario de Satisfacción Académica en estudiantes de medicina chilenos [Factor structure and reliability of the Academic Satisfaction Questionnaire in Chilean medical students]. Revista Iberoamericana de Diagnóstico y Evaluación 2, 73–82.
Kleinbaum, D. G., Kupper, L. L., and Muller, K. E. (1988). Variable Reduction and Factor Analysis. Applied Regression Analysis and Other Multivariable Methods. Boston, MA: PWS Kent Publishing Co.
Kline, R. B. (2016). Methodology in the Social Sciences. Principles and Practice of Structural Equation Modeling, 4th Edn. New York, NY: Guilford Press.
Lent, R. W., Singley, D., Sheu, H., Gainor, K., Brenner, B. R., Treistman, D., et al. (2005). Social cognitive predictors of domain and life satisfaction: Exploring the theoretical precursors of subjective well-being. J. Couns. Psychol. 52, 429–442. doi: 10.1037/0022-0167.52.3.429
Lent, R. W., Singley, D., Sheu, H., Janet, B., Schmidt, A., and Schmidt, C. L. (2007). Relation of social-cognitive factors to academic satisfaction in engineering student. J. Career Assess. 15, 87–97. doi: 10.1177/1069072706294518
León del Barco, B., Mendo-Lázaro, S., Felipe-Castaño, E., Polo del Río, M. I., and Fajardo-Bullón, F. (2017). Team potency and cooperative learning in the university setting. Rev. Psicodidáctica 22, 9–15. doi: 10.1387/RevPsicodidact.14213
Liddon, L., Kingerlee, R., and Barry, J. A. (2017). Gender differences in preferences for psychological treatment, coping strategies, and triggers to help-seeking. Br. J. Clin. Psychol. 57, 42–58. doi: 10.1111/bjc.12147
Lodi, E., Boerchi, D., Magnano, P., and Patrizi, P. (2017). College satisfaction scale (CSS): Evaluation of contextual satisfaction in relation to student life satisfaction and academic performance. Appl. Psychol. Bull. 279, 51–64.
Lorenzo-Seva, U., and Van-Ginkel, J. R. (2016). Multiple Imputation of missing values in exploratory factor analysis of multidimensional scales: Estimating latent trait scores. Anal. Psicol. 32, 596–608. doi: 10.6018/analesps.32.2.215161
Lukat, J., Margraf, J., Lutz, R., van der Veld, W. M., and Becker, E. S. (2016). Psychometric properties of the positive mental health scale (PMH-scale). BMC Psychol. 4:8. doi: 10.1186/s40359-016-0111-x
Mardia, K. V. (1970). Measures of multivariate skewness and kurtosis with applications. Biometrika 57, 519–530. doi: 10.1093/biomet/57.3.519
Medrano, A., and Pérez, E. (2010). Adaptación de la escala de satisfacción académica a la población universitaria de córdoba [Adaptation of the academic satisfaction scale to the university population of córdoba]. Summa Psicol. 7, 5–14. doi: 10.18774/448x.2010.7.117
Medrano, A., Fernández, M., and Pérez, E. (2014). Computerized assesment system for academic satisfaction (ASAS) for first-year university student. Electron. J. Res. Educ. Psychol. 12, 541–562. doi: 10.14204/ejrep.33.13131
Méndez-Vera, J., and Gálvez-Nieto, J. L. (2018). Propiedades psicométricas de la Escala de Autoconcepto Académico (EAA) en estudiantes universitarios chilenos. Liberabit 24, 131–145. doi: 10.24265/liberabit.2018.v24n1.09
Merino-Soto, C., Dominguez-Lara, S., and Fernández-Arata, M. (2016). Validación inicial de una escala breve de satisfacción con los estudios en estudiantes universitarios de Lima [Initial validation of a short scale of satisfaction with studies in university students from Lima]. Educ. Méd. 18, 74–77. doi: 10.1016/j.edumed.2016.06.016
Mondo, M., Sechi, C., and Cabras, C. (2021). Psychometric evaluation of three versions of the Italian perceived stress scale. Curr. Psychol. 40, 1884–1892. doi: 10.1007/s12144-019-0132-8
Morales-Rodríguez, F. M., and Pérez-Mármol, J. M. (2019). The role of anxiety, coping strategies, and emotional intelligence on general perceived self-efficacy in university students. Front. Psychol. 10:1689. doi: 10.3389/fpsyg.2019.01689
Muñiz, J., Elosua, P., and Hambleton, R. K. (2013). International test commission guidelines for test translation and adaptation: Second Ed. Psicothema 25, 151–157. doi: 10.7334/psicothema2013.24
Muñoz-Campos, E. M., Fernández González, A., and Jacott, L. (2018). Bienestar subjetivo y satisfacción vital del profesorado. REICE. Revista Iberoamericana sobre Calidad, Eficacia y Cambio Educación 16, 105–117. doi: 10.15366/reice2018.16.1.007
Olsson, U. H., Foss, T., Troye, S. V., and Howell, R. D. (2000). The performance of ML, GLS, and WLS estimation in structural equation modeling under conditions of misspecification and nonnormality. Struct. Equ. Model. 7, 557–595.
Osorio-Alvarez, M., and Parra, L. (2015). La satisfacción escolar en los estudiantes del primer año de la carrera de Médico Cirujano [School satisfaction in students of the first year of the Medical Surgeon career]. Investig. Educ. Méd. 5, 3–10. doi: 10.1016/j.riem.2015.08.002
Ramos, A., Tomaschewski, J., Lerch, V., Devos, E., Silva, R., and Saraiva, S. (2015). Satisfaction with academic experience among undergraduete nursing students. Text Context Nurs. 24, 187–195. doi: 10.1590/0104-07072015002870013
Rand, K. L. (2017). “Hope, self-efficacy, and optimism: Conceptual and empirical differences,” in The Oxford Handbook of Hope, eds M. W. Gallagher and S. J. Lopez (New York, NY: Oxford University Press), 45–58. doi: 10.1093/oxfordhb/9780199399314.013.4
Righi, A., Polydoro, S., and Angeli, A. (2006). Escala de satisfação com a experiência acadêmica de estudantes do ensino superior [Scale of satisfaction with the academic experience of higher education students]. Avaliação Psicol. 5, 11–20.
Sanjuán, P., Pérez-García, A. M., and Bermúdez, J. (2000). Escala de autoeficacia general: Datos psicométricos de la adaptación para población Española [General self-efficacy scale: Psychometric data of adaptation for the Spanish population]. Psicothema 12, 509–513.
Schwarzer, R., and Jerusalem, M. (1995). “Generalized self-efficacy scale,” in Measures in Health Psychology: A User’s Portfolio. Causal and Control Beliefs, eds J. Weinman, S. Wright, and M. Johnston (Windsor: NFER-NELSON), 35–37.
Shin, J. C., and Jung, J. (2014). Academics job satisfaction and job stress across countries in the changing academic environments. High. Educ. 67, 603–620. doi: 10.1007/s10734-013-9668-y
Slavin, R. E. (2011). “Instruction based on cooperative learning,” in Handbook of Research on Learning and Instruction, ed. R. Mayer (London: Taylor & Francis), 344–361.
Torrego, J. C. (2019). Inclusión Educativa y Aprendizaje Cooperativo [Educational inclusion and cooperative learning]. Madrid: Editorial Síntesis.
Trianes, M. V. (2014). Psicología del Desarrollo y de la Educación [Developmental and Educational Psychology]. Madrid: Pirámide.
Van de Schoot, R., Lugtig, P., and Hox, J. (2012). A checklist for testing measurement invariance. Eur. J. Dev. Psychol. 9, 486–492.
Vergara-Morales, J., Del Valle, M., Díaz, A., and Pérez, M. V. (2018). Adaptación de la escala de satisfacción académica en estudiantes universitarios chilenos. Educ Psychol. 24, 99–106. doi: 10.5093/psed2018a15
Wong, C. S., and Law, K. S. (2002). The effects of leader and follower emotional intelligence on performance and attitude: An exploratory study. Leadersh. Q. 13, 243–274. doi: 10.1016/S1048-9843(02)00099-1
World Medical Association (2013). World medical association declaration of Helsinki: Ethical principles for medical research involving human subjects. JAMA 10, 2191–2194.
Yoo, W., Namkoong, K., Choi, M., Shah, D. V., Tsang, S., Hong, Y., et al. (2014). Giving and receiving emotional support online: Communication competence as a moderator of psychosocial benefits for women with breast cancer. Computers in Human Behavior 30, 13–22. doi: 10.1016/j.chb.2013.07.024
Appendix
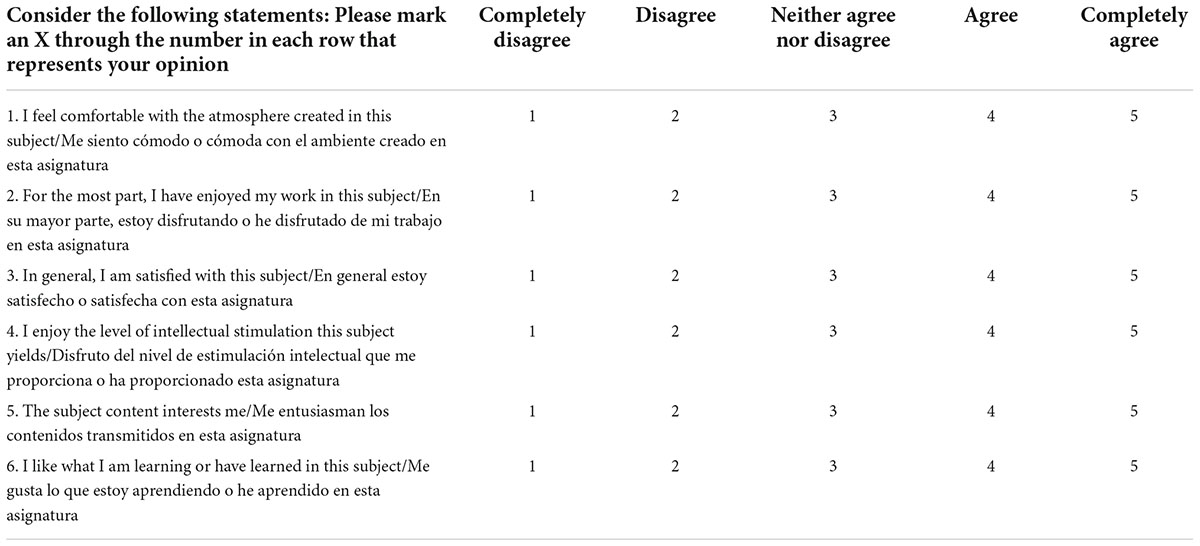
APPENDIX TABLE A1 Academic satisfaction scale for Spanish university students (AS-Spanish).
Keywords: cooperative learning, academic satisfaction, Spanish population, invariance, psychometric properties
Citation: Robles-Bello MA, Sánchez-Teruel D, Gavin Chocano Ó, González Luque A and Camacho Conde JA (2022) Co-operative learning, psychometric adaptation, and invariability of the academic satisfaction scale in Spanish university students. Front. Psychol. 13:864510. doi: 10.3389/fpsyg.2022.864510
Received: 28 January 2022; Accepted: 01 August 2022;
Published: 21 September 2022.
Edited by:
Martina Rau, University of Wisconsin-Madison, United StatesReviewed by:
Samuel P. León, University of Jaén, SpainDiego Boerchi, Catholic University of the Sacred Heart, Italy
Maha Atout, Philadelphia University, Jordan
Copyright © 2022 Robles-Bello, Sánchez-Teruel, Gavin Chocano, González Luque and Camacho Conde. This is an open-access article distributed under the terms of the Creative Commons Attribution License (CC BY). The use, distribution or reproduction in other forums is permitted, provided the original author(s) and the copyright owner(s) are credited and that the original publication in this journal is cited, in accordance with accepted academic practice. No use, distribution or reproduction is permitted which does not comply with these terms.
*Correspondence: José Antonio Camacho Conde, josean.camacho@ugr.es