 Yongbiao Zhao
 Yuanyuan Ma
 Qilin Zhang2
- 1National Engineering Research Center for E-Learning, Central China Normal University, Wuhan, Hubei, China
- 2School of Computer Engineering, Hubei University of Arts and Science, Xiangyang, Hubei, China
Background: Increasing evidence indicates that metabolites are closely related to human diseases. Identifying disease-related metabolites is especially important for the diagnosis and treatment of disease. Previous works have mainly focused on the global topological information of metabolite and disease similarity networks. However, the local tiny structure of metabolites and diseases may have been ignored, leading to insufficiency and inaccuracy in the latent metabolite-disease interaction mining.
Methods: To solve the aforementioned problem, we propose a novel metabolite-disease interaction prediction method with logical matrix factorization and local nearest neighbor constraints (LMFLNC). First, the algorithm constructs metabolite-metabolite and disease-disease similarity networks by integrating multi-source heterogeneous microbiome data. Then, the local spectral matrices based on these two networks are established and used as the input of the model, together with the known metabolite-disease interaction network. Finally, the probability of metabolite-disease interaction is calculated according to the learned latent representations of metabolites and diseases.
Results: Extensive experiments on the metabolite-disease interaction data were conducted. The results show that the proposed LMFLNC method outperformed the second-best algorithm by 5.28 and 5.61% in the AUPR and F1, respectively. The LMFLNC method also exhibited several potential metabolite-disease interactions, such as “Cortisol” (HMDB0000063), relating to “21-Hydroxylase deficiency,” and “3-Hydroxybutyric acid” (HMDB0000011) and “Acetoacetic acid” (HMDB0000060), both relating to “3-Hydroxy-3-methylglutaryl-CoA lyase deficiency.”
Conclusion: The proposed LMFLNC method can well preserve the geometrical structure of original data and can thus effectively predict the underlying associations between metabolites and diseases. The experimental results show its effectiveness in metabolite-disease interaction prediction.
1. Introduction
Metabolites, the final product of the cell regulation process, are also regarded as the final response of a biological system to genetic or environmental changes (1, 2). Changes in metabolite levels are important markers of disease development, directly reflecting the physiological state of the human body and metabolic abnormalities. Nicholson et al. (3) pointed out that the level of metabolites reflects the effect of the human body on drug treatment and can be used as an important indicator of susceptibility and disease rehabilitation. Disease-related metabolite identification can improve clinical diagnosis and deepen the understanding of pathological mechanisms. Therefore, it is a critical task and challenge in precision medicine and biology (4).
Researchers have developed numerous methods, mostly experimental or computational, to mine the relationship between metabolites and diseases. For example, Ouyang et al. (5) discovered that metabolites (e.g., isoleucine, triglyceride, leucine, and creatinine) revealed significantly higher in the serum of pancreatic cancer patients than those in the serum of healthy controls by using 1H NMR spectroscopy and principal component analysis. Reinke et al. (6) did a metabolomics analysis to identify different metabotypes of asthma severity and found that 15 out of 66 identified serum metabolites were significantly changed with asthma. Ibanez et al. (7) developed a non-targeted metabolomics method to detect differences in metabolites in cerebrospinal fluid samples from subjects with different cognitive states associated with the progression of Alzheimer’s disease. Further, Wang et al. (8) proposed a metabolomics method based on ultra-high performance liquid chromatography–mass spectrometry to identify 13 potential biomarkers, such as succinic acid (Canavaninosuccinate) and glycochenodeoxycholic acid, which effectively distinguished patients with hepatocellular carcinoma or cirrhosis from the control group and provided important indicators for the early diagnosis and screening of patients with liver cancer. Compared with traditional experimental methods, computational approaches are relatively convenient and economical and are now more important in the field of disease-metabolite interaction relationship prediction.
Recently, some researchers have used machine learning methods to predict the interactions between metabolites and diseases (1, 2, 9–12). The majority of these methods work as follows: First, a metabolite-related heterogeneous network is built by integrating multi-omics information; second, the candidate metabolites are scored via a random walk-based method (4, 9, 13); finally, the ranking of disease-related metabolites is obtained according to the score. These methods comprehensively consider the information from multiple sources, including the genome, phenotype, and metabolic pathway, but they ignore the noise and outliers in the metabolite interaction network, undermining the reliability of the final prediction. An effective solution is to utilize the neighbor information of disease (metabolite) nodes. It benefits in two aspects: (i) effectively reducing the computational complexity, especially the construction of large-scale node similarity networks, and (ii) largely eliminating noise and interference information.
Several studies have verified that compared with the global similarity network, the local structure information (neighbors) of nodes can significantly improve the algorithm’s performance. Ma et al. (12) adopted the nearest neighbor regularization to eliminate the noise information in the metabolite-disease interaction network, and obtained good prediction results, which proved the effectiveness of the local structure information in the prediction of metabolite-disease interaction. Zhou et al. (14) achieved the accurate classification of unlabeled nodes by introducing local neighbor information. The construction strategy of the nearest neighbor graph determines the algorithm’s performance. The nearest neighbor constraint usually adopts Laplacian graph regularization. However, Wang et al. (15) designed the local spectral matrix, called Vicus, which can outperform the Laplacian matrix in some scenarios.
In addition, LMF (logical matrix factorization) has been successfully applied in the biological interaction prediction. Johnson (16) demonstrated the advantages of logical matrix factorization in modeling unobserved connections, which was realized by setting different weights for positive and negative samples. Liu et al. (17) predicted the drug-target interaction by combining the neighbor structure of nodes and the logical matrix factorization algorithm.
In this paper, we propose a novel algorithm based on logical matrix factorization and considering the local structure information (using the aforementioned spectral matrix) to predict metabolite-disease interactions. The paper’s main contributions are as follows.
i. Integrating multisource information, such as disease description information from medical subject headings (MeSH) and disease-gene interaction information to build a disease similarity network. Multi-source information fusion can avoid the unreliability and inaccuracy in results caused by measurement errors and noises from a single data source, and it can describe the correlation between nodes more comprehensively;
ii. The impact of noise and outliers is largely eliminated by employing the logical matrix factorization and local neighbor structure information. The neighbor’s matrix constructed by the label diffusion algorithm has obvious advantages over the traditional Laplacian matrix. The experimental results show that the proposed method was superior to the baseline and state-of-the-art algorithms on the metabolite-disease dataset. The performance was improved by 5.28 and 5.61% in AUPR and F1, respectively;
iii. The proposed method is easily extended to other biological problems, such as phage-host interaction prediction and metabolite-drug interaction prediction.
2. Materials and methods
2.1. Dataset
The collected data fall into three categories:
i. Disease-related data, which were downloaded from the Comparative Toxicogenomic Database (CTD) (18). Data sources include: ① the human disease medical dictionary, which consists of 12,988 disease names, MeSH ID, Online Mendelian Inheritance in Man (OMIM) ID, disease synonyms, and the tree-structured disease representation; ② 25,114,553 interactions between 46,045 genes and 7,163 diseases; ③ 1,727,119 interactions between 13,126 Gene Ontology Biological Processes (GO BPs) and 7,116 diseases;
ii. Metabolite-related data, which were collected from the Human Metabolome Database (HMDB) (19). The data include 814,427 interactions between 5,643 genes and 24,444 metabolites. Furthermore, the functional similarity network of metabolites was derived from the human gene interaction network (1);
iii. Metabolite-disease interaction data, which were also obtained from the HMDB (19). Originally, the data contained 24,722 interactions between 649 diseases and 22,265 metabolites. By removing diseases without OMIM ID and semantic similarity and metabolites lacking functional similarity, we shrank that figure to 3,360 interactions between 337 diseases and 1,444 metabolites.
2.2. Problem formalization
In this article, the set of metabolites is denoted by , and the set of diseases is denoted by , where n and m are the number of metabolites and diseases, respectively. The known metabolite-disease interactions are represented as an binary matrix ( ), where if a metabolite ( ) has been observed to interact with a disease ( ); otherwise, .This study aimed to solve the problem of predicting the interaction probability of a disease-metabolite pair, and it subsequently ranked the candidate disease-metabolite pairs based on these probabilities in descending order. Thus, the top-ranked pairs can be viewed as latent interactions.
2.3. Metabolite-disease interaction prediction process based on logical matrix factorization and local neighborhood constraints
The prediction process, as demonstrated in Figure 1, can be divided into three subprocesses:
i. The disease-disease similarity network is constructed by integrating the disease-related data (disease-gene interactions, disease-GO interactions, and the MeSH tree). Similarly, the metabolite-metabolite similarity network is built from the metabolite-related data (gene–gene associations, metabolite-gene interactions. Due to its highly sparse and noisy, the metabolite-disease interaction data is smoothed via WKNNP (20).
ii. The local spectral matrices of diseases and metabolites are computed based on the disease-disease similarity network and metabolite-metabolite network, respectively.
iii. The metabolite-disease interaction probabilities are computed by feeding the modified metabolite-disease interaction matrix, metabolite local spectral matrix, and disease local spectral matrix into the proposed logical matrix factorization model based on the local nearest neighbor constraint (LMFLNC).
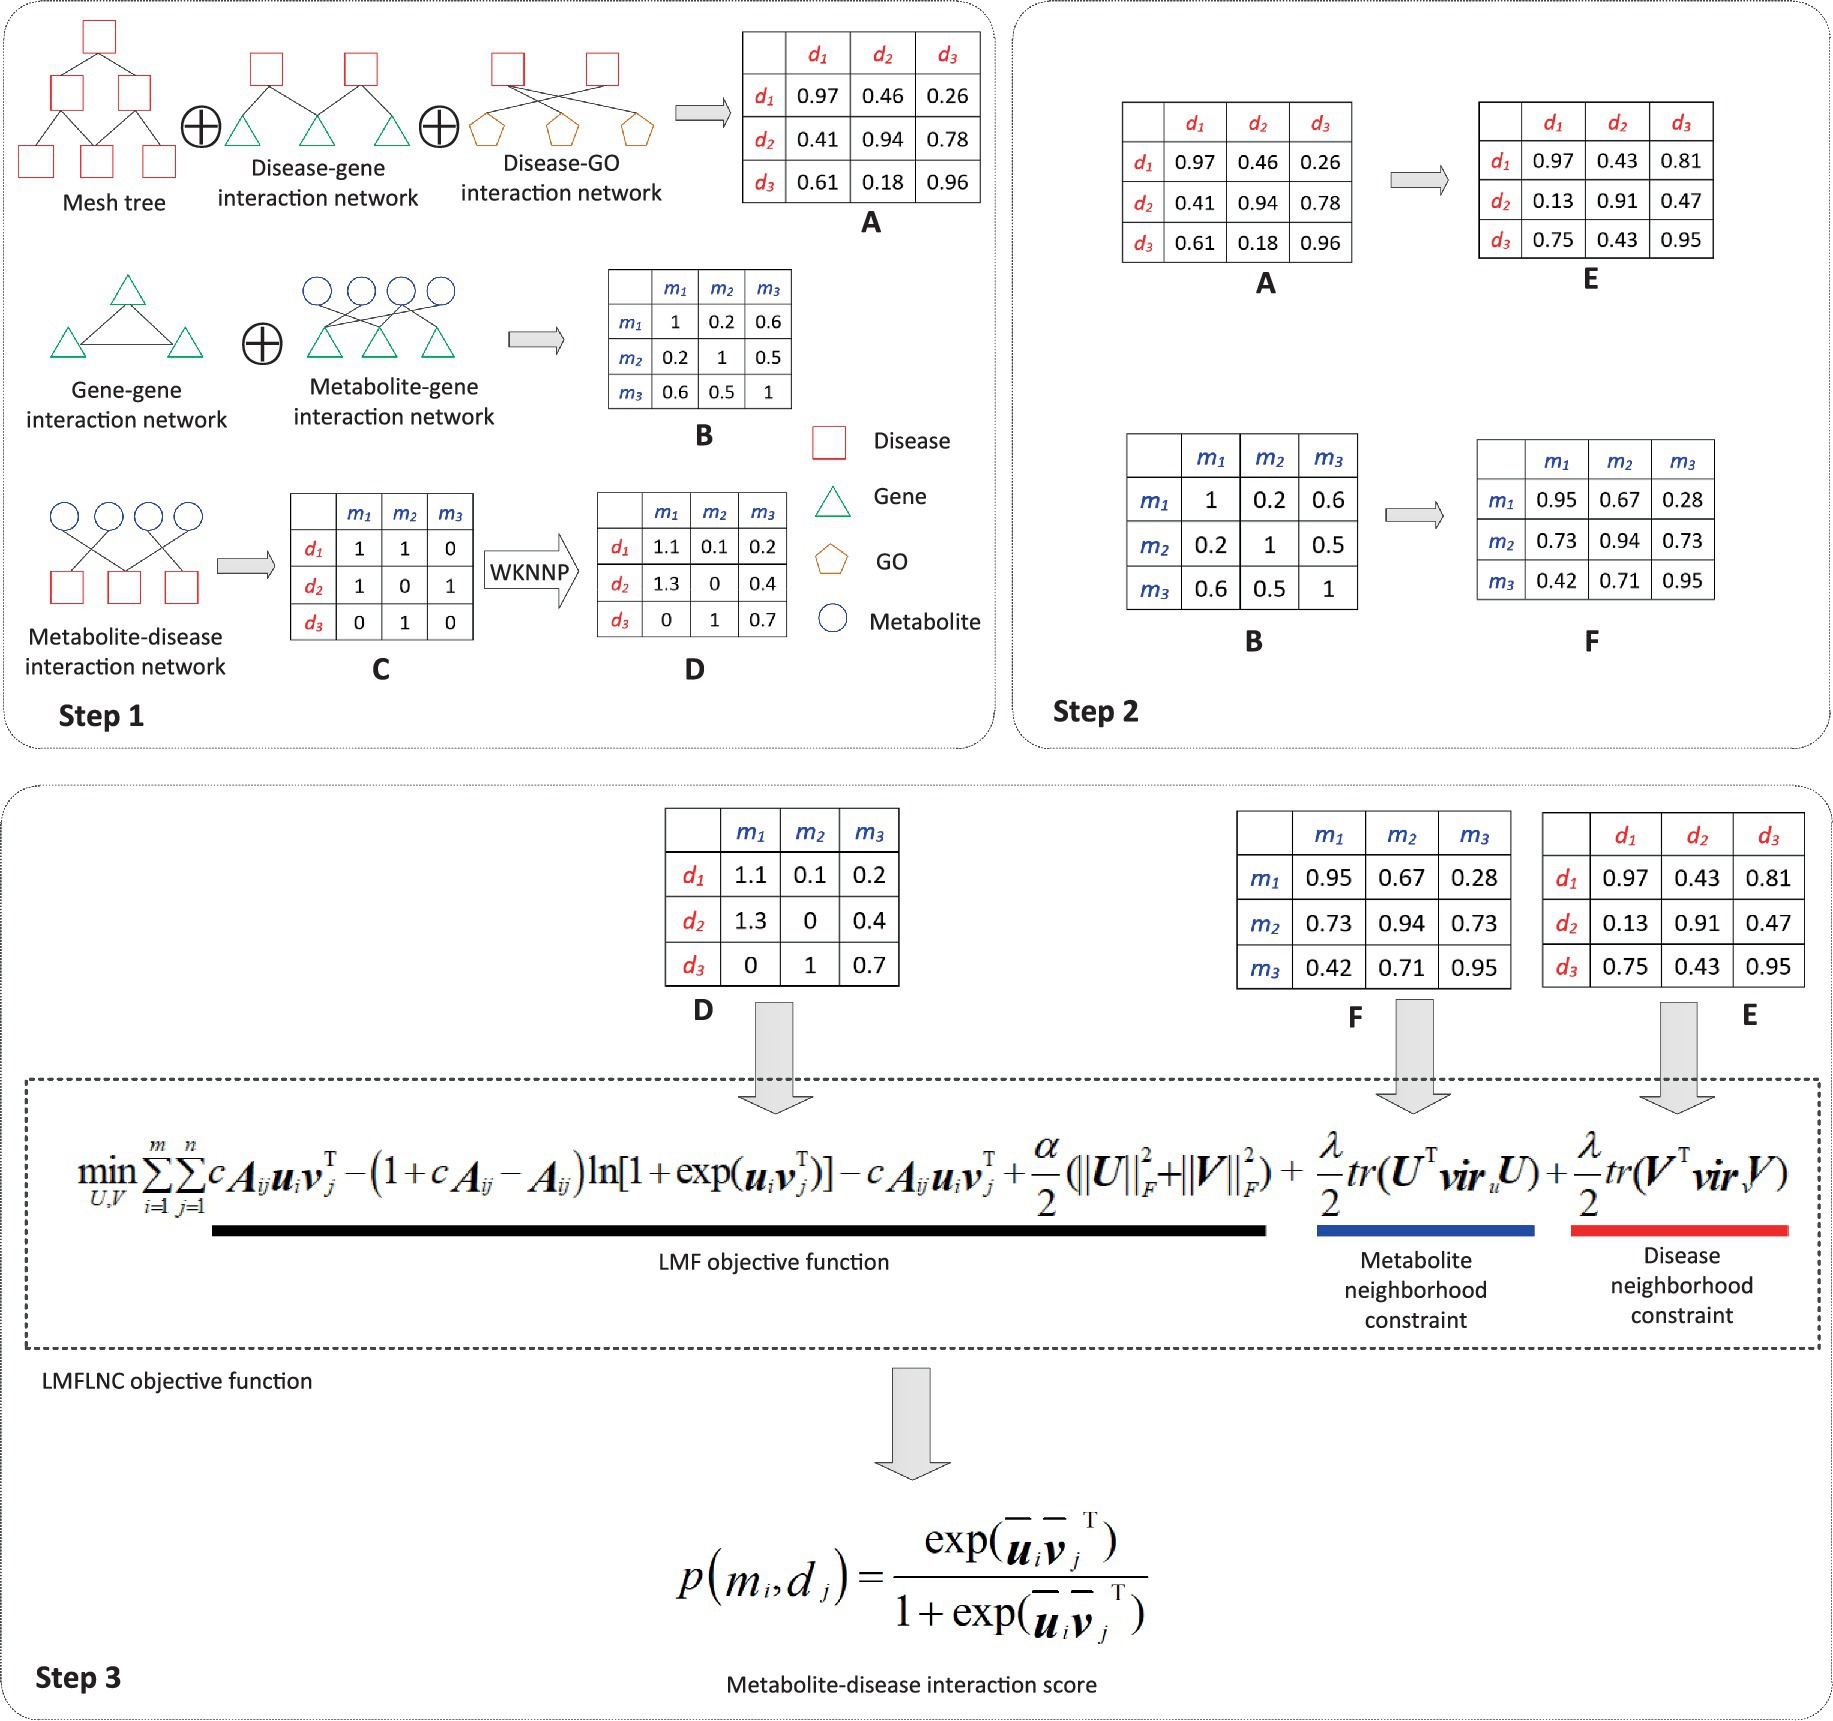
Figure 1. Flowchart of metabolite-disease interaction prediction with the LMFLNC. In step1, the disease-disease similarity matrix A is constructed by integrating the disease-related data disease-gene interactions, disease-GO interactions, and the MeSH tree with clusDCA. Similarly, the metabolite-metabolite similarity matrix B is built from gene–gene associations, metabolite-gene interactions; Running WKNNP on the metabolite-disease interaction matrix C generates the completed metabolite-disease interaction matrix D; In step 2, the local spectral matrices of diseases and metabolites E and F are obtained based on the disease-disease similarity matrix and metabolite-metabolite matrix, respectively. Finally, in step 3, the proposed LMFLNC was used to predict the metabolite-disease interaction scores.
Two crucial steps in the prediction process need further explanations.
(i) Disease-disease similarity network construction.
To obtain the comprehensive and accurate similarity between diseases, multiple data source of diseases including disease MeSH descriptors, disease–GO biological process interaction networks and disease–gene interaction networks are integrated. We employs the MultiSourcDSim model presented in (21) to calculate the semantic similarity of diseases. Specifically, for MeSH descriptors (22), we firstly construct a directed acyclic graph (DAG) to describe the relationships between any two diseases. Secondly, the probability of a disease term is calculated with its frequency occurring in the association dataset (Eqs. 1–2). Finally, the disease similarity (Eq. 3) is calculated with Lin’s method (23).
where is the number of disease term t, tc is a direct child of t. is the frequency at which t occurs in the single association dataset. N is the frequency of the root node term. is the set of least common ancestors of term and . denotes the semantic similarity score between disease terms and . For the other two data source, the similarity score is used to compute the disease similarity network.
(ii) Metabolite-metabolite similarity network construction.
With metabolite-gene interaction data, the similarity between any two genes, and , can be measured as
where GOi and GO j denote the GO sets explaining and , respectively.
Similarly, the similarity between a gene ( ) and a gene set (G) can be defined as
According to (24), the similarity between two metabolites, and , can be computed as
where and stand for gene sets related to and , respectively; denotes the set size.
The metabolite-metabolite similarity network is built via Equation (6).
2.4. Logical matrix factorization based on local nearest neighbor constraint
Logical matrix factorization has been successfully applied to the prediction of drug-target and virus-host interactions. In this paper, a new model based on logical matrix factorization is proposed to predict the interaction between metabolites and diseases. The main idea is to map metabolites and diseases into a shared low-dimensional latent semantic space, . Then, the probability of interaction between metabolite and disease can be modeled by the following logical function:
where and are latent representations of metabolite and disease , respectively.
In logical matrix factorization, the known or experimentally verified interactions are usually more informative, so they are usually assigned higher weights than those unknown ones. Each metabolite-disease interaction is regarded as positive sample, and each unknown metabolite-disease pair is regarded as a single negative sample. is used to control the importance level of the observed interactions, which was empirically set to 2 in the subsequent experiments.
Assuming that each training sample is independent, according to the maximum likelihood estimation, the following probability representation can be obtained:
where A represents the known metabolite-disease interaction matrix; U and V represent the decomposed the metabolite and disease latent semantic matrices, respectively; m is the number of metabolites; n is the number of diseases. The logarithm of can be inferred by combining Equation (7) with Equation (8):
Equation (9) is also called the basic LMF objective function. The latent representation matrices U and V can be estimated by maximizing this function.
To improve the performance of the logical matrix factorization algorithm, researchers (12, 17) introduced the local neighbor constraint. They sorted the nodes by their similarities to find neighbor nodes, but they ignored the diffusion and propagation of label information carried by neighbor nodes, which limited the performance enhancement. In this study, inspired by the idea of a local spectral matrix, the Vicus matrix (15), we obtained the following objective function by using the Vicus matrix to constrain Equation (9):
where is the regularization parameter to balance between the factorization error and the local spatial structure preservation; and represent the local spectral matrices of metabolites and diseases, respectively, whose calculation process is as follows:
Let be the set of data points, be the weighted network constructed from with as the vertex set and the similarities among as the weight set; be the ith data point in ; the ith vertex in , be the neighbors of , whose size is ; and C be the number of clusters.
First, for node , subnet is extracted from , where the vertex set , and is the edge set. Through the label diffusion algorithm (14), the label indicator vector is reconstructed as
where is a constant between 0 and 1, which is set to 0.9, as suggested in (24); is the clustering indicator vector reflecting the scaling of subnet ; represents the standardized transition matrix of , defined as .
Second, is estimated by . Let indicate the likelihood that data point i belongs to cluster k. The next task is to maximize the concordance between and . Let , where is the row of matrix , which represents the convergence state of label diffusion. Thus, can be estimated as
where and denotes the first K elements and the (K + 1)th element in , respectively.
Afterward, matrix B is constructed to represent the linear relationship between and : . It is computed as
To minimize the difference between and , we can define an objective function as
Finally, let , which is the needed local spectral matrix. Wang et al. (15) proved that and the Laplacian matrix share many of the same properties. For example, they are both symmetric and positive semidefinite, with the minimum eigenvalue being 0 and the eigenvector being 1.
In logical matrix factorization, to prevent overfitting, we usually constrain the latent space matrices U and V to construct the final objective function as
where denotes the regularization parameter. Here, the gradient descent algorithm is used to optimize Equation (15). Specifically, let L represent the objective function whose partial derivatives with respect to U and V are given as follows:
where P is the probability matrix defined by Equation (7), and represents the Hadamard product of a matrix. After the latent representations of U and V have been acquired, any unknown metabolite-disease interaction probability can be predicted by Equation (7). However, in the training process, the latent vectors of some unobserved metabolites and diseases are obtained based on negative samples, which may not be accurate enough. Ma et al. (12) presented an effective solution. Let represent the set of metabolites interacting with any disease, and let represent the set of K nearest neighbors of metabolites in . We set K = 10 in this manuscript. Metabolite can be represented by a linear combination of the latent vectors of , and is defined as follows:
where is a normalized term, denotes the kth neighbor of , and is the binary neighbor similarity matrix. if metabolite or metabolite ; otherwise, . is a decay factor, which is 0.9 in this paper. . Similarly, the representation of disease can be obtained:
where is a normalized term, denotes the kth neighbor of disease , and .
Eventually, the probability of an interaction between metabolite and disease can be rewritten as
In order to clearly demonstrate the steps of LMFLNC algorithm, we also presented its pseudocode in Table 1.
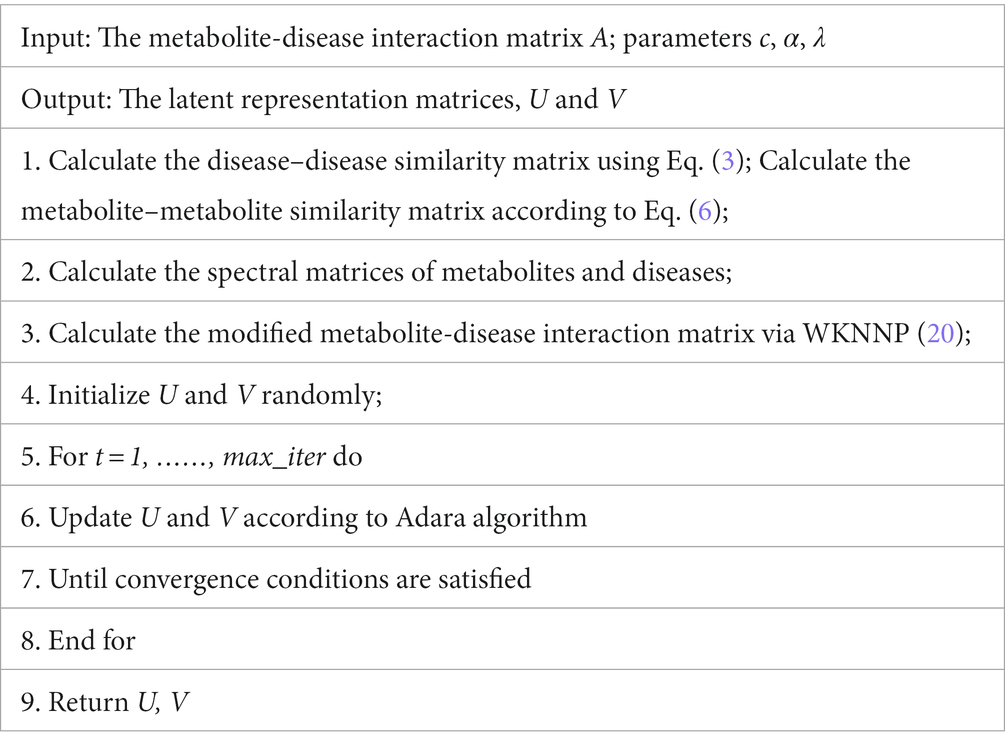
Table 1. The pseudocode of the LMFLNC algorithm.
3. Results and discussion
3.1. Experimental settings and evaluation metrics
Following the previous studies, we used the fivefold cross-validation technique for model validation in this paper. In each round, one-fifth of the known metabolite-disease interactions and all unobserved interactions (metabolite-disease pairs corresponding to elements of value 0 in the metabolite-disease interaction matrix A) were used for testing; the rest were used for training. AUPR, AUC, and F1 were adopted as performance evaluation. To achieve a relatively objective evaluation, we randomly ran the cross validation 20 times, over which the average values of the aforementioned metrics were taken as their final values. The model implementation and validation were realized in MATLAB R2017b (see Table 1).
3.2. Experimental results
To verify the superiority of the proposed LMFLNC model, we compared it with such baselines as MN-LMF (12), PROFANCY (2), WMAN (25), and MCF (13). The parameters of PROFANCY, WMAN, and MN-LMF were set to default values. For MCF, the reboot probability is set as the optimal element from . For LMFLNC, we set the number of nearest neighbors in local spectral matrices of metabolites and diseases as K = 15, the importance level of observed interactions c = 2, the neighbor regularization parameter , and the latent space regularization parameter . The performance of the abovementioned algorithms on the metabolite-disease benchmark dataset is shown in Table 2.
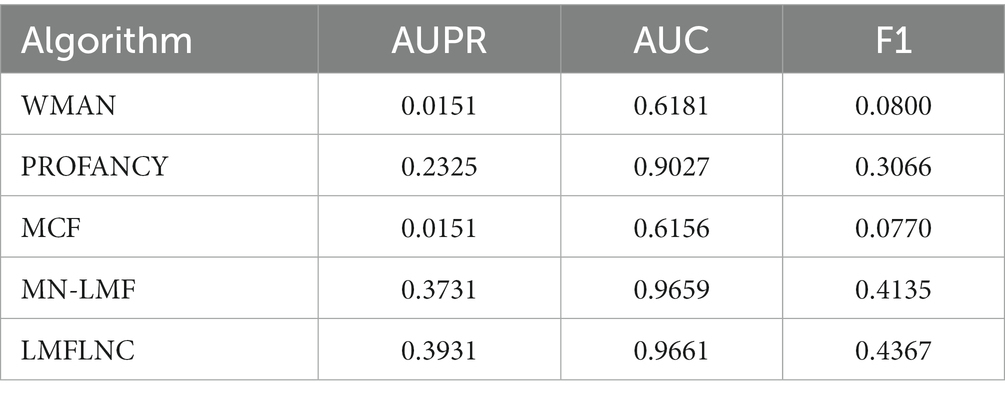
Table 2. Performance comparison of metabolite-disease benchmark dataset.
Table 2 shows that the LMFLNC algorithm outperformed the second MN-LMF algorithm in AUPR and F1 5.28 and 5.61%, respectively. Additionally, the prediction performances of WMAN and MCF methods were unsatisfactory. One possible reason is that these two methods simply focus on the known metabolite-disease interaction network and only leverage limited prior knowledge, that is, the disease similarity network. However, the LMFLNC method fully considers the similarities of metabolites and diseases at multiple levels and then adjusts the importance level of positive and negative samples (the observed metabolite-disease interaction is regarded as a positive sample. The unobserved metabolite-disease interaction is regarded as a negative sample) by parameter c, which improved its performance. Moreover, compared with MN-LMF, LMFLNC uses the local spectral matrices of metabolites and diseases to construct neighbor constraints, so the latent representations of metabolites and diseases generated by the logical matrix factorization were more robust. The experimental results show the potential of LMFLNC in predicting unknown metabolite-disease interactions.
3.3. Parameter analysis
Two parameters need to be tuned in LMFLNC: the latent space regularization parameter and the local spectral parameter (or neighbor regularization parameter) ; the other ones are set by default. The grid search was employed to find the optimal parameter values. Let , , and the model performance over different parameter combinations was evaluated by a fivefold cross-validation. As shown in Figure 2, LMFLNC obtained the optimal prediction performance (AUPR) when = 4 and = 8.
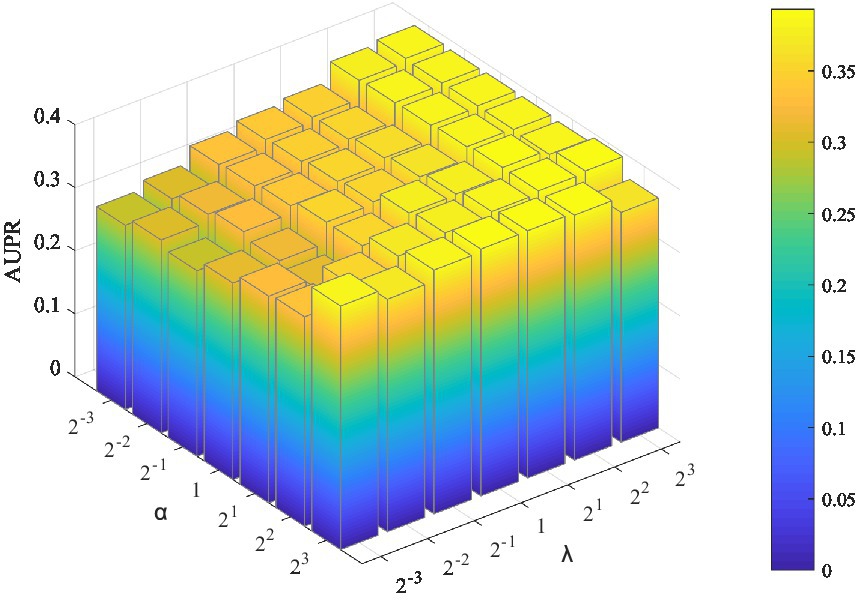
Figure 2. Parameter sensitivity analysis. AUPR achieves the maximum value when =4 and =8.
3.4. Case studies
We further verify the performance of LMFLNC method in this section. First, the entire dataset was used to train LMFLNC with the optimal parameters obtained above. Then, the trained LMFLNC was used to predict the interaction probabilities between all the metabolites and two example diseases, “21-Hydroxylase deficiency” and “3-Hydroxy-3-methylglutaryl-CoA lyase deficiency,” in the dataset. Table 3 displays 10 metabolites relating to the first example disease, with the probabilities listed in descending order. Similarly, Table 4 displays 15 metabolites relating to the second example disease, with the probabilities again listed in descending order.
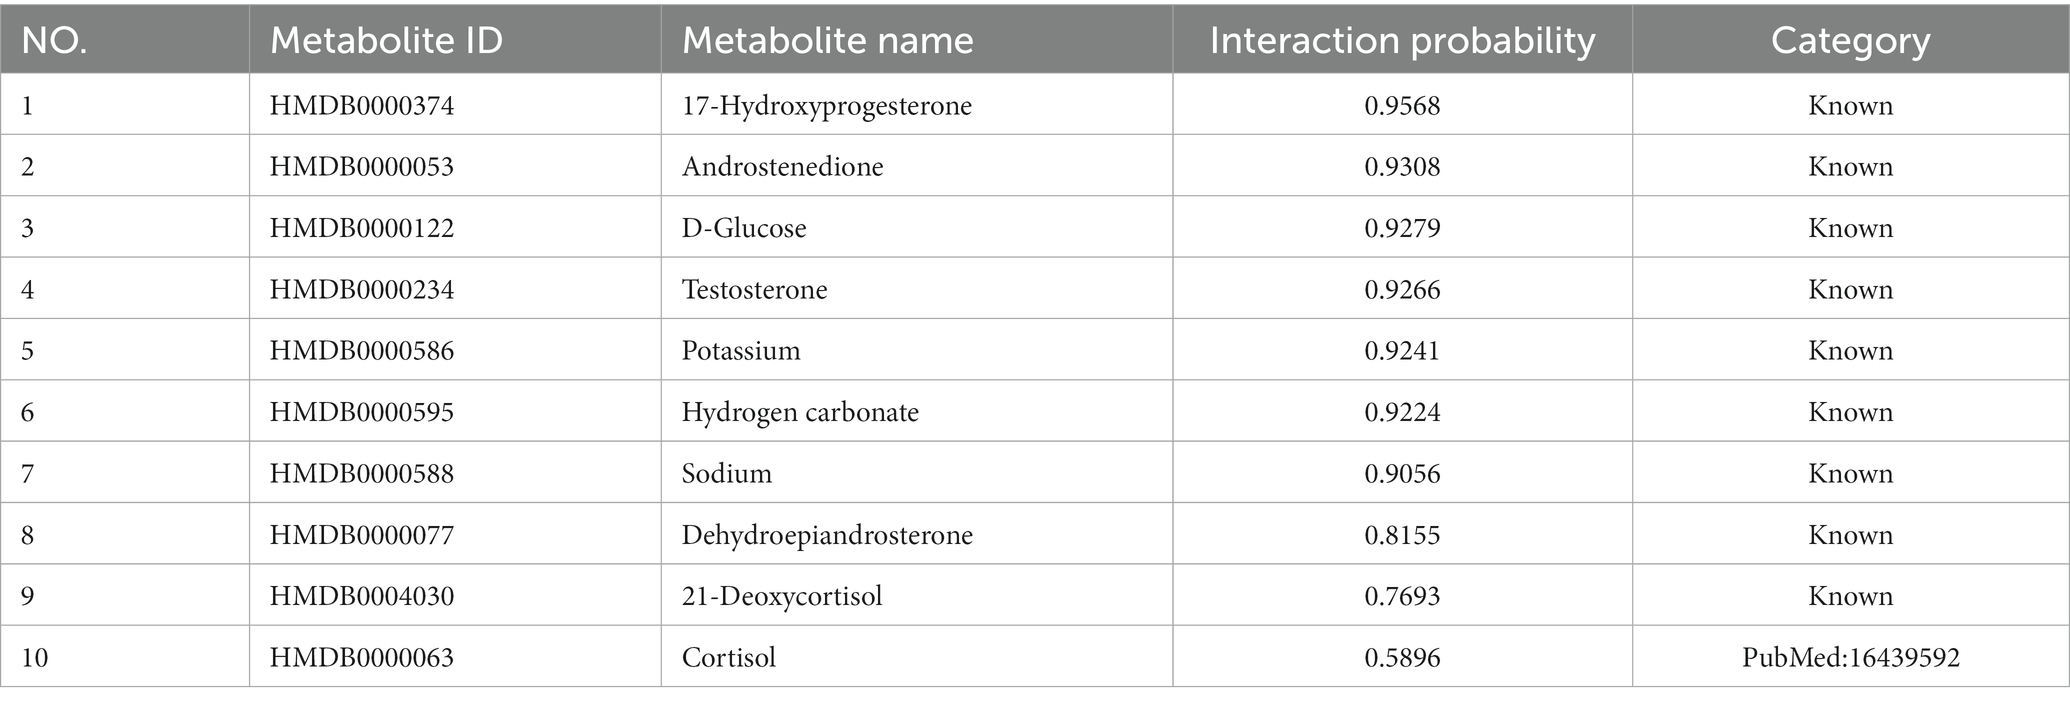
Table 3. 21-Hydroxylase deficiency’ related metabolites (top 10, descend).

Table 4. 3-Hydroxy-3-methylglutaryl-CoA lyase deficiency-related metabolites (top 15, descend).
It can be seen that all of the nine metabolites related to the disease “21-Hydroxylase deficiency” in the dataset appear in Table 3 and, more importantly, are located in the top nine. Similarly, all of the 13 metabolites related to disease “3-Hydroxy-3-methylglutaryl-CoA lyase deficiency” in the dataset are included in Table 4 and occupy the top 13. These findings demonstrate the good accuracy of LMFLNC. Note that LMFLNC also predicted that the metabolite ‘Cortisol “(HMDB0000063) were likely to interact with disease” “21-Hydroxylase deficiency” (the likelihood is 0.5896) and that metabolites “3-Hydroxybutyric acid (HMDB0000011)” and “Acetoacetic acid (HMDB0000060)” were likely to interact with disease “3-Hydroxy-3-methylglutaryl-CoA lyase deficiency” (likelihood of 0.4991 and 0.3614, respectively). Two of these three predictions have been verified, showing the potential of the LMFLNC model to discover latent metabolite-disease interactions.
In the same way, LMFLNC can compute the probabilities of diseases relating to a specific metabolite and predict new disease-metabolite interactions.
4. Conclusion
Existing metabolite-disease interaction prediction methods mainly leverage the global similarity network, which may be limited by noise and outliers. To solve this problem, we introduced a novel method, LMFLNC, to predict the metabolite-disease interaction. Extensive experiments were conducted on the collected dataset. The results show that the proposed LMFLNC method outperformed the baselines. LMFLNC also revealed several potential metabolite-disease interactions, such as “Cortisol (HMDB0000063),” relating to “21-Hydroxylase deficiency,” and “3-Hydroxybutyric acid (HMDB0000011)” and “Acetoacetic acid (HMDB0000060),” both relating to “3-Hydroxy-3-methylglutaryl-CoA lyase deficiency.”
Despite its promising performance, LMFLNC has the following weaknesses. (1) The predicted new metabolite-disease interactions need further verification. (2) The dataset scale, including the data quantity and type, is relatively small, and the information of metabolite structure and pathway can be incorporated to improve the performance and robustness of LMFLNC.
Our future research work will include the following: (1) exploring combining multi-kernel learning and logical matrix factorization in a study on the metabolite-disease interaction relationship and (2) exploring the application of our model in similar fields, such as microorganism-drug interactions and microorganism-metabolite interactions.
Data availability statement
The original contributions presented in the study are included in the article/supplementary material, further inquiries can be directed to the corresponding author.
Author contributions
YZ and YM wrote the manuscript and developed the algorithms. YM designed the concept and including the structure and content of the manuscript. YM, QZ, and YZ critically revised the manuscript. All authors reviewed and approved the final version of the manuscript.
Funding
This work was supported by Hubei Superior and Distinctive Discipline Group of “New Energy Vehicle and Smart Transportation.”
Acknowledgments
The authors thank LetPub (www.letpub.com) for its linguistic assistance during the preparation of this manuscript.
Conflict of interest
The authors declare that the research was conducted in the absence of any commercial or financial relationships that could be construed as a potential conflict of interest.
Publisher’s note
All claims expressed in this article are solely those of the authors and do not necessarily represent those of their affiliated organizations, or those of the publisher, the editors and the reviewers. Any product that may be evaluated in this article, or claim that may be made by its manufacturer, is not guaranteed or endorsed by the publisher.
References
1. Yao, Q , Xu, Y , Yang, H , Shang, D , Zhang, C , Zhang, Y, et al. Global prioritization of disease candidate metabolites based on a multi-omics composite network. Sci Rep. (2015) 5:17201. doi: 10.1038/srep17201
2. Shang, D , Li, C , Yao, Q , Yang, H , Xu, Y , Han, J, et al. Prioritizing candidate disease metabolites based on global functional relationships between metabolites in the context of metabolic pathways. PLoS One. (2014) 9:e104934. doi: 10.1371/journal.pone.0104934
3. Nicholson, JK , and Lindon, JC . Systems biology: metabonomics. Nature. (2008) 455:1054–6. doi: 10.1038/4551054a
4. Holmes, E , Wilson, ID , and Nicholson, JK . Metabolic phenotyping in health and disease. Cells. (2008) 134:714–7. doi: 10.1016/j.cell.2008.08.026
5. Ouyang, D , Xu, J , Huang, H , and Chen, Z . Metabolomic profiling of serum from human pancreatic cancer patients using 1H NMR spectroscopy and principal component analysis. Appl Biochem Biotechnol. (2011) 165:148–4. doi: 10.1007/s12010-011-9240-0
6. Reinke, SN , Gallart-Ayala, H , Gomez, C , Checa, A , Fauland, A , Naz, S, et al. Metabolomics analysis identifies different metabotypes of asthma severity. Eur Respir J. (2017) 49:1601740. doi: 10.1183/13993003.01740-2016
7. Ibanez, C , Simo, C , Martin-Alvarez, PJ , Kivipelto, M , Winblad, B , Cedazo-Minguez, A, et al. Toward a predictive model of Alzheimer's disease progression using capillary electrophoresis-mass spectrometry metabolomics. Anal Chem. (2012) 84:8532–40. doi: 10.1021/ac301243k
8. Wang, B , Chen, D , Chen, Y , Hu, Z , Cao, M , Xie, Q, et al. Metabonomic profiles discriminate hepatocellular carcinoma from liver cirrhosis by ultraperformance liquid chromatography-mass spectrometry. J Proteome Res. (2012) 11:1217–27. doi: 10.1021/pr2009252
9. Lei, X , and Tie, J . Prediction of disease-related metabolites using bi-random walks. PLoS One. (2019) 14:e0225380. doi: 10.1371/journal.pone.0225380
10. Wang, Y , Juan, L , Peng, J , Zang, T , and Wang, Y . Prioritizing candidate diseases-related metabolites based on literature and functional similarity. BMC Bioinform. (2019) 20:574. doi: 10.1186/s12859-019-3127-4
11. Mi, K , Jiang, Y , Chen, J , Lv, D , Qian, Z , Sun, H, et al. Construction and analysis of human diseases and metabolites network. Front Bioeng Biotechnol. (2020) 8:398. doi: 10.3389/fbioe.2020.00398
12. Ma, Y , He, T , and Jiang, X . Multi-network logistic matrix factorization for metabolite-disease interaction prediction. FEBS Lett. (2020) 594:1675–84. doi: 10.1002/1873-3468.13782
13. Duren, Z , Chen, X , Zamanighomi, M , Zeng, W , Satpathy, AT , Chang, HY, et al. Integrative analysis of single-cell genomics data by coupled nonnegative matrix factorizations. Proc Natl Acad Sci USA. (2018) 115:7723–8. doi: 10.1073/pnas.1805681115
14. Zhou, D , Bousquet, O , Lal, T , Weston, J , and Schölkopf, B . Learning with local and global consistency. Adv Neural Inf Proces Syst. (2004) 16:16.
15. Wang, B , Huang, L , Zhu, Y , Kundaje, A , Batzoglou, S , and Goldenberg, A . Vicus: exploiting local structures to improve network-based analysis of biological data. PLoS Comput Biol. (2017) 13:e1005621. doi: 10.1371/journal.pcbi.1005621
16. Johnson, CC , Logistic matrix factorization for implicit feedback data, in NIPS workshop on distributed machine learning and matrix computations (2014).
17. Liu, Y , Wu, M , Miao, C , Zhao, P , and Li, XL . Neighborhood regularized logistic matrix factorization for drug-target interaction prediction. PLoS Comput Biol. (2016) 12:e1004760. doi: 10.1371/journal.pcbi.1004760
18. Davis, AP , Grondin, CJ , Johnson, RJ , Sciaky, D , Mcmorran, R , Wiegers, J, et al. The comparative Toxicogenomics database: update 2019. Nucleic Acids Res. (2019) 47:D948–54. doi: 10.1093/nar/gky868
19. Wishart, DS , Feunang, YD , Marcu, A , Guo, AC , Liang, K , Vazquez-Fresno, R, et al. HMDB 4.0: the human metabolome database for 2018. Nucleic Acids Res. (2018) 46:D608–17. doi: 10.1093/nar/gkx1089
20. Xiao, Q , Luo, J , Liang, C , Cai, J , and Ding, P . A graph regularized non-negative matrix factorization method for identifying microRNA-disease associations. Bioinformatics. (2018) 34:239–8. doi: 10.1093/bioinformatics/btx545
21. Deng, L , Ye, D , Zhao, J , and Zhang, J . MultiSourcDSim: an integrated approach for exploring disease similarity. BMC Med Inform Decis Mak. (2019) 19:269. doi: 10.1186/s12911-019-0968-8
22. Resnik, P . Using information content to evaluate semantic similarity in a taxonomy. arXiv preprint cmp-lg/9511007. (1995).
24. Wang, JZ , Du, Z , Payattakool, R , Yu, PS , and Chen, CF . A new method to measure the semantic similarity of GO terms. Bioinformatics. (2007) 23:1274–81. doi: 10.1093/bioinformatics/btm087
Keywords: logistic matrix factorization, neighborhood regularization, metabolite-disease interaction, association prediction, vicus matrix
Citation: Zhao Y, Ma Y and Zhang Q (2023) Metabolite-disease interaction prediction based on logistic matrix factorization and local neighborhood constraints. Front. Psychiatry 14:1149947. doi: 10.3389/fpsyt.2023.1149947
Edited by:
Tao Wang, Northwestern Polytechnical University, ChinaReviewed by:
Chenchen Li, University of Pennsylvania, United StatesXueqing Chen, Brigham and Women’s Hospital and Harvard Medical School, United States
Copyright © 2023 Zhao, Ma and Zhang. This is an open-access article distributed under the terms of the Creative Commons Attribution License (CC BY). The use, distribution or reproduction in other forums is permitted, provided the original author(s) and the copyright owner(s) are credited and that the original publication in this journal is cited, in accordance with accepted academic practice. No use, distribution or reproduction is permitted which does not comply with these terms.
*Correspondence: Yuanyuan Ma, chonghua_1983@126.com