 Deng Pan
 Dandan Cheng2
 Chuan Hu
 Wencheng Yu
 Tao Xu
- 1Department of Pulmonary and Critical Care Medicine, Affiliated Hospital of Qingdao University, Qingdao, China
- 2Department of Hematology, Tongji Medical College, Tongji Hospital, Huazhong University of Science and Technology, Wuhan, China
- 3Department of Joint Surgery, Affiliated Hospital of Qingdao University, Qingdao, China
- 4Department of Biliary-Pancreatic Surgery, Tongji Medical College, Tongji Hospital, Huazhong University of Science and Technology, Wuhan, China
Background: The global COVID-19 epidemic remains severe, with the cumulative global death toll reaching more than 207,170 as of May 2, 2020 (1).
Purpose: Our research objective is to establish a reliable nomogram to predict mortality in COVID-19 patients. The nomogram can help us distinguish between patients who are at high risk of death and need close attention.
Patients and Methods: For the single-center retrospective study, we collected 21 cases of patients who died in the critical illness area of the Optical Valley Branch of Tongji Hospital, Huazhong University of Science and Technology, from February 9 to March 10. Additionally, we selected 99 patients discharged during this period for analysis. The nomogram was constructed to predict the mortality for COVID-19 patients using the primary group of 120 patients and was validated using an independent cohort of 84 patients. We used multivariable logistic regression analysis to construct the prediction model. The nomogram was evaluated for calibration, differentiation, and clinical usefulness.
Results: The predictors included in the nomogram were c-reactive protein, PaO2/FiO2, and cTnI. The areas under the curves of the nomogram were 0.988 (95% CI: 0.972–1.000) and 0.956 (95% CI, 0.874–1.000) in the primary and validation groups, respectively. Decision curve analysis suggests that the nomogram may have clinical usefulness.
Conclusion: This study provides a nomogram containing c-reactive protein, PaO2/FiO2, and cTnI that can be conveniently used to predict individual mortality in COVID-19 patients. Next, we will collect as many cases as possible from multiple centers to build a more reliable nomogram to predict mortality for COVID-19 patients.
Introduction
Since the outbreak of COVID-19 in Wuhan, Hubei province, in December 2019, it has had a major impact on people's lives, health, and property safety. It has rapidly expanded to 34 provincial divisions of China (2–4). As of April 28, 2020, the total number of confirmed cases in Wuhan has reached 68,128, accounting for 80.75% of the total number of confirmed cases in China, and 4,512 people have died in Wuhan, accounting for 97.18% of the total number of deaths in China (5).
SARS-CoV-2 is a binuclear virus that has a wide clinical spectrum of infection (6–8). In the past 2 months, only a few studies have analyzed prognostic factors for death, with repeated emphasis on factors such as age, lymphocytosis, leukocytosis, and elevated ALT (7). Thus, some of these potential prognostic factors need further validation, and a scoring system that accurately predicts the possible mortality risk is needed. Nomograms are used for multiple indicators to diagnose or predict disease onset or progression, making prognostic model results easier to read. Therefore, nomograms have been gradually applied in medical research and clinical practice (9, 10).
Here, we randomly selected some patients with definite clinical outcome (death or discharge) who had been admitted to the critical care unit of the Optical Valley Branch of Tongji Hospital, Huazhong University of Science and Technology, as of March 10, 2020 (11). The aim of our study was to establish a nomogram that incorporated demographics, clinical characteristics, and laboratory results to predict individual mortality in COVID-19 patients.
Materials and Methods
Patient Selection
We selected COVID-19 patients admitted to the critical illness area of the Optical Valley Branch of Tongji Hospital, Huazhong University of Science and Technology, from February 9, 2020, to March 10, 2020.
Patients were enrolled in this cohort if they: (1) were more than 18 years old; (2) were diagnosed with COVID-19 by multiplex real-time RT-PCR; (3) had complete clinical records of medical history and laboratory results. Patients were excluded if they: (1) were suspected with COVID-19; (2) had incomplete clinical records of medical history and laboratory results.
Study Variables
We collected demographics, comorbidities, routine laboratory tests, immunological indicators, radiological images, and inpatient treatments (12). For each patient, the baseline characters were screened: gender, age, leukocytes, platelet–lymphocyte ratio (PLR), neutrophil–lymphocyte ratio (NLR), Charlson Comorbidity Index (CCI), CURB-65 score, PaO2/FiO2, interleukin-1β (IL-1β), interleukin-2R (IL-2R), interleukin-6 (IL-6), interleukin-8 (IL-8), interleukin-10 (IL-10), tumor necrosis factor-α (TNF-α), cardiac troponin I (cTnI), brain natriuretic peptide (BNP), calcitonin, c-reactive protein (CRP), lactate dehydrogenase (LDH), d-dimer, fibrinogen, history of hypertension, heart failure, coronary heart disease (CHD), diabetes, cough, expectoration, diarrhea, shortness of breath, body temperature above 38°C, and X-ray or CT findings.
Construction of the Nomogram
We used the chi-square test for univariate analysis. Multivariable regression models were developed by incorporating meaningful factors in univariate analyses. Univariate and multivariate regression analysis was used to analyze the risk factors in the primary cohort (13). Then we construct a nomogram on the basis of the multivariate logistic regression model.
Statistical Analysis
Patients' demographic and clinical characteristics were analyzed using descriptive methods, with standard summary statistics including the median, interquartile range (IQR), and proportions. Categorical variables were processed by Chi-square or Fisher's exact tests, as appropriate. We tested the accuracy of the nomograms by discrimination and calibration both in the primary and the validation cohort. We used the receiver operating characteristic curve (ROC) to assess the discriminative ability of the nomogram and then assessed the area under the curve (AUC) (14, 15). Calibration curves were used to compare the association between actual outcomes and predicted probabilities (16). Decision curve analysis (DCA) was performed by calculating the net benefits for a range of threshold probabilities to evaluate the clinical utility of the nomogram (17, 18). Statistical analysis was performed using SPSS 23 (IBM, Chicago, IL, USA) and R version 3.4.4. All statistical tests were two-tailed, and a P < 0.05 was considered to be statistically significant.
Results
Patient Characteristics
Between February 9, 2020, and March 10, 2020, from more than 600 patients in the critical illness area of the Optical Valley Branch of Tongji Hospital, 120 cases were selected for inclusion in the study by means of a random number table. The average age of the 120 patients was 62.16 years old, and there were 50 females and 70 males (19). The majority of the patients were over 60 years old (69.20%). Among the 120 cases, 90 (75.0%) developed cough symptoms with or without expectoration, 62 (51.7%) had high fever (≥38°C), 68 (56.7%) had mild shortness of breath, and 15 (12.5%) developed diarrhea. The vast majority of patients exhibited bilateral invasion in chest X-ray and CT, mostly with a patchy and ground-glass appearance (Table 1).
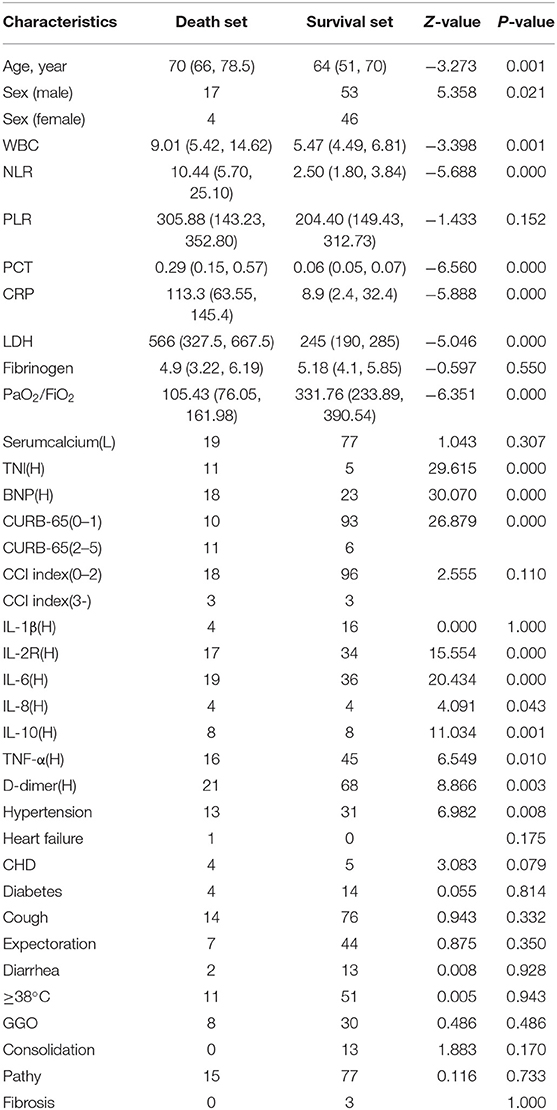
Table 1. Results of the univariate association analyses.
Independent Prognostic Factors
We used univariate and multivariate analyses to identify the prognostic factors (20, 21). The univariate analysis revealed that age (p = 0.001), Male/Female (p = 0.021), WBC (p = 0.001), NLR (p = 0.000), PCT (p = 0.000), CRP (p = 0.000), LDH (p = 0.000), PaO2/FiO2 (p = 0.000), Serum calcium (p = 0.307), cTnI (p = 0.000), BNP (p = 0.000), CURB-65 (p = 0.000), IL-2R (p = 0.000), IL-6 (p = 0.000), IL-8 (p = 0.043), IL-10 (p = 0.001), TNF-α (p = 0.01), D-dimer (p = 0.003), and Hypertension (p = 0.008) were significant prognostic factors. The multivariate analysis revealed that CRP (p = 0.004), PaO2/FiO2 (p = 0.002), and cTnI (p = 0.016) were independent prognostic factors for predicting the mortality of COVID-19 patients (22).
Development and Validation of a Nomogram
Multivariate logistic regression analysis determined that CRP, PaO2/FiO2, and cTnI were independent predictors (Table 2). The model with three independent predictors is established and represented by a nomogram (Figure 1).
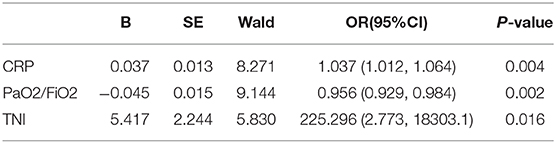
Table 2. Multivariate logistic regression of death in COVID-19 patients.
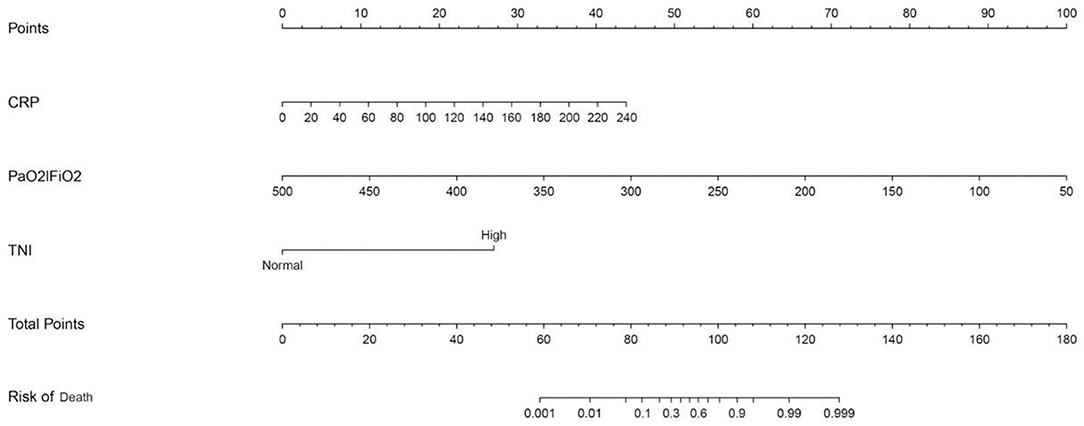
Figure 1. Nomogram predicting mortality for COVID-19 patients with three available factors: CRP, PaO2/FiO2, and cTnI.
We predicted the probability of death in patients with COVID-19 by calculating the sum of points in the nomogram corresponding to patient characteristics. Regarding the clinical application of this nomogram, we assumed that, if a patient's CRP was 20 mg/L, the PaO2/FiO2 was 350, and the cTnI was increased, then the corresponding score of this patient was 3+33+26, a total of 62 points, so the corresponding risk of death of this patient was between 0.001 and 0.01, and this patient was relatively safe.
The AUC for the prediction nomogram was 0.988, 95% CI, 0.972–1.000 (23). The AUC for CRP was 0.910. The AUC for PaO2/FiO2 was 0.942. The AUC for cTnI was 0.737. The nomogram decision curve analysis is shown in Figure 2. The calibration curve of the nomogram for the probability of mortality demonstrated good agreement between prediction and observation in the primary cohort (Figure 2) (24). The decision curve showed that if the threshold probability of a patient or doctor is >0%, using the nomogram to predict the mortality for COVID-19 patients adds more benefit. Within this range, net benefit was comparable, with several overlaps, on the basis of the nomogram (25).
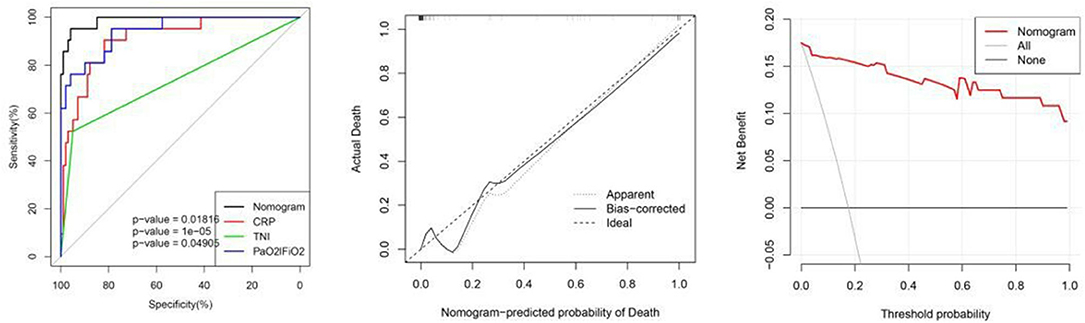
Figure 2. From left to right: ROC curves of the nomogram and the three factors; calibration curve of the nomogram in the cohort; decision curve analysis for the nomogram. The y-axis measures the net benefit. The red line represents the nomogram. The gray line represents the assumption that all patients have died. The thin black link represents the assumption that no patients have died. The net benefit was calculated by subtracting the proportion of all patients who are false positive from the proportion who are true positive, weighting by the relative harm of forgoing treatment compared with the negative consequences of unnecessary treatment.
Validation was performed by using another 84 COVID-19 patients. In the validation cohort, the independent risk factors included in the nomogram were examined. The AUC of the nomogram was 0.956 (95% CI: 0.874–1.000). Figure 3 shows that the calibration plot for the probability of mortality demonstrated good agreement between the prediction by nomogram and actual observation.
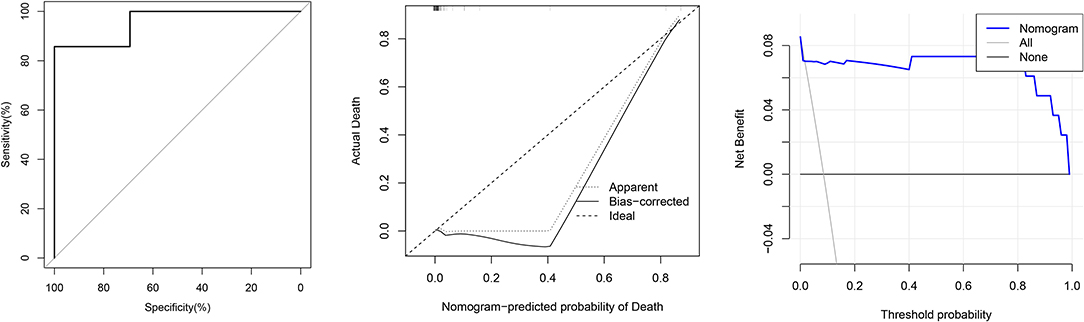
Figure 3. From left to right: ROC curves of the Nomogram and the three factors; calibration curve of the nomogram in the cohort; decision curve analysis for the nomogram.
Discussion
Since 2003, coronavirus has caused a number of major public health events (26, 27). Generally, it was not until the outbreak of severe acute respiratory syndrome (SARS) in Guangdong, China, in 2002 and 2003 that the coronavirus was found to be highly pathogenic to humans. Another highly pathogenic coronavirus is the Middle East respiratory syndrome (MERS) coronavirus, which emerged in 2012 in Middle Eastern countries (28–31). COVID-19 is another highly pathogenic coronavirus that has been added to human history. Although COVID-19 has a mortality rate of <3% compared to SARS (9.6%) and MERS (34%), its effects remain extremely sudden and devastating (32, 33).
Previous studies have shown that coronaviruses can cause respiratory and intestinal infections (34). According to recent reports, the most common symptoms of COVID-19 patients are fever, cough, myalgia, and fatigue, while the less common are expectoration, hemoptysis, and diarrhea (35–39). Most patients have mild symptoms and good prognosis. Mild patients may have only a low fever and mild weakness, with no obvious signs of pneumonia (40). In the late stage of infection, a variety of complications occur in critically ill patients, including ARDS, septic shock, refractory metabolic acidosis, acute myocardial injury, disseminated intravascular coagulation, and even death (5, 6). Therefore, early diagnosis and early assessment of the patient's prognosis are crucial for controlling the outbreak.
Corticosteroids were used extensively during the outbreaks of severe SARS and MERS and are being applied in COVID-19 patients. Corticosteroids suppress inflammation in the lungs but also inhibit immune responses and pathogen clearance at the same time (41). The clinical benefit of corticosteroids in COVID-19 needs further clinical trials to confirm (42, 43).
In previous studies, several prognostic models have been developed. For example, the NLR was the most effective prognostic factor affecting prognosis for severe COVID-19 patients (44).
In our study, this nomogram based on three variables, CRP, PaO2/FiO2, and cTnI, can provide a more accurate assessment and prediction of mortality at admission for COVID-19 patients. If patients with high mortality rates are properly and promptly identified, they should be more likely to benefit from nutritional support in nursing care and close attention in clinical care, which will ultimately have a positive impact on their recovery (45, 46).
The variables in the nomogram we constructed were easily accessible from routine clinical work. As a result, clinicians can use this simple, intuitive predictive tool to draw a few lines in a few seconds to make a quick assessment of a patient's prognosis with no computational difficulty. Additionally, our model can help clinical workers rationally allocate medical resources to reduce the fatality rate of COVID-19 when medical resources are scarce.
There are still some limitations to our study. First, the study was at a single center with a small sample, and the next step is to include as many cases as possible from multiple centers to build a more reliable predicting nomogram for mortality in COVID-19 patients. Second, we excluded patients whose case data were incomplete, which could have resulted in selection bias.
Conclusions
To sum up, to better identify the prognosis of COVID-19 patients, identify severe patients as early as possible, improve the cure rate, and reduce the fatality rate, we constructed a nomogram based on 120 patients to predict mortality. The proposed nomogram considered three independent risk factors, namely, CRP, PaO2/FiO2, and cTnI. We have confirmed that this nomogram has excellent discrimination and clinical availability.
Data Availability Statement
The raw data supporting the conclusions of this article will be made available by the authors, without undue reservation.
Ethics Statement
The studies involving human participants were reviewed and approved by Medical ethics committee of affiliated hospital of Qingdao university. The ethics committee waived the requirement of written informed consent for participation. Written informed consent was obtained from the individual(s) for the publication of any potentially identifiable images or data included in this article.
Author Contributions
DP: data analysis and visualization. DP, DC, YC, and CH: writing original draft. FZ, TX, and WY: review and editing. All authors contributed to the article and approved the submitted version.
Funding
This work was supported by Qingdao City Science and Technology Special Fund No.20-4-1-5-nsh.
Conflict of Interest
The authors declare that the research was conducted in the absence of any commercial or financial relationships that could be construed as a potential conflict of interest.
Acknowledgments
Thanks to the medical workers who have contributed to the epidemic and those in all industries involved in the prevention and control of the epidemic. Finally, we pay tribute to our patients.
References
2. Lu H, Stratton CW, Tang YW. Outbreak of pneumonia of unknown etiology in Wuhan, China: The mystery and the miracle. J Med Virol. (2020) 92:401–2. doi: 10.1002/jmv.25678
3. Hui DS, Azhar EI, Madani TA, Ntoumi F, Kock R, Dar O, et al. The continuing 2019-nCoV epidemic threat of novel coronaviruses to global health - the latest 2019 novel coronavirus outbreak in Wuhan, China. Int J Infect Dis. (2020) 91:264–6. doi: 10.1016/j.ijid.2020.01.009
4. Wang Z, Yang B, Li Q, Wen L, Zhang R. Clinical features of 69 cases with coronavirus disease 2019 in Wuhan, China. Clin Infect Dis. (2020) ciaa272. doi: 10.1093/cid/ciaa272. [Epub ahead of print].
5. WJW. The Official Website of Hubei Provincial Health Committee. (2020). Available online at: http://wjw.hubei.gov.cn/ (accessed February 19, 2020).
6. Wang D, Hu B, Hu C, Zhu F, Liu X, Zhang J, et al. Clinical characteristics of 138 hospitalized patients with (2019). novel coronavirus-infected pneumonia in Wuhan, China. JAMA. (2020) 323:1061–9. doi: 10.1001/jama.2020.1585
7. Chen N, Zhou M, Dong X, Qu J, Gong F, Han Y, et al. Epidemiological and clinical characteristics of 99 cases of 2019 novel coronavirus pneumonia in Wuhan, China: a descriptive study. Lancet. (2020) 395:507–13. doi: 10.1016/S0140-6736(20)30211-7
8. Döhla M, Boesecke C, Schulte B, Diegmann C, Sib E, Richter E, et al. Rapid point-of-care testing for SARS-CoV-2 in a community screening setting shows low sensitivity. Public Health. (2020) 182:170–2. doi: 10.1016/j.puhe.2020.04.009
9. Lei Z, Li J, Wu D, Xia Y, Wang Q, Si A, et al. Nomogram for preoperative estimation of microvascular invasion risk in Hepatitis B virus-related hepatocellular carcinoma within the Milan criteria. JAMA Surg. (2016) 151:356–63. doi: 10.1001/jamasurg.2015.4257
10. Wu XX, Chen RP, Chen RC, Gong HP, Wang BF, Li YL, et al. Nomogram predicting cancer-specific mortality in patients with esophageal adenocarcinoma: a competing risk analysis. J Thorac Dis. (2019) 11:2990–3003. doi: 10.21037/jtd.2019.07.56
11. Zhou F, Yu T, Du R, Fan G, Liu Y, Liu Z, et al. Clinical course and risk factors for mortality of adult inpatients‘ with COVID-19 in Wuhan, China: a retrospective cohort study. Lancet. (2020) 395:1054–62. doi: 10.1016/S0140-6736(20)30566-3
12. Guo L, Wei D, Zhang X, Wu Y, Li Q, Zhou M, et al. Clinical features predicting mortality risk in patients with viral pneumonia: the MuLBSTA score. Front Microbiol. (2019) 10:2752. doi: 10.3389/fmicb.2019.02752
13. Wu S, Zheng J, Li Y, Yu H, Shi S, Xie W, et al. A radiomics nomogram for the preoperative prediction of lymph node metastasis in bladder cancer. Clin Cancer Res. (2017) 23:6904–11. doi: 10.1158/1078-0432.CCR-17-1510
14. Heyard R, Timsit JF, Held L, COMBACTE-MAGNET consortium. Validation of discrete time-to-event prediction models in the presence of competing risks. Biom J. (2020) 62:643–57. doi: 10.1002/bimj.201800293
15. Wolbers M, Koller MT, Witteman JCM, Steyerberg EW. Prognostic models with competing risks: methods and application to coronary risk prediction. Epidemiology. (2009) 20:555–61. doi: 10.1097/EDE.0b013e3181a39056
16. Chen S, Liu Y, Yang J, Liu Q, You H, Dong Y, et al. Development and validation of a nomogram for predicting survival in male patients with breast cancer. Front Oncol. (2019) 9:361. doi: 10.3389/fonc.2019.00361
17. Vickers AJ, Elkin EB. Decision curve analysis: a novel method for evaluating prediction models. Med Decis Making. (2006) 26:565–74. doi: 10.1177/0272989X06295361
18. Cui J, Wang L, Tan G, Chen W, He G, Huang H, et al. Development and validation of nomograms to accurately predict risk of recurrence for patients with laryngeal squamous cell carcinoma: Cohort study. Int J Surg. (2020) 76:163–170. doi: 10.1016/j.ijsu.2020.03.010
19. Burgos R, Bretón I, Cereda E, Desport JC, Dziewas R, Genton L, et al. ESPEN guideline clinical nutrition in neurology. Clin Nutr. (2018) 37:354–96. doi: 10.1016/j.clnu.2017.09.003
20. Songc W, Lv CG, Miao D, Zhu Z, Wu Q, Wang Y, et al. Development and validation of a nomogram for predicting survival in patients with gastrointestinal stromal tumours. Eur J Surg Oncol. (2018) 44:1657–65. doi: 10.1016/j.ejso.2018.07.004
21. Zhang C, Qin L, Li K, Wang Q, Zhao Y, Xu B, et al. A novel scoring system for prediction of disease severity in COVID-19. Front Cell Infect Microbiol. (2020) 10:318. doi: 10.3389/fcimb.2020.00318
22. Fu Y, Sun Y, Lu S, Yang Y, Wang Y, Xu F. Impact of blood analysis and immune function on the prognosis of patients with COVID-19. Cold Spring Harbor Lab. (2020). doi: 10.1101/2020.04.16.20067587. [Epub ahead of print].
23. Yan W, Lei X, Pengfei Y, Lin N, Huang X, Pan W, et al. Survival prediction in high-grade osteosarcoma using radiomics of diagnostic computed tomography. Ebiomedicine. (2018) 34:27–34. doi: 10.1016/j.ebiom.2018.07.006
24. Liu XH, Wu XR, Zhou C, Zheng X, Ke J, Liu H, et al. Conversion is a risk factor for postoperative anastomotic leak in rectal cancer patients - a retrospective cohort study. Int J Surg. (2018) 53:298–303. doi: 10.1016/j.ijsu.2018.01.024
25. Vickers AJ, Cronin AM, Elkin EB, Gonen M. Extensions to decision curve analysis, a novel method for evaluating diagnostic tests, prediction models and molecular markers. BMC Med Inform Decis Mak. (2008) 8:53. doi: 10.1186/1472-6947-8-53
26. Kim D, Lee JY, Yang JS, Kim JW, Kim VN, Chang H. The architecture of SARS-CoV-2 transcriptome. Cell. (2020) 181:914–21.e10. doi: 10.1101/2020.03.12.988865
27. Kang S, Peng W, Zhu Y, Lu S, Zhou M, Lin W, et al. Recent progress in understanding 2019. novel coronavirus associated with human respiratory disease: detection, mechanism and treatment. Int J Antimicrob Agents. (2020) 55:105950. doi: 10.1016/j.ijantimicag.2020.105950
28. Drosten C, Günther S, Preiser W, van der Werf S, Brodt HR, Becker S, et al. Identification of a novel coronavirus in patients with severe acute respiratory syndrome. N Engl J Med. (2003) 348:1967–76. doi: 10.1056/NEJMoa030747
29. Ksiazek TG, Erdman D, Goldsmith CS, Zaki SR, Peret T, Emery S, et al. A novel coronavirus associated with severe acute respiratory syndrome. NEngl J Med. (2003) 348:1953–66. doi: 10.1056/NEJMoa030781
30. Zaki AM, van Boheemen S, Bestebroer TM, Osterhaus AD, Fouchier RA. Isolation of a novel coronavirus from a man with pneumonia in Saudi Arabia. N Engl J Med. (2012) 367:1814–20. doi: 10.1056/NEJMoa1211721
31. Zhong N, Zheng B, Li Y, Poon L, Xie Z, Chan K, et al. Epidemiology and cause of severe acute respiratory syndrome (sars) in guangdong, people's republic of china, in February, 2003. Lancet. (2003) 362:1353–8. doi: 10.1016/S0140-6736(03)14630-2
32. Jiang X, Rayner S, Luo MH. Does SARS-CoV-2 has a longer incubation period than SARS and MERS? J Med Virol. (2020) 92:476–8. doi: 10.1002/jmv.25708
33. Coleman CM, Sisk JM, Mingo RM, Nelson EA, White JM, Frieman MB. Abl kinase inhibitors are potent inhibitors of sars-cov and mers-cov fusion. J Virol. (2016) 90:8924–33. doi: 10.1128/JVI.01429-16
34. Han Y, Du J, Su H, Zhang J, Zhu G, Zhang S, et al. Identification of diverse bat alphacoronaviruses and betacoronaviruses in China provides new insights into the evolution and origin of coronavirus-related diseases. Front Microbiol. (2019) 10:1900. doi: 10.3389/fmicb.2019.01900
35. Kui L, Fang YY, Deng Y, Liu W, Wang MF, Ma JP, et al. Clinical characteristics of novel coronavirus cases in tertiary hospitals in hubei province. Chin Med J. (2020) 133:1025–31. doi: 10.1097/CM9.0000000000000744
36. Zhu N, Zhang D, Wang W, Li X, Yang B, Song J, et al. A novel coronavirus from patients with pneumonia in china, 2019. N Engl J Med. (2020) 382:727–33. doi: 10.1056/NEJMoa2001017
37. Wang M, Zhou Y, Zong Z, Liang Z, Cao Y, Tang H, et al. A precision medicine approach to managing 2019 novel coronavirus pneumonia. Precis Clin Med. (2020) 3:14–21. doi: 10.1093/pcmedi/pbaa002
38. Wang Z, Chen X, Lu Y, Chen F, Zhang W. Clinical characteristics and therapeutic procedure for four cases with 2019 novel coronavirus pneumonia receiving combined Chinese and Western medicine treatment. Biosci Trends. (2020) 14:64–8. doi: 10.5582/bst.2020.01030
39. Wu Y, Chi Chen CS, Chan YJ. Overview of the 2019. novel coronavirus (2019-nCoV): the pathogen of severe specific contagious pneumonia (SSCP). J Chin Med Assoc. (2020) 83:1. doi: 10.1097/JCMA.0000000000000270
40. Xu YH, Dong JH, An WM, Lv XY, Yin XP, Zhang JZ, et al. Clinical and computed tomographic imaging features of novel coronavirus pneumonia caused by SARS-CoV-2. J Infect. (2020) 80:394–400. doi: 10.1016/j.jinf.2020.02.017
41. Russell CD, Millar JE, Baillie JK. Clinical evidence does not support corticosteroid treatment for 2019-nCoV lung injury. Lancet. (2020) 395:473–5. doi: 10.1016/S0140-6736(20)30317-2
42. Chen RC, Tang XP, Tan SY, Liang BL, Wan ZY, Fang JQ, et al. Treatment of severe acute respiratory syndrome with glucosteroids: the Guangzhou experience. Chest. (2006) 129:1441–52. doi: 10.1378/chest.129.6.1441
43. Zhao JP, Hu Y, Du RH, Chen ZS, Jin Y, Zhou M, et al. [Expert consensus on the use of corticosteroid in patients with 2019-nCoV pneumonia]. Zhonghua Jie He He Hu Xi Za Zhi. (2020) 43:183–4. doi: 10.3760/cma.j.issn.1001-0939.2020.03.008
44. Liu J, Liu Y, Xiang P, Pu L, Xiong H, Li C, et al. Neutrophil-to-lymphocyte ratio predicts critical illness patients with 2019 coronavirus disease in the early stage. J Transl Med. (2020) 18:206. doi: 10.1186/s12967-020-02374-0
45. Filomena Gomes, Peter W. Risk of malnutrition is an independent predictor of mortality, length of hospital stay, and hospitalization costs in stroke patients. J Stroke Cerebrovasc Dis. (2016) 25:799–806. doi: 10.1016/j.jstrokecerebrovasdis.2015.12.017
Keywords: nomogram, predict, mortality, COVID-19, patients
Citation: Pan D, Cheng D, Cao Y, Hu C, Zou F, Yu W and Xu T (2020) A Predicting Nomogram for Mortality in Patients With COVID-19. Front. Public Health 8:461. doi: 10.3389/fpubh.2020.00461
Received: 12 May 2020; Accepted: 22 July 2020;
Published: 11 August 2020.
Edited by:
Banu Cakir, Hacettepe University, TurkeyReviewed by:
Eugenia M. Bastos, Independent Researcher, Sommerville, MA, United StatesLira Pi, The University of Iowa, United States
Copyright © 2020 Pan, Cheng, Cao, Hu, Zou, Yu and Xu. This is an open-access article distributed under the terms of the Creative Commons Attribution License (CC BY). The use, distribution or reproduction in other forums is permitted, provided the original author(s) and the copyright owner(s) are credited and that the original publication in this journal is cited, in accordance with accepted academic practice. No use, distribution or reproduction is permitted which does not comply with these terms.
*Correspondence: Wencheng Yu, ywcheng00@sina.com; Tao Xu, xutao1008@163.com