ALL classification using neural ensemble and memetic deep feature optimization
 Muhammad Awais1,2*
  Riaz Ahmad3,4 Nabeela Kausar3
  Ahmed Ibrahim Alzahrani5 Nasser Alalwan5
  Anum Masood6,7*
- 1Department of Electrical and Computer Engineering, COMSATS University Islamabad, Wah, Pakistan
- 2Department of Computer Engineering, TED University Ankara, Ankara, Türkiye
- 3Department of Computer Science, Iqra University Islamabad, Islamabad, Pakistan
- 4Department of Computer Science, COMSATS University Islamabad, Wah, Pakistan
- 5Department of Computer Science, Community College, King Saud University, Riyadh, Saudi Arabia
- 6Department of Physics, Norwegian University of Science and Technology, Trondheim, Norway
- 7Department of Radiology, Boston Children's Hospital, Boston, MA, United States
Acute lymphoblastic leukemia (ALL) is a fatal blood disorder characterized by the excessive proliferation of immature white blood cells, originating in the bone marrow. An effective prognosis and treatment of ALL calls for its accurate and timely detection. Deep convolutional neural networks (CNNs) have shown promising results in digital pathology. However, they face challenges in classifying different subtypes of leukemia due to their subtle morphological differences. This study proposes an improved pipeline for binary detection and sub-type classification of ALL from blood smear images. At first, a customized, 88 layers deep CNN is proposed and trained using transfer learning along with GoogleNet CNN to create an ensemble of features. Furthermore, this study models the feature selection problem as a combinatorial optimization problem and proposes a memetic version of binary whale optimization algorithm, incorporating Differential Evolution-based local search method to enhance the exploration and exploitation of feature search space. The proposed approach is validated using publicly available standard datasets containing peripheral blood smear images of various classes of ALL. An overall best average accuracy of 99.15% is achieved for binary classification of ALL with an 85% decrease in the feature vector, together with 99% precision and 98.8% sensitivity. For B-ALL sub-type classification, the best accuracy of 98.69% is attained with 98.7% precision and 99.57% specificity. The proposed methodology shows better performance metrics as compared with several existing studies.
1 Introduction
Blood is an essential element for life and general health of human beings. It performs several crucial functions including transport of nutrients and waste materials, controlling flow of oxygen and overall immune system of body. Human blood is composed of three main types of blood cells, namely, erythrocytes, thrombocytes, and leukocytes. Each cell type performs a specific function in the human body. For example, leukocytes also referred as white blood cells (WBCs) are responsible for human immune and inflammatory response against diseases. Any abnormality in the structure and count of blood cells leads to certain diseases. As an example, leukemia, a blood malignancy, is caused due to an excessive leukocyte production in the bone marrows.
Leukemia is a widespread disease with over 475,000 new cases diagnosed worldwide each year and 312,000 annual deaths (Sung et al., 2021). With 62,770 new cases and 23,670 deaths anticipated, leukemia remains a significant public health concern for the United States in 2024 (Siegel et al., 2024). It is primarily categorized into two types: acute and chronic. Acute leukemia is distinguished by the rapid and unregulated proliferation of immature white blood cells within the bone marrow, which displaces the healthy cells. The fast progression of disease requires prompt response. On the other hand, the chronic leukemia is a slow progressing disease in which gradual accumulation of mature but abnormal WBCs takes place. Although these cells are typically more functional than those found in acute leukemia, they are aberrant and can still affect the normal functionality of blood and bone marrow. The acute and chronic categories of leukemia are further classified into myeloid and lymphoblastic sub-types, based on their afflicted cells. The acute lymphoblastic type of leukemia (ALL) affects the lymphoid cells and has high likelihood of occurring in the children and young adults. It represents ~14% of all new leukemia cases. Approximately 90% of ALL cases occur in individuals younger than 20 years old, with a peak incidence observed in children aged 2–5 (Sung et al., 2021). An estimated 6,550 new cases of ALL are expected in the US in 2024 (Siegel et al., 2024).
A form of acute lymphoblastic leukemia called B-cell acute lymphoblastic leukemia (B-ALL) develops from abnormal B-cell progenitors. Various sub types of B-ALL are further categorized based on distinct genetic, molecular, and immunophenotypic characteristics. Sub types of B-ALL include pre-cursor, mature, common, and pro B cell all.
The classical approach for the diagnosis of leukemia involves visual analysis of microscopic blood images by hematologists. This manual process needs human supervision; therefore, it is a time-consuming process and often prone to classification errors due to several factors (Matek et al., 2019). Thus, an accurate, computer-aided diagnosis of leukemia is highly desirable (Khattak et al., 2022). Among the modern approaches of computer vision, deep CNNs have demonstrated significant potential for a number of classification tasks in the biomedical domain. However, the computer vision-based blood analysis for leukemia diagnosis is difficult due to the small size, irregular structure, and physical similarities across various blood components (Kassani et al., 2019). Moreover, the performance of CNNs depends heavily on their depth and structure. To obtain a high level of accuracy requires a large, accurately labeled dataset for deep neural network training from the scratch. However, due to a number of limitations, such datasets are frequently not easily accessible in the biomedical domain. In such a context, transfer learning stands out as the recommended strategy, entailing the retraining of a deep CNN originally trained on a substantially extensive dataset to suit a specific classification task. A number of pretrained CNNs have achieved high top-1 accuracy on benchmark datasets. GoogleNet (Szegedy et al., 2015), Resnet (He et al., 2016), Darknet (Redmon and Farhadi, 2018), Densenet (Howard et al., 2017), and Inception (Chollet, 2017) are a few to mention. Recent research uses deep CNNs as extractors of features, which are then utilized to train outer classifiers. This leverages the power of transfer learning, allows for task-specific adaptation, and provides an efficient way to build accurate models. However, due to a large number of layers, deep CNNs extract high dimensionality feature representations from the input data. Afterward, feature selection is done to reduce the dimensionality of these extracted features, making them more manageable and potentially more informative. Efforts in current research are directed toward optimizing the computational efficiency and memory demands of the classification pipeline. The primary goal is to attain superior accuracy while operating with a more streamlined feature set (Khan et al., 2020; Ahmad et al., 2023b).
The remainder of the study is structured as follows: Section 2 presents a literature review of some recently published studies in the domain of leukemia identification. Section 3 offers an elaborate exposition of the proposed framework for ALL identification. In Section 4, we present and analyze simulation results, while discussion is concluded in Section 5.
2 Literature review
Table 1 presents a summary of some notable contributions in the realm of lekuemia identification using deep learning. They are discussed as follows. In the study mentioned in the reference, Elhassan et al. (2022), an approach is proposed for the detection of acute myeloid leukemia (AML) from WBC images. At first, a CMYK moment-based localization method is proposed to isolate the region of interest (ROI) from WBC images. This is followed by extraction and fusion of several pointwise and spatial features. Classification is performed using multiple classifiers including SVM and XG boost. The study reports the best accuracy of 97.57% on self collected single cell morphological dataset. In the study mentioned in the reference, Dese et al. (2021), a computer-assisted system is proposed for the diagnosis of several leukemia sub-types. The system is based on Gaussian and Weiner filtering for image pre-processing, followed by K-means clustering and marker-controlled Watershed algorithm for segmentation. Several morphological, texture, and statistical features are extracted and classified using multi-class SVM classifier. The best accuracy of 97.69% is reported for overall leukemia detection on self-collected dataset of peripheral blood smear images. In Al-jaboriy et al. (2019), an automatic method for the diagnosis of leukemia is proposed based on leukocyte cell segmentation. The method uses a dataset of 108 microscopic images and performs ANN-based segmentation and extracts various statistical features for classification. The best accuracy of 96% is achieved for binary classification of leukocyte cell blasts. The study mentioned in the reference, Kassani et al. (2019), the authors applied different augmentation techniques to the dataset images. Then, a hybrid CNN model consisting of hidden layers of VGG16, and MobileNet is proposed for feature extraction. The extracted features are classified using a NN architecture. The proposed method achieves a binary classification accuracy of 96.17%. In the study mentioned in the reference Jung et al. (2022), the authors proposed a custom CNN model for WBC classification for leukemia detection. The authors first created a synthetic dataset of WBC images using generative adversarial networks and then performed transfer learning of the proposed CNN for classification. An average accuracy of 97% is achieved by the system.
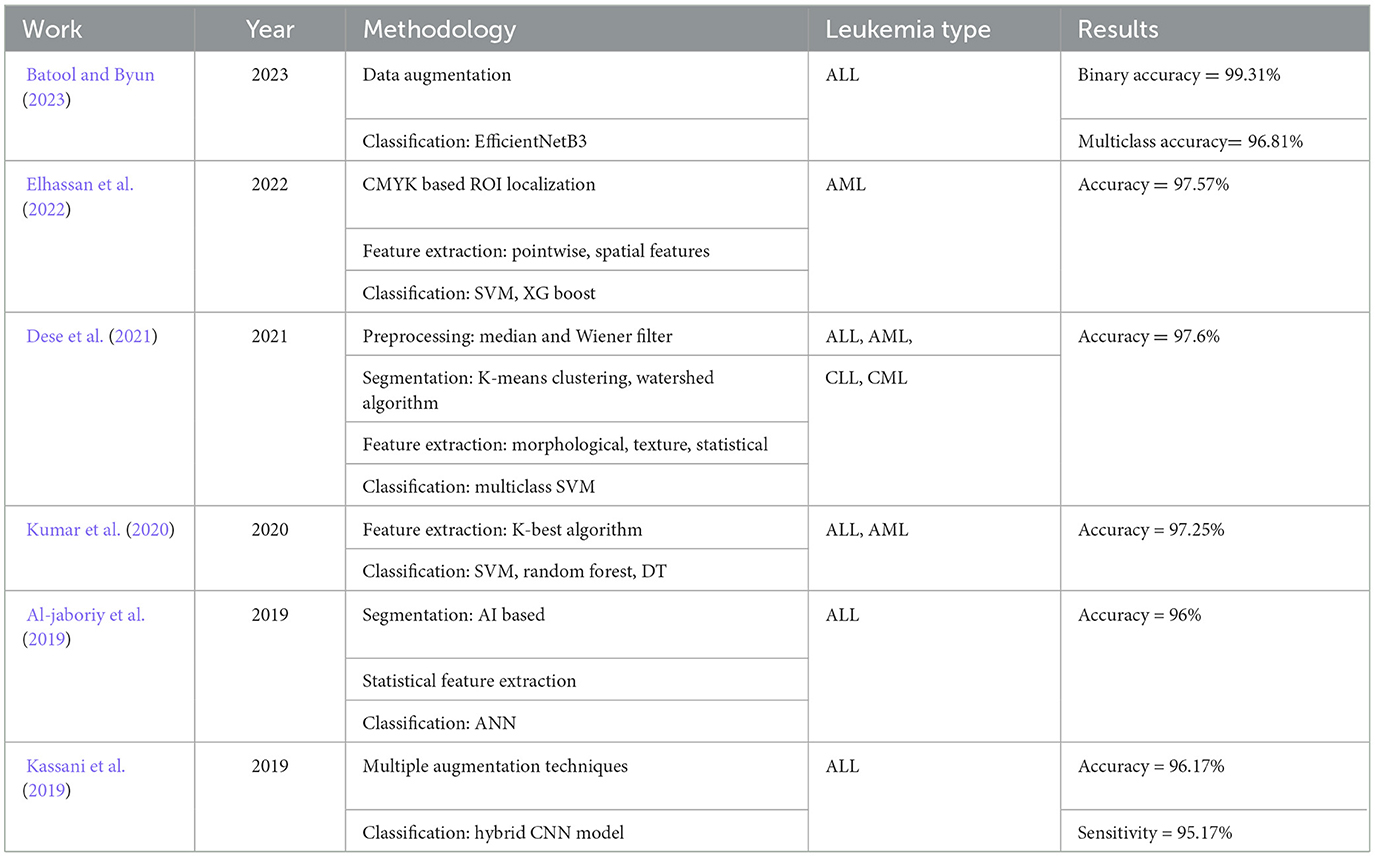
Table 1. Summary of some published studies on leukemia identification.
For extracting and choosing blood features, the authors of the study mentioned in the reference, Alruwaili (2021) presented a stepwise linear discriminant analysis technique. The suggested method performs the identification of specific attributes within blood smear images and their classification based on partial F-values. A Matlab-based method for classifying and identifying WBC cancer was proposed in the study mentioned in the reference, Nithyaa et al. (2021). The approach integrates a range of morphological, clustering, and image pre-processing procedures with the utilization of random forest classification. In the study mentioned in the reference, Pang et al. (2015), an automatic leukocyte categorization approach is proposed. Initially, moment invariants are derived using the Euclidean distance transform within the nucleus region, followed by the extraction of morphological characteristics from the segmented cells.
The published literature on leukemia detection also proposes a number of proprietary deep CNNs and their ensembles. In the study mentioned in the reference, Batool and Byun (2023), a lightweight deep learning-based EfficientNet-B3 model is proposed which employs depth-wise separable convolutions for ALL classification. The method proposed in this study attains a classification accuracy of 96.81% when applied to publicly available datasets for leukemia sub-type classification. In the study mentioned in the reference, Kumar et al. (2020), a simple method for the detection of ALL, and AML is proposed in which KBest algorithm is used for feature extraction, followed by a dense CNN for classification. The proposed approach reports the best accuracy of 97.2%. In the study mentioned in the reference, Jha et al. (2022), a leukemia identification method is proposed which uses K-means clustering from image segmentation. Next, multiple statistical features are extracted to train an ensemble of multiple classifiers. The proposed system reports a best accuracy of 96.3%. In most of the existing studies that utilize deep transfer learning, the feature selection is performed using a filter or wrapper-based approach. Filter-based methods assess the relevance of individual features by examining their statistical properties, such as correlation with the target variable or variance within the feature. These methods have a limitation in that they do not consider the relevance between the selected features and the actual model's performance. This can lead to situations where selected features might not be the most predictive for the planned model. Conversely, wrapper-based methods entail employing a machine learning model in the capacity of a “wrapper” to assess the effectiveness of various feature subsets. These methods select features by repeatedly training and evaluating the model on different subsets of features. These methods are particularly useful in obtaining the best set of features for a specific classifier model. Recently, population-based algorithms for feature selection have received considerable research attention. A significant challenge lies in fine tuning the algorithm to achieve better exploration of feature search space and obtain the most discriminant and powerful set of features. Standard population-based algorithms used in several studies on disease classification often suffer from poor convergence and local optima problems (Gupta et al., 2020; Shahzad et al., 2022).
2.1 Contributions
In this study, a hybrid method is proposed for the classification of ALL sub-types. The key contributions of this research can be outlined as follows:
• First, we present a customized 88-layer deep CNN architecture which incorporates the aspects of two standard deep CNN models, namely, AlexNet and SqueezeNet.
• Subsequently, we employ transfer learning to extract features using the proposed custom CNN architecture and another deep model, namely, GoogleNet. The feature vectors from both networks are fused together.
• For feature selection, we propose a memetic algorithm which combines a nature inspired meta-heuristic, i.e., whale optimization algorithm (WOA) with local search based on differential evolution. The proposed method achieves a better exploration of search space while avoiding local optima.
• The set of selected features is then used to perform training and classification using several outer classifiers with multiple kernel settings.
• The proposed pipeline is validated using public datasets for binary detection and sub-type classification of ALL. Better or comparable performance with significant reduction in feature vector size is demonstrated by the proposed method as compared with several existing studies.
3 Materials and methods
3.1 Datasets
In this research, publicly accessible datasets comprising blood smear images are employed for both binary detection and the identification of ALL sub-types. The first dataset is the ALL-IDB2 dataset created by the authors of the study mentioned in the reference, Scotti et al. (2005) at the University of Milan. This dataset consists of 260 images corresponding to two classes of subjects, i.e., “Healthy” and “ALL.” An optical microscope with a Canon Power Shot G5 camera is used to capture the images. The ALL-IDB2 dataset consists of cropped images of ALL-IDB1 dataset that obtains region of interest of normal and blast cells. The image resolution is 2, 592 × 1, 944 pixels with a TIFF format. Few samples of ALL-IDB2 dataset are shown in Figure 1.
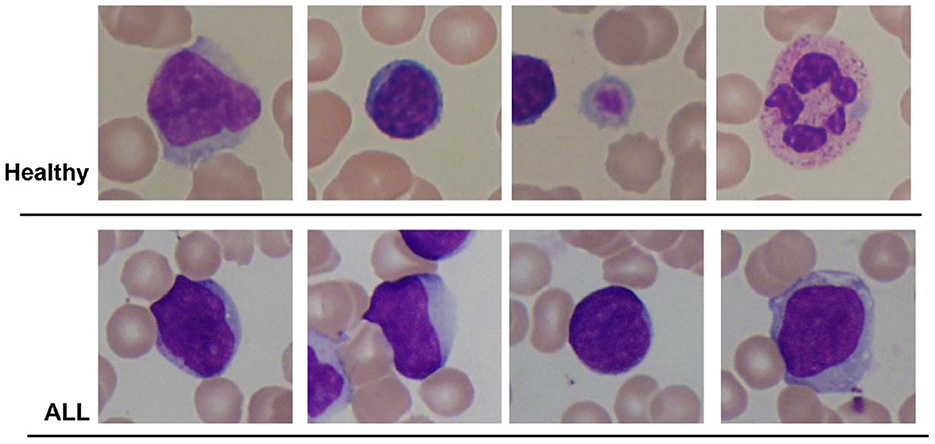
Figure 1. Sample images of ALL-IDB2 dataset of the study mentioned in the reference, Scotti et al. (2005).
For multi-class classification, this study uses the dataset of the study mentioned in the reference, Ghaderzadeh et al. (2022), which is prepared at bone marrow laboratory of Taleqani Hospital Iran. The dataset is composed of 3, 242 images which are divided into “Benign” class and three sub types of B-Cell ALL, namely, “Early,” “Pre-cursor,” and “Pro B,” with a class distribution of 512, 955, 796, and 979 images, respectively. A microscope with 100× magnification of Zeiss Camera is used to capture the images having 224 × 224 pixel resolution. Few images of this dataset are shown in Figure 2.
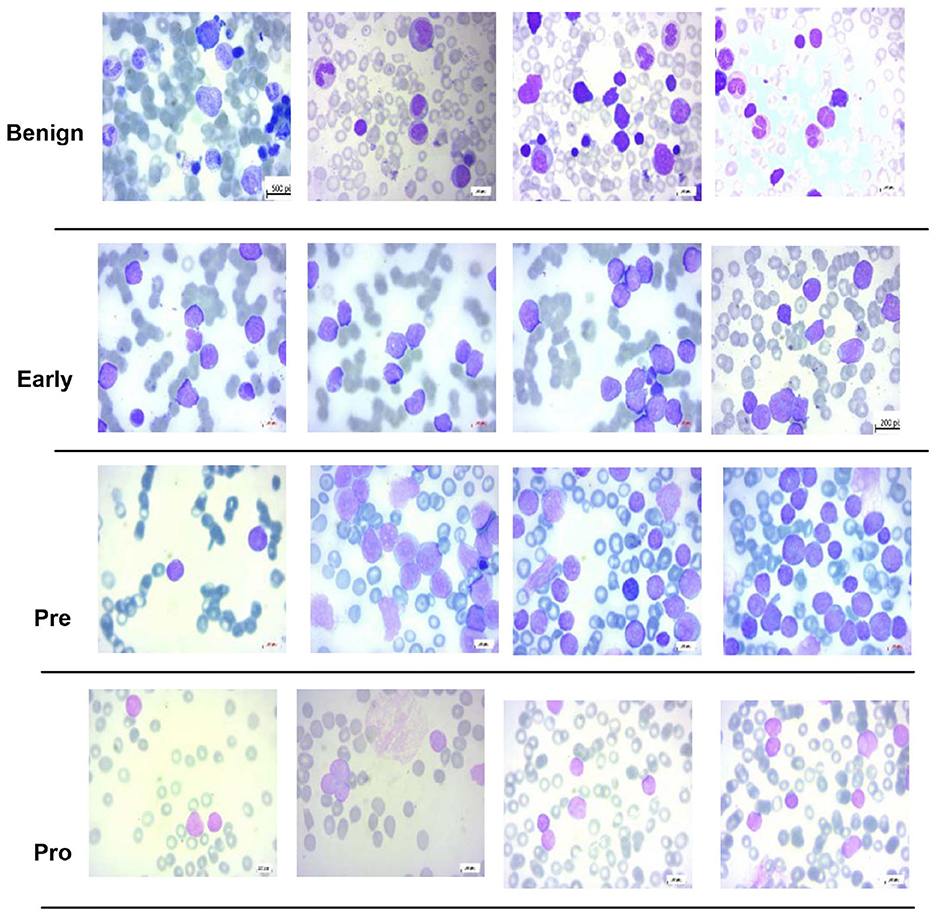
Figure 2. Sample images of dataset of the study mentioned in the reference, Ghaderzadeh et al. (2022).
3.2 Computation pipeline
Figure 3 shows the computation pipeline of the proposed framework for ALL identification and its sub-type classification. The pipeline accepts the raw microscopic images from selected database repositories. These images are then pre-processed using contrast enhancement and augmentation steps. The contrast-enhanced images are resized according to input layer requirements of two deep neural networks, i.e., GoogleNet and our proposed CNN and subjected to transfer learning step. The features extracted from these deep CNNs are serially fused together and then subjected to the feature selection step. The selected set of features is then classified using multiple classifiers. These steps are discussed in details as follows.
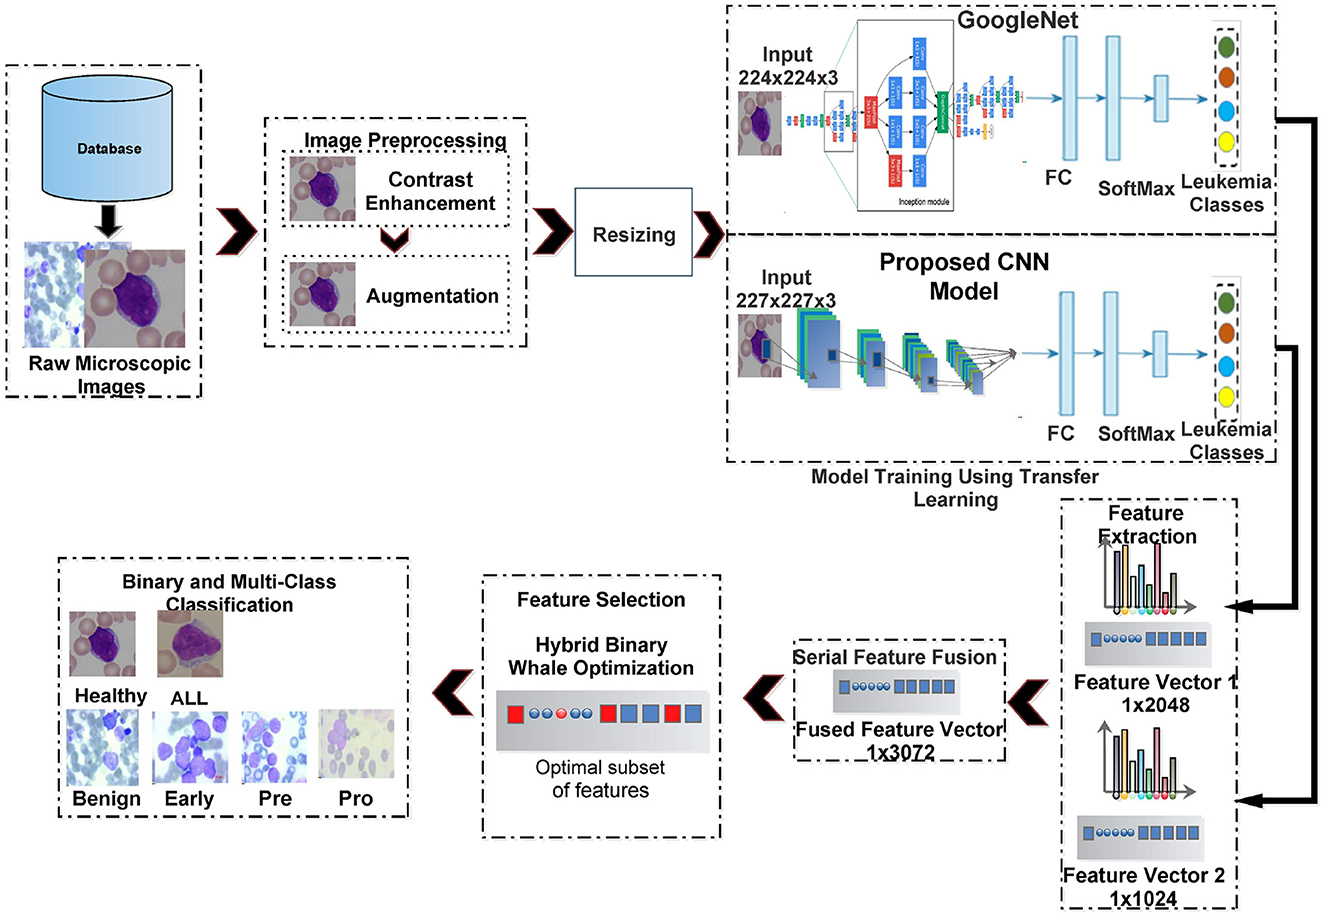
Figure 3. Proposed framework for binary and sub-type classification of ALL.
3.2.1 Dataset pre-processing
In the first step, the training and testing dataset images are subjected to contrast enhancement using color histogram equalization. When dealing with microscopic images, contrast enhancement by applying histogram equalization independently to R, G, and B channels may not always produce good results (Xie et al., 2019). Equalizing the histogram across all three RGB channels can amplify existing noise in the image, especially in areas with low intensity values. This can make it difficult to distinguish between relevant features and noise artifacts. This study performs image contrast enhancement within the HSI image domain. HSI separates intensity information from hue and saturation, making it less susceptible to variations in lighting conditions that can affect RGB channels. This is particularly helpful for microscopic images, where lighting control can be challenging. By separating hue, saturation, and intensity, HSI provides distinct channels that can be individually analyzed or combined to extract specific features relevant to the recognition task. This can improve the ability to differentiate between different cell types, structures, or objects in the image.
The main steps of image contrast enhancement adopted in this study are as follows:
1. Transform the RGB image into the HSI image;
2. Perform histogram equalization on the intensity channel;
3. Substitute the HSI image's intensity channel with the corresponding histogram-equalized intensity channel;
4. Revert the HSI image back to an RGB image.
3.2.2 Customized deep feature extraction
Feature extraction stands as a pivotal phase within the domain of deep learning. In this study, we employ transfer learning from a standard deep CNN, i.e., GoogleNet and our proposed custom CNN architecture for feature extraction. Both of these networks are elaborated upon as follows.
3.2.2.1 GoogleNet
GoogleNet also referred to as InceptionV1 is a deep CNN architecture developed by the researchers at Google (Szegedy et al., 2015). It is designed to solve some problems of earlier networks such as vanishing gradient problem and trade-off between complexity and efficiency. To solve the problem of overfitting due to very deep neural networks, the GoogleNet is based on the idea of having multiple sized filters, operating in the same level. The resultant network becomes wider rather than becoming deeper. Breakthrough performance is achieved due to the introduction of ‘Inception modules” and auxiliary classifiers. An inception module is composed of parallel concatenation of convolutions with multiple sized kernels and pooling operations in order to allow efficient learning of local and global features. The GoogleNet also utilizes 1 × 1 convolutions which is also known as “network-in-network” layers. Incorporation of these layers before applying larger filter convolution results in a compact, computationally efficient network. Moreover, these layers are used to combine features across different inception modules for multi-abstraction feature learning.
The GoogleNet Architecture has 22 layers including nine linearly stacked inception modules, four max pool layers, a dropout regularization layer, and fully connected layer. The inception module terminations are linked to the global average pooling layer. The GoogleNet is pretrained on the ImageNet dataset,1 which consists of thousands of image categories. To facilitate transfer learning on the leukemia dataset, several modifications are made to the network. First, the last learnable layer, referred to as “loss3-classifier,” is substituted with a new fully connected layer having an output count and matching the number of leukemia classes. Additionally, the network's softmax layer is replaced with a new softmax layer. Furthermore, the classification layer of the network is substituted with a new classification layer without class labels. Before commencing training, dimensions of all images are changed to 224 × 224 × 3 to conform to the network's input layer. Subsequently, various augmentation techniques, such as flipping, scaling, and random rotation, are applied. The extraction of deep features is conducted from the global average pool layer, denoted as “pool5-7x7_s1,” which yields a deep feature vector comprising 1 × 1,024 features per image.
3.2.2.2 Proposed custom network
This study introduces a novel deep CNN, which is meticulously designed to incorporate key attributes from two well-known deep models: AlexNet and SqueezeNet. AlexNet is composed of five convolutional layers and three fully connected layers. Furthermore, it incorporates three pooling layers, seven ReLU activation layers, two dropout layers, and a SoftMax layer. In contrast, the proposed CNN model encompasses 88 layers, spanning from the input to the output layer. Beyond the conventional layers inspired by AlexNet, the proposed model introduces additional elements such as batch normalization and structures reminiscent of SqueezeNet. The architectural view of customized architecture is shown in Figure 4. The size of input layer is 227 × 227 × 3, which is similar to the AlexNet architecture. The network starts with a convolution (CN) layer followed by ReLU (R), Batch Normalization (BN), Max Poopling (PL), Leaky ReLU (LR), and Drop out (D) layers. Embedded in the network, are the SqueezeNet like structures of parallel branches of grouped convolution layers (having a cascade of CN, R, LR, A, and BN layers). The individual branches of each group are merged together with the help of Addition (A) layer. The last three layers of the network are fully connected (FC), softmax and classoutput layer. Tables 2, 3 present the detailed configuration of all layers of the proposed CNN architecture.
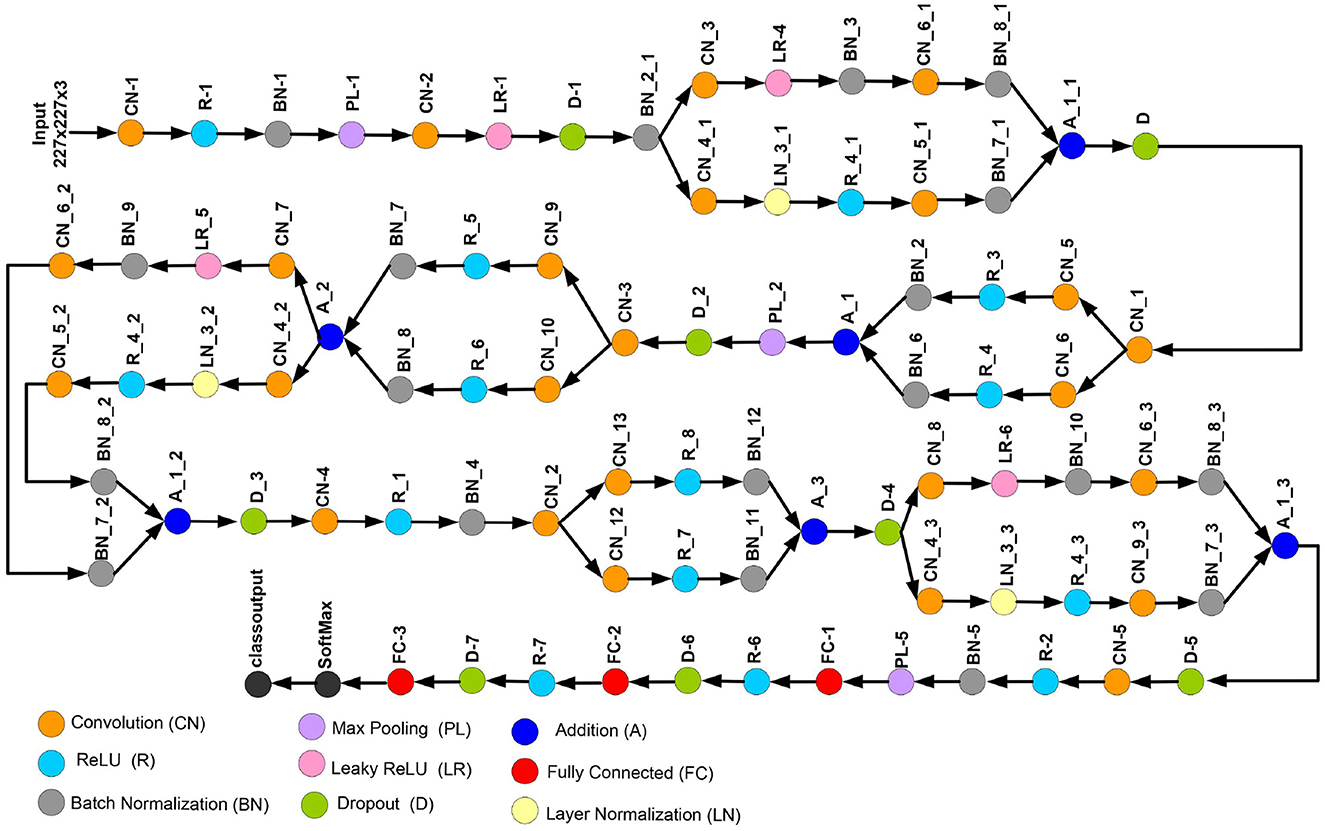
Figure 4. Proposed custom CNN architecture.
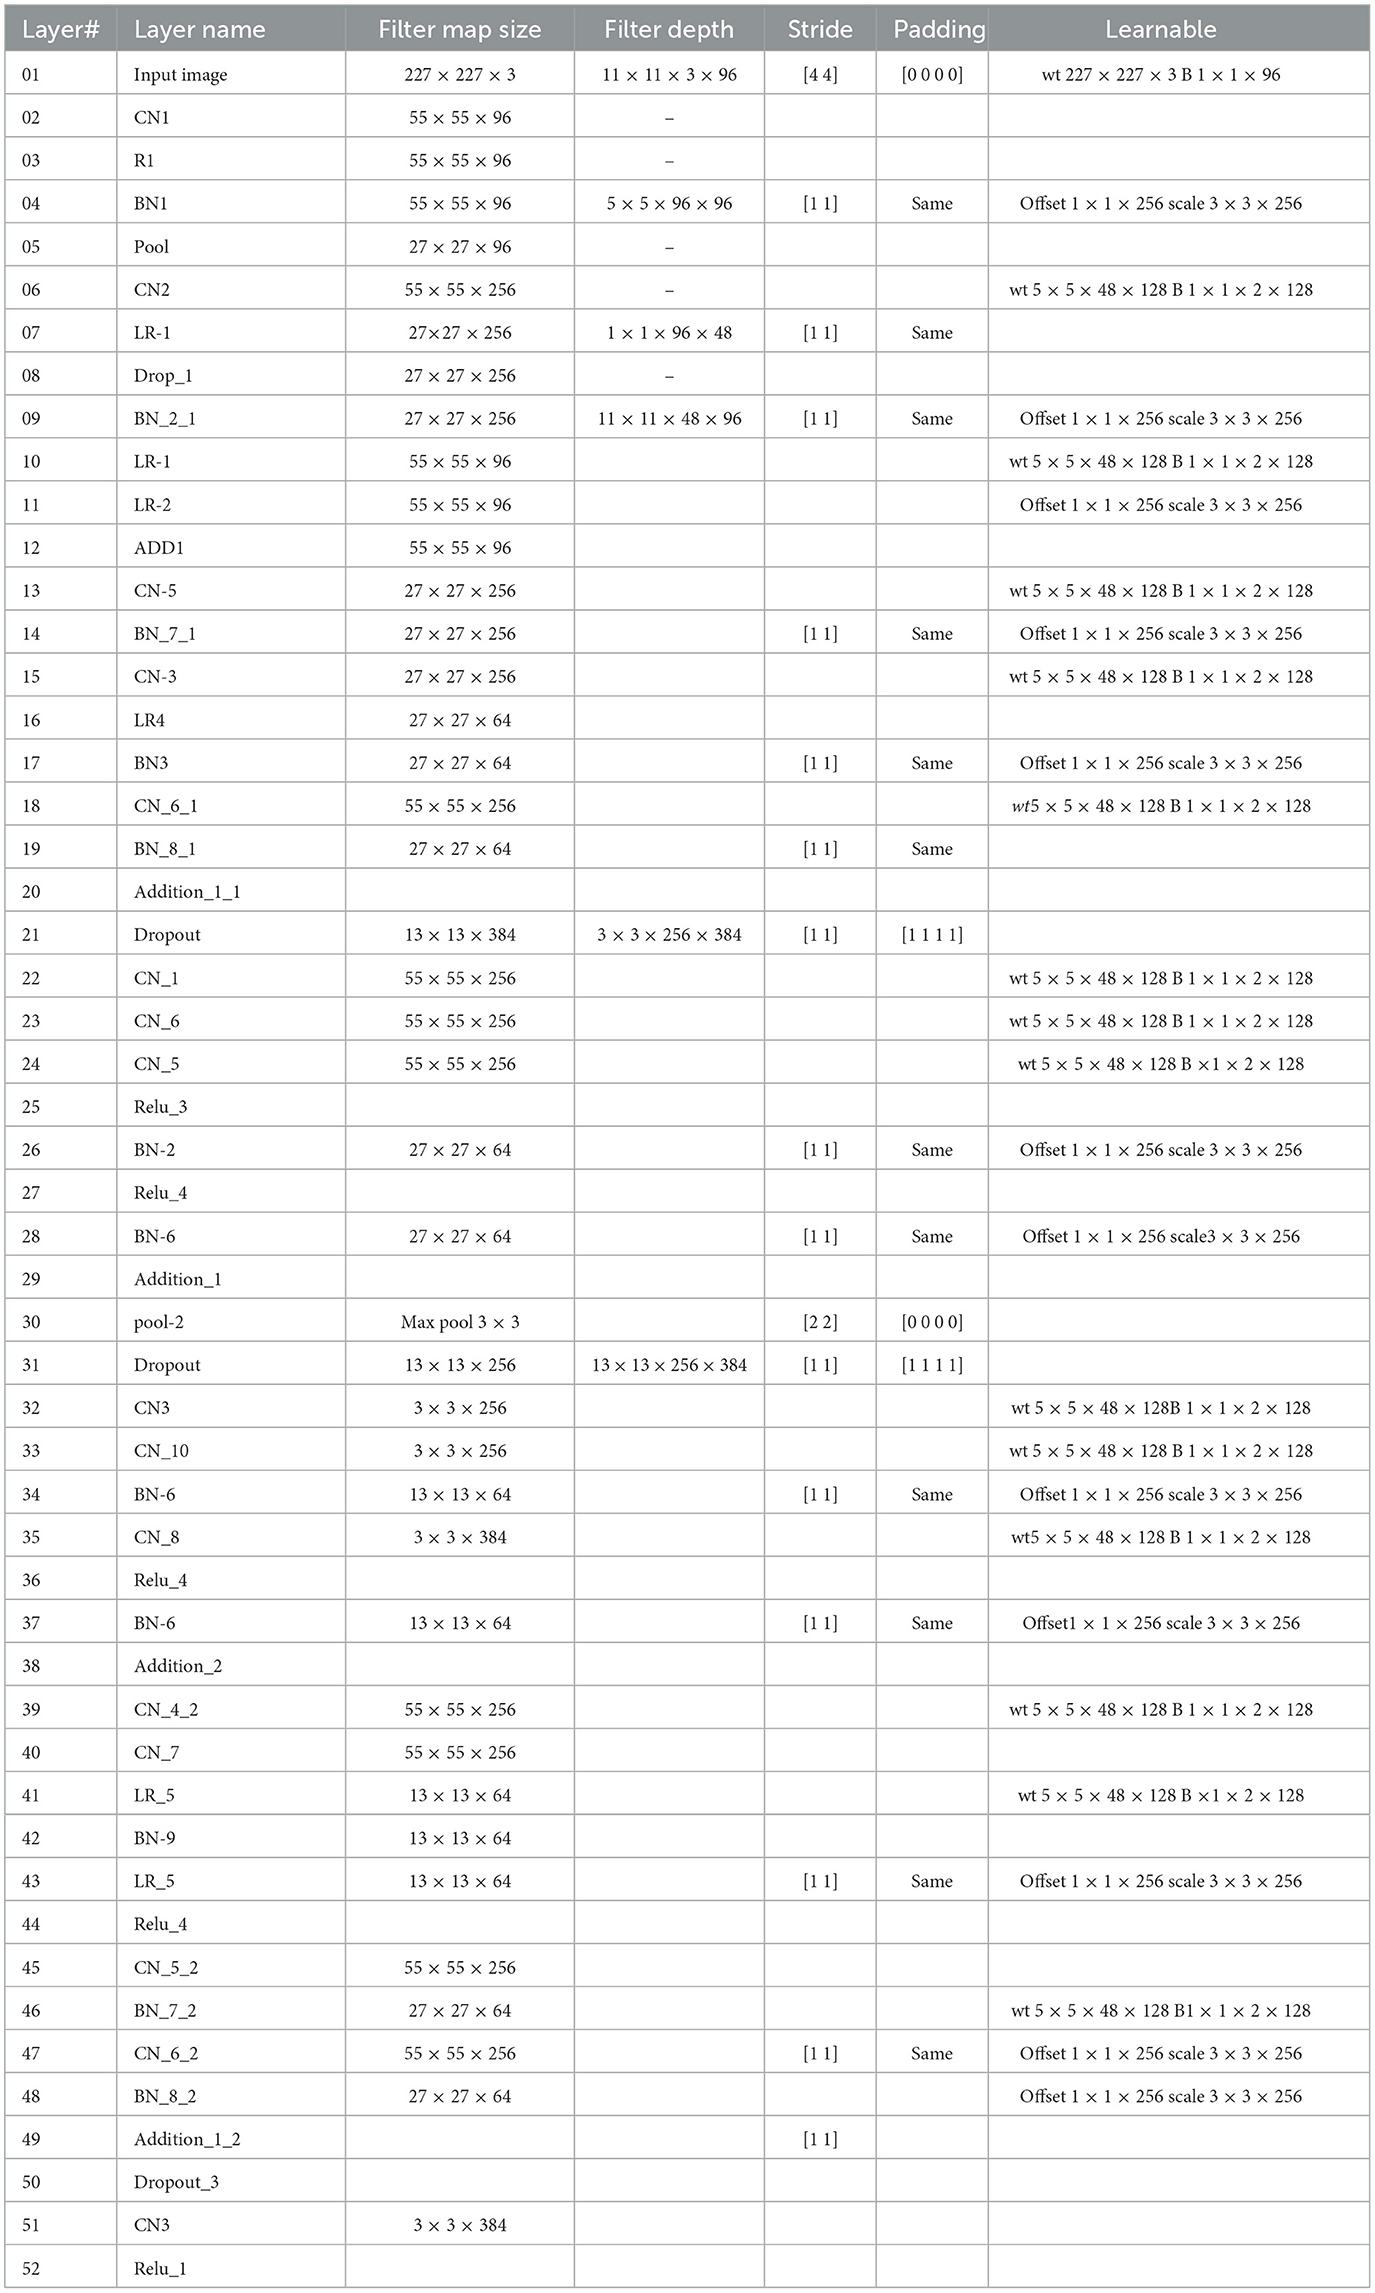
Table 2. Layer-specific details of the proposed CNN architecture.
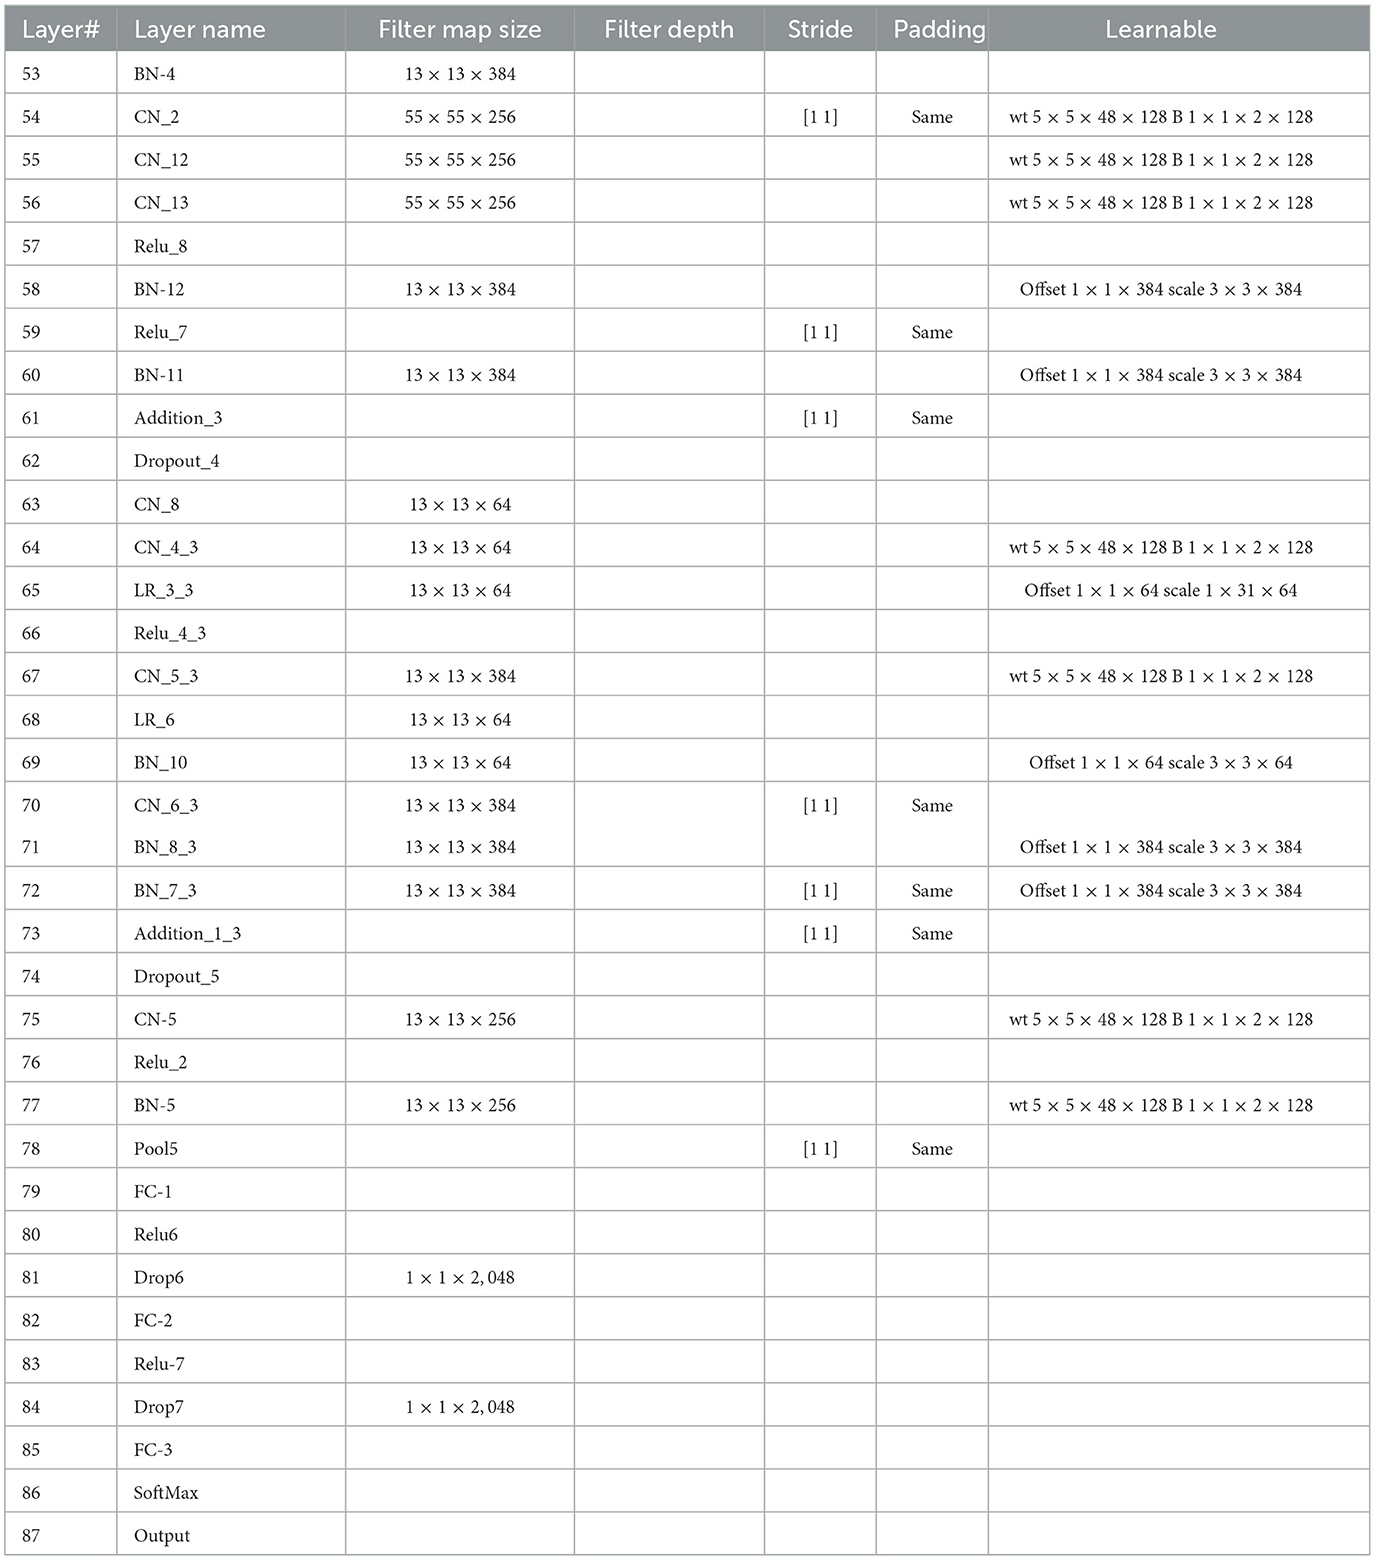
Table 3. Layer-specific details of the proposed CNN architecture (Contd.).
The leukemia datasets utilized in this research are relatively small, making it infeasible to train the proposed CNN model from the ground up. Consequently, the initial step involves pre-training the proposed CNN on the CIFAR-100 dataset (Krizhevsky et al., 2009), which encompasses 100 object categories, each with 600 images. Subsequently, transfer learning is applied to adapt the pre-trained network to the leukemia dataset. The extraction of deep features is conducted from the FC-3 layer, yielding a feature vector with dimensions of 1 × 2, 048 for each image.
3.2.3 Feature ensemble/fusion
Obtained feature vectors from both networks are combined together through a serial concatenation technique. The joint feature vector has a size of 1 × 3, 072 features per image.
3.2.4 Feature selection
Feature fusion enlarges the feature vector, potentially triggering the ‘curse of dimensionality' issue. This expanded feature vector may include duplicate features, which can result in overfitting by the classifier. Selection of the most relevant features is an essential step to achieve better generalization while reducing the computational complexity of the classification system. As an important contribution, this study models the problem of deep feature selection as a global combinatorial optimization problem and proposes a nature-inspired metaheuristic, i.e., whale optimization algorithm (WOA), to achieve the most pertinent set of features.
3.2.4.1 Standard whale optimization algorithm
The WOA, as introduced by Mirjalili and Lewis in their study (Mirjalili and Lewis, 2016), offers a solution to the challenge of discovering optimal solutions within intricate search spaces. This algorithm emulates the social and hunting behaviors of humpback whales, leveraging their techniques to improve solutions within the search space. Humpback whales employ a bubble-net hunting strategy to corral and capture their prey, particularly in the case of small fish groups.
Mathematically, the algorithm begins with a random whale population. The optimization model captures three whale behaviors: (a) hunting for prey (exploration), (b) encircling the prey, and (c) executing a bubble-net attack (exploitation).
3.2.4.1.1 Encircling the prey
The current best candidate solution of a population is called as the “leader.” It is the whale which has the best fitness value and assumed to be closest to the target prey. All other solutions (whales) update their position toward the leader. Mathematically, the position update is computed as follows (Mirjalili and Lewis, 2016):
where t denotes the current iteration number, is the leader, i.e., population best solution so far, is the individual whale. and are the co-efficient vectors calculated as follows (Mirjalili and Lewis, 2016):
where r1 and r2 are random numbers in [0, 1].
3.2.4.1.2 Bubble-net attacking
This behavior of humpback whales is mathematically modeled using two approaches.
1. Shrinking encircle: to mimic this behavior, the value of is decreased from 2 to 0 through a linear function (Mirjalili and Lewis, 2016)
where tmax is the maximum number of iterations.
2. Spiral trajectory: the whales create an upward spiral loop around the prey. The position update due to this spiral trajectory is modeled as follows (Mirjalili and Lewis, 2016):
where l is a random number in [−1, 1] and b is a constant.
The position update of whales considering both phenomenons of spiral trajectory and shrinking encirclement is performed as follows:
3.2.4.1.3 Searching prey (exploration)
In addition to above hunting mechanisms, the humpback whales also search randomly according to position of each others. When , the position update of each whale is carried out using the Equation (1) whereas, for , the position update is computed as follows (Mirjalili and Lewis, 2016):
where Xr(t) is the randomly selected whale as the population best solution.
3.2.4.2 Proposed hybrid binary whale optimization algorithm
The optimal feature selection problem is a binary combinatorial optimization problem. Therefore, an association rule is required to convert the real valued whale position vectors into binary sub-space. In this study, we have proposed a “V”-shaped transfer function for whale position update as follows:
where r1 denotes a uniformly distributed random number in [0, 1], and denotes the feature at index j of i − th whale.
In WOA, the whales update their position on the basis of optimal individual solutions (leader). Often, the algorithm may fall into the local optimum, resulting in a loss of population diversity. To avoid this problem, we have proposed a hybrid binary WOA, in which Differential Evolution (DE) is applied as a local search technique.
During each iteration of WOA, the so far best solution (leader) is computed. All other whales of the population update their position using the update rules (Equations 8, 11, 12). To perform local refinement of an optimum solution, the whole population of binary individuals is considered as an input to the DE algorithm which operates in the following steps.
3.2.4.2.1 Mutation
Each individual (“target”) in the population is used to generate its corresponding mutation vector such that:
This mutation vector is then used to create a trial vector as follows:
where , and are three randomly selected distinct vectors excluding , and ⊕ denotes the bit-wise XOR operation.
3.2.4.2.2 Binomial crossover
The target vector and trial vector undergo the Binomial Crossover as follows:
where j = 1 : d, d is the dimensionality of the i-th individual, x1 is a random number in interval [1, d], x2 is a random number in interval [0, 1], and pr is the crossover probability.
Finally, the fitness of each cross-over individual is computed. If there is an individual with fitness value better than the iteration best solution of binary WOA, is replaced by this individual.
3.2.4.2.3 Feature selection using proposed hybrid binary WOA
Algorithm 1 shows the main computational steps of the proposed hybrid binary whale optimization (BWO)-based feature selection approach. Table 4 lists the main symbols and variables used in the algorithm. The algorithm receives the fused feature matrix 𝔽 of size nt × dmax, where nt denotes the total number of images in the training set used for feature extraction, and dmax is the total number of fused features, i.e., 3, 072 per image. Each row of 𝔽 corresponds to fused feature vector obtained from a single image. L is a vector containing class labels of training dataset images, tmax is the maximum number of algorithm iterations, and np is the population size. In Step 4 of the algorithm, the whale population matrix of size np × dmax is randomly generated. The algorithm runs for tmax iterations. During each iteration, Steps 7–12 compute the fitness of each individual to update the best (leader whale) solution and its fitness value Γ*. The fitness function Evaluate receives as input parameters the population matrix , the label vector L, and one binary individual of . In Step 35, all features corresponding to non-zero entries of are extracted from 𝔽 and stored in 𝔽2. In the subsequent Steps 36–38, the feature matrix 𝔽2 and label vector V are split into training and testing parts with holdout ratio of h0. Then, training of KNN classifier is performed, and predicted labels are obtained by applying testing feature set. The classification accuracy ac and fitness Γ are computed as Equations 16, 17:
where npred and ntest, respectively, denote the total number of successfully predicted and applied testing samples of KNN classifier. α1 and α2 are weight coefficients such that α1+α2 = 1. qs and qt denote the number of selected and total features of .
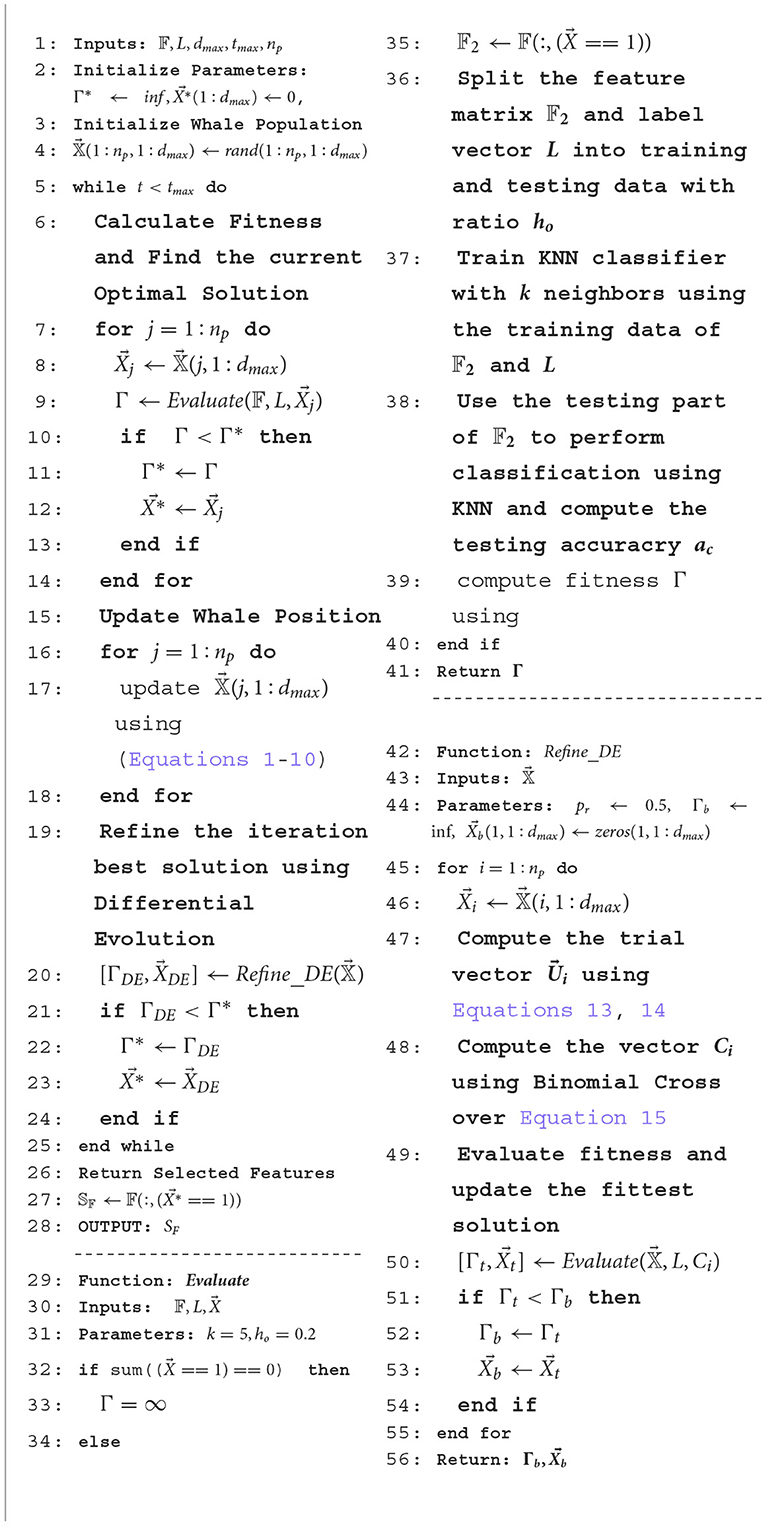
Algorithm 1. Proposed hybrid BWO based feature selection algorithm.
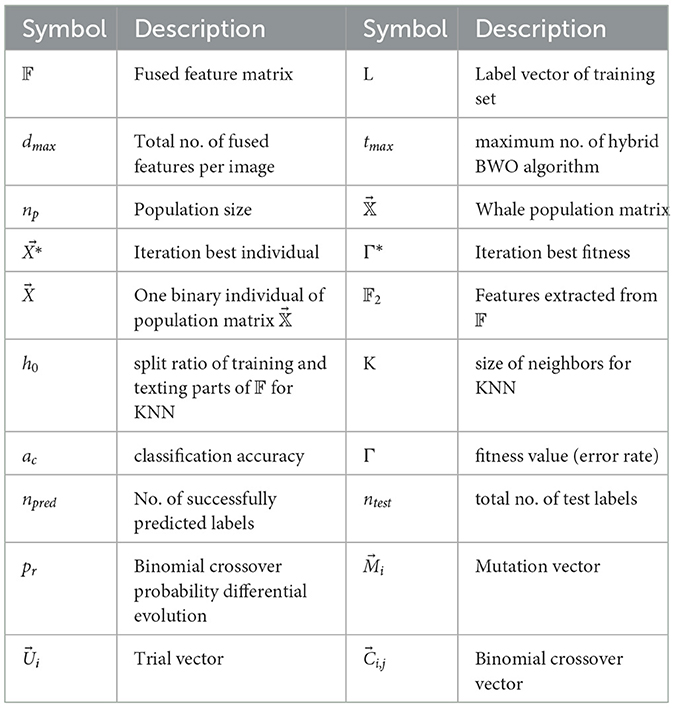
Table 4. Description of main symbols used in Algorithm 1.
In Steps 15–18 of the main routine, the fittest solution (leader whale) is used to update the position of all other whales of population using the update rules (Equations 1–10). The updated whales population is given as an input to Refine_DE which performs refinement of best solution using differential evolution. If a better solution is obtained by performing mutation and crossover rules (Equations 13–15) of DE, this solution is selected as the iteration best of BWO algorithm. At the conclusion of tmax iterations of the BWO algorithm, Step 27 involves utilizing the indices of non-zero entries in the best overall solution , to choose the corresponding features from the set 𝔽.
3.2.5 Classification
The ensemble of selected features yielded by the proposed hybrid BWO algorithm, in conjunction with the label vector L, is subsequently employed for training the outer classifiers. In this study, we conducted an assessment of the classification efficacy across a spectrum of classifiers employing diverse kernel configurations, ultimately identifying and adopting the top-performing classifiers for our proposed study.
4 Performance results
The prescribed workflow for the detection and sub-type categorization of acute lymphoblastic leukemia has been executed using MATLAB R2021a, running on an Intel Core i7 CPU equipped with 16GB of RAM, all hosted within a 64-bit Windows 10 operating environment.
4.1 Leukemia binary detection
In the first phase, the leukemia detection pipeline is applied to the ALL-IDB2 dataset. To mitigate potential overfitting issues, the pre-processed images within the dataset undergo an augmentation procedure. This step involves random image rotations within the range of [0, 360] degrees, resizing by a random factor within [0.5, 1] interval. The distribution of images across various classes of augmented ALL-IDB2 dataset is presented in Table 5. Next, the augmented dataset was stratified into training and validation sets with a 70:30 ratio through a random selection of images belonging to each class. The corresponding image distribution is shown in Table 6.
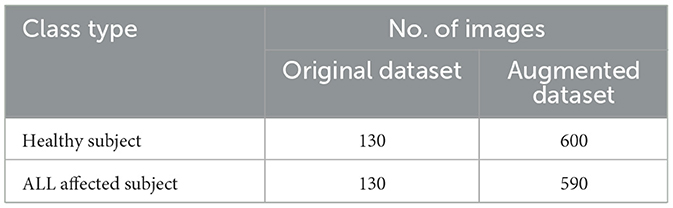
Table 5. Class-wise image details of augmented ALL-IDB2 dataset.
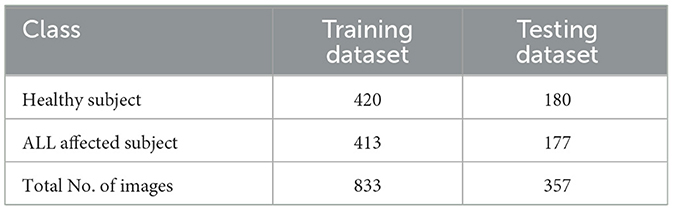
Table 6. Distribution of ALL-IDB2 dataset into training and test parts.
To perform feature extraction, the training dataset is employed for transfer learning with both the GoogleNet model and our proposed custom CNN architecture. The main training parameters are shown in Table 7. We explored various combinations of hyperparameters through multiple training runs and identified the set that achieved the best training performance. These optimal parameters were then used to train the custom CNN on the augmented ALL-IDB2 dataset. Figure 5 shows the validation accuracy and loss function plot of proposed custom CNN on the augmented ALL-IDB2 dataset. Subsequently, deep feature vectors of dimensions 1, 024 and 2, 048 are, respectively, extracted from GoogleNet and custom CNN. These feature vectors are then horizontally concatenated, yielding a composite feature vector of size 1 × 3, 072 for each training image. In the next step, the proposed hybrid BWO algorithm is applied on fused feature vector for the selection of most dominant set of features. The vector of selected features is then used for training outer classifiers. In this study, we have used a range of classifier families, such as SVM, KNN, NN, Decision Tree (DT), and Ensemble, with different kernel settings. The performance results of best performing classifiers from each family are shown in Table 8. The key performance metrics are evaluated, which include classification Accuracy, Precision, Sensitivity (Recall), F1 Score, and Specificity. For binary classification, these metrics are computed as Equations 18–22:
where TP denotes the total number of “ALL” images successfully classified, TN denotes the total number of “Healthy” images classified as “Healthy,” FP denotes the number of ‘Healthy' images incorrectly classified as “ALL,” and FN denotes the number of “ALL” images incorrectly classified as “Healthy.”
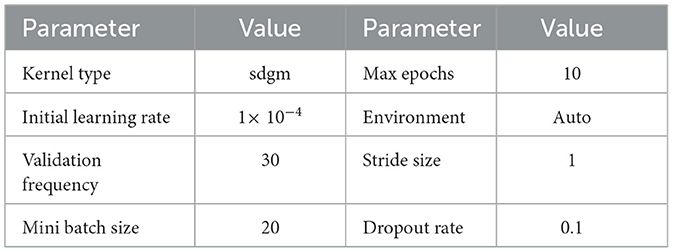
Table 7. Main parameters for transfer learning of GoogleNet and proposed custom CNN model.
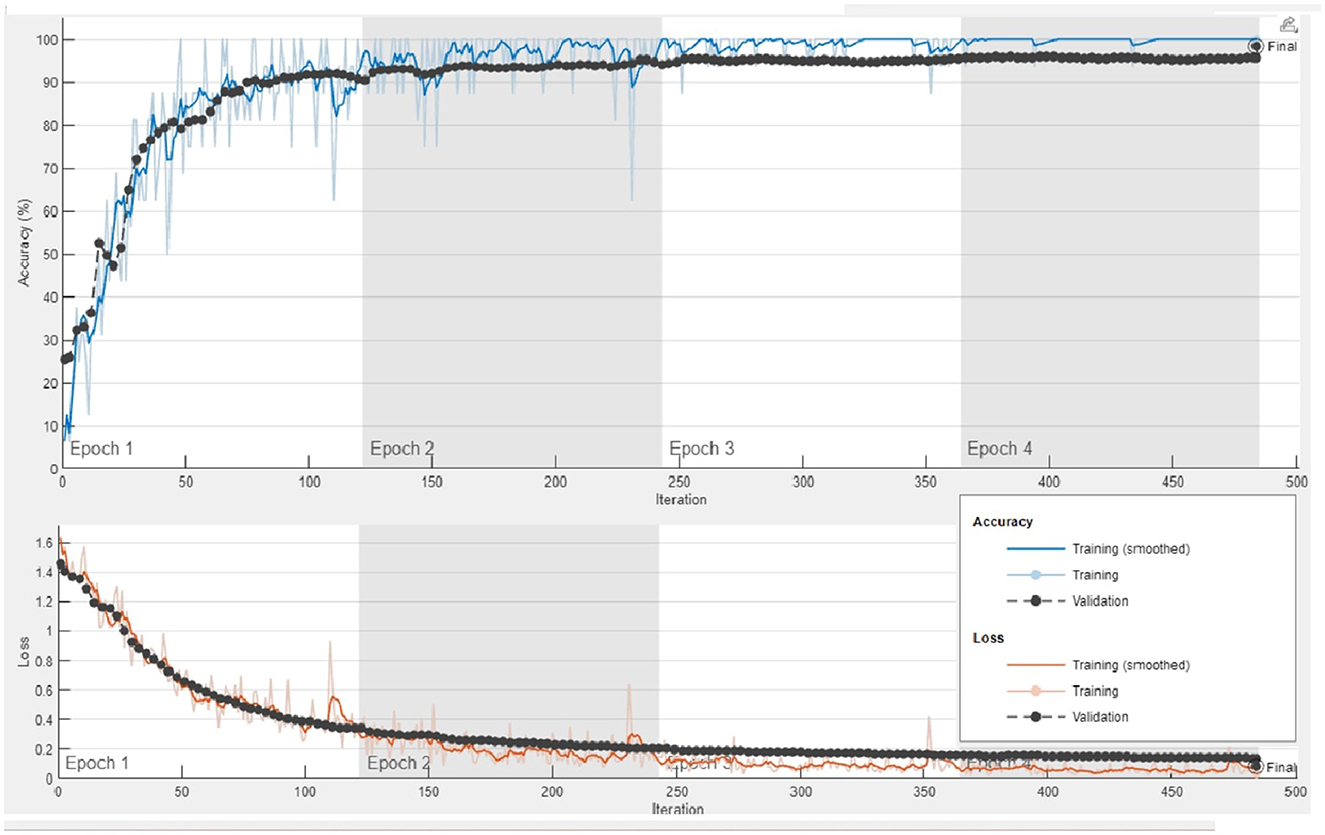
Figure 5. Plots of training accuracy and loss function for transfer learning of proposed custom CNN model on augmented ALL-IDB2 dataset.
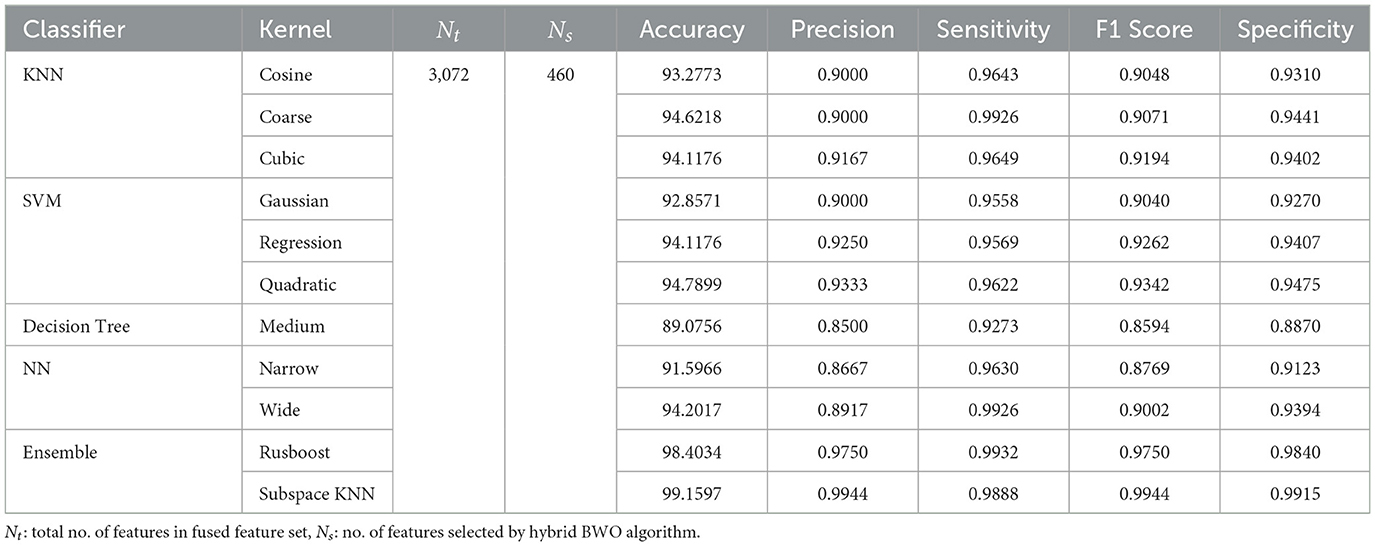
Table 8. Performance metrics of leukemia binary detection on ALL-IDB2 dataset.
The above performance metrics reported in Table 8 are the average results obtained after several Monte-Carlo iterations of proposed pipeline with 10-fold cross validation. In Figure 6, the individual results of each classifier are graphically presented for comparison. Out of 3, 072 features extracted from transfer learning of GoogleNet and proposed custom CNN, only 460 features are selected by Hybrid BWO algorithm. With an 85% feature reduction, all selected classifiers demonstrate accuracy above 89%. The Ensemble Subspace KNN classifier demonstrates an average accuracy of 99.2% and better or comparable values of key performance parameters in comparison with other classifier settings.
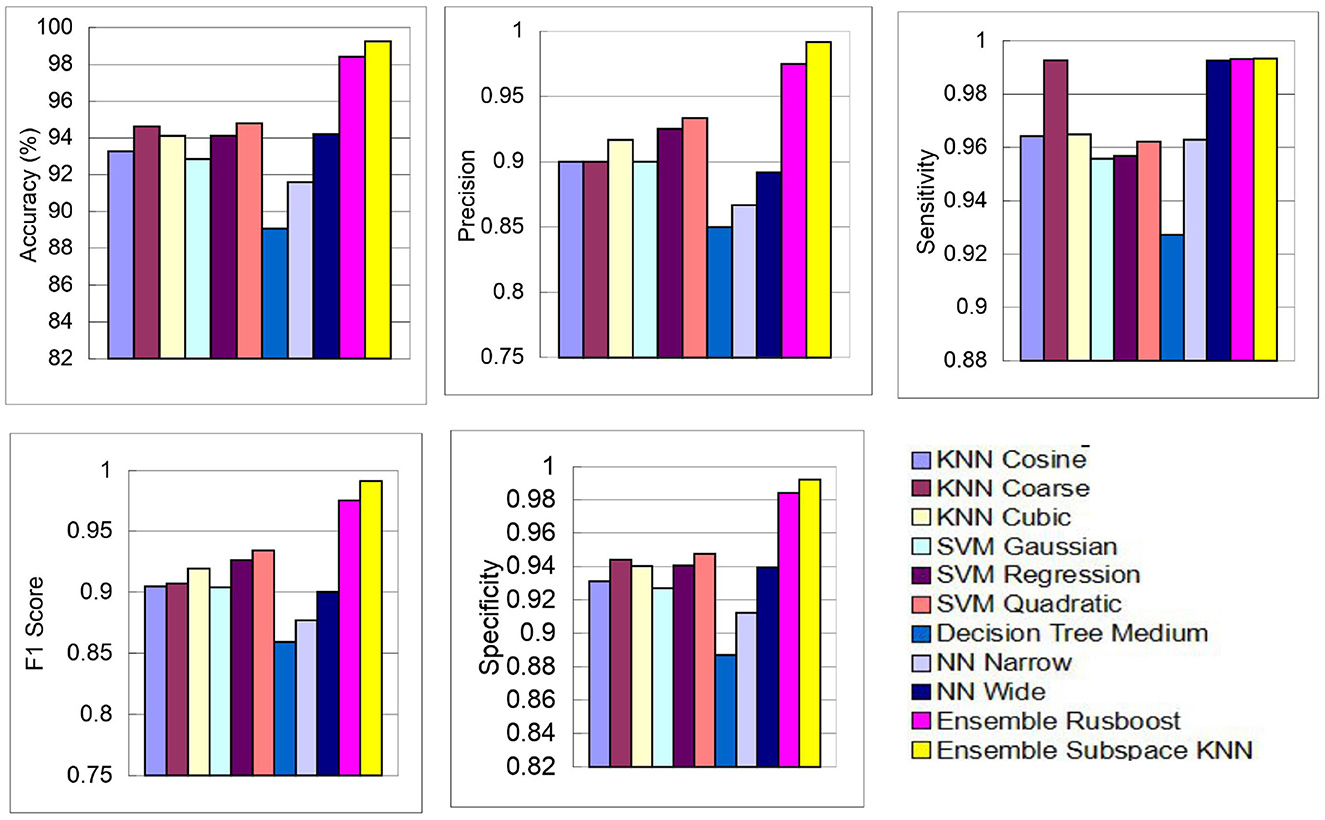
Figure 6. Graphical representation of performance results of proposed pipeline for leukemia detection using ALL-IDB2 dataset.
The test confusion matrix of Ensemble Subspace KNN classifier on ALL-IDB2 dataset is shown in Figure 7, which indicates a high true positive rate (TPR) and a very low false negative rate (FNR), confirming the accuracy of our method. Furthermore, in Figure 8, the error rate of feature selector using proposed hybrid BWO algorithm is plotted with classical Genetic Algorithm (GA). The error rate Γ is computed using the Equation 17. Both GA and BWO are population-based search algorithms, the hybrid BWO demonstrates a better exploration of search space by achieving significantly smaller error rate for all iterations.
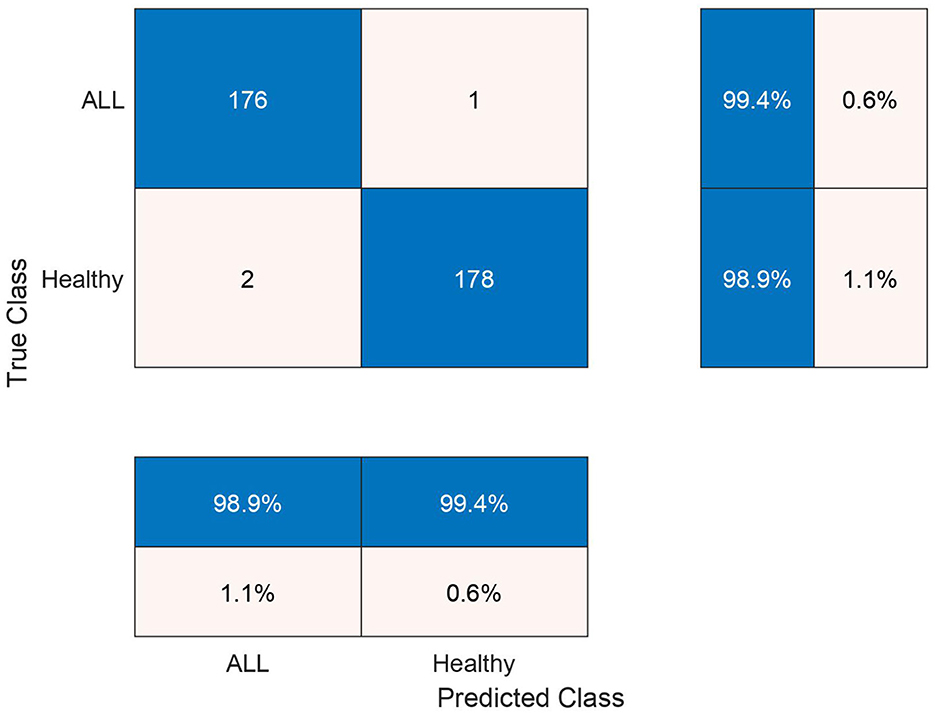
Figure 7. Testing confusion matrix of ensemble subspace KNN classifier on ALL-IDB2 dataset.
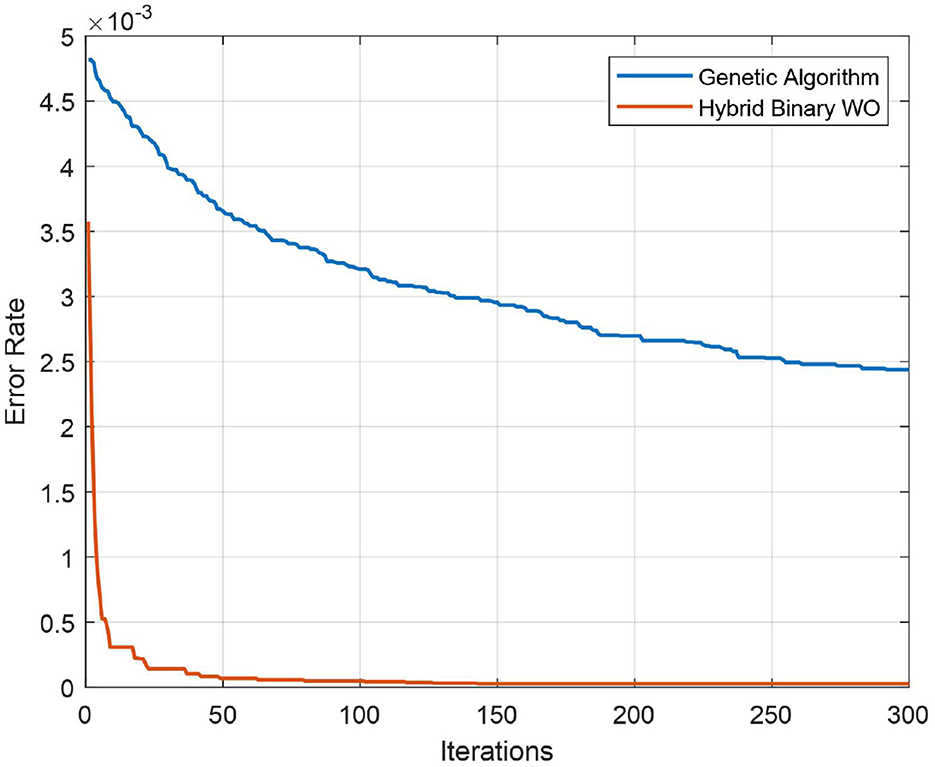
Figure 8. Convergence plot of proposed hybrid binary whale optimization and genetic algorithm.
Figure 9 demonstrates a performance comparison of standard BWO and proposed hybrid BWO algorithms. The graphs in the figure are generated by performing several Monte Carlo iterations of both algorithms on the same training and testing portions of ALL-IDB2 dataset and other common parameters. Each curve in the graph is obtained for one Monte Carlo iteration of the corresponding algorithm and plots the error rate as a function of t iterations (generations) of the algorithm. Each algorithm runs for tmax = 50 times per Monte Carlo iteration. The graphs clearly reveal a better convergence performance of proposed hybrid BWO algorithm with DE-based local search method. For example, for t = 50, the best error rate achieved by standard BWO is 1.5 × 10⁻³, whereas, for the same value of t, proposed hybrid BWO achieves an error rate of 1.0 × 10⁻³, which is ~30% smaller as compared with the standard BWO algorithm. This shows the superiority of proposed local search-based solution refinement strategy. In Figure 10, the convergence performance of two algorithms is plotted for multi-class dataset of the study mentioned in the reference Ghaderzadeh et al. (2022). The graphs again reveal a faster convergence rate of proposed hybrid BWO algorithm as compared with its standard version.
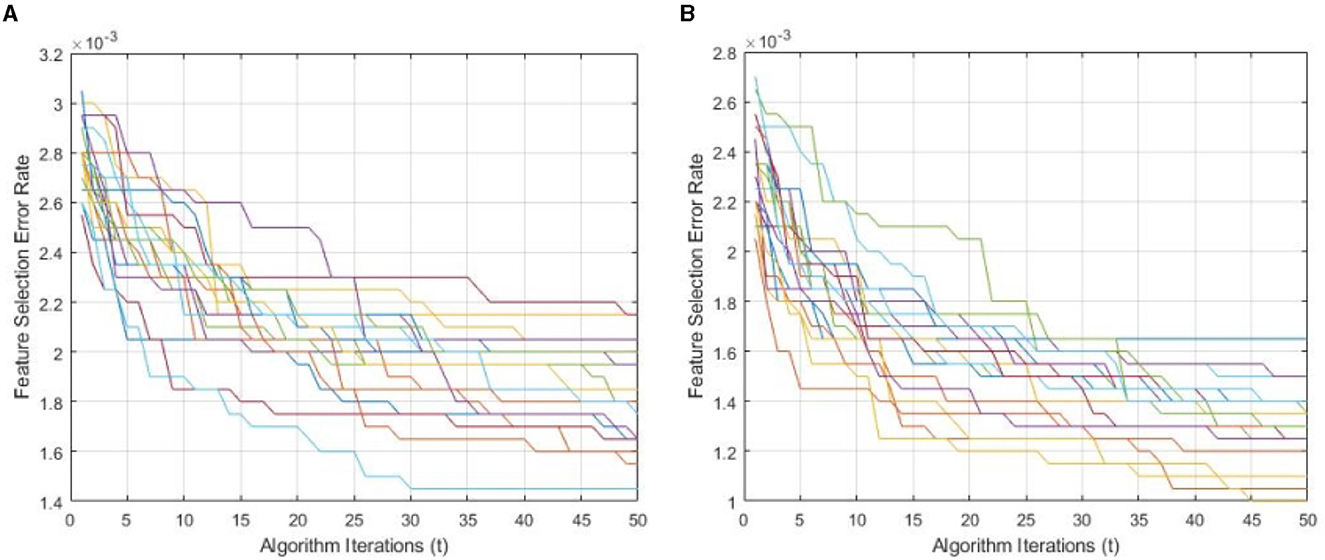
Figure 9. Convergence performance of standard and proposed hybrid BWO algorithm ON ALL-IDB2 dataset. (A) Standard BWO algorithm. (B) Proposed memetic BWO algorithm.
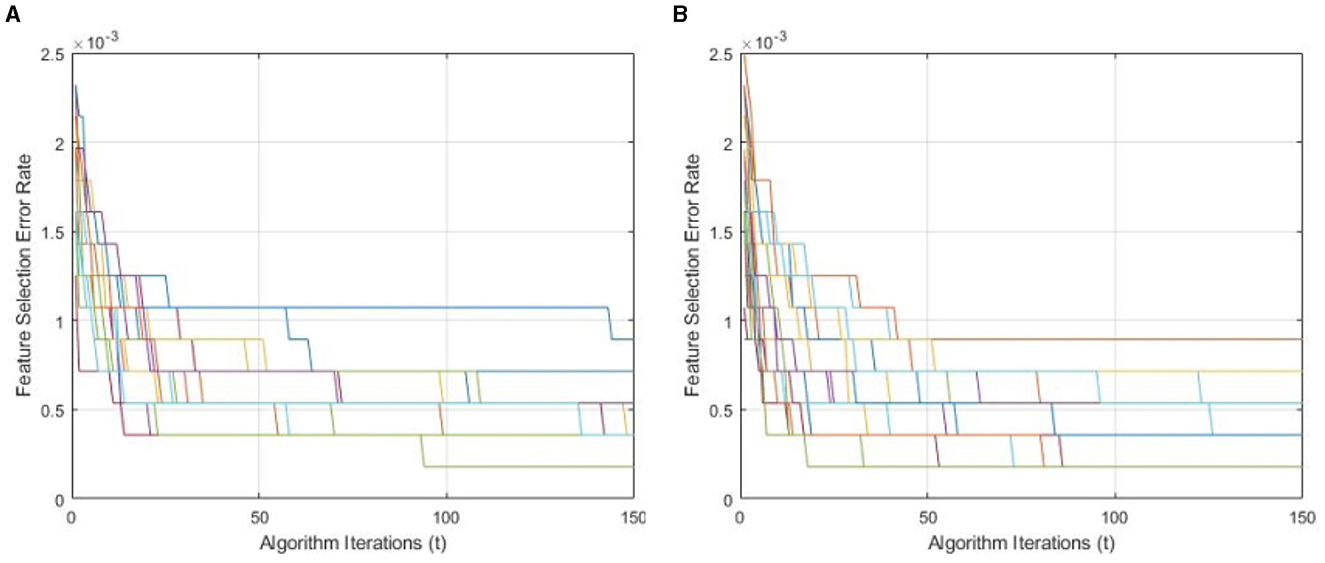
Figure 10. Convergence performance of standard and proposed hybrid BWO algorithm on multi-class dataset of the study mentioned in the reference Ghaderzadeh et al. (2022). (A) Standard BWO algorithm. (B) Proposed memetic BWO algorithm.
4.2 Leukemia sub type identification
In the subsequent stage, the proposed pipeline is employed for the purpose of leukemia sub type classification, utilizing the dataset of the study mentioned in the reference Ghaderzadeh et al. (2022). Dataset diversity is augmented through randomized rotation and scaling of images along with the application of color jitter. The image distribution of augmented dataset is shown in Table 9. In Table 10, the class distribution of images is demonstrated after performing random splitting of augmented dataset into training and validation parts with a 70:30 ratio. Using the similar approach of binary classification, the training dataset is used for transfer learning of GoogleNet and proposed custom CNN. The features are extracted from both networks and concatenated together to obtain a fused feature vector. The set of selected features is then obtained using proposed hybrid BWO algorithm and subsequently used for training of outer classifiers. Table 11 shows the ALL multi-class identification performance of selected classifiers. The average results are computed from several Monte-Carlo iterations of proposed pipeline. During each iteration, the overall value of all performance metrics of Table 11 is computed by micro-averaging of their individual class-wise values. A comparison of individual metrics of all classifiers is presented in Figure 11. Again, a better performance is demonstrated by the Ensemble Subspace KNN, which obtains an overall average accuracy of 98.6981% with relatively good values of other performance metrics. The confusion matrix of Ensemble Subspace KNN is shown in Figure 12.
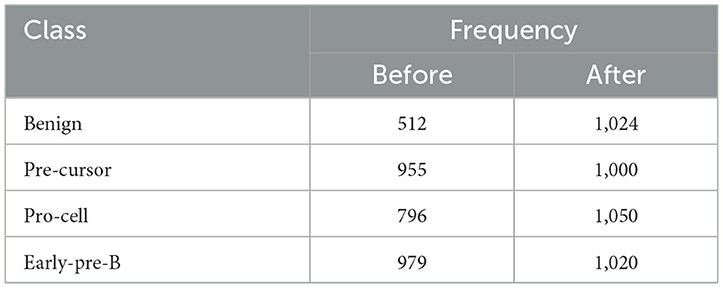
Table 9. Distribution of augmented dataset of the study mentioned in the reference Ghaderzadeh et al. (2022).
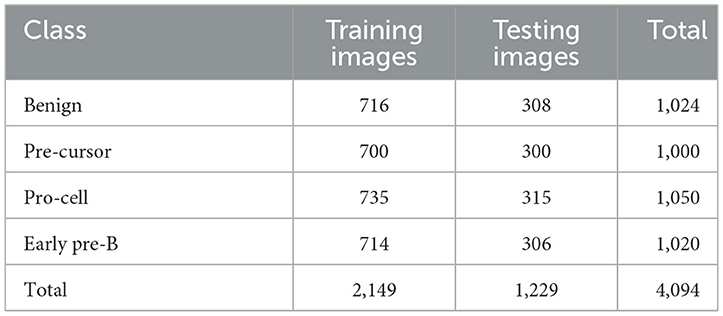
Table 10. Class distribution of training and testing parts of dataset of the study mentioned in the reference Ghaderzadeh et al. (2022) for leukemia sub type classification.
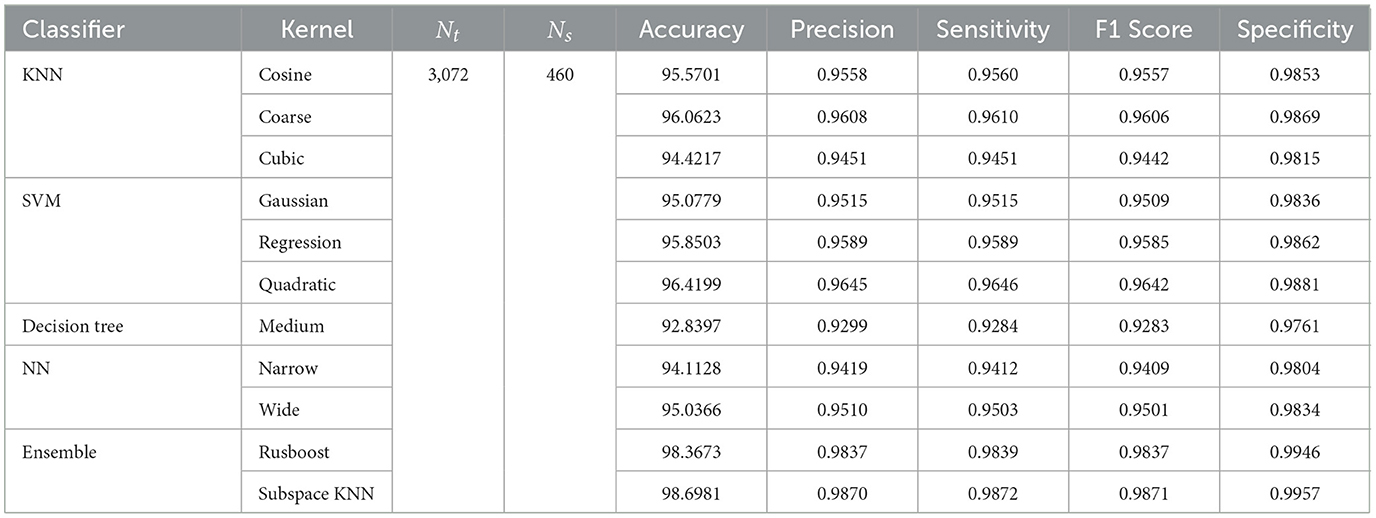
Table 11. Performance metrics of leukemia sub type classification using dataset of the study mentioned in the reference Ghaderzadeh et al. (2022).
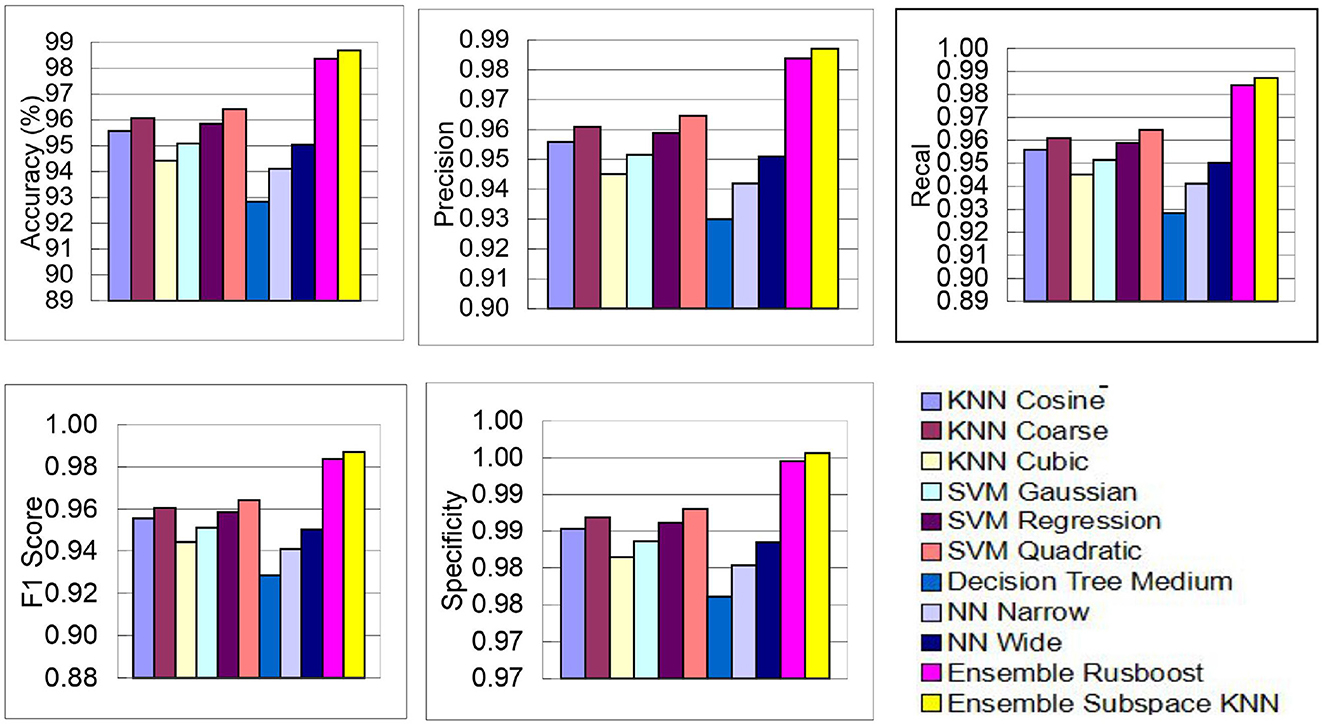
Figure 11. Performance results of selected classifiers for ALL sub type classification using dataset of the study mentioned in the reference Ghaderzadeh et al. (2022).
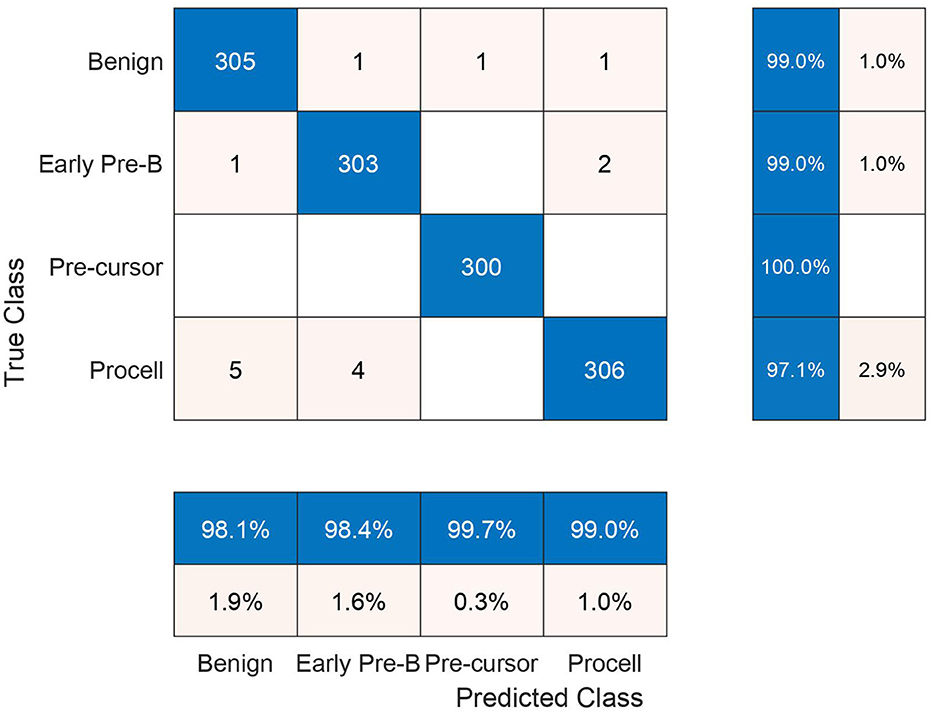
Figure 12. Testing confusion matrix of ensemble subspace KNN classifier on dataset of the study mentioned in the reference Ghaderzadeh et al. (2022).
Table 12 provides a comparison between the performance of our proposed approach and several existing studies focused on leukemia identification. To ensure a fair assessment, we specifically selected previously published studies that utilized either identical or highly similar datasets. Our proposed pipeline, designed for both binary leukemia detection and sub-type identification, demonstrates superior or at least comparable performance metrics compared with various other relevant investigations that employed smaller feature sets. These results affirm the effectiveness and practicality of our proposed methodology.
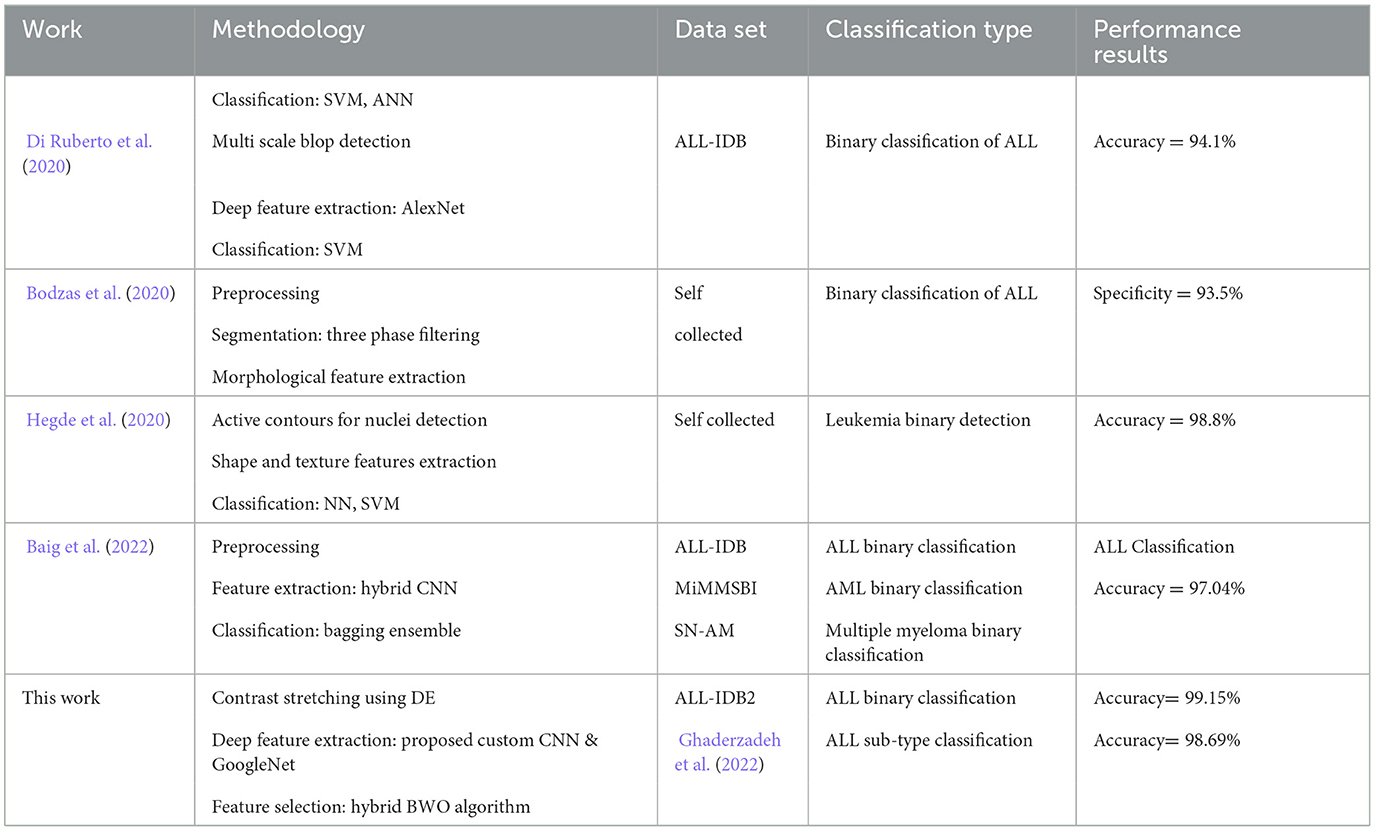
Table 12. Comparison of classification accuracy of proposed leukemia identification pipeline with some existing relevant studies.
4.3 Statistical analysis
In this study, we applied the one-way analysis of variance (ANOVA) (Fotso Kamga et al., 2018) method to verify the validity of classification results from statistical point of view. The statistical analysis was performed on classification accuracy as the key performance metric. For this purpose, a number of Monte Carlo iterations of the complete classification pipeline were performed with 10 fold-cross validation in each iteration. The accuracy values were collected for the above mentioned classifiers. The normality of accuracy data was validated using Shapiro–Wilk test (Akram et al., 2020). The homogeneity of variances of classifier accuracy values were verified using Bartlet's test (Ahmad et al., 2023a). The significance level α = 0.05 was selected. The p-values of KNN, SVM, Decision Tree, NN, and Ensemble family of classifier were p1 = 0.723, p2 = 0.7021, p3 = 0.694, p4 = 0.660 and p5 = 0.651, respectively, along with chi-squared probability pch = 0.825. The obtained p-values were less than α, which confirmed that null hypotheses of Shapiro–Wilk and Bartlet's test are true, i.e., accuracy values are normally distributed with homogeneous variances.
Table 13 shows the results of one-way ANOVA test performed on accuracy of selected classifiers. The key metrics include mean square error (MSE), degree of freedom (df), F-statistics, p-value, and sum of square deviation (SS).
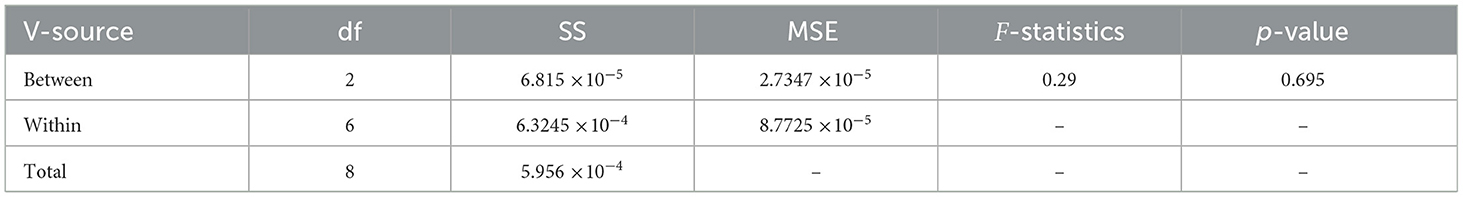
Table 13. ANOVA statistical results of proposed pipeline.
The confidence interval plot of selected classifiers on the proposed leukemia identification pipeline is shown. The average accuracy is demonstrated as red line, whereas the 95% confidence limits are shown as black lines. The figure demonstrates that ensemble subspace achieves a high average accuracy with small confidence interval as compared with other classifiers. The upper and lower quantile points of each classifier lie within the confidence interval limits.
5 Discussion
In this study, we examined the effectiveness of our proposed approach for the binary and multi-class identification of ALL. Modern deep CNNs often come with large model sizes, demanding significant memory and computational resources. Employing an ensemble of networks, including a tailored CNN alongside publicly available deep CNN models, offers a practical compromise between classification performance and pipeline complexity. Furthermore, leveraging pretrained CNN models for feature extraction and employing external classifiers is a potent and pragmatic strategy that amalgamates the advantages of transfer learning, feature abstraction, and minimized training effort to enhance the outcomes of diverse computer vision tasks. One drawback of this approach is that the feature sets extracted from deep CNNs often exhibit substantial size and encompass a considerable amount of duplicate features. Selection of most promising set of features is a combinatorial optimization problem with computational complexity of exhaustive search growing exponential with the size of feature vector. Population-based feature selection methods have shown a significant research interest in recent years. A number of bio-inspired and nature-inspired meta-heuristics have been proposed. One challenge is the exploration and exploitation capabilities of the algorithm problem of local optima. To address this issue, we have proposed a memetic feature selection approach that combines elements of population-based algorithms with local search methods. In particular, we have proposed a nature-inspired metaheuristic name binary whale optimization algorithm in which optimization of an iteration best solution is performed using a differential evolution method. These optimizations at CNN architecture and feature selection level yield an improved pipeline which shows promising results for leukemia detection and sub-type classification. The validity of proposed approach is manifested with better performance results as compared with several recently published studies.
6 Conclusion
Leukemia, a hematologic malignancy, afflicts both pediatric and geriatric populations. Acute lymphoblastic leukemia is an aggressive form of leukemia that has a high mortality rate. Modern computer vision approaches and deep CNNs have been demonstrated as potential solutions for computer aided diagnosis of several medical conditions. However, precise classification of malignancies at microscopic level is a challenging task due to morphological similarities between different blood entities. This study presents an improved pipeline for enhancing leukemia detection from blood smear images. At first, We propose an intricately designed 88-layer deep CNN architecture inspired by AlexNet and SqueezeNet. We used this network as a feature extractor alongside GoogleNet, aiming to balance classification accuracy and computational efficiency. The work then models the feature selection problem as a combinatorial optimization problem and proposes a novel memetic approach based on the Hybrid binary whale optimization algorithm to meticulously select the most dominant set of features. Our proposed methodology undergoes rigorous validation using publicly available datasets containing peripheral blood smear images across diverse leukemia classes. The proposed feature selection approach effectively selects the most dominant and discriminant set of features. The proposed system achieves an overall accuracy rate of 99.15% with an 80% reduction in feature size, performing comparably or better than several existing studies on leukemia identification. The propose method can be extended to the diagnosis of other blood-related diseases. It can complement advanced diagnostic methods such as RNA sequencing and molecular testing by providing additional supporting evidence. Additionally, it offers smooth integration with practical image analysis systems such as image flow cytometry, expanding their functionalities in real-world settings.
Data availability statement
Publicly available datasets were analyzed in this study. This data can be found here: Scotti et al. (2005) and Ghaderzadeh et al. (2022).
Author contributions
MA: Conceptualization, Data curation, Investigation, Methodology, Software, Validation, Writing – original draft, Writing – review & editing. RA: Methodology, Software, Validation, Writing – original draft. NK: Supervision, Writing – review & editing. AA: Writing – review & editing. NA: Writing – review & editing. AM: Resources, Validation, Writing – review & editing.
Funding
The author(s) declare financial support was received for the research, authorship, and/or publication of this article. This study was funded by the Researchers Supporting Project Number: RSP2024R157, King Saud University, Riyadh, Saudi Arabia.
Conflict of interest
The authors declare that the research was conducted in the absence of any commercial or financial relationships that could be construed as a potential conflict of interest.
Publisher's note
All claims expressed in this article are solely those of the authors and do not necessarily represent those of their affiliated organizations, or those of the publisher, the editors and the reviewers. Any product that may be evaluated in this article, or claim that may be made by its manufacturer, is not guaranteed or endorsed by the publisher.
Abbreviations
ALL, acute lymphoblastic leukemia; B-ALL, B cell acute lymphoblastic leukemia; AML, acute myeloid leukemia; ANOVA, analysis of variance; CNN, convolutional neural network; DNN, deep neural network; DE, differential evolution; DT, decision tree; RGB, red green blue; HSI, hue saturation intensity; SVMs, support vector machines; KNN, K-nearest neighbors; TP, true positive; FN, false negative; TPR, true positive rate; FNR, false negative rate; NN, neural network; WOA, whale optimization algorithm; WBC, white blood cell.
Footnotes
References
Ahmad, R., Awais, M., Kausar, N., and Akram, T. (2023a). White blood cells classification using entropy-controlled deep features optimization. Diagnostics 13:352. doi: 10.3390/diagnostics13030352
Ahmad, R., Awais, M., Kausar, N., Tariq, U., Cha, J.-H., Balili, J., et al. (2023b). Leukocytes classification for leukemia detection using quantum inspired deep feature selection. Cancers 15:2507. doi: 10.3390/cancers15092507
Akram, T., Naqvi, S. R., Haider, S. A., Kamran, M., and Qamar, A. (2020). A novel framework for approximation of magneto-resistance curves of a superconducting film using gmdh-type neural networks. Superlattices Microstruct. 145:106635. doi: 10.1016/j.spmi.2020.106635
Al-jaboriy, S. S., Sjarif, N. N. A., Chuprat, S., and Abduallah, W. M. (2019). Acute lymphoblastic leukemia segmentation using local pixel information. Pattern Recognit. Lett. 125, 85–90. doi: 10.1016/j.patrec.2019.03.024
Alruwaili, M. (2021). An intelligent medical imaging approach for various blood structure classifications. Complexity 2021:5573300. doi: 10.1155/2021/5573300
Baig, R., Rehman, A., Almuhaimeed, A., Alzahrani, A., and Rauf, H. T. (2022). Detecting malignant leukemia cells using microscopic blood smear images: a deep learning approach. Appl. Sci. 12:6317. doi: 10.3390/app12136317
Batool, A., and Byun, Y.-C. (2023). Lightweight efficientnetb3 model based on depthwise separable convolutions for enhancing classification of leukemia white blood cell images. IEEE Access 11, 37203–37215. doi: 10.1109/ACCESS.2023.3266511
Bodzas, A., Kodytek, P., and Zidek, J. (2020). Automated detection of acute lymphoblastic leukemia from microscopic images based on human visual perception. Front. Bioeng. Biotechnol. 8:1005. doi: 10.3389/fbioe.2020.01005
Chollet, F. (2017). “Xception: deep learning with depthwise separable convolutions,” in Proceedings of the IEEE Conference on Computer Vision and Pattern Recognition (Honolulu, HI: IEEE), 1251–1258. doi: 10.1109/CVPR.2017.195
Dese, K., Raj, H., Ayana, G., Yemane, T., Adissu, W., Krishnamoorthy, J., et al. (2021). Accurate machine-learning-based classification of leukemia from blood smear images. Clin. Lymphoma Myeloma Leuk. 21, e903–e914. doi: 10.1016/j.clml.2021.06.025
Di Ruberto, C., Loddo, A., and Puglisi, G. (2020). Blob detection and deep learning for leukemic blood image analysis. Appl. Sci. 10:1176. doi: 10.3390/app10031176
Elhassan, T. A. M., Rahim, M. S. M., Swee, T. T., Hashim, S. Z. M., and Aljurf, M. (2022). Feature extraction of white blood cells using cmyk-moment localization and deep learning in acute myeloid leukemia blood smear microscopic images. IEEE Access 10, 16577–16591. doi: 10.1109/ACCESS.2022.3149637
Fotso Kamga, G. A., Akram, T., Laurent, B., Naqvi, S. R., Alex, M. M., Muhammad, N., et al. (2018). A deep heterogeneous feature fusion approach for automatic land-use classification. Inf. Sci. 467, 199–218. doi: 10.1016/j.ins.2018.07.074
Ghaderzadeh, M., Aria, M., Hosseini, A., Asadi, F., Bashash, D., Abolghasemi, H., et al. (2022). A fast and efficient cnn model for b-all diagnosis and its subtypes classification using peripheral blood smear images. Int. J. Intell. Syst. 37, 5113–5133. doi: 10.1002/int.22753
Gupta, D., Agrawal, U., Arora, J., and Khanna, A. (2020). “Bat-inspired algorithm for feature selection and white blood cell classification,” in Nature-Inspired Computation and Swarm Intelligence, ed. X.-S. Yang (Amsterdam: Elsevier), 179–197. doi: 10.1016/B978-0-12-819714-1.00022-1
He, K., Zhang, X., Ren, S., and Sun, J. (2016). “Deep residual learning for image recognition,” in Proceedings of the IEEE Conference on Computer Vision and Pattern Recognition (Las Vegas, NV: IEEE), 770–778. doi: 10.1109/CVPR.2016.90
Hegde, R. B., Prasad, K., Hebbar, H., Singh, B. M. K., and Sandhya, I. (2020). Automated decision support system for detection of leukemia from peripheral blood smear images. J. Digit. Imaging 33, 361–374. doi: 10.1007/s10278-019-00288-y
Howard, A. G., Zhu, M., Chen, B., Kalenichenko, D., Wang, W., Weyand, T., et al. (2017). Mobilenets: efficient convolutional neural networks for mobile vision applications. arXiv [Preprint]. arXiv:1704.04861. doi: 10.48550/arXiv.1704.04861
Jha, K. K., Das, P., and Dutta, H. S. (2022). “Artificial neural network-based leukaemia identification and prediction using ensemble deep learning model,” in 2022 International Conference on Communication, Computing and Internet of Things (IC3IoT) (Chennai: IEEE), 1–6. doi: 10.1109/IC3IOT53935.2022.9767874
Jung, C., Abuhamad, M., Mohaisen, D., Han, K., and Nyang, D. (2022). Wbc image classification and generative models based on convolutional neural network. BMC Med. Imaging 22, 1–16. doi: 10.1186/s12880-022-00818-1
Kassani, S. H., Kassani, P. H., Wesolowski, M. J., Schneider, K. A., and Deters, R. (2019). “A hybrid deep learning architecture for leukemic b-lymphoblast classification,” in 2019 International Conference on Information and Communication Technology Convergence (ICTC) (Jeju: IEEE), 271–276. doi: 10.1109/ICTC46691.2019.8939959
Khan, S., Sajjad, M., Hussain, T., Ullah, A., and Imran, A. S. (2020). A review on traditional machine learning and deep learning models for wbcs classification in blood smear images. IEEE Access 9, 10657–10673. doi: 10.1109/ACCESS.2020.3048172
Khattak, M. I., Saleem, N., Gao, J., Verdu, E., and Fuente, J. P. (2022). Regularized sparse features for noisy speech enhancement using deep neural networks. Comput. Electr. Eng. 100:107887. doi: 10.1016/j.compeleceng.2022.107887
Krizhevsky, A.Hinton, G., et al. (2009). Learning Multiple Layers of Features from Tiny Images. Toronto, ON: University of Toronto.
Kumar, D., Jain, N., Khurana, A., Mittal, S., Satapathy, S. C., Senkerik, R., et al. (2020). Automatic detection of white blood cancer from bone marrow microscopic images using convolutional neural networks. IEEE Access 8, 142521–142531. doi: 10.1109/ACCESS.2020.3012292
Matek, C., Schwarz, S., Spiekermann, K., and Marr, C. (2019). Human-level recognition of blast cells in acute myeloid leukaemia with convolutional neural networks. Nat. Mach. Intell. 1, 538–544. doi: 10.1038/s42256-019-0101-9
Mirjalili, S., and Lewis, A. (2016). The whale optimization algorithm. Adv. Eng. Softw. 95, 51–67. doi: 10.1016/j.advengsoft.2016.01.008
Nithyaa, A. N., Prem Kumar, R., Gokul, M., and Geetha Anandhi, C. (2021). Matlab based potent algorithm for WBc cancer detection and classification. Biomed. Pharmacol. J. 14, 2277–2284. doi: 10.13005/bpj/2328
Pang, G., Zhuang, Y., and Zhou, P. (2015). “Automatic leukocytes classification by distance transform, moment invariant, morphological features, gray level co-occurrence matrices and SVM,” in First International Conference on Information Sciences, Machinery, Materials and Energy (Paris: Atlantis Press), 1089–1094. doi: 10.2991/icismme-15.2015.231
Redmon, J., and Farhadi, A. (2018). Yolov3: an incremental improvement. arXiv [Preprint] arXiv:1804.02767. doi: 10.48550/arXiv.1804.02767
Scotti, F., Labati, R., and Piuri, V. (2005). Acute Lymphoblastic Leukemia Image Database for Image Processing. Milan: Department of Computer Science, University of Milan.
Shahzad, A., Raza, M., Shah, J. H., Sharif, M., and Nayak, R. S. (2022). Categorizing white blood cells by utilizing deep features of proposed 4B-additionnet-based cnn network with ant colony optimization. Complex Intell. Syst. 8, 3145–3159. doi: 10.1007/s40747-021-00564-x
Siegel, R. L., Giaquinto, A. N., and Jemal, A. (2024). Cancer statistics, 2024. CA: Cancer J. Clin. 74, 12–49. doi: 10.3322/caac.21820
Sung, H., Ferlay, J., Siegel, R. L., Laversanne, M., Soerjomataram, I., Jemal, A., et al. (2021). Global cancer statistics 2020: globocan estimates of incidence and mortality worldwide for 36 cancers in 185 countries. CA: Cancer J. Clin. 71, 209–249. doi: 10.3322/caac.21660
Szegedy, C., Liu, W., Jia, Y., Sermanet, P., Reed, S., Anguelov, D., et al. (2015). “Going deeper with convolutions,” in Proceedings of the IEEE Conference on Computer Vision and Pattern Recognition (Boston, MA: IEEE), 1–9. doi: 10.1109/CVPR.2015.7298594
Keywords: deep neural networks, optimization, meta-heuristics, transfer learning, convolutional neural network
Citation: Awais M, Ahmad R, Kausar N, Alzahrani AI, Alalwan N and Masood A (2024) ALL classification using neural ensemble and memetic deep feature optimization. Front. Artif. Intell. 7:1351942. doi: 10.3389/frai.2024.1351942
Received: 10 December 2023; Accepted: 15 March 2024;
Published: 09 April 2024.
Edited by:
Erik Cuevas, University of Guadalajara, MexicoReviewed by:
Ahmed Salama, Future University in Egypt, EgyptAyad Al-Dujaili, Middle Technical University, Iraq
Pooja Pathak, GLA University, India
Copyright © 2024 Awais, Ahmad, Kausar, Alzahrani, Alalwan and Masood. This is an open-access article distributed under the terms of the Creative Commons Attribution License (CC BY). The use, distribution or reproduction in other forums is permitted, provided the original author(s) and the copyright owner(s) are credited and that the original publication in this journal is cited, in accordance with accepted academic practice. No use, distribution or reproduction is permitted which does not comply with these terms.
*Correspondence: Muhammad Awais, muhammadawais@ciitwah.edu.pk; Anum Masood, anum.masood@ntnu.no