 D. R. N. Vos1,2†
 R. E. Pouw
 R. M. A. Heeren
 B. Balluff
- 1The Maastricht MultiModal Molecular Imaging Institute (M4I), Maastricht University, Maastricht, Netherlands
- 2Center for Mass Spectrometry and Optical Spectroscopy (CeMOS), Mannheim University of Applied Sciences, Mannheim, Germany
- 3Department of Pathology, Amsterdam UMC, University of Amsterdam, Amsterdam, Netherlands
- 4Department of Gastroenterology and Hepatology, Amsterdam UMC, University of Amsterdam, Amsterdam, Netherlands
- 5Mass Spectrometry Imaging Laboratory, School of Chemistry and Molecular Bioscience, University of Wollongong, Wollongong, NSW, Australia
Glycosylation plays an important role in the progression of esophageal adenocarcinoma (EAC). Being able to image these glycosylation changes directly in endoscopic resection specimens could provide useful insights into the molecular mechanisms of the disease progression and potential markers for EAC staging. For this purpose, both 3D and 2.5D matrix-assisted laser/desorption ionization (MALDI) mass spectrometry imaging (MSI) have been employed in this study to investigate glycosidase-cleaved N-glycans in a total of 24 formalin-fixed paraffin-embedded esophageal local excision specimens spanning all stages of disease progression, namely from non-dysplastic Barrett’s esophagus to metastatic EAC. 3D-MSI was first used to estimate the number of sections needed to sufficiently cover the molecular heterogeneity of each stage of progression. This analysis showed that a total of four sections out of 20 were sufficient. This subset of four sections was measured for all remaining specimens and is called 2.5D-MSI. Subsequent analyses of the 2.5D-MSI datasets revealed significant elevations of five high-mannose N-glycans (Man3, Man4, Man6, Man7, and Man8) in EAC and three complex (Hex6HexNAc5, Hex6HexNAc5NeuAc1, Hex7HexNAc6) N-glycans in metastatic EAC as compared to previous stages of the disease. The augmented levels of these glycans in EAC could be explained by publically available gene expression data of enzymes involved in glycan synthesis and processing. As the role of glycosylation is gaining more interest in MSI and cancer research, our results show the added value of combining localized N-glycan levels, as provided by MSI, with gene expression to gain a deeper understanding of the mechanisms behind N-glycan changes. This gives evidence at multiple levels that specific N-glycosylation plays an important role during progression of dysplasia to EAC and could play a role in patient surveillance.
Introduction
Esophageal adenocarcinoma (EAC) is an aggressive disease that is often diagnosed at a late stage and has therefore a dismal prognosis. Even though advances have been made in both diagnosis and therapeutics, it still has a poor 5-year survival rate of 15–25% (Enzinger and Mayer, 2003; Domper Arnal et al., 2015; Lin et al., 2016). Moreover, the incidence of esophageal adenocarcinoma has risen dramatically over the last decades (Runge et al., 2015).
The only known precursor lesion is Barrett’s esophagus (BE), a condition in which the squamous epithelial lining of the distal esophagus is replaced by columnar epithelium containing intestinal metaplasia because of chronic gastroesophageal reflux (Spechler, 2002). Esophageal adenocarcinoma can develop by gradual progression from non-dysplastic BE (NDBE) over low-grade dysplasia, high-grade dysplasia, intramucosal cancer to eventually invasive adenocarcinoma (Shaheen and Richter, 2009). When discovered in early stage (i.e., dysplasia or intramucosal cancer) a local curative treatment using endoscopic resection is possible (van Munster et al., 2021). Hence, a correct staging of the disease is of crucial importance for the therapy.
The progression from NDBE to EAC is accompanied by a large number of alterations in oncogenic pathways and tumor suppressor genes that play a role and vary individually in EAC development (Caspa Gokulan et al., 2019). The complexity of EAC is also reflected in its molecular heterogeneity at the spatial tissue level (Talukdar et al., 2018; Walker and Underwood, 2018). Understanding the local molecular alterations underlying adeno-carcinogenesis in the context of tissue-based molecular and cellular heterogeneity will aid in understanding the mechanisms of cancer onset, its prevention, and the development of personalized therapy (Talukdar et al., 2018). Especially, since EAC precursor lesions are very locally confined events, gaining insight into the molecular sequence of events that lead to EAC requires an in situ molecular analysis.
One technique, that allows both the label-free detection of molecular species and records their spatial distribution, is mass spectrometry imaging (MSI) (Vaysse et al., 2017; Cressman and Spraggins, 2018). It allows the simultaneous detection of a large number of compounds from a broad range of molecular classes (small molecules, lipids, peptide, proteins, and modifications thereof). In cancer research, it has already been used to determine metabolite and lipid profiles in therapy-resistant tumors (Barre et al., 2018), to reveal tumor heterogeneity (Schone et al., 2013; Balluff et al., 2015), as well as to aid in classifying tumors (Mascini et al., 2018).
In EAC research, MSI has already been employed for the identification of specific peptide profiles for EAC stages in 300 patient tissues assembled into tissue microarrays (Quaas et al., 2013). In two other studies on intact proteins, MSI identified several proteins that could be linked to EAC development, EAC metastases, patient prognosis, and chemotherapy response (Elsner et al., 2012; Aichler et al., 2013). A study using desorption ionization MSI investigated lipid profiles of metastatic and non-metastatic primary tumors, which allowed to predict with 98% accuracy the metastatic status of patients (Abbassi-Ghadi et al., 2016).
Glycosylation is one of the most important post-translational modifications of proteins (Wang et al., 2019) and aberrant glycosylation has been found implicated in various types of cancers, including EAC during malignant transformation, albeit the latter on a serum level (Mechref et al., 2009). N-linked glycans have already been studied by MSI in ovarian and breast cancer. It allowed the differentiation between tumor and non-tumor regions (Everest-Dass et al., 2016) and identified N-glycans specific for late-stage compared to the early-stage ovarian cancer like sialylated structures and oligomannose N-glycans (Briggs et al., 2019) In breast cancer, MSI found the specific presence of polylactosamine glycans in triple-negative, metastatic, and advanced HER2+ patients (Scott et al., 2019a) and a core-fucosylated tetra-antennary glycan correlated with poor clinical outcome (Herrera et al., 2019).
The aforementioned studies provided evidence for the added benefit of MSI in differentiating different stages as well as finding new potential markers. Although these results are encouraging, most MSI studies limit themselves to one section per sample. However, cancer is a molecularly heterogeneous disease, and analyzing only a single section can lead to discrepancies with a full tissue analysis (Guo et al., 2018). It is important to overcome the sampling bias and analyze either the whole 3D volume or measure a representative subset of sections of the whole tissue (2.5D), as we have shown previously (Paine et al., 2019; Vos et al., 2019).
The aim of this study is to investigate N-glycan changes in human esophageal adeno-carcinogenesis (Figure 1) using 3D matrix-assisted laser/desorption ionization MSI (MALDI-MSI) followed by 2.5D MALDI-MSI of 24 formalin-fixed paraffin-embedded (FFPE) esophageal endoscopic resection specimens with complete coverage of all steps of the esophageal adeno-carcinogenesis.
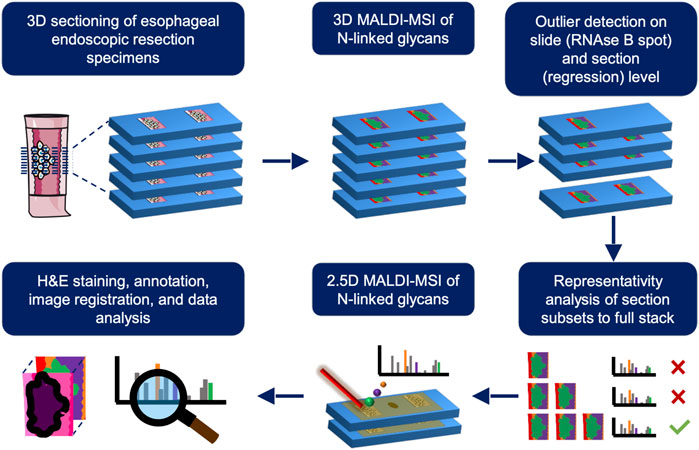
FIGURE 1. Schematic overview of the different experimental steps involved for a single stage of the esophageal adenocarcinoma progression sequence. First, 3D matrix-assisted laser/desorption ionization mass spectrometry imaging (MALDI-MSI) is employed on one tissue sample and outliers are removed on a slide- (using a RNAse B spot on every slide as quality control) and section-basis (using regression analysis across z-dimension). After outlier removal, the number of sections needed to be representative of the whole volume is determined using a correlation analysis from section subsets to the full 3D stack consisting of 20 sections. This subset is used is for subsequent 2.5D MALDI-MSI of the remaining patients and used for further analyses where the resulting images are overlaid with their annotated H&E stains (lower row). This process is repeated for all stages of EAC progression.
Material and methods
Patient material
24 formalin-fixed, paraffin-embedded (FFPE) tissue blocks obtained from endoscopic mucosal resection specimens of 24 patients were retrieved from the pathology archives of the Amsterdam Medical Center (Amsterdam, Netherlands). All samples were anonymized for further use and did not require approval from the relevant Institutional Ethics Committee under applicable local regulatory law (‘Code of conduct’, FEDERA). These 24 tissue blocks covered the following consecutive stages of disease progression: three with non-dysplastic Barrett’s esophagus, six with low- or high-grade dysplasia, five with intramucosal cancer, and ten with esophageal adenocarcinoma, of which six were of patients who developed distant metastasis during follow-up. From each tissue block, 20 consecutive sections with a thickness of 5 µm and spaced 10 µm apart were cut on indium tin oxide-coated conductive (ITO) glass slides (Rs 4–8 Ω/sq, Delta Technologies Ltd., Loveland, Colorado, United States) with two sections per slide.
Sample preparation
Materials. Xylene, HPLC grade ethanol, UHPLC grade water, ULC/MS - CC/SFC acetonitrile, and ULC/MS - CC/SFC grade methanol were purchased from Biosolve Chimie SARL (Dieuze, France). Citric acid monohydrate, α-cyano-4-hydroxycinnamic acid (CHCA, C10H7NO3), and trifluoracetic acid (TFA, Chromasolv®, for HPLC), and RNAse B (Glycoprotein Standard from bovine pancreas) were purchased from Sigma-Aldrich (Zwijndrecht, Netherlands). PNGase F was purchased from N-Zyme Scientifics, LLC (Doylestown, Pennsylvania, United States). Eosine-Y, Alcoholic was purchased from Avantor® Performance Materials B.V. (Deventer, the Netherlands). Hematoxylin solution modified according to Gill and Entellan® new were purchased from Merck KGaA (Darmstadt, Germany), and coverslips were purchased from Thermo Scientific (Waltham, Massachusetts, United States).
N-glycan MALDI-MSI preparation. Sections were pre-heated on a heating plate at 60°C for an hour to melt the paraffin. Immediately after, the sections were washed with xylene for 1 × 5 min and 2 × 10 min to remove the paraffin, followed by subsequent washes with ethanol (3 × 2 min) to remove the lipids and with water (2 × 5 min) to rehydrate the sections. Antigen retrieval was subsequently performed to undo the cross-linking of proteins induced by the formalin fixation with a 10 mM citric acid solution at pH 6.0 using the Antigen Retriever 2100 (Aptum Biologics, Southampton, United Kingdom) at 121°C for 20 min. Sections were then washed with water (2 × 1 min) and after drying of the slides 1 µL of 1 μg/μL RNAse B was spotted on the slides as quality control. This was followed by application of 15 layers of 200 ng/μL water-dissolved PNGase F using a SunCollect pneumatic sprayer (SunChrom Wissenschaftliche Geräte GmbH, Friedrichsdorf, Germany) at a flowrate of 10 μl/min, nozzle speed of 900 mm/min, nozzle height of 25 mm, and a track spacing of 1 mm where the slides were randomized. This was followed by incubation of the slides for 3 h in an air-tight incubation box containing 50% methanol at 37°C. Afterward, the sections were coated with 8 layers of 5 mg/ml CHCA in a 50% acetonitrile solution containing 0.2% TFA using an automated TM-sprayer (HTX Technologies, LLC, North Carolina, United States) at 30°C with a flowrate of 0.05 ml/min with no drying time in between the layers. All slides underwent sample preparation in randomized order.
Data acquisition
Mass spectrometry imaging. All sections were measured on a rapifleX MALDI-ToF/ToF instrument (Bruker Daltonik GmbH, Bremen, Germany) in positive-ion mode at a spatial resolution of 50 µm in the m/z range of 800–4,000 by scanning the laser across a 45 × 45 µm2 area and summing 200 shots per pixel. To obtain reproducible results, detector checks were performed at the start of each measurement day and laser intensity and height were optimized on the matrix intensity off tissue to obtain similar intensities for the matrix (∼3–4E4). Before each measurement, the instrument was calibrated using red phosphorus as a calibration agent. During acquisition, the data were automatically processed with Savitzky-Golay smoothing (0.01 m/z width, a cycle), TopHat baseline subtraction, and centroid peak detection (0.05 m/z peak width, S/N ≥ 5, and height 78%).
Hematoxylin and Eosin (H&E) staining and annotations. Following MSI analysis, sections were H&E stained by first washing off the matrix from the slides in 70% ethanol for 2 × 3 min, followed by a 3-min wash with MilliQ. Slides were stained with hematoxylin (3 min), washed for 3 min with tap water to remove excess hematoxylin, then stained with eosin (30 s), washed again for 3 min to remove excess eosin, followed by a 1-min ethanol wash and a 30 s xylene wash before attaching coverslips to the slides using Entellan as a mounting medium. After 24 h drying, optical images of the H&E tissue sections were acquired using a microscopic slide scanner (Mirax Desk, Zeiss, Jena, Germany). For each sample, one unmeasured, digital H&E section was annotated in high detail by a pathologist allocating individual regions of the tissue a specified grade of dysplasia or cancer. These annotations were then manually transferred onto the scanned and H&E stained MSI sections. Annotations for each section were grouped to obtain an average spectrum for every patient and section.
3D-MSI N-glycan analysis
Data preparation. In total five complete 3D-MSI datasets were acquired representing the different EAC progression stages: one for non-dysplastic Barrett’s esophagus, one for (low- and high-grade) dysplasia, one for intramucosal cancer, one for adenocarcinoma, and one for adenocarcinoma with metastasis. These 3D datasets were imported into separate SCiLS Lab 2022b (Bruker Daltonics, Bremen, Germany) files for representativity analysis using a 200 data points precision for the TopHat baseline subtraction. Spectra were normalized on their total-ion-count (TIC) and a ± 0.2 Da interval width per peak was chosen for further analysis. The overall average mass spectrum was exported to mMass (Strohalm et al., 2008) for peak picking to reduce the amount of data prior to processing. Peak picking in mMass was preceded by 35 precision baseline correction, Gaussian smoothing with a 0.3 Da window size and 1 cycle, crop from m/z 920 to 3000, and a de-isotoping with a 70% intensity tolerance and 0.2 Da isotope mass tolerance. Peaks were picked that had an S/N ≥ 5 at maximum height in the mean spectrum and matrix peaks were removed by expelling those peaks up to m/z 2,500 that had a mass defect ≤ 0.3. The resulting list was imported back into SCiLS Lab and used for further analysis. Maximum intensities for each peak interval (0.2 Da) in the peak list for every section was afterward exported from SCiLS Lab in tabular form for sequential outlier detection and representation analysis in R (version 4.1).
MSI data from the RNAse B quality controls were imported into separate (per 3D dataset) SCiLS Lab files for outlier detection employing a 200 precision TopHat baseline subtraction. All spectra were normalized to TIC for subsequent analysis and peak picking was performed in mMass on the exported overall average mass spectrum employing the same pre-processing as for the 3D-MSI data except for the following settings: peaks were picked that had an S/N ≥ 3 and a relative intensity threshold ≥ 1% (with respect to the base peak) at maximum peak height. The resulting list was imported back into SCiLS Lab and used for further analysis.
Outlier detection. Outlier slides or sections were identified based on two outlier strategies that were previously reported by our group (Vos et al., 2019). For identifying outlier slides, a principal component analysis (PCA) was performed on the TIC-normalized mean spectra of the RNAse B quality control spots per slide using a 95% error ellipse in the first two-component space. All RNAse B measurements outside this ellipse were considered outliers and corresponding slides were removed from further analysis. To identify outlier sections, we use a method that investigates the intensity gradient of single m/z values in the z-directionality within a 3D model. Per m/z value a regression is fitted to a linear or quadratic function, depending on which one fits best according to the Akaike information index, and the section with the maximum residual is recorded. This is repeated for all m/z values and the sections that have a residual count higher than a set threshold (i.e. ≥ 99% confidence interval of expected by-chance mean frequency, Eq. 1) are considered outliers. A combination of these two outlier detection methods resulted in a list with outlier sections that were not considered for further analysis.
Representation analysis. Based on the 3D-MSI data after outlier detection it was determined how many sections per patient are sufficiently representative of the whole volume. This was done as described previously by our group (Vos et al., 2019). Briefly, an average spectrum is created for the whole 3D volume and each section. The mean spectrum of the whole 3D volume is then compared to the average spectra obtained for a subset of n random sections and repeated 100 times. Subsequently, this is repeated with n+1 sections until all 20 sections have been used. For each combination a Pearson correlation coefficient is calculated and the first number of sections that reaches 0.99 defines the minimum number of sections required.
2.5D-MSI N-glycan analysis
Spectral recalibration. In total 19 2.5D-MSI datasets were acquired that included RNAse B quality controls for each measured slide. All sections were individually recalibrated by selecting one spectrum per section containing N-glycans covering the whole spectral range. These spectra were then manually recalibrated in flexAnalysis (Bruker Daltonik GmbH, Bremen, Germany) using a mass list containing known molecular signals from m/z 860 up to m/z 2,540 (Supplementary Table S1) and a 500 ppm tolerance to be able to recalibrate the low-intensity masses at the higher end of the spectrum. The calibration constants of each recalibrated spectrum were automatically copied and pasted to all other spectra from the same dataset.
Outlier detection. MSI data from all RNAse B quality controls was also imported into SCiLS Lab for outlier detection employing a 200 precision TopHat baseline subtraction. All spectra were normalized to TIC for subsequent analysis and peak picking was performed in mMass on the exported overall average mass spectrum with the same settings as for the 3D-MSI RNAse B data (see above). The resulting list was imported back into SCiLS Lab and used for further analysis. The RNAse B quality controls were checked for outliers in the 2.5D-MSI data as described above. Outliers were replaced by the measurement of consecutive slides.
Data preparation. The recalibrated MSI datasets were manually co-registered with their annotated H&E images and imported into SCiLS Lab 2022b using TopHat baseline subtraction with a window width of 200. Spectra were TIC normalized and a ±0.2 Da interval width per peak was chosen for further analysis. The overall average mass spectrum was exported to mMass (Strohalm et al., 2008) for peak picking to reduce the amount of data prior to processing. Peak picking in mMass was preceded by a cropping of the mass range to m/z 920–3,000, by applying a baseline correction (precision = 35), and a 1-cycle Gaussian smoothing with a 0.3 Da-sized window. Peaks were picked that had an S/N ≥ 3 at maximum height and the resulting peak list underwent de-isotoping with a 70% intensity tolerance and 0.2 Da isotope mass tolerance. This was followed by a manual clean-up to remove false-positive peak detections.
N-glycan identification. The remaining peaks were tentatively identified by mass-matching them with a maximum tolerance of 60 ppm to N-glycans reported in the MSI literature (Heijs et al., 2016; Drake et al., 2017; West et al., 2018) (Supplementary Table S2). The resulting list was imported back into SCiLS Lab and used for further analysis.
The identities of statistically significant N-glycan signals, as determined by the next step (“Data Analysis”) were corroborated by additional high-mass resolution MALDI MS (Supplementary Material S1A) and MALDI-based MS/MS (Supplementary Material S1B) experiments directly from tissue.
Data analysis. For every technical replicate, the SCiLS Lab data of annotated areas was exported using the “maximum peak intensity” (mean spectrum statistics) of every peak interval to investigate if N-glycans show significant differences in abundance over the different stages. Statistical analyses were performed in R (version 4.1.0). Analysis of Variance (ANOVA) was employed, for which the data were log-transformed to comply with the requirement of normally distributed data. As the data is composed of 19 patients with 4 technical replicates each, a repeated measurement design was used in the ANOVA model. The obtained p-values were corrected for multiple testing using the Benjamini-Hochberg method. p-values < 0.05 were considered strongly significant and between 0.05 and 0.1 weakly significant. Post-hoc pairwise comparisons were performed using the emmeans (“estimated marginal means”) package in R.
Meta-analysis on enzyme expression levels. The publically available gene expression datasets from the NCBI GEO DataSets repository (https://www.ncbi.nlm.nih.gov/gds) on esophageal cancer GSE1420 (Kimchi et al., 2005) and GSE2444 (Gomes et al., 2005) were searched for enzymes that are involved in the synthesis of N-glycans observed in this study (Supplementary Table S4) (Hemmoranta et al., 2007; Nettleship and Petrescu, 2012). In case of dataset GSE1420, the reported p-values of the enzymes were re-scored to be 0 (p-value>0.06), 0.5 (0.04≤p-value≤0.06), or 1 (p-value<0.04).
Results
Determination of minimum number of sections per patient using 3D MALDI-MSI
Imaging the tissue blocks of all endoscopic resection specimens reconstructed in 3D is time-consuming and merits the question whether it provides significantly more information over a subset of sections. We set out to determine the minimum number of sections statistically representative of a whole 3D volume made out of 20 consecutive sections. For this purpose, five full 3D-MSI dataset were acquired: one for non-dysplastic Barrett’s esophagus, one for low- and high-grade dysplasia, one for intramucosal cancer, one for esophageal adenocarcinoma (EAC), and one for EAC with metastasis; thereby spanning the whole sequence of EAC progression (Figure 1).
Outliers slides were detected and removed based on RNAse B quality controls that were present on every slide. Performing a PCA on the RNAse B spectra with a 95% error ellipse threshold in the first two principal component space showed that the sample preparation was similar on all slides with the exception of one slide in the low- and high-grade dysplasia dataset, which exhibited a lower digestion efficiency and was therefore removed (Supplementary Figure S1A). Individual outlier sections were determined by investigating deviations from the steady intensity gradients in the z-direction (Vos et al., 2019). On average 2.6 sections were classified as outliers per 3D-MSI dataset through the application of this criterion (Supplementary Figure S1B).
For each of these 3D-MSI datasets, the aim was to subsequently find a set of representative sections (2.5D) for the whole tissue. An average spectrum was calculated as a reference for every 3D-MSI dataset for this purpose. Then this reference spectrum was compared to the average spectrum calculated from an increasing number of randomly chosen sections by determining the similarity between these two profiles using Pearson correlation. Taking a minimum coefficient of 0.99, on average 2.6 and maximum 4 sections were found to be sufficiently representative for a 3D-MSI dataset (Figure 2A), which is 20% of the total sample size of 20 sections. To have a consistent amount of sections for all stages of progression to EAC, we decided to include 4 sections for all remaining patients, also because two sections had always been placed on one single slide (Figure 2B).
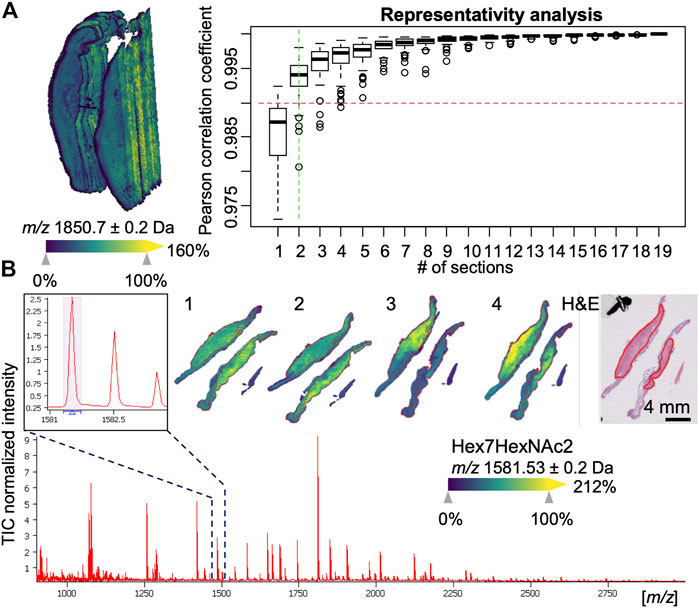
FIGURE 2. Examples of 3D and 2.5 mass spectrometry imaging (MSI) data. (A) 3D visualization of an esophageal adenocarcinoma (EAC) dataset consisting of 20 sections with 10 µm spacing (left hand side). A representativity analysis can be performed (right hand side) using Pearson correlation to estimate the minimum number of section to reach a minimum level of correlation to the full stack. (B) Overall average spectrum with zoom-in on an m/z signal corresponding to an N-linked glycan Hex7HexNAc2 and its visualization in one of the 2.5D EAC MSI datasets consisting of 4 sections (numbered 1–4) along with the pathologist-annotated hematoxylin and eosin (H&E) stained tissue section, which shows the specific co-localization of the glycan in the tumor region (red-outlines).
Mapping N-glycan changes during esophageal adenocarcinogenesis
Based on the previous representativity analysis, we measured slides 3 and 8 (or alternatively slide 4 and 9, respectively, in case a slide was found an outlier according to RNAse B quality control) from the remaining 19 patients with different stages of the esophageal adenocarcinogenesis (Table 1): 2 non-dysplastic Barrett’s esophagi (NDBE), 5 dysplasias (DYS), 4 intramucosal cancer (IMC), 3 esophageal adenocarcinoma patients without (EAC) and 5 EAC patients with distant metastases (EAC + M). Annotations by an experienced pathologist were used to extract the N-glycan profiles from the respective relevant tissue areas.
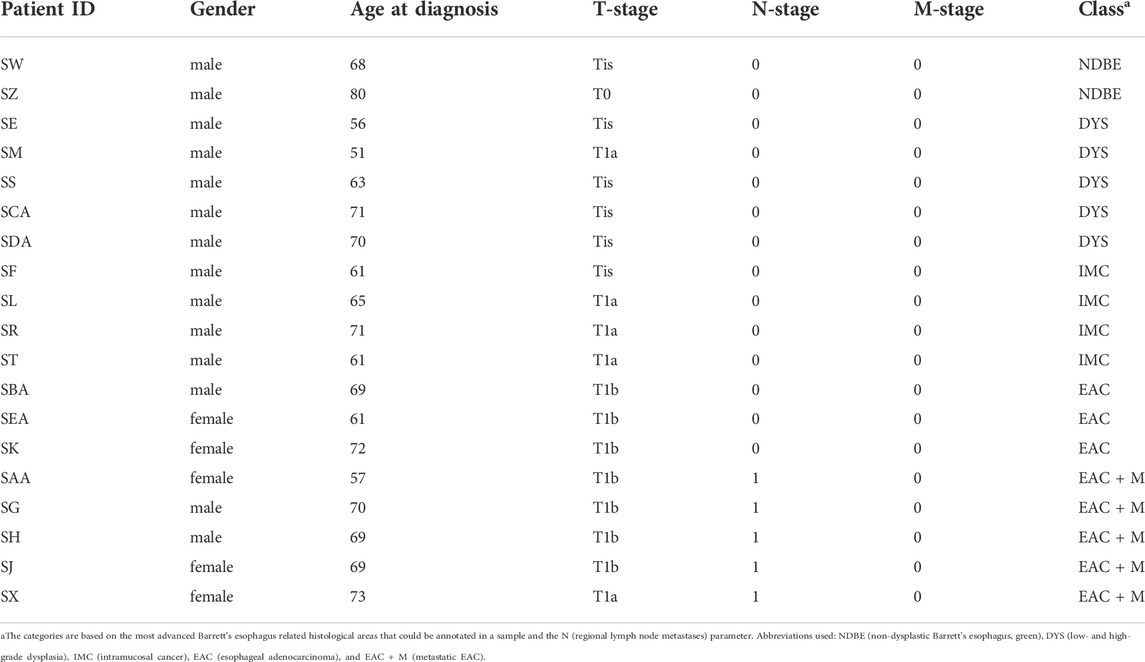
TABLE 1. Summary of patient characteristics for the 2.5D analysis.
After peak picking, 64 of the 146 detected signals (44%) could be assigned, based on literature, to known N-glycan species which are commonly detected with a single sodium adduct in positive-mode MALDI-MSI (Supplementary Table S2) (Powers et al., 2015; Heijs et al., 2016; West et al., 2018). To determine if there are differentially expressed N-glycans between the different EAC stages, a statistical model was calculated for every N-glycan that considered the four technical replicates per specimen. This analysis revealed three strongly significant (corrected p-value ≤ 0.05) and five weakly significant (corrected p-value ≤ 0.1) altered N-glycans, all of which were found at higher abundances in EAC or metastatic EAC as compared to previous stages of the disease (statistics in Supplementary Table S3 and boxplots in Supplementary Figure S2). Table 2 summarizes the ANOVA statistics and the type of these N-glycans. While there was a significant bias of female subjects in the advanced stages (Table 1), as revealed by a Fisher exact test (p-value = 0.05, Supplementary Table S3), all of the eight N-glycans were independent of the factor gender (all p-values>0.6, Supplementary Table S3). There was no significant effect for age (Supplementary Table S3).
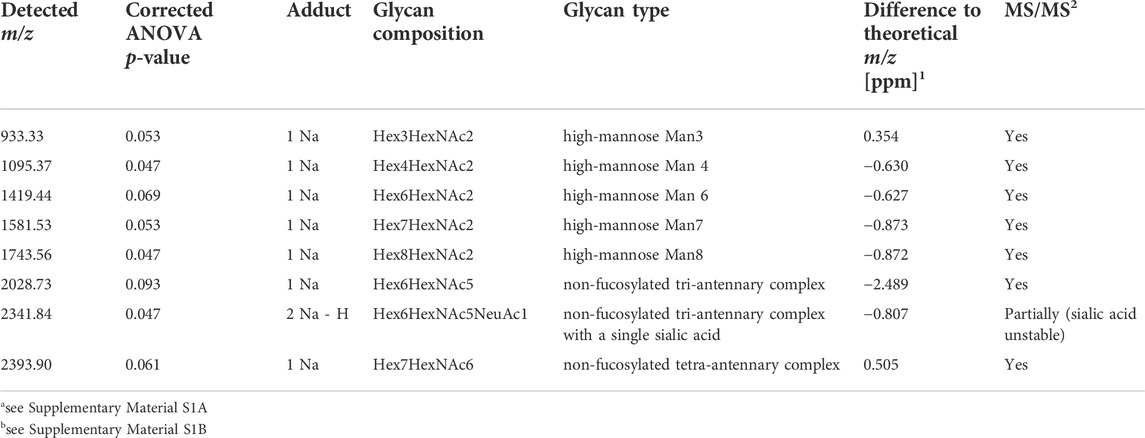
TABLE 2. Summary of N-glycans showing differential abundances between stages of esophageal carcinogenesis.
With respect to the types of N-glycans, high-mass resolution and tandem MS experiments corroborated the assumed identities of the eight N-glycan signals (Supplementary Material S1). Of these, the signals belonging to five high-mannose glycans with three, four, six, seven, and eight mannoses were detected and found to be elevated in EAC (including metastatic EAC) as compared to earlier stages (Figure 3A, Supplementary Figure S2), amongst them two statistically significant between dysplasia and EAC (Supplementary Table S3): Hex4HexNAc2 (m/z 1095.37) and Hex7HexNAc2 (m/z 1581.53). This is confirmed by the visualizations that show a co-localization of the high-mannose signals with the tumor annotations (Figure 2B).
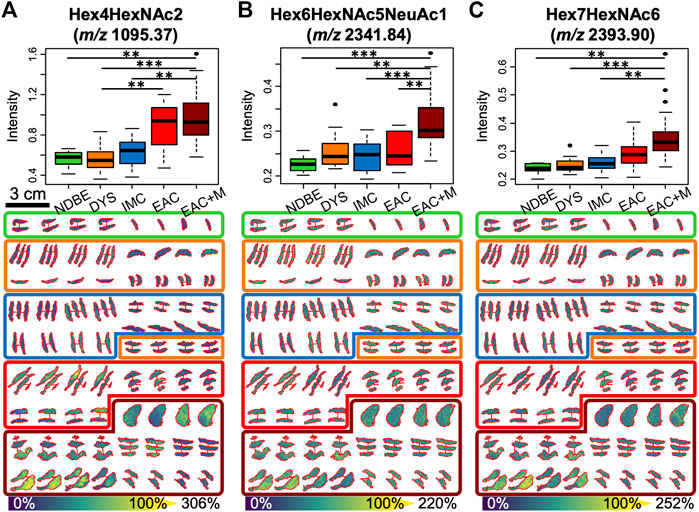
FIGURE 3. Significant alterations in three N-glycan abundances between the different stages of esophageal adenocarcinoma progression as determined by 2.5D mass spectrometry imaging: boxplots (upper row) and tissue visualizations (lower row) are shown for the mass channels m/z 1095.4 (A), 2,341.8 (B), and 2,393.9 (C), which have been assigned to high-mannose Man3 (Hex4HexNAc2), and to the tri- and tetra-antennary N-glycans Hex6HexNAc5NeuAc1 and Hex7HexNAc6, respectively. p-value significance coding: ***, p < 0.01; **, p < 0.05; *, p < 0.1. Abbreviations and color coding: NDBE (non-dysplastic Barrett’s esophagus, green), DYS (low- and high-grade dysplasia, orange), IMC (intramucosal cancer, blue), EAC (esophageal adenocarcinoma, red), and EAC + M (metastatic EAC, dark red).
Based on literature, the remaining three N-glycans were all of complex type (m/z 2028.73 = Hex6HexNAc5, m/z 2,341.84 = Hex6HexNAc5NeuAc1, m/z 2,393.9 = Hex7HexNAc6). While the signal intensity of the tetra-antennary Hex7HexNAc6 was found to steadily increase with the disease stage with its signal intensity culminating in metastatic EAC (Figure 3C), the two tri-antennary N-glycans Hex6HexNAc5 and Hex6HexNAc5NeuAc1 exhibited especially higher levels in already metastasized EAC as compared to non-metastasized EAC and precursors (Figure 3B, Supplementary Figure S2).
Finally, we investigated two publically available gene expression datasets related to esophageal cancer, GSE1420 (Kimchi et al., 2005) and GSE2444 (Gomes et al., 2005), for alterations in enzymes that play a role in the synthesis of the found N-glycans in EAC onset or progression (Figure 4B) (Hemmoranta et al., 2007; Stanley et al., 2015). These studies reported most of these enzymes increased in EAC compared to non-dysplastic Barrett’s esophagus or normal esophageal epithelium (Figure 4A, Supplementary Table S4).
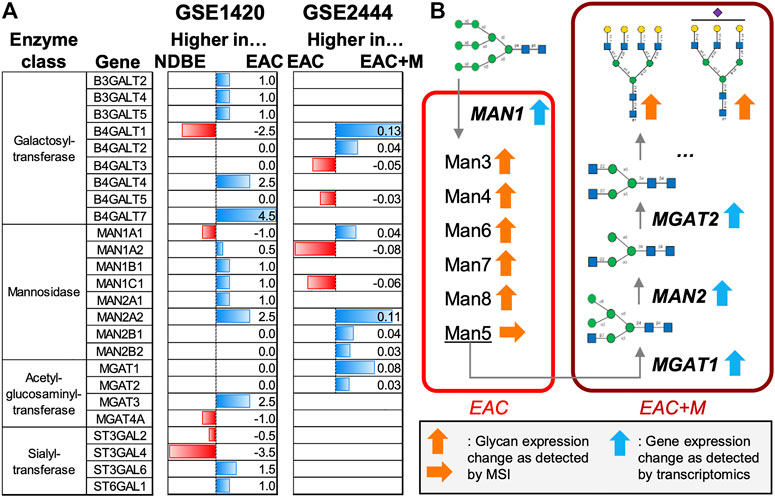
FIGURE 4. Meta-study analyses of enzymes involved in the synthesis of N-glycans. Two publically available gene expression datasets on esophageal adenocarcinoma (EAC) were considered: GSE1420 and GSE2444, which contained data on EAC vs. non-dysplastic Barrett’s esophagus (NDBE) and EAC vs. metastatic EAC (EAC + M), respectively. (A) Horizontal barplots show the up- or down-regulation of enzymes involved in the synthesis of high-mannose and non-fucosylated multi-antennary N-glycans for both datasets. (B) Schematic overview of the role of the enzymes involved in the synthesis of the N-glycan types observed in this study.
Discussion
This study is the first of its kind aiming to find N-glycans related to the stages of progression in esophageal adenocarcinoma (EAC) using MALDI mass spectrometry imaging (MSI). To achieve this we analyzed 24 tissue samples of endoscopic resections specimens covering the complete sequence of progression from non-dysplastic Barrett’s esophagus over dysplastic tissue to neoplastic lesions. Moreover, this study has also a prognostic angle since also EAC samples of patients were analyzed that developed local metastasis during follow-up time.
As EAC is a heterogeneous disease, one sample per stage was imaged in 3D first to determine the number of sections needed to be representative for the whole volume. Before that, we performed a previously established 2-step outlier detection procedure (Vos et al., 2019), which determined that in total 15 sections out of the 100 sections measured had to be removed, giving an 85% reproducibility rate (Supplementary Figure S1). This was considered an acceptable dropout rate since previous and similar enzyme-based experiments on bladder cancer gave a lower reproducibility rate of 80% (Vos et al., 2019).
The representativity analysis determined that maximum 4 sections could be considered sufficiently (Pearson correlation > 0.99) representative for the stack of 20 consecutive sections (Figure 2). It is clear that this stack is itself not fully representative for the entire tissue sample or the patient, but the reduction in experimental workload from 10 to 2 slides (termed here 2.5D) is significant while maintaining most of the information. Sampling bias will continue persisting as long as invasive sampling methods are being used.
The acquired 2.5D data was subsequently used to discover differentially expressed N-glycans between the different EAC stages. A total of 146 signals were detected in the mass range typical for N-glycans of which 44% could be tentatively assigned to previously described N-glycans (Supplementary Table S2), which is alike other studies with equivalent instrumentation (Boyaval et al., 2022).
Eight N-glycans were found significantly altered between EAC, dysplasia, intramucosal carcinoma or non-dysplastic Barrett’s esophagus (Table 2, Figure 3, Supplementary Figure S2, and Supplementary Table S3). Of these glycans, five were high-mannose and three complex N-glycans as confirmed by high-mass resolution mass spectrometry and MS/MS experiments (Supplementary Material 1)
The class of high-mannose N-glycans represents an early stage in the N-glycan synthesis pathway (Figure 4B) and elevated levels of high-mannose and pauci-mannose glycans have been detected in many tumors using MSI (Drake et al., 2017; McDowell et al., 2021). For instance, high-mannose glycans have been reported as progression and prognostic markers in early-stage colorectal cancer patients (Boyaval et al., 2022) and liposarcoma, respectively (Heijs et al., 2020). In line with that, we observed a steady escalation of signal intensities belonging to several high-mannose N-glycans with three (Man3), four (Man4), six (Man6), seven (Man7), and eight (Man8) mannose units along EAC disease advancement. Interestingly, Man5, which is an important intermediate for the production of hybrid or complex N-glycans (Hossler et al., 2017), has been the only high-mannose glycan in our study (although detected at m/z 1257.40, Supplementary Table S2) that has not been found to be significantly associated to (metastatic) EAC. This points towards a fast turn-over to complex N-glycans once the Man5 state has been reached (Figure 4B).
In general, we observe a considerable shift from an equilibrium between complex and high-mannose glycans in NDBE (ratio high-mannose/complex: 1.01, Supplementary Table S3) towards high-mannose signals in EAC (ratio high-mannose/complex: 15.77), followed by a reversal of the shift towards complex glycans in metastatic EAC (ratio high-mannose/complex: 0.88). Consequently, the complex N-glycans displayed their highest abundance in metastatic EAC, with the single-sialylated, tri-antennary N-glycan Hex6HexNAc5NeuAc1 (m/z 2,341.84) at a significant level as compared to non-metastatic EAC (p = 0.037, Supplementary Table S3). Tri-antennary complex-type N-glycans have also recently been reported to be indicative of a significantly reduced disease-specific survival in liposarcomas (Heijs et al., 2020). The tetra-antennary Hex7HexNAc6, which was also found especially increased in metastatic EAC, has been previously reported to be at higher abundances in hepatocellular carcinoma with almost no presence in normal tissue (Powers et al., 2015).
Interestingly, none of our N-glycans has been found fucosylated, whereas 62% of our mass matching database actually contained fucosylated N-glycans. Fucosylation has been associated with cancer progression and poor prognosis in several cancer types (McDowell et al., 2021) and we have observed several fucosylated N-glycans to be present and characteristic for changes that accompany esophageal carcinogenesis in non-dysplastic tissue in proximity to dysplastic or cancerous tissue (Supplementary Material S2). Scott et al. have observed necrotic regions in tumors to be characterized by the absence of fucose modifications (Scott et al., 2019b). Tumor necrosis is a common pathological feature of rapidly growing tumors and associated with hypoxia which in turn promotes metastatic behavior (Spill et al., 2016). While visually we cannot observe necrotic areas within the annotated tumor regions, the lack of fucosylated glycans might be an event that precedes the morphological changes and indicates a metabolic reaction to necrotic or hypoxic conditions (Silva-Filho et al., 2017).
These glycans have therefore potential to serve as indicators for shorter follow-up times with the gastroenterologist in order to discover metastatic disease in time.
However, a rigorous validation in larger patient cohorts and independent laboratories is necessary since our study is statistically limited by a low number of samples. To obtain an estimation of the number of samples required for such as validation, we performed a power analysis with a minimum power of 0.8 and for every mass channel separately (Supplementary Material S3). This analysis showed that at least 137 (alpha = 0.1) would be needed in total, which is seven times the current sample size. In mass spectrometry imaging, these numbers are still rarely achieved unless tissue microarrays are used, which are very limited in representing the biological variation within a sample. But the latter was one of the core aims of our study. Hence less patients were involved but more sample material for every patient.
In addition, we strived for shedding more light into the synthesis mechanisms of the glycans observed in our study. To do so, we investigated two publically available gene expression datasets on esophageal cancer for alterations in enzymes that play a role in the production of high-mannose and multi-antennary N-glycans without fucosylation but with sialylation. In the study that compared EAC vs. NDBE (Figure 4A, GSE1420), gene expression indicates higher levels of almost all the detected mannosidases (MAN) in EAC. The MAN1 enzymes are in first instance responsible for trimming down N-glycans starting from a structure with nine mannoses (Figure 4B), which could therefore explain the higher presence of high-mannose glycans in tumor areas as observed in our study.
Metastatic EAC samples were characterized by the presence of specific complex N-glycans whose synthesis is initiated by the acetylglucosaminyltransferase (MGAT) enzymes. In the second gene expression study (Figure 4A, GSE2444), which focuses on the comparison of non-metastatic vs. metastatic EAC, all detected MGAT enzymes (MGAT1 and MGAT2) exhibited increased levels in metastatic EAC. This is also in line with the up-regulation of MAN2 enzymes which act in between MGAT1 and MGAT2 (Figure 4B). The observed shift from high-mannose glycans in EAC to more complex type glycans in metastatic EAC (ratio high-mannose/complex: 0.88) could be caused by the reduction of MAN1 enzyme expression in metastatic EAC. Further on, all significant complex N-glycans of our study were terminated by galactosyltransferases with the exception of one tri-antennary N-glycan (Hex6HexNAc5NeuAc1), which was additionally sialylated. Due to variation in up- or down-regulation of functionally similar galactosyltransferases and sialyltransferases, no conclusion can be made on the preferred linkage site and therefore on the resulting structure of these glycans. Interestingly, MGAT3 and MGAT4 were found up- and down-regulated in EAC, respectively, which indicates that the tri-antennary N-glycan could be of bisecting type (Reily et al., 2019), although this is not very likely since terminal modifications are suppressed in bisecting N-glycans (Nakano et al., 2019). In that context it is to mention that our mass matching database might introduce a bias towards the underrepresentation of bisecting N-glycans in our results since only (but at least) ten entries (11.7%) corresponded to the bisecting type. Ultimately, only tandem mass spectrometry combined with NMR can fully elucidate the precise structure of glycans.
Nevertheless, this study demonstrates that N-glycan MSI data can be largely contextualized with gene expression data from studies with similar research questions. It also gives evidence that specific N-glycosylation clearly reflects the different stages of esophageal carcinogenesis and prognosis, which therefore has the potential to aid in patient surveillance (Powers et al., 2014).
Data availability statement
The datasets presented in this study can be found online on DataverseNL (https://doi.org/10.34894/TAHYTW).
Ethics statement
Ethical review and approval was not required for the study on human participants in accordance with the local legislation and institutional requirements. Written informed consent for participation was not required for this study in accordance with the national legislation and the institutional requirements (‘Code of conduct’, FEDERA).
Author contributions
DV performed the experiments and wrote the manuscript. SM conceived the research question, aided in the interpretation of the tissue samples and results, and contributed to writing the manuscript. RP provided the tissue samples and aided in interpretation of the results. SE conceived the experiments and aided in writing the manuscript. RH aided in interpretation of results and writing of the manuscript. BB supervised the project, performed the data analysis and the interpretation of the results.
Funding
This work has been made possible with the financial support of the Dutch province of Limburg through the LINK program, ITEA, and RVO by means of project numbers ITEA151003/ITEA 14001 as well as funding from the National Institutes of Health (NIH) of the United States of America, Grant No. NIH R01 CA213492. BB acknowledges the financial support from the European Union (ERA-NET TRANSCAN 2; Grant No. 643638).
Conflict of interest
The authors declare that the research was conducted in the absence of any commercial or financial relationships that could be construed as a potential conflict of interest.
Publisher’s note
All claims expressed in this article are solely those of the authors and do not necessarily represent those of their affiliated organizations, or those of the publisher, the editors and the reviewers. Any product that may be evaluated in this article, or claim that may be made by its manufacturer, is not guaranteed or endorsed by the publisher.
Supplementary material
The Supplementary Material for this article can be found online at: https://www.frontiersin.org/articles/10.3389/frans.2022.1010317/full#supplementary-material
References
Abbassi-Ghadi, N., Golf, O., Kumar, S., Antonowicz, S., McKenzie, J. S., Huang, J., et al. (2016). Imaging of esophageal lymph node metastases by desorption electrospray ionization mass spectrometry. Cancer Res. 76 (19), 5647–5656. doi:10.1158/0008-5472.CAN-16-0699
Aichler, M., Elsner, M., Ludyga, N., Feuchtinger, A., Zangen, V., Maier, S. K., et al. (2013). Clinical response to chemotherapy in oesophageal adenocarcinoma patients is linked to defects in mitochondria. J. Pathol. 230 (4), 410–419. doi:10.1002/path.4199
Balluff, B., Frese, C. K., Maier, S. K., Schone, C., Kuster, B., Schmitt, M., et al. (2015). De novo discovery of phenotypic intratumour heterogeneity using imaging mass spectrometry. J. Pathol. 235 (1), 3–13. doi:10.1002/path.4436
Barre, F. P. Y., Claes, B. S. R., Dewez, F., Peutz-Kootstra, C., Munch-Petersen, H. F., Gronbaek, K., et al. (2018). Specific lipid and metabolic profiles of R-CHOP-resistant diffuse large B-cell lymphoma elucidated by matrix-assisted laser desorption ionization mass spectrometry imaging and in vivo imaging. Anal. Chem. 90 (24), 14198–14206. doi:10.1021/acs.analchem.8b02910
Boyaval, F., Dalebout, H., Van Zeijl, R., Wang, W., Farina-Sarasqueta, A., Lageveen-Kammeijer, G. S. M., et al. (2022). High-mannose N-glycans as malignant progression markers in early-stage colorectal cancer. Cancers (Basel) 14 (6), 1552. doi:10.3390/cancers14061552
Briggs, M. T., Condina, M. R., Ho, Y. Y., Everest-Dass, A. V., Mittal, P., Kaur, G., et al. (2019). MALDI mass spectrometry imaging of early- and late-stage serous ovarian cancer tissue reveals stage-specific N-glycans. Proteomics 19 (21-22), e1800482. doi:10.1002/pmic.201800482
Caspa Gokulan, R., Garcia-Buitrago, M. T., and Zaika, A. I. (2019). From genetics to signaling pathways: molecular pathogenesis of esophageal adenocarcinoma. Biochim. Biophys. Acta. Rev. Cancer 1872 (1), 37–48. doi:10.1016/j.bbcan.2019.05.003
Cressman, E. N. K., and Spraggins, J. M. (2018). Viewing the future of IR through molecular histology: an overview of imaging mass spectrometry. J. Vasc. Interv. Radiol. 29 (11), 1543–1546. doi:10.1016/j.jvir.2018.07.004
Domper Arnal, M. J., Ferrandez Arenas, A., and Lanas Arbeloa, A. (2015). Esophageal cancer: risk factors, screening and endoscopic treatment in western and eastern countries. World J. Gastroenterol. 21 (26), 7933–7943. doi:10.3748/wjg.v21.i26.7933
Drake, R. R., Powers, T. W., Jones, E. E., Bruner, E., Mehta, A. S., and Angel, P. M. (2017). MALDI mass spectrometry imaging of N-linked glycans in cancer tissues. Adv. Cancer Res. 134, 85–116. doi:10.1016/bs.acr.2016.11.009
Elsner, M., Rauser, S., Maier, S., Schone, C., Balluff, B., Meding, S., et al. (2012). MALDI imaging mass spectrometry reveals COX7A2, TAGLN2 and S100-A10 as novel prognostic markers in Barrett's adenocarcinoma. J. Proteomics 75 (15), 4693–4704. doi:10.1016/j.jprot.2012.02.012
Enzinger, P. C., and Mayer, R. J. (2003). Esophageal cancer. N. Engl. J. Med. 349 (23), 2241–2252. doi:10.1056/NEJMra035010
Everest-Dass, A. V., Briggs, M. T., Kaur, G., Oehler, M. K., Hoffmann, P., and Packer, N. H. (2016). N-glycan MALDI imaging mass spectrometry on formalin-fixed paraffin-embedded tissue enables the delineation of ovarian cancer tissues. Mol. Cell. Proteomics 15 (9), 3003–3016. doi:10.1074/mcp.M116.059816
Gomes, L. I., Esteves, G. H., Carvalho, A. F., Cristo, E. B., Hirata, R., Martins, W. K., et al. (2005). Expression profile of malignant and nonmalignant lesions of esophagus and stomach: differential activity of functional modules related to inflammation and lipid metabolism. Cancer Res. 65 (16), 7127–7136. doi:10.1158/0008-5472.CAN-05-1035
Guo, T., Li, L., Zhong, Q., Rupp, N. J., Charmpi, K., Wong, C. E., et al. (2018). Multi-region proteome analysis quantifies spatial heterogeneity of prostate tissue biomarkers. Life Sci. Alliance 1 (2), e201800042. doi:10.26508/lsa.201800042
Heijs, B., Holst, S., Briaire-de Bruijn, I. H., van Pelt, G. W., de Ru, A. H., van Veelen, P. A., et al. (2016). Multimodal mass spectrometry imaging of N-glycans and proteins from the same tissue section. Anal. Chem. 88 (15), 7745–7753. doi:10.1021/acs.analchem.6b01739
Heijs, B., Holst-Bernal, S., de Graaff, M. A., Briaire-de Bruijn, I. H., Rodriguez-Girondo, M., van de Sande, M. A. J., et al. (2020). Molecular signatures of tumor progression in myxoid liposarcoma identified by N-glycan mass spectrometry imaging. Lab. Invest. 100 (9), 1252–1261. doi:10.1038/s41374-020-0435-2
Hemmoranta, H., Satomaa, T., Blomqvist, M., Heiskanen, A., Aitio, O., Saarinen, J., et al. (2007). N-glycan structures and associated gene expression reflect the characteristic N-glycosylation pattern of human hematopoietic stem and progenitor cells. Exp. Hematol. 35 (8), 1279–1292. doi:10.1016/j.exphem.2007.05.006
Herrera, H., Dilday, T., Uber, A., Scott, D., Zambrano, J. N., Wang, M., et al. (2019). Core-fucosylated tetra-antennary N-glycan containing A single N-acetyllactosamine branch is associated with poor survival outcome in breast cancer. Int. J. Mol. Sci. 20 (10), E2528. doi:10.3390/ijms20102528
Hossler, P., Chumsae, C., Racicot, C., Ouellette, D., Ibraghimov, A., Serna, D., et al. (2017). Arabinosylation of recombinant human immunoglobulin-based protein therapeutics. MAbs 9 (4), 715–734. doi:10.1080/19420862.2017.1294295
Kimchi, E. T., Posner, M. C., Park, J. O., Darga, T. E., Kocherginsky, M., Karrison, T., et al. (2005). Progression of Barrett's metaplasia to adenocarcinoma is associated with the suppression of the transcriptional programs of epidermal differentiation. Cancer Res. 65 (8), 3146–3154. doi:10.1158/0008-5472.CAN-04-2490
Lin, E. W., Karakasheva, T. A., Hicks, P. D., Bass, A. J., and Rustgi, A. K. (2016). The tumor microenvironment in esophageal cancer. Oncogene 35 (41), 5337–5349. doi:10.1038/onc.2016.34
Mascini, N. E., Teunissen, J., Noorlag, R., Willems, S. M., and Heeren, R. M. A. (2018). Tumor classification with MALDI-MSI data of tissue microarrays: a case study. Methods 151, 21–27. doi:10.1016/j.ymeth.2018.04.004
McDowell, C. T., Lu, X., Mehta, A. S., Angel, P. M., and Drake, R. R. (2021). Applications and continued evolution of glycan imaging mass spectrometry. Mass Spectrom. Rev., mas.21725. doi:10.1002/mas.21725
Mechref, Y., Hussein, A., Bekesova, S., Pungpapong, V., Zhang, M., Dobrolecki, L. E., et al. (2009). Quantitative serum glycomics of esophageal adenocarcinoma and other esophageal disease onsets. J. Proteome Res. 8 (6), 2656–2666. doi:10.1021/pr8008385
Nakano, M., Mishra, S. K., Tokoro, Y., Sato, K., Nakajima, K., Yamaguchi, Y., et al. (2019). Bisecting GlcNAc is a general suppressor of terminal modification of N-glycan. Mol. Cell. Proteomics 18 (10), 2044–2057. doi:10.1074/mcp.RA119.001534
Nettleship, J. E. (2012). “Structural biology of glycoproteins,” in Glycosylation. Editor S. Petrescu (Rijeka: IntechOpen).
Paine, M. R. L., Liu, J., Huang, D., Ellis, S. R., Trede, D., Kobarg, J. H., et al. (2019). Three-dimensional mass spectrometry imaging identifies lipid markers of medulloblastoma metastasis. Sci. Rep. 9 (1), 2205. doi:10.1038/s41598-018-38257-0
Powers, T. W., Holst, S., Wuhrer, M., Mehta, A. S., and Drake, R. R. (2015). Two-dimensional N-glycan distribution mapping of hepatocellular carcinoma tissues by MALDI-imaging mass spectrometry. Biomolecules 5 (4), 2554–2572. doi:10.3390/biom5042554
Powers, T. W., Neely, B. A., Shao, Y., Tang, H., Troyer, D. A., Mehta, A. S., et al. (2014). MALDI imaging mass spectrometry profiling of N-glycans in formalin-fixed paraffin embedded clinical tissue blocks and tissue microarrays. PLoS One 9 (9), e106255. doi:10.1371/journal.pone.0106255
Quaas, A., Bahar, A. S., von Loga, K., Seddiqi, A. S., Singer, J. M., Omidi, M., et al. (2013). MALDI imaging on large-scale tissue microarrays identifies molecular features associated with tumour phenotype in oesophageal cancer. Histopathology 63 (4), 455–462. doi:10.1111/his.12193
Reily, C., Stewart, T. J., Renfrow, M. B., and Novak, J. (2019). Glycosylation in health and disease. Nat. Rev. Nephrol. 15 (6), 346–366. doi:10.1038/s41581-019-0129-4
Runge, T. M., Abrams, J. A., and Shaheen, N. J. (2015). Epidemiology of barrett's esophagus and esophageal adenocarcinoma. Gastroenterol. Clin. North Am. 44 (2), 203–231. doi:10.1016/j.gtc.2015.02.001
Schone, C., Hofler, H., and Walch, A. (2013). MALDI imaging mass spectrometry in cancer research: combining proteomic profiling and histological evaluation. Clin. Biochem. 46 (6), 539–545. doi:10.1016/j.clinbiochem.2013.01.018
Scott, D. A., Casadonte, R., Cardinali, B., Spruill, L., Mehta, A. S., Carli, F., et al. (2019). Increases in tumor N-glycan polylactosamines associated with advanced HER2-positive and triple-negative breast cancer tissues. Proteomics. Clin. Appl. 13 (1), e1800014. doi:10.1002/prca.201800014
Scott, D. A., Norris-Caneda, K., Spruill, L., Bruner, E., Kono, Y., Angel, P. M., et al. (2019). Specific N-linked glycosylation patterns in areas of necrosis in tumor tissues. Int. J. Mass Spectrom. 437, 69–76. doi:10.1016/j.ijms.2018.01.002
Shaheen, N. J., and Richter, J. E. (2009). Barrett's oesophagus. Lancet 373 (9666), 850–861. doi:10.1016/S0140-6736(09)60487-6
Silva-Filho, A. F., Sena, W. L. B., Lima, L. R. A., Carvalho, L. V. N., Pereira, M. C., Santos, L. G. S., et al. (2017). Glycobiology modifications in intratumoral hypoxia: the breathless side of glycans interaction. Cell. Physiol. Biochem. 41 (5), 1801–1829. doi:10.1159/000471912
Spechler, S. J. (2002). Barrett's esophagus and esophageal adenocarcinoma: pathogenesis, diagnosis, and therapy. Med. Clin. North Am. 86 (6), 1423–1445. doi:10.1016/s0025-7125(02)00082-2
Spill, F., Reynolds, D. S., Kamm, R. D., and Zaman, M. H. (2016). Impact of the physical microenvironment on tumor progression and metastasis. Curr. Opin. Biotechnol. 40, 41–48. doi:10.1016/j.copbio.2016.02.007
Stanley, P., Taniguchi, N., and Aebi, M. (2015). “N-Glycans,” in Essentials of glycobiology. Varki A. rd, R. D. Cummings, J. D. Esko, P. Stanley, and G. W. Hart. Editors (New York: Cold Spring Harbor), 99–111.
Strohalm, M., Hassman, M., Kosata, B., and Kodicek, M. (2008). mMass data miner: an open source alternative for mass spectrometric data analysis. Rapid Commun. Mass Spectrom. 22 (6), 905–908. doi:10.1002/rcm.3444
Talukdar, F. R., di Pietro, M., Secrier, M., Moehler, M., Goepfert, K., Lima, S. S. C., et al. (2018). Molecular landscape of esophageal cancer: implications for early detection and personalized therapy. Ann. N. Y. Acad. Sci. 1434 (1), 342–359. doi:10.1111/nyas.13876
van Munster, S. N., Verheij, E. P. D., Nieuwenhuis, E. A., Offerhaus, J., Meijer, S. L., Brosens, L. A. A., et al. (2021). Extending treatment criteria for barrett's neoplasia: results of a nationwide cohort of 138 endoscopic submucosal dissection procedures. Endoscopy 54, 531–541. doi:10.1055/a-1658-7554
Vaysse, P. M., Heeren, R. M. A., Porta, T., and Balluff, B. (2017). Mass spectrometry imaging for clinical research - latest developments, applications, and current limitations. Analyst 142 (15), 2690–2712. doi:10.1039/c7an00565b
Vos, D. R. N., Jansen, I., Lucas, M., Paine, M. R. L., de Boer, O. J., Meijer, S. L., et al. (2019). Strategies for managing multi-patient 3D mass spectrometry imaging data. J. Proteomics 193, 184–191. doi:10.1016/j.jprot.2018.10.008
Walker, R. C., and Underwood, T. J. (2018). Molecular pathways in the development and treatment of oesophageal cancer. Best. Pract. Res. Clin. Gastroenterol. 36-37, 9–15. doi:10.1016/j.bpg.2018.11.013
Wang, M., Zhu, J., Lubman, D. M., and Gao, C. (2019). Aberrant glycosylation and cancer biomarker discovery: a promising and thorny journey. Clin. Chem. Lab. Med. 57 (4), 407–416. doi:10.1515/cclm-2018-0379
Keywords: esophageal cancer, glycosylation, mass spectrometry imaging (MSI), N-glycans, MALDI
Citation: Vos DRN, Meijer SL, Pouw RE, Ellis SR, Heeren RMA and Balluff B (2022) 2.5D mass spectrometry imaging of N-glycans in esophageal adenocarcinoma and precursor lesions. Front. Anal. Sci. 2:1010317. doi: 10.3389/frans.2022.1010317
Received: 02 August 2022; Accepted: 14 October 2022;
Published: 29 November 2022.
Edited by:
Arun Everest-Dass, Griffith University, AustraliaReviewed by:
Anand Mehta, Medical University of South Carolina, United StatesManveen K Sethi, Boston University, United States
Copyright © 2022 Vos, Meijer, Pouw, Ellis, Heeren and Balluff. This is an open-access article distributed under the terms of the Creative Commons Attribution License (CC BY). The use, distribution or reproduction in other forums is permitted, provided the original author(s) and the copyright owner(s) are credited and that the original publication in this journal is cited, in accordance with accepted academic practice. No use, distribution or reproduction is permitted which does not comply with these terms.
*Correspondence: B. Balluff, Yi5iYWxsdWZmQG1hYXN0cmljaHR1bml2ZXJzaXR5Lm5s
†ORCID: D. R. N. Vos, https://orcid.org/0000-0002-1290-239X; S. L. Meijer, https://orcid.org/0000-0002-6953-2406; R. E. Pouw, https://orcid.org/0000-0002-4707-1186; S. R. Ellis, https://orcid.org/0000-0002-3326-5991; R. M. A. Heeren, https://orcid.org/0000-0002-6533-7179; B. Balluff, https://orcid.org/0000-0003-0351-240X