Single-cell metabolome profiling for phenotyping parasitic diseases in phytoplankton
 Marine Vallet1,2*
  Filip Kaftan3 Anthony Buaya4,5
  Marco Thines4,5
  Laure Guillou6
  Aleš Svatoš3
  Georg Pohnert1,2
- 1Max Planck Fellow Group Plankton Community Interaction, Max Planck Institute for Chemical Ecology, Jena, Germany
- 2Bioorganic Analytics Institute for Inorganic and Analytical Chemistry Friedrich Schiller University Jena Germany, Jena, Germany
- 3Research Group Plankton Community Interaction Max Planck Institute for Chemical Ecology, Jena, Germany
- 4Senckenberg Biodiversity and Climate Research Centre, Frankfurt (Main), Germany
- 5Department of Biological Sciences, Institute for Ecology, Evolution and Diversity, Goethe University, Frankfurt (Main), Germany
- 6Sorbonne Université CNRS UMR7144 Adaptation et Diversité en Milieu Marin Ecology of Marine Plankton (ECOMAP) Station Biologique de Roscoff SBR, Roscoff, France
Bloom-forming phytoplankton are key players in aquatic ecosystems, fixing carbon dioxide and forming the base of the marine food web. Diverse stresses, such as nutrient depletion, temperature increase, and pathogen emergence can influence the health and dynamics of algal populations. While population responses to these stressors are well-documented in the aquatic ecosystems, little is known about the individual cellular adaptations. These are however the key to an in-depth physiological understanding of microbiome dynamics in the plankton. Finding solutions to disease control in aquaculture also depends on knowledge of infection dynamics and physiology in algae. Single-cell metabolomics can give insight into infection processes by providing a snapshot of small molecules within a biological system. We used a single-cell metabolome profiling workflow to track metabolic changes of diatoms and dinoflagellates subjected to parasite infection caused by the oomycete Lagenisma coscinodisci and the alveolate Parvilucifera spp. We accurately classified the healthy phenotype of bloom-forming phytoplankton, including the diatoms Coscinodiscus granii and Coscinodiscus radiatus, and the toxic dinoflagellate Alexandrium minutum. We discriminated the infection of the toxic dinoflagellate A. minutum with the alveolate parasitoids Parvilucifera infectans and P. rostrata down to the single-cell resolution. Strain and species-specific responses of the diatom hosts Coscinodiscus spp. Infected with the oomycete pathogen Lagenisma coscinodisci could be recognized. LC-HRMS and fragmentation pattern analysis enabled the structure elucidation of metabolic predictors of infection (guanine, xanthine, DMSP, and pheophorbide). The purine salvage pathway and DMSP lysis could be assigned as regulated processes during host invasion. The findings establish single-cell metabolome profiling with LDI-HRMS coupled with classification analysis as a reliable diagnostic tool to track metabolic changes in algae.
Highlights
• Intracellular parasitic diseases control the health and dynamics of bloom-forming algae but are strenuous to detect in natural populations and aquacultures.
• We use a single-cell LDI-HRMS profiling workflow coupled with classification analysis to track metabolic changes of diatoms and dinoflagellates subjected to parasitic intracellular infection caused by oomycete Lagenisma coscinodisci and alveolate Parvilucifera spp.
Introduction
Plankton blooms are mass occurrences of unicellular algae from a single species. They are composed of cells with heterogeneous physiology. Stresses, caused by temperature elevation, nutrient depletion, or pathogen infection can influence the metabolic activities of phytoplankton and the persistence of blooms (Rosenwasser S. et al., 2014; Levitan et al., 2015; Marañón et al., 2018). Opportunistic pathogens such as parasites that infect cells intracellularly are frequent in all classes of bloom-forming phytoplankton. They often contribute to bloom termination and shape species succession in the microbial community of the plankton (Deng et al., 2022).
Most of our knowledge of parasite infections in phytoplankton is derived from microscopic observations (Jephcott T. G. et al., 2016; Chambouvet et al., 2019). These studies show that uninfected cells and cells at different infection stages coexist in natural populations. Accordingly, cells within one bloom exhibit a high phenotypic diversity, despite belonging to a single species. This diversity within a phylogenetically homogeneous population can reflect local infection dynamics, genotypic variability of host resistance traits, or the different fitness of the individual host cells caused by aging or access to nutrients. However, it is unclear which factors control the observed variability and the diversity of responses. We hypothesize that this lack of knowledge might be overcome by using single-cell LDI-HRMS profiling to resolve phenotypic plasticity with a cellular resolution. This approach can provide in-depth insights into the physiological responses to (a)biotic stresses, thereby revealing metabolic changes in algal populations (Baumeister et al., 2019). Knowledge about the metabolic processes also allows for the identification of pathogenicity mechanisms (Vallet et al., 2019). Common metabolomics approaches are suitable for tracking the metabolic changes in cultures and complex heterogeneous plankton communities, but they average thousands of cells and neglect cellular individuality. Single-cell mass spectrometry can reliably profile metabolites of living cells kept in their native environment (Fujii et al., 2015; Yang et al., 2017). Measurement of individual cells by laser desorption ionization mass spectrometric (LDI-MS) analysis (Jaschinski et al., 2014) allows for the rapid profiling of hundreds of metabolites associated with a phenotype (Duncan et al., 2019). Single-cell LDI-HRMS profiling expands this strategy by classifying the metabolic patterns of the investigated cells. Thereby metabolomics offers the chance to explain phenotypic variability (Chappell et al., 2018), and disease dynamics and facilitates the identification of the involved key metabolites. This methodology served to generate metabolic fingerprints of nitrogen-deprived microalgae (Krismer J. et al., 2016), identify diverse microalgal species within complex communities (Baumeister et al., 2020), and monitor alkaloid production during the oomycete infection of marine diatoms (Vallet et al., 2019).
Here, we demonstrate the utility of single-cell LDI-HRMS profiling coupled with a classification analysis for diagnosing individual algal cells picked from cultures subjected to parasite infection. We selected two marine parasite models available in culture. The oomycete Lagenisma coscinodisci is a specialist obligate parasitoid of the diatom genus Coscinodiscus, causing host disease and cell death (Thines et al., 2015). The parasite uses flagellate zoospores that attach to and penetrate host cells to form a branched thallus with stout hyphae in the hosts. These hyphae develop into sporangia, in which new zoospores are formed in the late stage of infection (Drebes 1968).
The alveolate pathogens Parvilucifera rostrata and P. infectans are intracellular generalists that affect many dinoflagellates (Alacid et al., 2017). The algal hosts include the harmful bloom-forming dinoflagellates Alexandrium, Dinophysis, Gambierdiscus, Ostreopsis, and the non-toxic Scrippsiella (Garcés et al., 2013a; Lepelletier et al., 2014). All those parasites are essential components of aquatic ecosystems, coexist and coevolve with their host while contributing to the food web structuration (Wetsteyn and Peperzak 1991; Gil et al., 2004; Blanquart et al., 2016).
We developed and applied a single-cell analysis pipeline starting with live infected and non-infected host cells that are kept at ambient pressure, temperature and salinity until disruption by a laser pulse. Data are generated within milliseconds and can be evaluated by multivariate statistical methods to characterize the respective LDI-HRMS spectra. We can resolve cellular individuality in phytoplankton populations, thereby paving the way to understanding species survival in infected communities. We also unravel cellular metabolic re-wiring associated with parasitism by combining single-cell metabolomics with classification analysis based on a Support-Vector Machine algorithm. The diagnostic identification of stressed cells provides a new method to characterize parasite infection in diatoms and dinoflagellates populations.
Results
Single-cell profiling of parasite disease in diatoms and dinoflagellates
We developed and applied an analysis pipeline, from the single-cell isolation of infected and non-infected algal cells to the evaluation of their respective single-cell profiles obtained by LDI-HRMS (Figure 1). This enables the identification of metabolic predictors of the disease caused by Lagenisma coscinodisci and Parvilucifera spp. In our study, the infection of diatoms C. granii and C. radiatus was achieved by inoculating healthy cultures with Coscinodiscus cells that contain sporangia of different L. coscinodisci strains. We then let the disease spread within the diatom population within 2 weeks. The strains of the parasitoid Lagenisma coscinodisci were isolated during algal blooms of 2016, 2017, and 2019 at Helgoland, Germany (Supplementary Table S1), and cultures were established as described by (Buaya et al., 2019). We developed a workflow starting with sampling, single-cell sorting, and subsequent matrix-free LDI-HRMS analysis (Figure 1). This delivered LDI-HRMS profiles from infected or healthy algal cells that could be further statistically evaluated.
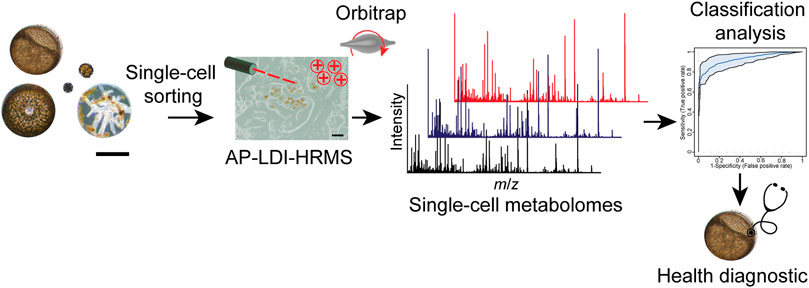
FIGURE 1. Single-cell metabolomics workflow provides cellular profiles with LDI-HRMS of phytoplankton under biotic stresses. The workflow combines cell sorting and microscopic observations, matrix-free LDI-HRMS profiling, and classification analysis to assign healthy diagnostic in algal individuals. Scale bar equals 50 µm.
Single-cell profiles were recorded with LDI-HRMS for the healthy and infected hosts C. radiatus and C. granii (Supplementary Figure S1). Therefore, we randomly selected cells in the early stage (few to no visual symptoms) and the sporangium phase (with clearly visible sporangia) and compared them to uninfected controls. Single-cell profiles were processed to subtract features from media and other contaminants obtained by measurement of blanks and normalized. The data processing yielded refined single-cell profiles with a coverage of 6 155 features (Supplementary Figure S1). Chlorophyll a at m/z 892.5353 ([M]+ • for C55H72MgN4O5) and its fragments at m/z 614.2378 and m/z 467.1717 were used as a physiological marker to indicate healthy algal cells in single-cell mass spectrometry (Baumeister et al., 2019). Classification analysis using single-cell profiles obtained healthy (n = 19) and infected (n = 125) cells allowed us to assign the healthy phenotype unambiguously to the respective spectra in C. granii (Figure 2A; Supplementary Table S2 CG/Lagenisma 5 strains). Using the same method, we assigned the health phenotype of C. radiatus using single-cell metabolites obtained from healthy (n = 31) and infected cells (n = 74) (Figure 2B; Supplementary Table S2 CR/Lagenisma 8 strains). The support-vector machine algorithm was selected over the random forest as the classification yielded the lowest error scores. Initially, we performed a pair-wise comparison of healthy diatoms and those infected with the respective parasite strains: five strains propagating in C. radiatus and eight in C. granii (Supplementary Figures S2A–E, S3A–H). We evaluated the overall classification using the support vector machine method by analyzing combined data sets for all eight C. granii and all five C. radiatus infections (Figures 2A, B). The diagnostic performance was evaluated by plotting the receiver operating characteristic (ROC) curves using the features model with the highest predictive accuracy. The ROC curves illustrate the relationship between sensitivity (true positive rate) and specificity (false positive rate) of the selected feature model used for each dataset (Campbell 1993; Baumeister et al., 2020). The area under the ROC curve (i.e. AUC) describes the performance of the selected features model, whereby the value can vary from 0.5 (no apparent accuracy) to 1.0 (perfect accuracy) (Hanley and McNeil 1982). An AUC of 0.7 is formally considered the minimum performance for a biomarker test in clinical metabolomics (Xia et al., 2013). For the infection with strain LagC19, LagCG, LagCRC2, LagCRMix, and LagC7, all cells of controls and infected cultures were classified correctly (Supplementary Figures S2B, S3A, G, H). The classification performance remained high for the overall combined data sets for all eight C. granii infections and all five C. radiatus with AUCs of 0.98 and 0.99 (Figures 2A, B).
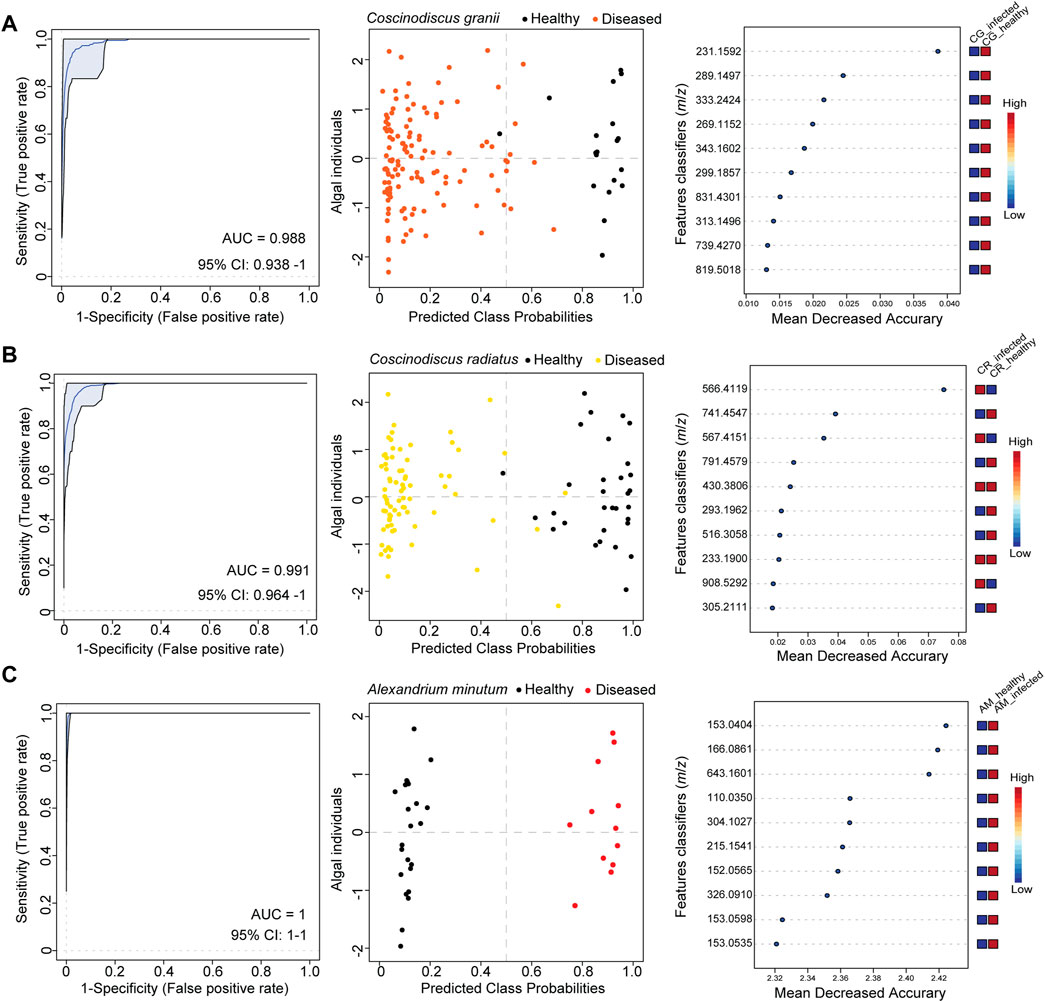
FIGURE 2. Single-cell metabolomics revealed individual responses in bloom-forming phytoplankton during parasite infection. The classification analysis was conducted for the alga-parasite models (A) Coscinodiscus granii—Lagenisma coscinodisci, (B) Coscinodiscus radiatus—Lagenisma coscinodisci and (C) Alexandrium minutum—Parvilucifera spp. Receiver operating characteristic (ROC) curves (left side plots) demonstrate the ability to classify the healthy phenotype of phytoplankton with high performance as testified by the area under the ROC curve (AUC) values. The confidence interval (95% CI) estimates a low variance of the AUC. Using the best classifier based on AUC, the predicted class probabilities were plotted for algal individuals for each alga–parasite model (center plots, every dot represents an individual cell). The healthy phenotype was assigned correctly as predicted for algal individuals. Most significant features classifiers (m/z) found as top classifiers by the model are shown and ranked by their mean decreased accurary (Right side plots). The classification analysis for Coscinodiscus granii and Coscinodiscus radiatius dataset using the SVM algorithm (model with 100 features) and for Alexandrium minutum dataset using the Random forest algorithm (model with 100 Features).
We demonstrate that single-cell LDI-HRMS profiling can also be applied to other plankton models to classify and characterize cell infections caused by parasites in dinoflagellates. We used the dinoflagellate host A. minutum and two generalist parasitoid species, P. rostrata and P. infectans, to generate a dataset of 35 cell profiles using matrix-free LDI-HRMS. The infection of susceptible dinoflagellates was achieved in culture and led to the formation of a Parvilucifera sporangium (Supplementary Figure S4B, red arrows) that releases hundreds of flagellated spores capable of infecting healthy cells. Parvilucifera were maintained by controlled dinoflagellate infections. Therefore, the infected cultures containing sporangia and free-living spores were inoculated to healthy cultures for a week. Then cells from infected and healthy cultures were characterized by light microscopy and transferred to a wetted GF/C filter for mass spectrometry profiling with matrix-free LDI-HRMS. The dataset of cell profiles recovered by LDI-HRMS consisted of profiles from cells of healthy A. minutum (n = 23) or A. minutum infected either with P. rostrata or P. infectans (n = 12), yielding a data matrix of 12 189 features (m/z) (Supplementary Table S2). The data processing included blank subtraction, setting a signal-to-noise ratio of 1 and using the Interquartile range filter in MetaboAnalyst 5.0 (Chong et al., 2019) reduced the data matrix to 2 500 features (m/z). A Student’s test was conducted and 182 significant features (m/z) were found. High classification analysis was achieved as shown by a low error of 2.8% (AM/Parvilucifera, Supplementary Table S2). The performance of the assignment of the correct phenotype was high with an AUC value of 1 and significant features supporting the classification into the groups of infected or healthy cells were plotted (Figure 2C).
Identification of the metabolic markers in parasite-algae interactions
We then aimed at identifying the several features that significantly discriminated the healthy phenotype of algal cells. The classification analysis based on single selected classifiers revealed the features at m/z 592.2678, m/z 152.0565, and m/z 135.0473 as robust metabolic predictors of infected algal cells and were found in the features list from Student’s test analysis (Figure 3; Supplementary Tables S3–S7). The feature at m/z 592.2678 appeared in significantly differential intensity between healthy and infected cells (Student’s test p < 0.001, Supplementary Table S3) in the dataset C. radiatus - L. coscinodisci strain LagC19 that yielded the highest classification outcome (Figure 3A). While MS/MS identification in single-cell MS is limited to features with high intensity, additional LC-MS/MS analyses on bulk samples can facilitate the identification of features of interest. Therefore, infected cultures were extracted, and the extracts were separated and analyzed in an ultra-high performance liquid chromatography-electrospray ionization mass spectrometry (LC-HRMS/MS) analysis. The elemental composition of the ion at m/z 592.2678 was assigned C35H36N4O5 (calculated m/z 592.2680 ± 0.3 ppm for [M]+). The ion at m/z 593.2708 for [M + H]+ was also found as a significant feature in the classification analysis (Supplementary Table S4). Fragmentation of the precursor ion at m/z 593.2744 yielded three fragments at m/z 533.2338, m/z 505.2231, and m/z 460.2248 (Figure 3C), and spectral matching analysis found a 90.2% similarity with the tetrapyrrole-derivative pheophorbide a (COCONUT ID: CNP0334168). These fragments were also from the MS/MS analysis of the standard (Nguyen et al., 2016).
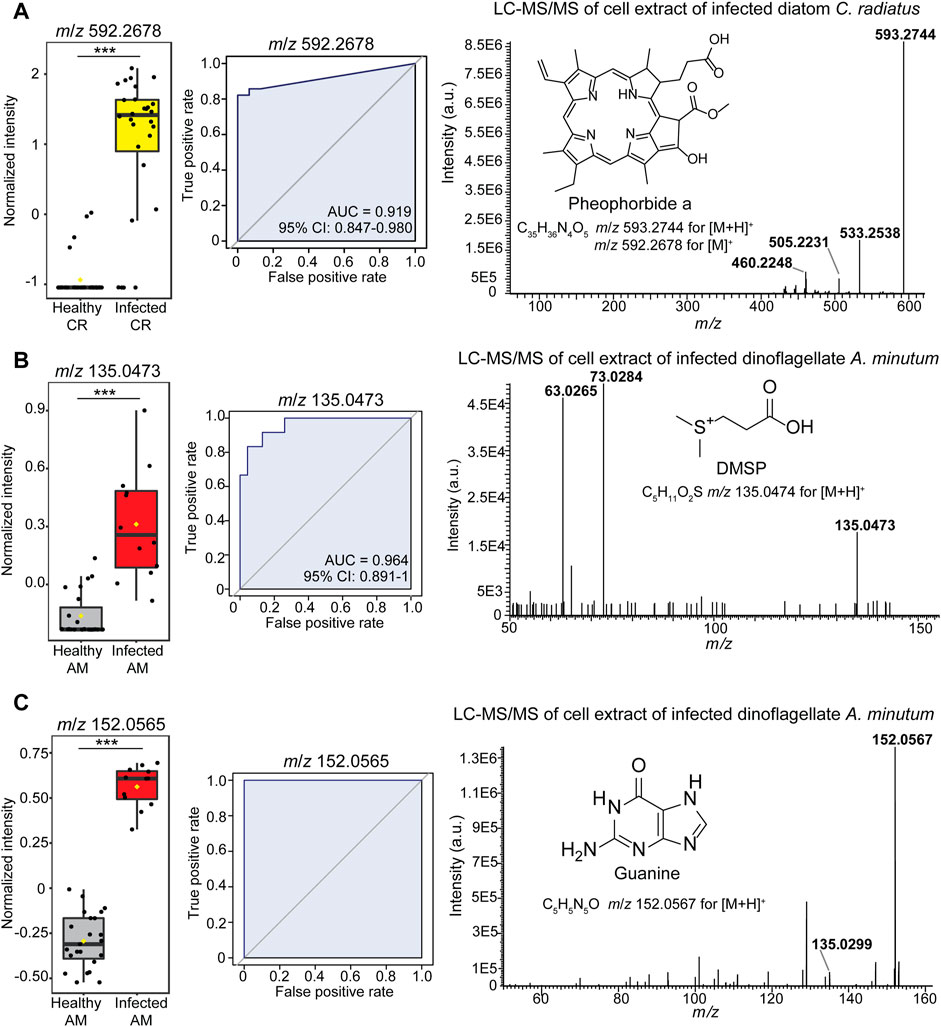
FIGURE 3. Identification of the metabolic markers in diatom Coscinodiscus-Lagenisma parasite (A) and dinoflagellate Alexandrium-Parvilucifera parasite (B,C) interactions. The investigation led to the identification of (A) pheophorbide a (feature at m/z 593.2678) (B) DMSP (feature at m/z 135.0473) and (C) guanine (feature at m/z 152.0567) as classifiers of the infected algal cells. Statistical significance was further confirmed in the Student’s test (p < 0.001) (Supplementary Table S3). For each feature, the abundance in single-cell LDI-HRMS profiles (left-side) and receiver operating characteristic curves (plots in the center) demonstrate that each feature can correctly classify the cell phenotype (Area under the curve AUCs >0.90). The confidence interval (95% CI) shows the true mean of the AUC values. The significant features were identified using HRMS/MS fragmentation spectrum (right side plot) and spectral similarity matching analysis. Referent MS/MS spectrum of guanine can be found at the open-source repository MassBank of North America (MoNA) (CCMSLIB00000479701).
To pursue the metabolite annotation in infected dinoflagellates A. minutum, bulk samples of Parvilucifera-infected cells were analyzed by LC-HRMS/MS. This investigation allowed the fragmentation analysis of identified markers of infection, such as the signal at m/z 135.0473 for [M + H]+ annotated as C5H10O2S (calculated m/z 135.0474 ± 0.7 ppm) was found as a significant metabolic predictor for infected dinoflagellate cells (Student’s test p < 0.001, Supplementary Table S4). The precursor ion at m/z 135.0473 yielded two diagnostic fragments, m/z 73.0284 and m/z 63.0265, in the LC-HRMS/MS spectrum (Figure 3B) that enable us to identify this feature as dimethylsulfoniopropionate (DMSP) based on the spectral similarity search with a previous report (Spielmeyer and Pohnert 2010). Furthermore, the significant feature at m/z 152.0565 for [M + H]+ was annotated with a molecular formula of C5H5N5O (calculated m/z 152.0566 ± 3.8 ppm) and characterized the infected Alexandrium minutum cells (Figure 3C, left side plot). The feature was identified as guanine according to the MS/MS fragmentation pattern and one fragment was found at m/z 135.0299 (Figure 3C, right side plot) which coincided with the spectra found in the MONA database search (CCMSLIB00000479701). Another significant feature at m/z 153.0404 for [M + H]+ was annotated as C5H4N4O2 (calculated m/z 153.0407 ± 1.9 ppm) and tentatively assigned to xanthine. Furthermore, dimethylsulfoniopropionate, xanthine, and guanine were also detected at m/z 135.0474, m/z 153.0407 and m/z 152.0566 as [M + H]+ respectively in the AP-LDI-HRMS analysis of standards (Supplementary data available at https://dx.doi.org/10.17617/3.50).
Discussion
We applied the single-cell LDI-HRMS profiling methodology to host-parasite plankton models. We used the dinoflagellate host A. minutum and two generalist parasitoid species, P. rostrata and P. infectans, and the diatom host Coscinodiscus spp. And eight strains of the oomycete L. coscinodisci to generate single-cell profiles using LDI-HRMS. Cells were investigated at atmospheric pressure using LDI-HRMS without the need for laborious preparations. The use of matrix-free ionization enabled the detection of signals in the range of m/z 100 to 400 which is often dominated by matrix signals in conventional MALDI-MS analysis. Metabolites in the higher molecular weight range (m/z 700–1,000) were also detected. We selected a classification analysis based on the support vector machine algorithm which yielded the highest performance to identify metabolic predictors for infection from these data sets. We achieved the identification of metabolites found as significant features that characterized healthy or infected algal cells. In the diatom-parasite model, the tetrapyrrole-derivative pheophorbide was identified using MS/MS fragmentation pattern analysis and spectral database libraries. Pheophorbide a is one of the products derived from chlorophyll degradation in higher plants (Hörtensteiner and Kräutler 2011) and can function as a signal molecule that inhibits a specific enzyme and induces cell death (Hirashima et al., 2009). Pheophorbide-like compounds can be found in diatoms, as they can be produced after chlorophyll ingestion by grazing copepods (BuffanDubau et al., 1996). We can infer that this metabolite might be involved in the degradation processes generated by Lagenisma coscinodisci infection. Overall, only four metabolites could be identified with high confidence to the level 1, which is assigned to structures confirmed with MS/MS measurement of reference standards (Schymanski E. L. et al., 2014), and we used MS/MS analysis of commercial standards both with LC-HRMS/MS and MALDI-HRMS (Supplementary Table S4). Other infection predictors identified solely with their m/z values were displayed (Figure 2) and remain to be further explored. The low matching and identified features might be explained either because the different ionization type between LCMS and LDI-MS yields different ions or because the extraction with methanol enabled the recovery of different metabolites. The poor matching with MS and MS/MS databases could also be due to either the metabolites could be new unreported structures or the MS data for those compounds are not yet available in the screened databases.
When investigating the dinoflagellate-parasite model, significant features discriminating infected cells were identified as guanine, xanthine, and DMSP. Guanine and xanthine are two components of the purine salvage pathway involved in parasitic diseases in human cells (Campagnaro and de Koning 2020). We infer that the parasite disease caused by Parvilucifera involves the purine salvage pathway during host invasion and cellular breakdown. DMSP is an intracellular zwitterionic metabolite with many reported functions in plankton microbiome interactions (Deng et al., 2022). DMSP can be enzymatically hydrolyzed into acrylate and dimethylsulfide (DMS) in the dinoflagellate Alexandrium minutum (Caruana et al., 2012). Strikingly, DMS was previously identified as a density-dependent cue of algal hosts and controlled the switch of the parasitoid Parvilucifera sinerae between the sporangium stage and the free-living virulent form (Garcés et al., 2013b). The fact that DMSP was identified as a metabolic predictor of Alexandrium minutum infected by P. rostrata and P. infectans in our study indicates a conserved mechanism in the parasitoid genus Parvilucifera involving DMS as a chemical trigger. Hence, we suggest that DMSP might be a crucial regulator of Parvilucifera infection and might contribute to the bloom termination of the harmful alga A. minutum.
Single-cell profiling with LDI-HRMS can discriminate healthy from infected cells in plankton communities. We provide an analytical workflow starting from single-cell isolation to the generation and evaluation of single-cell profiles obtained from LDI-HRMS. The data allow for correctly diagnosing parasite infection in two major phytoplankton groups, diatoms and dinoflagellates. We highlight strain-specific differences for diseases caused by the parasitoids L. coscinodisci, P. infectans and P. rostrata in their respective algal hosts, the diatom Coscinodiscus spp. And the toxic dinoflagellate A. minutum. The metabolite classifiers identified using HRMS/MS analysis in bulk populations granted us some insights into the infection mechanism. This framework opens a venue to trace parasite epidemics in natural phytoplankton populations and study the effects of biotic stresses on the metabolism of algal individuals at fine time scales.
Experimental procedures
Materials
The organisms were obtained from the Roscoff Culture Collection (Supplementary Table S1) for dinoflagellate—parasite, and the Thines-lab for diatom—oomycete parasite systems (Supplementary Table S1). The oomycete strains were isolated from C. radiatus (Bloom 2016: LagCRC2, LagCR; bloom 2019: LagC19) and C. granii (Bloom 2016: LagCG, LagC2, LagCGMix, LagCRMix; bloom 2017: LagC7, LagCG8) (Buaya et al., 2019). All strains were maintained in both hosts (Supplementary Table S2). The diatom hosts and L. coscinodisci oomycete strains are available upon request from Marco Thines (m.thines@thines-lab.eu). The cultures were maintained under fluorescent lamps at 100 µE m−2 s−1 of irradiance with a 14 h: 10 h day/night cycle. Incubation temperatures were 16°C–12°C for the day/night light period for diatom—oomycete models and 19°C–16°C for the dinoflagellate - parasite system. The diatom-oomycete medium was prepared with 1% of Guillard’s f/2 medium (G9903 with silicate, Sigma-Aldrich, Munich, Germany) added to 0.22 µm filtered and autoclaved natural seawater (Helgoland, AWI, Bremenhaven, Germany). The dinoflagellate—parasite medium was prepared by adding 1% of Guillard’s f/2 medium (G0154 no silicate, Sigma-Aldrich, Munich, Germany) complemented to 3% with sterile-filtrate soil extract (Santec Coastal State Forest, France) to 0.22 µm filtered water from the Penzé estuary, sampled at a salinity of 27 PSU (Roscoff Marine Biological Station, Roscoff, France). The infection was propagated by inoculating healthy algal cells with infected algae in which the parasite has developed to the sporangium stage once a week (ratio 30: 100 parasite: host). L. coscinodisci was maintained in C. granii and C. radiatus hosts, and Parvilucifera spp. (P. infectans, P. rostrata) in A. minutum (Supplementary Table S1). The parasite cell suspension was obtained by adding 100 µL of infected cells to 30 mL cultures of the respective host during its exponential growth phase.
Infection and stress experiments
Diatoms. The host diatom cells were harvested by filtering cultures in the late exponential phase (400 mL in biological triplicates) over 40 µm pore-size nylon mesh (Corning Life Sciences). Filtered diatoms were re-suspended in 35 mL f/2 medium. Infection experiments of Coscinodiscus spp. Were performed by inoculating 40 µL of an infected culture at the sporangium stage into 35 mL cultures of the diatom hosts Coscinodiscus radiatus or C. granii (adjusted final cell concentration 1000 cell mL−1). The incubation lasted 3 days. The infection experiments with the respective pathogen strains and diatom species are summarized in Supplementary Table S2. Full nutrient-depleted diatom cells were recovered from healthy cultures after 15 days of incubation under the conditions of the oomycete/diatom models.
Dinoflagellates. For infection, 2 mL of 3 weeks old A. minutum cultures in the late exponential growth phase (cell concentration of 5 × 10⁴ cell mL−1) were inoculated into 24-well plates (Sarstedt, Nuembrecht, Germany) and treated with 100 µL of a parasite cell suspension (104 cell mL−1) for 2 weeks.
All infection experiments were conducted in biological replicates. The degree of replication and the number of single-cell mass spectrometry profiles recorded are given in Supplementary Table S2.
Microscopy
Light microscopy pictures were taken with a × 40 and × 20 magnification with a 0.4 Ph2-Korr Achroplan objective with an Axiovert200 microscope (Carl Zeiss AG, Oberkochen, Germany). Single algal cells from untreated or parasite-treated cultures were sorted by pipetting under a Stereomicroscope (STB150, VisiScope, VWR), and apparent disease symptoms (development of fungal hyphae, presence of sporangium) were recorded before LDI-HRMS analysis.
Single-cell analysis with matrix-free atmospheric pressure Laser Desorption Ionization High-Resolution Mass Spectrometry (AP-LDI-HRMS)
Host cells were inspected with a stereomicroscope (VWR International GmbH, Dresden, Germany) and a digital microscope (Keyence, Neu-Isenburg, Germany) and 100 µL of cell suspension were sampled using a pipette following the previously described procedure (Baumeister et al., 2019). 100 µL of selected cell suspension was transferred to a sterile GF/C filter, beforehand cut in rectangles of 15 × 12 mm and wetted with 50 µL sterile medium. The samples were mounted and analyzed without any further preparation with an atmospheric pressure-scanning microprobe laser desorption ionization ion source (AP-SMALDI10, TransMIT, Gießen, Germany) equipped with a UV (337 nm) nitrogen laser (LTB MNL-106LD, LTB, Germany). Single cells were visually targeted with the laser on a GF/C filter by using an AP-SMALDI camera and the laser irradiation completely disrupted the cell within a minute yielding desorbed/ionized molecules. The AP-SMALDI10 ion source was coupled to a Q-Exactive™ Plus mass spectrometer (Thermo Fisher Scientific, Bremen, Germany), providing high-resolution mass spectra. MS data were collected using the Xcalibur software v.2.8 build 2806 (Thermo Fisher Scientific, Bremen, Germany). Samples were analyzed in positive ionization mode with a laser spot size of 10 μm. The number of laser shots per spot was set to 30 (approximately 1.2 μJ × shot−1) and a laser frequency of 60 Hz. The mass range was m/z 100 to m/z 1000 with a resolving power from 140 000 up to 280 000. A resolving power of 280 000 was used for analyzing diatom-Lagenisma samples and 140 000 for dinoflagellate-Parvilucifera samples. Single cells were targeted for 1 minute with the laser, resulting in cell profiles from LDI-HRMS.
Analysis of standards with AP-MALDI-HRMS
Analytical standards (dimethylsulfoniopropionate, xanthine, guanine) were obtained from Sigma-Aldrich. Methanolic solutions of each standard (20 mg mL−1) were mixed in a 1:1 (v:v) ratio with aqueous 2,5-dihydroxybenzoic acid (DHB) matrix solution and 1 µL was applied to microscope glass slides (Omni Slide Hydrophobic Array 26 × 76 mm, 66 well; Prosolia Inc.). The standards dimethylsulfoniopropionate, xanthine, and guanine were detected at m/z 135.0474, m/z 153.0407, and m/z 152.0566 as [M + H]+ (Supplementary data available at https://dx.doi.org/10.17617/3.50).
Data processing and statistical analysis
Raw data were converted into a netCDF format using the converter tool in the Xcalibur software (version 2.8, Thermo Fisher Scientific, Bremen, Germany). Features found also in the measurements of the medium blanks were removed, signals were normalized based on total ion current, and the signal-to-noise ratio (SNR) was set to 1 to include all signals detected using the MALDIquant package (Gibb and Strimmer 2012). The resulting dataset matrices containing the total number of features m/z (Supplementary Table S2) were analyzed using MetaboAnalyst 5.0 (Chong et al., 2019) to mine the significant features of the studied phenotype. All datasets were reduced to 2 500 features using the interquartile range (IQR) filter, and intensities were square-root transformed and Pareto-scaled to normalize the dataset and achieve a normal distribution. A Student’s test was conducted to identify significant features (p < 0.05) between control (healthy algal cells) and treatment (infected algal cells) (Supplementary Tables S2, S4, S5, S6). Single-cell profiles were investigated with a classification analysis based on either random forest or support-vector machine algorithms. The random forest algorithm used 1,000 classification-built trees to classify the individual cells using the features (m/z), providing an out-of-bag (OOB) percentage of error (Supplementary Table S2). The features model with the highest predictive accuracy was selected using the Biomarker Module in MetaboAnalyst 5.0. We conducted the Multivariate ROC curve-based exploratory analysis (Explorer option), testing support vector machine and random forest as the supervised learning methods for the classification analysis. These algorithms identified important features through repeated random sub-sampling cross-validation, with two-thirds of the samples used to evaluate the importance of each feature based on the mean decreased accuracy values. We choose the features with the higher value of mean decrease accuracy, which testified of higher significance to classifying the healthy phenotype. To build the classification, we selected the model yielding the highest accuracy with the number of significant features characterizing the highest predictive accuracy. The receiver operating curves (ROC) were built to plot the true positive rate in function of the false positive rate, with the area under the curve (AUC) being the measure of how well the selected model can distinguish between the two diagnostic groups (infected vs infected). The confidence interval was computed for each dataset. The diatom-oomycete dataset comprised 50 samples from healthy cultures (C. granii n = 19, C. radiatus n = 31) and 199 samples from cultures infected with the different Lagenisma parasite strains (Supplementary Table S2). The dinoflagellate-Parvilucifera dataset comprised 23 samples from healthy cells (A. minutum n = 23) and 12 samples from infected cultures at the sporangium stage with apparent symptoms (P. rostrata n = 5, P. infectans n = 7). Figures were prepared in Adobe® Illustrator CS6.
Metabolite identification
The identification of the significant features found by the classification analysis was conducted based on their MS/MS fragmentation pattern using LC-HRMS/MS profiling of methanolic extract of infected cells. We searched among the significant features those who could be identified in infected cell extracts analyzed by LC-HRMS/MS using spectral similarity and could identify only four features using commercial standards (Supplementary Table S4). To obtain the methanolic extracts of cell cultures, a gentle filtration of the exponentially growing cells was conducted onto a 25 mm GF/C microfiber filter (Whatman) under vacuum at 800 mbar, and the wet filter was transferred to 2 mL safe-lock Eppendorf tubes. Extraction was conducted by adding 1.6 mL of cold methanol and sonicating the samples in an ultrasonic bath (Bandelin, SONOREX™, Berlin, Germany) for 10 min at room temperature. The samples were centrifuged for 20 min at 12 000 g. The extracts were dried under nitrogen flow and taken up with 100 µL of methanol: water (1: 1). 1 µL was analyzed with ultra-high performance liquid chromatography-electrospray ionization mass spectrometry (UltiMate 3000 UHPLC Dionex) using an Accucore C-18 column (100 × 2.1 mm, 2.6 µm, Thermo Fischer Scientific) coupled to a Q-Exactive Plus Orbitrap mass spectrometer (Thermo Fisher Scientific, Bremen, Germany). Metabolites were separated with a 10 min gradient, with 100% of the aqueous phase (2% acetonitrile, 0.1% formic acid in water) for 3 min, then an increase of the acetonitrile phase (0.1% formic acid in acetonitrile) for 8 min until reaching 100%. Equilibration with 100% of the aqueous phase was pursued 1 min. The flow rate was increased from 0.4 to 0.7 mL min−1 in 8 min and set back to 0.4 mL min−1. All LC-based mass spectrometry experiments were conducted in positive-ion mode with a scan range of m/z 100 to 1000 and the resolution set to 140 000. The LC-HRMS/MS analysis was performed using the targeted parallel reaction monitoring (PRM) method, with an isolation window of m/z 0.4, normalized energy collision of 30 with the resolving power set to 140 000. MS/MS spectra (Figures 3, Supplementary Figure S1) were analyzed and searched in public spectral databases and repositories METLIN, LIPID MAPS®, MoNA using a mass deviation of 5 ppm. The mass measurement accuracy (MMA) of Orbitrap mass spectrometers is 1–5 ppm according to the manufacturer’s specifications (Makarov et al., 2006) and a 5 ppm mass tolerance was selected for the analysis in both MS and MS/MS spectra from Orbitrap mass spectrometers. MS/MS spectra were further analyzed with SIRIUS, CANOPUS (Dührkop et al., 2021), and CSI: FingerID (Dührkop et al., 2015). The feature-assigned metabolites were used in the univariate ROC curve analysis to test their potential as a discriminator of the two diagnostic groups (Figure 3).
Data availability statement
The datasets presented in this study can be found in online repositories. The names of the repository/repositories and accession number(s) can be found in the article/Supplementary Material.
Author contributions
GP and MV conceived the study. AB and MT isolated and identified the oomycete and diatom strains. FK performed sample preparation and LDI-HRMS analysis. MV performed the infection experiments, analyzed the data, and wrote the manuscript with contributions from all co-authors.
Funding
This work was supported by an MPG Fellowship awarded to GP and has been funded by the Deutsche Forschungsgemeinschaft (DFG, German Research Foundation) under Germany´s Excellence Strategy—EXC 2051—Project-ID 390713860, and the French ANR project EPHEMER. MT is supported by the government of Hessen in the framework of the LOEWE centre for Translational Biodiversity Genomics (TBG). MV and GP are each supported by the Deutsche Forschungsgemeinschaft (DFG, German Research Foundation), SFB 1127 ChemBioSys, project number 239748522.
Acknowledgments
We thank Ute Kieb from the Helgoland marine station for providing seawater and plankton samples.
Conflict of interest
The authors declare that the research was conducted in the absence of any commercial or financial relationships that could be construed as a potential conflict of interest.
Publisher’s note
All claims expressed in this article are solely those of the authors and do not necessarily represent those of their affiliated organizations, or those of the publisher, the editors and the reviewers. Any product that may be evaluated in this article, or claim that may be made by its manufacturer, is not guaranteed or endorsed by the publisher.
Supplementary material
The Supplementary Material for this article can be found online at: https://www.frontiersin.org/articles/10.3389/frans.2022.1051955/full#supplementary-material
References
Alacid, E., Reñé, A., Camp, J., and Garcés, E. (2017). In situ occurrence, prevalence and dynamics of Parvilucifera parasitoids during recurrent blooms of the toxic dinoflagellate Alexandrium minutum. Front. Microbiol. 8, 1624. doi:10.3389/fmicb.2017.01624
Baumeister, T. U. H., Vallet, M., Kaftan, F., Guillou, L., Svatoš, A., and Pohnert, G. (2020). Identification to species level of live single microalgal cells from plankton samples with matrix-free laser/desorption ionization mass spectrometry. Metabolomics 16, 28. doi:10.1007/s11306-020-1646-7
Baumeister, T. U. H., Vallet, M., Kaftan, F., Svatoš, A., and Pohnert, G. (2019). Live single-cell metabolomics with matrix-free laser/desorption ionization mass spectrometry to address microalgal physiology. Front. Plant Sci. 10, 172. doi:10.3389/fpls.2019.00172
Blanquart, F., Valero, M., Alves-de-Souza, C., Dia, A., Lepelletier, F., Bigeard, E., et al. (2016). Evidence for parasite-mediated selection during short-lasting toxic algal blooms. Proc. R. Soc. B Biol. Sci. 283, 20161870. doi:10.1098/rspb.2016.1870
Buaya, A., Kraberg, A., and Thines, M. (2019). Dual culture of the oomycete Lagenisma coscinodisci Drebes and Coscinodiscus diatoms as a model for plankton/parasite interactions. Helgol. Mar. Res. 73, 2. doi:10.1186/s10152-019-0523-0
BuffanDubau, E., deWit, R., and Castel, J. (1996). Feeding selectivity of the harpacticoid copepod Canuella perplexa in benthic muddy environments demonstrated by HPLC analyses of chlorin and carotenoid pigments. Mar. Ecol. Prog. Ser. 137, 71–73 7182. doi:10.3354/meps137071
Campagnaro, G. D., and de Koning, H. P. (2020). Purine and pyrimidine transporters of pathogenic protozoa – conduits for therapeutic agents. Med. Res. Rev. 40, 5 1679–1714. doi:10.1002/med.21667
Campbell, G. (1993). Receiver-operating characteristic (ROC) plots: A fundamental evaluation tool in clinical medicine. Clin. Chem. Baltim. Md 39, 4 561–577. doi:10.1093/clinchem/39.4.561
Caruana, A. M. N., Steinke, M., Turner, S. M., and Malin, G. (2012). Concentrations of dimethylsulphoniopropionate and activities of dimethylsulphide-producing enzymes in batch cultures of nine dinoflagellate species. Biogeochemistry 110, 1 87–107. doi:10.1007/s10533-012-9705-4
Chambouvet, A., Monier, A., Maguire, F., Itoïz, S., del Campo, J., Elies, P., et al. (2019). Intracellular infection of diverse diatoms by an evolutionary distinct relative of the fungi. Curr. Biol. 29, 40934093–40934101. doi:10.1016/j.cub.2019.09.074
Chappell, L., Russell, A. J. C., and Voet, T. (2018). Single-cell (multi)omics technologies. Annu. Rev. Genomics Hum. Genet. 19, 1 15–41. doi:10.1146/annurev-genom-091416-035324
Chong, J., Wishart, D. S., and Xia, J. (2019). Using MetaboAnalyst 4.0 for comprehensive and integrative metabolomics data analysis. Curr. Protoc. Bioinforma. 68, e86. doi:10.1002/cpbi.86
Deng, Y., Vallet, M., and Pohnert, G. (2022). Temporal and spatial signaling mediating the balance of the plankton microbiome. Annu. Rev. Mar. Sci. 14, 239–260. doi:10.1146/annurev-marine-042021-012353
Drebes, G. (1968). Lagenisma coscinodisci new genus new species a representative of lagenidiales from the marine diatom Coscinodiscus. Veroeffentlichungen des Instituts fuer Meeresforschung Bremerhaven 3, 67–70.
Dührkop, K., Nothias, L-F., Fleischauer, M., Reher, R., Ludwig, M., Hoffmann, M. A., et al. (2021). Systematic classification of unknown metabolites using high-resolution fragmentation mass spectra. Nat. Biotechnol. 39, 4 462–471. doi:10.1038/s41587-020-0740-8
Dührkop, K., Shen, H., Meusel, M., Rousu, J., and Böcker, S. (2015). Searching molecular structure databases with tandem mass spectra using CSI:FingerID. Proc. Natl. Acad. Sci. 112, 41 12580–12585. doi:10.1073/pnas.1509788112
Duncan, K. D., Fyrestam, J., and Lanekoff, I. (2019). Advances in mass spectrometry based single-cell metabolomics. Analyst 144, 3 782–793. doi:10.1039/c8an01581c
Fujii, T., Matsuda, S., Tejedor, M. L., Esaki, T., Sakane, I., Mizuno, H., et al. (2015). Direct metabolomics for plant cells by live single-cell mass spectrometry. Nat. Protoc. 10, 1445–1456. doi:10.1038/nprot.2015.084
Garcés, E., Alacid, E., Bravo, I., Fraga, S., and Figueroa, R. I. (2013a). Parvilucifera sinerae (Alveolata, Myzozoa) is a generalist parasitoid of dinoflagellates. Protist 164, 2 245–260. doi:10.1016/j.protis.2012.11.004
Garcés, E., Alacid, E., Reñé, A., Petrou, K., and Simó, R. (2013b). Host-released dimethylsulphide activates the dinoflagellate parasitoid Parvilucifera sinerae. ISME J. 7, 5 1065–1068. doi:10.1038/ismej.2012.173
Gibb, S., and Strimmer, K. (2012). MALDIquant: a versatile R package for the analysis of mass spectrometry data. Bioinformatics 28, 17 2270–2271. doi:10.1093/bioinformatics/bts447
Gil, P. M., Wonho, Y., and Wayne, C. D. (2004). Parasites and phytoplankton, with special emphasis on dinoflagellate infections. J. Eukaryot. Microbiol. 51, 2 145–155. doi:10.1111/j.1550-7408.2004.tb00539.x
Hanley, J. A., and McNeil, B. J. (1982). The meaning and use of the area under a receiver operating characteristic (ROC) curve. Radiology 143, 1 29–36. doi:10.1148/radiology.143.1.7063747
Hirashima, M., Tanaka, R., and Tanaka, A. (2009). Light-independent cell death induced by accumulation of Pheophorbide a in Arabidopsis thaliana. Plant Cell Physiology 50, 4 719–729. doi:10.1093/pcp/pcp035
Hörtensteiner, S., and Kräutler, B. (2011). Chlorophyll breakdown in higher plants. Biochimica Biophysica Acta (BBA) - Bioenergetics 8, 977–988. doi:10.1016/j.bbabio.2010.12.007
Jaschinski, T., Helfrich, E. J. N., Bock, C., Wolfram, S., Svatoš, A., Hertweck, C., et al. (2014). Matrix-free single-cell LDI-MS investigations of the diatoms Coscinodiscus granii and Thalassiosira pseudonana. J. Mass Spectrom. 49, 2 136–144. doi:10.1002/jms.3316
Jephcott, T. G., Alves-de-Souza, C., Gleason, F. H., van Ogtrop, F. F., Sime-Ngando, T., Karpov, S. A., et al. (2016). Ecological impacts of parasitic chytrids, syndiniales and perkinsids on populations of marine photosynthetic dinoflagellates. Fungal Ecol. 19, 47–58. doi:10.1016/j.funeco.2015.03.007
Krismer, J., Tamminen, M., Fontana, S., Zenobi, R., and Narwani, A. (2016). Single-cell mass spectrometry reveals the importance of genetic diversity and plasticity for phenotypic variation in nitrogen-limited Chlamydomonas. ISME J. 11, 988–998. doi:10.1038/ismej.2016.167
Lepelletier, F., Karpov, S. A., Le Panse, S., Bigeard, E., Skovgaard, A., Jeanthon, C., et al. (2014). Parvilucifera rostrata sp. nov. (Perkinsozoa), a novel parasitoid that infects planktonic dinoflagellates. Protist 165, 1 31–49. doi:10.1016/j.protis.2013.09.005
Levitan, O., Dinamarca, J., Zelzion, E., Lun, D. S., Guerra, L. T., Kim, M. K., et al. (2015). Remodeling of intermediate metabolism in the diatom Phaeodactylum tricornutum under nitrogen stress. Proc. Natl. Acad. Sci. 112, 2 412–417. doi:10.1073/pnas.1419818112
Makarov, A., Denisov, E., Kholomeev, A., Baischun, W., Lang, O., Strupat, K., et al. (2006). Performance evaluation of a hybrid linear ion trap/orbitrap mass spectrometer. Anal. Chem. 78, 2113–2120. doi:10.1021/ac0518811
Marañón, E., Lorenzo, M. P., Cermeño, P., and Mouriño-Carballido, B. (2018). Nutrient limitation suppresses the temperature dependence of phytoplankton metabolic rates. ISME J. 12, 7 1836–1845. doi:10.1038/s41396-018-0105-1
Nguyen, T. T., Parat, M-O., Shaw, P. N., Hewavitharana, A. K., and Hodson, M. P. (2016). Traditional aboriginal preparation alters the chemical profile of Carica papaya leaves and impacts on cytotoxicity towards human squamous cell carcinoma. PLOS ONE 11, 2e0147956. doi:10.1371/journal.pone.0147956
Rosenwasser, S., Mausz, M. A., Schatz, D., Sheyn, U., Malitsky, S., Aharoni, A., et al. (2014). Rewiring host lipid metabolism by large viruses determines the fate of Emiliania huxleyi, a bloom-forming alga in the ocean. Plant Cell 26, 6 2689–2707. doi:10.1105/tpc.114.125641
Schymanski, E. L., Jeon, J., Gulde, R., Fenner, K., Ruff, M., Singer, H. P., et al. (2014). Identifying small molecules via high resolution mass spectrometry: Communication confidence. Environ. Sci. Technol. 48, 4 2097–2098.
Spielmeyer, A., and Pohnert, G. (2010). Direct quantification of dimethylsulfoniopropionate (DMSP) with hydrophilic interaction liquid chromatography/mass spectrometry. J. Chromatogr. B 878, 31 3238–3242. doi:10.1016/j.jchromb.2010.09.031
Thines, M., Nam, B., Nigrelli, L., Beakes, G., and Kraberg, A. (2015). The diatom parasite Lagenisma coscinodisci (Lagenismatales, Oomycota) is an early diverging lineage of the Saprolegniomycetes. Mycol. Prog. 14, 9 75. doi:10.1007/s11557-015-1099-y
Vallet, M., Baumeister, T. U. H., Kaftan, F., Grabe, V., Buaya, A., Thines, M., et al. (2019). The oomycete Lagenisma coscinodisci hijacks host alkaloid synthesis during infection of a marine diatom. Nat. Commun. 10, 1698. doi:10.1038/s41467-020-15527-y
Wetsteyn, L. P. M. J., and Peperzak, L. (1991). Field observations in the Oosterschelde (The Netherlands) on Coscinodiscus concinnus and Coscinodiscus granii (Bacillariophyceae) infected by the marine fungus Lagenisma coscinodisci (Oomycetes). Hydrobiol. Bull. 25, 1 15–21. doi:10.1007/bf02259584
Xia, J., Broadhurst, D. I., Wilson, M., and Wishart, D. S. (2013). Translational biomarker discovery in clinical metabolomics: An introductory tutorial. Metabolomics 9, 2 280–299. doi:10.1007/s11306-012-0482-9
Keywords: parasitism, microbial infection, phytoplankton, single-cell metabolomics, laser desorption ionization high-resolution mass spectrometry
Citation: Vallet M, Kaftan F, Buaya A, Thines M, Guillou L, Svatoš A and Pohnert G (2023) Single-cell metabolome profiling for phenotyping parasitic diseases in phytoplankton. Front. Anal. Sci. 2:1051955. doi: 10.3389/frans.2022.1051955
Received: 23 September 2022; Accepted: 28 December 2022;
Published: 18 January 2023.
Edited by:
Kim K. Hixson, Pacific Northwest National Laboratory (DOE), United StatesReviewed by:
Carmen Bedia, Institute of Environmental Assessment and Water Research, Spanish National Research Council (CSIC), SpainAna Varela Coelho, Universidade Nova de Lisboa, Portugal
Copyright © 2023 Vallet, Kaftan, Buaya, Thines, Guillou, Svatoš and Pohnert. This is an open-access article distributed under the terms of the Creative Commons Attribution License (CC BY). The use, distribution or reproduction in other forums is permitted, provided the original author(s) and the copyright owner(s) are credited and that the original publication in this journal is cited, in accordance with accepted academic practice. No use, distribution or reproduction is permitted which does not comply with these terms.
*Correspondence: Marine Vallet, mvallet@ice.mpg.de