Label-Free Determination of PSA and Free PSA Using MA-SERS
 Zuzana Chaloupková
 Zdenka Medříková
 Milan Král
 Veronika Šedajová
 Václav Ranc
- 1Regional Center of Advanced Technologies and Materials, Palacky University Olomouc, Olomouc, Czechia
- 2Department of Urology, University Hospital, Olomouc, Czechia
- 3Department of Physical Chemistry, Faculty of Science, Palacky University, Olomouc, Czechia
- 4Laboratory of Experimental Medicine, Faculty of Medicine and Dentistry, Institute of Molecular and Translational Medicine, Palacky University Olomouc, Olomouc, Czechia
Prostate cancer is one of the compelling types of cancer diagnosed in men. Development of screening analytical methods, which provide fast and reliable results is, thus, demanding. Currently applied methods are usually based on the determination of serum prostate-specific antigen (PSA), where several limitations were identified. However, scientific reports have shown a direct correlation between the percentage of free PSA and prostate volume, and indirect correlation between the unfavorable course of the disease of prostate cancer and the percentage of free PSA in men with elevated PSA levels. Parallel analysis of PSA and free PSA presents an interesting alternative. Here, we present a new analytical method for a parallel analysis of PSA and free PSA in a whole human blood based on MA-SERS. The method is based on magnetic Fe3O4@Ag nanocomposite functionalized using anti-PSA. The method can distinguish between levels of PSA and free PSA within a single analytical run with limits of detection of 0.62 ng/ml for PSA and 0.49 ng/ml for free PSA, respectively.
Introduction
Digital rectal examination, PSA levels, and transrectal ultrasound followed by prostate biopsy are considered the basis for the detection of prostate cancer and one of the main tools in the differential diagnosis of prostate disease (Prcic et al., 2016). PSA is a leading tumor marker today beneficial for screening and early diagnosis of prostate cancer. A useful diagnostic index for classifying patients with benign and prostate cancer is the ratio of free to total PSA. Moreover, evaluation of this ratio is the most important especially in cases where DRE (digital rectal examination) was negative. The area in prostate cancer detection in the PSA ranges 4–10 ng/ml indicating low specificity for the PSA testing, and only 25% of men after biopsy are finally diagnosed with prostate cancer (Chen et al., 2017) The formerly used term PSA gray zone (e.g., 4–10 ng/ml) is not widely used in current clinical practice due to the fact that we encounter patients with PSA even below 4 ng/ml but already harboring locally advanced and aggressive prostate cancer. The level of free PSA in the patients with prostate cancer is decreased; therefore, the ratio of free to total PSA can be utilized for diagnostics to determine between prostate cancer and benign prostatic hyperplasia (Cheng et al., 2017).
Besides, the crucial factor of methods is the limit of detection of PSA/free PSA ratio, which is important in the early diagnostics of prostate cancer. The analytical feasibility of the diagnostic use of the alpha-1-antichymotrypsin-prostatic-specific antigen complex in serum has been classified in order to facilitate the distinction between benign prostatic hyperplasia and prostate cancer with a detection limit of 0.068 μg/L of ACT-PSA (Jung et al., 1999). The UniCel DxI800 accessory immunoassay system with a limit of detection of ng/ml was used to detect the free PSA/PSA ratio (Huang et al., 2017). A sandwich-type immunological method using specific pieces of single-chain antibody conjugated to magnetic particles for subsequent magnetic separation of free PSA allowed the detection of free PSA in the range of up to 10 ng/ml of free PSA (Zapatero-Rodrígue et al., 2018). A method based on the determination of benign prostate-specific antigen by fluorescent ELISA with high specificity for BPSA showed a detection limit of 6 ng/L due to the lack of cross-reactivity with other forms of PSA (Linton et al., 2003).
The assay for simultaneous detection of two PSA markers using surface-enhanced Raman spectroscopy is characterized by high detection throughput with the advantage of using a small sample size compared with other methods (Cheng et al., 2017). The clinical use of Raman spectroscopy for prostate cancer detection, including biopsy, screening, and possible monitoring of treatment efficacy, has also been investigated for the possibility of Raman spectroscopy’s concordance with other methods commonly used for prostate cancer detection (Kast et al., 2014). Studies further suggest that Raman spectroscopy can be used to detect biochemical differences and that spectral differences can be distinguished in prostate tissues with different Gleason scores, allowing Raman spectroscopy to be a tool for classifying prostate cancer risk (Kast et al., 2014; Crow et al., 2003).
Nevertheless, nowadays, performed analysis of the total amount of PSA have low selectivity, which is their main disadvantage. Magnetically assisted surface-enhanced Raman spectroscopy (MA-SERS) is a suitable method to increase selectivity. MA-SERS is based on the presence of MNPs@Ag nanocomposite, which uses both—the magnetic properties of Fe3O4 particles and the amplification factor of silver nanoparticles. The use of silver nanoparticles in Raman spectroscopy (SERS) overcomes the traditional problems associated with classical Raman spectroscopy, including the need for high concentrations of the sample to be measured, problems with fluorescence, or long accumulation times for the acquired data. The main contribution to the overall enhancement is due to the so-called electromagnetic mechanism based on the amplification of the local electromagnetic field (on the order of 105–107) due to the resonant excitation of surface plasmons in a metal, in our case a silver nanoparticle (Le Ru and Etchegoin, 2009). Furthermore, the specificity of the method is increased by the presence of magnetic nanocomposite. Using an external magnetic force, it is possible to easily separate the sample to be determined from the complex matrix and then directly determine the target using SERS. In our case, the selectivity was increased by functionalizing the MNPs@Ag nanocomposite with anti-PSA. PSA is present in three forms in the blood [the main form is immunoreactive PSA in serum, which can be bound by alpha 1-antichymotrypsin or by alpha-2-macroglobulin (75% is bounded to antichymotrypsin), while free PSA exists in 5%–50% in the serum] (Li, 2012). Methods based on MA-SERS can increase selectivity due to use of external magnetic force for separation samples from complex matrices. In addition, using MNPs@Ag@anti-PSA nanocomposite and the MA-SERS method, only a very small volume of clinical samples is required (in the tens of μl), and the determination takes minutes.
Here, we present a new analytical method for a parallel analysis of PSA and free PSA in whole human blood using the MA-SERS method. The method is based on magnetic MNPS@Ag nanocomposite covalently functionalized using anti-PSA antibodies (Marková et al., 2016). For this purpose, carboxymethyl cellulose was used as a linker between magnetic nanoparticles (also play role as a stabilator against their aggregation) (Marková et al., 2015), silver nanoparticles (throw interactions of carboxyl groups with silver nanoparticles), and antibody (using EDC chemistry). The nanocomposite allows to isolate the PSA from the sample by an application of the external magnetic field. Methods based on MA-SERS can solve this problem by the use of external magnetic force for a separation of analytes from complex matrices. In addition, using MNPs@Ag@anti PSA nanocomposite and the MA-SERS method, only a very small volume of clinical samples is required (in the tens of μl), and the determination takes minutes. Following spectral analysis using magnetically assisted surface-enhanced Raman spectroscopy allows to distinguish between a signal of free PSA and bonded PSA and determine their levels with limits of detection of 0.49 and 0.62 ng ml−1, respectively. MA-SERS can increase selectivity of determination of PSA and free PSA due to advantages mentioned before.
Experimental Section
Chemicals and Reagents
Iron (II) chloride tetrahydrate (p.a.) and iron (III) chloride hexahydrate (p.a.), carboxymethyl cellulose sodium salt (with a low viscosity), sodium hydroxide (p.a.), N-(3-dimethylaminopropyl)-N′ethylcarbodiimide hydrochloride (≥99%), silver nitrate (p.a.), 1-[3-(dimethylamino)propyl]-3-ethylcarbodiimide methiodide, D-(+)-maltose monohydrate (p.a.), ammonia (25% v/v, p.a.), prostate-specific antigen from human semen (purity ≥95%), and anti-PSA (monoclonal antibody produced in rabbit) were purchased from Sigma Aldrich (San Jose, CA, United States) and utilized without further purification. Free prostate-specific antigen (fPSA) was purchased from Cedarlane (Buenos Aires, Argentina) and used without further purification.
Synthesis of MNPs@Ag@anti-PSA Nanocomposite
Magnetite nanoparticles (MNPs) functionalized by CMC (carboxy methyl cellulose) were prepared according to the following protocol (Marková et al., 2016): First, 1 g of CMC was dissolved in 30 ml of deionized H2O; the solution was heated up to 303 K. Next, 720 mg of FeSO4.7H2O was dissolved in 10 ml of deionized H2O, acidified by the addition of 100 µl of 37% HCl. Both solutions were mixed and stirred at 300 rpm. Next, 7 ml of aqueous solution of NH4OH (28%) was added to the mixture. The temperature was increased to 323 K over a period of 15 min, followed by the addition of 5 ml of 28% NH4OH. The synthesized magnetic nanomaterial was separated by centrifugation at 20,000 × g and 293 K for 1 h. Finally, the magnetic pellet was resuspended in 60 ml of deionized H2O and immersed in ultrasound bath for 15 min. This step was repeated two times. The obtained magnetic nanomaterial was centrifuged at 1,000 × g and 298 K for 20 min. In the last step, the supernatant containing carboxylated magnetic nanoparticles (labeled as cMNPs) was stored, and its concentration was adjusted to 1 g of magnetite/L.
Silver nanoparticles (d = 28 nm, AgNPs) were prepared according to protocol (Panáček et al., 2006). First, an aqueous solution containing 1 mmol of AgNO3, 10 mmol of maltose, and 5 mmol NH4OH was prepared. Next, the pH of the reaction mixture was adjusted to 11.5 ± 0.1 by the addition of NaOH. To obtain the MNPs@Ag composite, 10 µl of Ag NP suspension was added to the MNP suspension. The loading of Ag NPs was performed in a continuous flow for 15 min at room temperature.
Finally, immobilization of anti-PSA on the surface of silver nanoparticles was carried out. First, 1 ml of MNPs@Ag was mixed with 100 µl of EDC (final concentration 20 mmol) and stirred for 30 min. The nanocomposite was separated using external magnetic force, and adequately washed by 10 mmol PBS buffer. Next, anti-PSA was added to achieve a concentration of 0.2 ng/L, and its anchoring on the surface of the nanocomposite was performed under stirring at 300 rpm for 1 h at room temperature.
Preparation of Model Samples Containing Prostate-Specific Antigen and Free Prostate-Specific Antigen
PSA and free PSA were analyzed using the following protocol: 10 µl of MNPs@Ag@anti-PSA was mixed with 10 µl of a standard solution of PSA or free PSA (c = 10 ng/ml). The mixture was incubated for 30 min at 293 K.
Preparation of Samples of Whole Human Blood
To demonstrate the method applicability, two volunteers (male), both aged 62 years, were selected. Whole blood samples (2 ml) were collected in Eppendorf tubes with sodium citrate as an anticoagulant. Samples were stored at −80°C before analysis and analyzed within 24 h after unfreezing. Samples for measurements were prepared by a dilution of 200 µl of unfrozen samples with 800 µl of deionized water to reduce sample density/viscosity. No further pretreatment of the samples was carried out.
Analysis of Samples
Obtained samples were isolated using external magnetic force, the obtained droplet was deposited on a microscopy glass (2 × 8 cm), and the analyzed samples were dried out and concentrated in a coffee ring structure caused by capillary flow. The samples were analyzed by means of Raman spectroscopy at three spots on the ring. Obtained spectra were averaged and employed in the consecutive steps. Samples of the whole human blood were analyzed in an analogy to a methodology previously described in the section on Preparation of samples of whole human blood.
Determination of Prostate-Specific Antigen/Free Prostate-Specific Antigen
The determination of the PSA and free PSA, respectively, consisted of two consecutive steps. Intensity of the spectral band at 1,335 cm−1 was used as a quantitative marker in both. In the first step, estimated concentration of PSA and free PSA, respectively, in the samples was determined from an external calibration assembled using standard solutions in a concentration range of 2–500 ng/ml. The second step was as follows: More precise/accurate values were determined using a standard addition method based on the three repeated additions of the standard of PSA or free PSA, respectively. The concentrations of the standard additions were derived from an approximate concentration of PSA/free PSA determined in the first step. Concentrations of additions 1–3 were set to cause 30%–50% increments in the measured signal.
Characterization
Microscopic images were obtained by transmission electron microscopy (TEM) JEOL JEM 2100 microscope operated at 200 kV. Energy-dispersive X-ray spectroscopy (EDS) was performed in scanning (STEM) mode of high-resolution transmission electron microscope (HRTEM) TITAN G2 operated at 80 kV to obtain elemental maps (using Super-X system with four silicon drift detectors Bruker). STEM images were taken with an HAADF detector 3,000 (Fischione).
Zeta potential values
Raman spectral data were obtained on a DXR Raman microscopy (Thermo Scientific, United States) with an excitation laser operating at 633 nm (red). Raman spectra were measured in the range from 400 to 3,500 cm−1. Spectral resolution of the applied combination of laser and optics was 1.0 cm−1. Experimental parameters were as follows: the exposure time: 16 s, laser power 4 mW (measured on the sample surface), one experimental point was obtained by the averaging of 512 microscans. Interfering spectral background, including fluorescence and sample heating, was corrected using a subtraction of polynomial fit, where n = 3. Quantification of concentrations of proteins, including PSA and fPSA, was performed using the TQ-Analyst software package (Omnic, version 8, Thermo Scientific, Waltham, United States).
Results and Discussion
Characterization of Prepared Nanocomposite
The prepared nanosensor, based on carboxymethylcellulose-stabilized magnetite–silver nanoclusters, was characterized by Raman and infrared spectroscopy, transmission electron microscopy, ζ-potential measurements, EDS analysis, elemental mapping, and XPS analysis. EDS spectrum (Figure 1A) confirmed the presence of Ag and Fe in the nanocomposite. The arrangement of nanoparticles was identified by microscopic technique, where the results from the TEM (Figure 1B) and comparison of dark-field STEM (Figure 1C) and elemental mapping (Figures 1D–G) reveal that composite is formed by 5- to 20-nm magnetite nanoparticles and 20- to 40-nm silver nanoparticles, which are attached to CMC, which presence was confirmed by zeta-potential and FT-IR measurements. The presence of free carboxyl groups of CMC on the nanocomposite surface, which plays a critical role for anti-PSA loading and good stability of the system (Kirby and Hasselbrink, 2004), was confirmed by the determination of very low values of zeta potentials of MNPs, MNPs@Ag, and MNPs@Ag@antiPSA (−52,5, −45,3, and −45,2 mV, respectively).
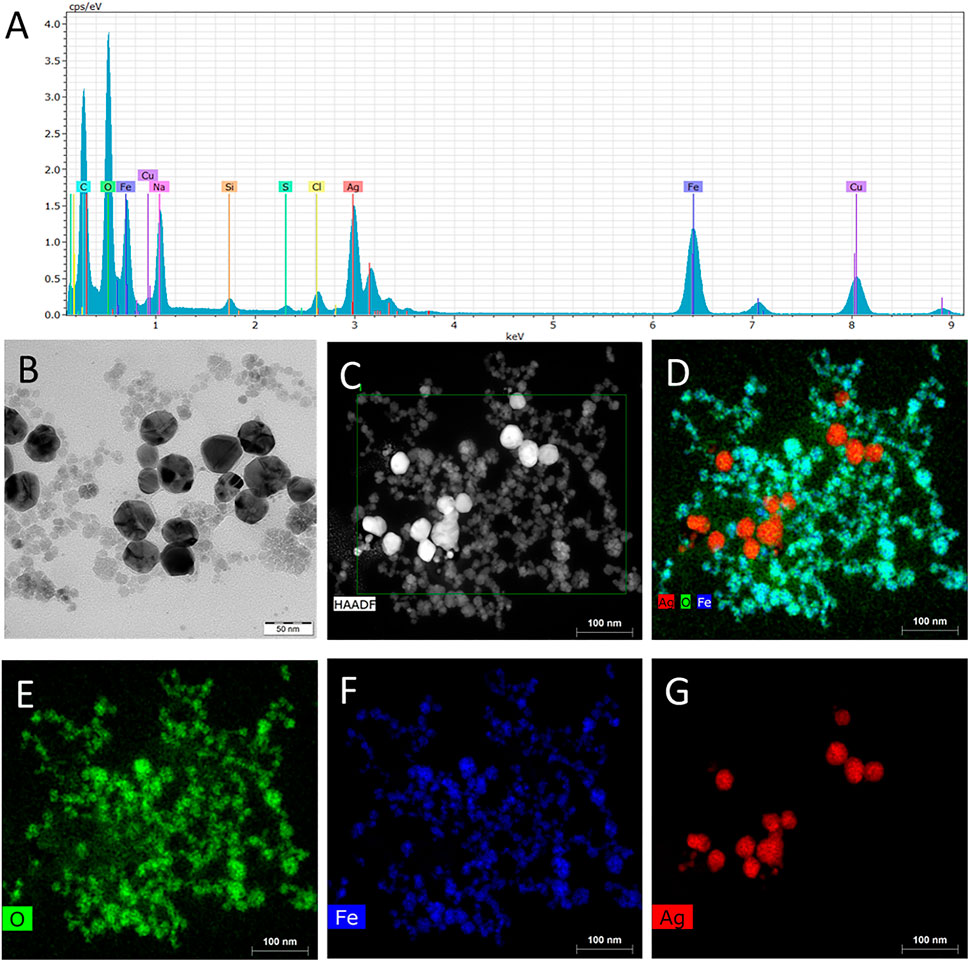
FIGURE 1. (A) Energy dispersive x-ray spectroscopy (EDS) spectrum, (B) transmission electron microscopy (TEM) image, (C) dark-field scanning transmission electron microscopy (HAADF-STEM) image, and (D–G) element mapping of MNPs@Ag composite.
The comparison of FT-IR spectra of free CMC, MNPs, MNPs@Ag, and MNPs@Ag@antiPSA shows an effective anchoring of CMC on the surface of the nanostructures and its presence in all composites (Figure 2A). Spectra were interpreted in agreement with methods previously specified by Barth (Barth, 2007; Xue Li et al., 2014). All spectra involve characteristic peaks of CMC, namely, 1,030 (C-O stretch), 1,330 (bridge–O–stretch), 1,420 (bridge-O-stretch), 1,590 (-COO− asymmetric stretch), 2,900 (C-H stretch), and 3,400–3,200 (O–H stretch). Moreover, a nonsymetric character of –COO− peak at 1,590 cm−1 was observed for MNPs@Ag-anti-PSA (Figure 2B) due to the presence of amide I band (∼1,650 cm−1), which is characteristic of the presence of proteins (Miller et al., 2013). In accordance, the comparison of XPS spectra of MNPs@Ag and MNPs@Ag@anti-PSA (Figure 2C) confirmed the EDS analysis, and moreover, they revealed four times higher content of nitrogen in the sample of MNPs@Ag@anti-PSA (Figure 2D) that can be attributed to the presence of amine and amide groups of anti-PSA on the nanocomposite surface.
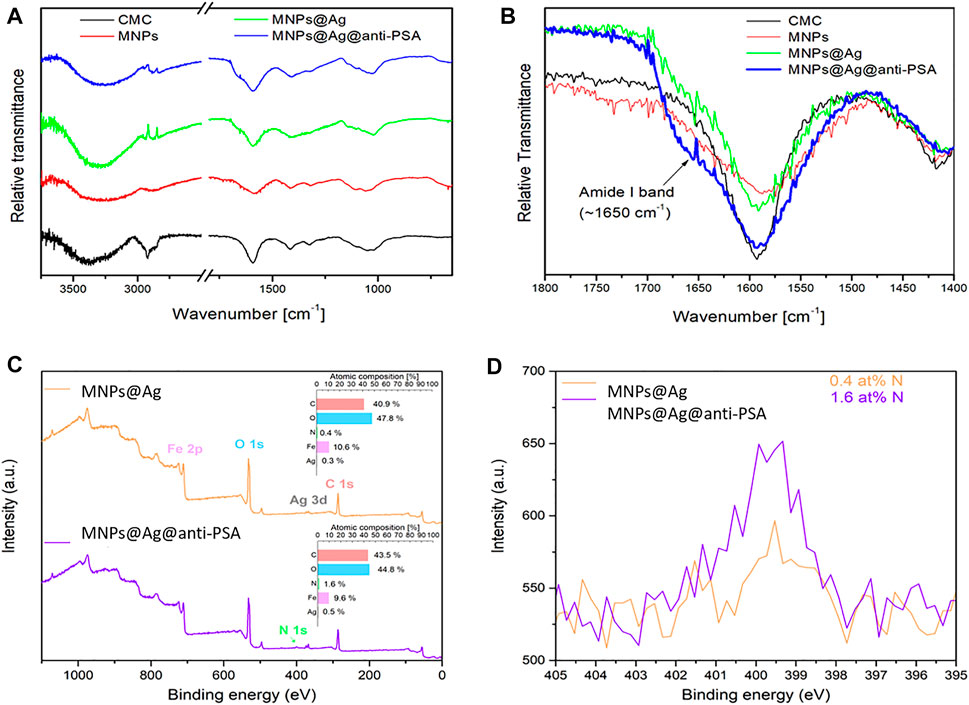
FIGURE 2. (A,B) Fourier transform infrared (FT-IR) spectra of CMC, magnetite nanoparticles (MNPs), MNPs@Ag, and MNPs@Ag@anti-PSA, (C) XPS survey spectra of MNP@Ag and MNP@Ag@anti-PSA samples with atomic composition (insets), and (D) comparison of HR-XPS N 1-s region for both samples.
Measurement of Standard Solutions and Determination Level of Detection of Prostate-Specific Antigen and Free Prostate-Specific Antigen
The synthesized nanomaterial was subjected to the analysis of standard solutions containing PSA and free PSA (c = 10 ng/ml). The resulting data can be seen in Figure 3A. Raman spectra obtained from the analysis of the model sample (sample label: MNPs@Ag@anti-PSA@PSA, MNPs@Ag@anti-PSA@fPSA) include spectral bands typical for proteins. Considerable vibrations of proteins included abundant spectral bands present at 650, 845, 1,003, and 1,290 cm−1 (C-H deformation vibrations of proteins), and 1,450 cm −1 and 1,670 cm−1 (labeled as amide I). Moreover, raw nanomaterial and functionalized sensor MNPs@Ag, stabilized by CMC (label: MNPs@Ag), were measured as spectral references. Both spectra do not contain any significant Raman bands.
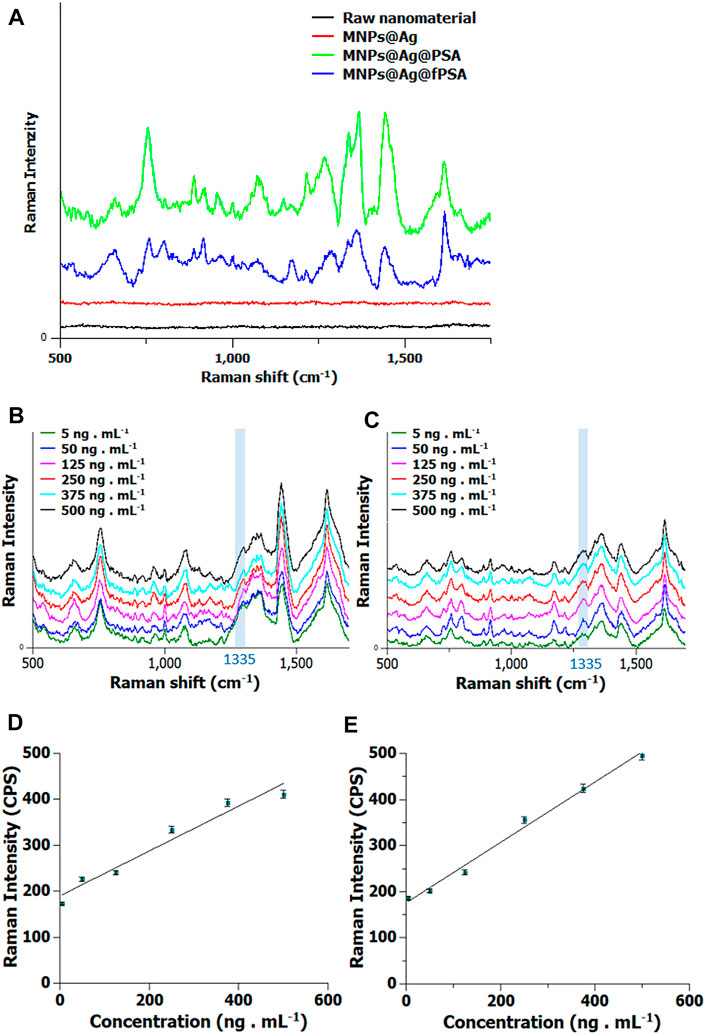
FIGURE 3. (A) Raman spectra obtained by the analysis of standard solution of prostate-specific antigen (PSA) or free prostate-specific antigen (fPSA) (c = 10 ng/ml) immobilized on MNPs@Ag@anti-PSA. Raman spectrum of raw nanomaterial (black), Raman spectrum of MNPS functionalized by Ag (red), Raman spectrum of standard solution of PSA (green), and Raman spectrum obtained from the analysis of standard solution of free PSA (blue). The spectra of the standard samples are shifted by 100 pulses, for better readability of the picture. (B) Raman spectra obtained from analysis of PSA and (C) free PSA at concentrations of 5, 50, 125, 250, 375, and 500 ng/ml, and the calibration curves are composed of six calibration points obtained by (D) PSA and (E) free PSA analysis.
Next, a set of standard solutions containing PSA and fPSA, respectively, was measured using MNPs@Ag@anti-PSA nanocomposite in the range of concentration levels from 5 to 500 ng/ml Figures 3B,C, where six concentration levels with five replicates were measured and classified. The resulting spectra of all six standards are shown in Figure 3D (PSA) and Figure 3E (free PSA). These data suggest that the Raman intensity of the spectral bands that are characteristic of PSA and free PSA varies with concentration. As a marker of quantification, we determined the amide vibration of the amide located at 1,335 cm−1, and the obtained intensity of this band was applied to construct a calibration curve. The LOD values were statistically estimated by using reliability of calibration curves for PSA and free PSA, from the three-time evaluated standard deviation of the slopes. The calculated coefficient of determination (R2) is 0.98 for PSA and 0.952 for free PSA, respectively. The resulting lower limit of detection (LOD) is 0.62 ng/ml for PSA and 0.49 ng/ml for free PSA, respectively.
Repeatability and Reproducibility
The repeatability of the analytical method was classified on a set of five independent measurements (Figures 4A,B). It is clear from the results that all obtained spectra are fully comparable, with the statistical difference aimed at the previously selected peak being less than 9%. Then the stability of the nanomaterial was evaluated by regular measurements for 3 months, the spectral data obtained 3 months after the synthesis of the nanomaterial show a strong analytical signal of PSA and freePSA, confirming that the synthesized nanomaterial can be applied for a long time without significant signal loss.
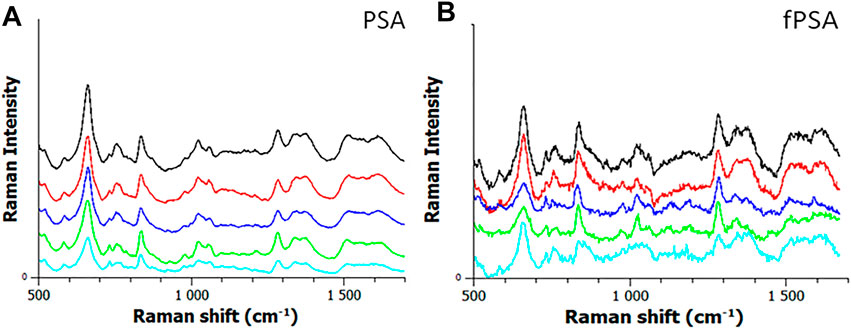
FIGURE 4. (A) Raman data of five sequential samples of standard mixture of PSA and free PSA (c = 10 ng/ml). (B) Spectra were measured using MNPs@Ag@anti-PSA nanocomposite. It is shown that there is no considerable difference between obtained spectral data. The spectra of the standard samples are shifted by 100 counts, for better readability of the picture.
Discriminant Analysis of Prostate-Specific Antigen and Free Prostate-Specific Antigen
We further concluded that Raman spectroscopy can be used to correctly distinguish between PSA and free PSA using our developed high-precision analytical sensor. Investigative study and supervised classification, namely, partial least squares discriminant analysis (PLSA), confirmed the possibility of using Raman spectroscopy to distinguish between the studied PSA and free PSA. Obtained data are shown in Figures 5A,B.
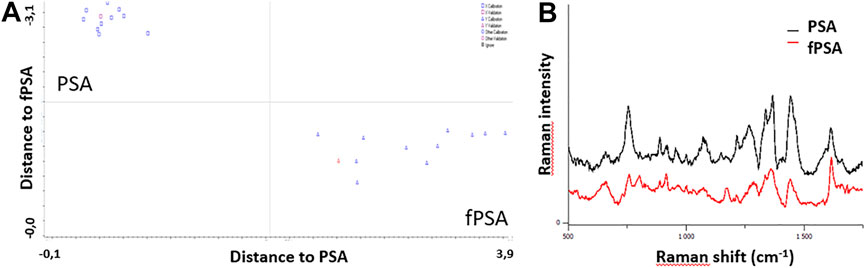
FIGURE 5. (A) Data aquared from the partial least squares discriminant analysis (PLSA) analysis. (B) Raman spectra obtained by the analysis of PSA/free PSA using MNPs@Ag@anti-PSA nanocomposite.
MNPs@Ag@anti-PSA Nanocomposite for Analysis of Real Samples
Finally, we studied the use of MNPs@Ag@anti-PSA nanocomposite for the analysis of human whole blood samples containing different concentrations of PSA and freePSA. Figure 6 shows the Raman spectrum obtained by analyzing a real sample and a standard mixture containing PSA and free PSA (c = 10 ng/ml in total). Subsequent detailed spectral analysis revealed new bands located at 1,350 and 1,525 cm−1, which are not present in the spectrum of the real samples, thus, outlining minor nonspecific interactions. The total PSA and free PSA concentrations in the samples were calculated using the standard addition method and the synthetic analytical sensor, respectively, in order to minimize the influence of nonspecific interactions between the matrix components. For the measurement of the real samples containing blood, it is necessary to focus on possible hemolysis caused by hemoglobin and intracellular components during measurement. Using spectroscopic methods, we can find an oxyhemoglobin peak between 531 and 543 cm−1, and due to the relatively wide absorption peak, hemolysis can affect the quantification of analytes in this range (Howanitz et al., 2015). Medipally et al. (2020) studied the effect of hemolysis using infrared spectroscopy and Raman spectra of blood plasma. They measured that hemolysis could affect the infrared and Raman spectra of blood plasma, but a larger study is needed to confirm the effect of hemolysis both in vitro and in vivo.
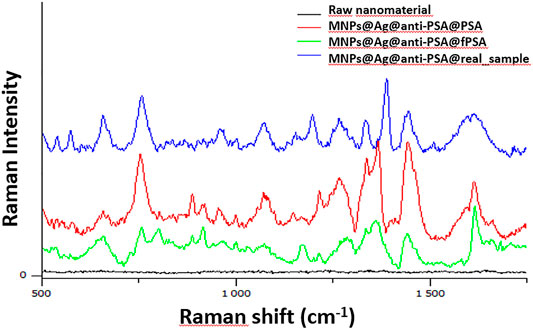
FIGURE 6. Raman spectra obtained by the analysis of whole blood samples containing PSA and free PSA (whole blood) using MNPs@Ag@anti-PSA nanocomposite.
A total of two samples (both with a diagnosis of BHP) were evaluated. The PSA or free PSA concentrations in these samples were: 2.91 ng ml−1 (PSA), 2.34 ng ml−1 (free PSA) per first real sample, and 3.29 ng ml−1 (PSA) and 2.76 ng ml−1 (freePSA) per second real sample. For patients who have borderline concentrations, the ratio of free to total PSA (free/total PSA ratio) is determined (Hoffman et al., 2000).
Conclusion
Commonly used techniques for prostate cancer detections [fluorescence immunoassay (Shaoxin Li et al., 2014), ELISA (Liang et al., 2015)] are based on determination of only a single biomarker, and parallel immunoassay test must be realized for the determination of both PSA/free PSA levels. Furthermore, ELISA is labor intensive, with expensive to prepare antibodies, and requires expensive culture and sophistication. Cheng et al. (2017) developed a method for simultaneous free PSA and cPSA detection using SERS and two different types of SERS nanotags (unequal for free PSA and cPSA) on AuNP surface with limits of detection of 0.012 ng/ml per PSA and 0.15 ng/ml per fPSA. Here, we present a new possibility for the determination of prostate cancer based on magnetic MNPS@Ag nanocomposite covalently functionalized using anti-PSA antibodies. The nanocomposite allows isolating the PSA/free PSA from the sample (whole human blood) by an application of the external magnetic field. The main advantages of this method are label-free determination. Also, there is a small volume of clinical samples (in the tens of μl), and the determination takes minutes. The ability to determine the total amount of PSA/free PSA in biological samples opens interesting alternatives to commonly used ELISA-based methods. The MNPs@Ag@anti-PSA nanocomposite has been successfully classified as a potential nanosensor suitable for the determination of total PSA/free PSA in whole human blood samples. The calculated limits of quantification are in the range of ng/ml, which is in good correlation with other methods for the determination of PSA/free PSA ratio Barth, 2007, Xue Li et al., 2014.
Data Availability Statement
The raw data supporting the conclusion of this article will be made available by the authors, without undue reservation.
Author Contributions
Conceptualization, ZC, VR, ZM, VS and MK; Investigation, ZC, MK, and ZM; Writing - original draft preparation, ZC, ZM, and VR; writing - review and editing, ZC, ZM and VR; All authors have read and agreed to the published version of the manuscript.
Funding
The work was supported by the ERDF project “Development of pre-applied research in nanotechnology and biotechnology” (No. CZ.02.1.01/0.0/0.0/17\_048/0007323), by the Ministry of Health of the Czech Republic, grant no. NV19-04-00281. NANO4TARMED consortium H2020 WIDESPREAD-2020-5 project number 952063 and from the Internal Student Grant Agency of the Palacký University in Olomouc, Czech Republic (IGA_PrF_2022_019).
Conflict of Interest
The authors declare that the research was conducted in the absence of any commercial or financial relationships that could be construed as a potential conflict of interest.
Publisher’s Note
All claims expressed in this article are solely those of the authors and do not necessarily represent those of their affiliated organizations, or those of the publisher, the editors, and the reviewers. Any product that may be evaluated in this article, or claim that may be made by its manufacturer, is not guaranteed nor endorsed by the publisher.
References
Barth, A., Infrared Spectroscopy of Proteins. Biochim. Biophys. Acta (Bba) - Bioenerg. (2007) 1767(9):1073–1101. doi:10.1016/j.bbabio.2007.06.004
Chen, N., Rong, M., Shao, X., Zhang, H., Liu, S., Dong, B., et al. Surface-enhanced Raman Spectroscopy of Serum Accurately Detects Prostate Cancer in Patients with Prostate-specific Antigen Levels of 4–10 ng/mL. Int. J. Nanomedicine (2017) Vol 12:5399–5407. doi:10.2147/ijn.s137756
Cheng, Z., Choi, N., Wang, R., Lee, S., Moon, K. C., Yoon, S.-Y., et al. Simultaneous Detection of Dual Prostate Specific Antigens Using Surface-Enhanced Raman Scattering-Based Immunoassay for Accurate Diagnosis of Prostate Cancer. ACS Nano (2017) 11(5):4926–4933. doi:10.1021/acsnano.7b01536
Crow, P., Stone, N., Kendall, C. A., Uff, J. S., Farmer, J. A. M., Barr, H., et al. The Use of Raman Spectroscopy to Identify and Grade Prostatic Adenocarcinoma In Vitro. Br. J. Cancer (2003) 89(1):106–108. doi:10.1038/sj.bjc.6601059
Hoffman, R. M., Clanon, D. L., Littenberg, B., Frank, J. J., and Peirce, J. C., Using the Free-To-Total Prostate-specific Antigen Ratio to Detect Prostate Cancer in Men with Nonspecific Elevations of Prostate-specific Antigen Levels. J. Gen. Intern. Med. (2000) 15(10):739–748. doi:10.1046/j.1525-1497.2000.90907.x
Howanitz, P. J., Lehman, C. M., Jones, B. A., Meier, F. A., and Horowitz, G. L., Clinical Laboratory Quality Practices when Hemolysis Occurs. Arch. Pathol. Lab. Med. (2015) 139(7):901–906. doi:10.5858/arpa.2014-0252-cp
Huang, H.-Q., Zhang, Y., and Xu, H.-G., Different Free Prostate-specific Antigen to Total Prostate-specific Antigen Ratios Using Three Detecting Systems. J. Clin. Lab. Anal. (2017) 32(2):e22231. doi:10.1002/jcla.22231
Jung, K., Brux, B., Lein, M., Knäbich, A., Sinha, P., Rudolph, B., et al. Determination of Alpha1-Antichymotrypsin-PSA Complex in Serum Does Not Improve the Differentiation between Benign Prostatic Hyperplasia and Prostate Cancer Compared with Total PSA and Percent Free PSA. Urology (1999) 53(6):1160–1167. doi:10.1016/S0090-4295(99)00080-1
Kast, R. E., Tucker, S. C., Killian, K., Trexler, M., Honn, K. V., and Auner, G. W., Emerging Technology: Applications of Raman Spectroscopy for Prostate Cancer. Cancer Metastasis Rev. (2014) 33:673–693. doi:10.1007/s10555-013-9489-6
Kirby, B. J., and Hasselbrink, E. F., Zeta Potential of Microfluidic Substrates: 1. Theory, Experimental Techniques, and Effects on Separations. Electrophoresis (2004) 25:187–202. doi:10.1002/elps.200305754
Le Ru, E. L., and Etchegoin, P., Principles of Surface Enhanced Raman Spectroscopy and Related Plasmonic Effects. Amsterdam: Elsevier (2009).
Li, B., Prostate Cancer Target Therapy. In: The Encyclopedia of Cancer. 3rd edition. Berlin (2012). p. 3065–3069.
Liang, J., Liu, H., Huang, C., Yao, C., Fu, Q., Li, X., et al. Aggregated Silver Nanoparticles Based Surface-Enhanced Raman Scattering Enzyme-Linked Immunosorbent Assay for Ultrasensitive Detection of Protein Biomarkers and Small Molecules. Anal. Chem. (2015) 87:5790–5796. doi:10.1021/acs.analchem.5b01011
Linton, H. J., Marks, L. S., Millar, L. S., Knott, C. L., Rittenhouse, H. G., and Mikolajczyk, S. D., Benign Prostate-specific Antigen (BPSA) in Serum Is Increased in Benign Prostate Disease. Clin. Chem. (2003) 49(2):253–259. doi:10.1373/49.2.253
Medipally, D. K. R., Cullen, D., Untereiner, V., Bryant, J., Sockalingum, G. D., Nguyen, T. N. Q., et al. Effect of Hemolysis on Fourier Transform Infrared and Raman Spectra of Blood Plasma. J. Biophotonics (2020) 13:e2455. doi:10.1002/jbio.201960173
Medříková, Z., Novohradsky, V., Zajac, J., Vrána, O., Kasparkova, J., Bakandritsos, A., et al. Enhancing Tumor Cell Response to Chemotherapy through the Targeted Delivery of Platinum Drugs Mediated by Highly Stable, Multifunctional Carboxymethylcellulose-Coated Magnetic Nanoparticles. Chem. Eur. J. (2016) 22(28):9750–9759. doi:10.1002/chem.201600949
Miller, L. M., Bourassa, M. W., and Smith, R. J., FTIR Spectroscopic Imaging of Protein Aggregation in Living Cells. Biochim. Biophys. Acta (Bba) - Biomembranes (2013) 1828(10):2339–2346. doi:10.1016/j.bbamem.2013.01.014
Panacek, A., Kvítek, L., Prucek, R., Kolar, M., Vecerova, R., Pizúrova, N., et al. Silver Colloid Nanoparticles: Synthesis, Characterization, and Their Antibacterial Activity. J. Phys. Chem. B (2006) 110(33):16248–16253. doi:10.1021/jp063826h
Prcic, A., Begic, E., and Hiros, a., Actual Contribution of Free to Total PSA Ratio in Prostate Diseases Differentiation. Med. Arh (2016) 70(4):288–292. doi:10.5455/medarh.2016.70.288-292
Shaoxin Li, S., Zhang, Y., Xu, J., Li, L., Zeng, Q., Lin, L., et al. Noninvasive Prostate Cancer Screening Based on Serum Surface-Enhanced Raman Spectroscopy and Support Vector Machine. Appl. Phys. Lett. (2014) 105(9):091104. doi:10.1063/1.4892667
Xue Li, X., Li, W., Yang, Q., Gong, X., Guo, W., Dong, C., et al. Rapid and Quantitative Detection of Prostate Specific Antigen with a Quantum Dot Nanobeads-Based Immunochromatography Test Strip. ACS Appl. Mater. Inter. (2014) 6(9):6406–6414. doi:10.1021/am5012782
Keywords: prostate cancer, PSA/free PSA, magnetic nanocomposite, Raman spectroscopy, surface-enhanced Raman scattering (SERS)
Citation: Chaloupková Z, Medříková Z, Král M, Šedajová V and Ranc V (2022) Label-Free Determination of PSA and Free PSA Using MA-SERS. Front. Anal. Sci. 2:847730. doi: 10.3389/frans.2022.847730
Received: 03 January 2022; Accepted: 31 January 2022;
Published: 22 March 2022.
Edited by:
Liang Qiao, Fudan University, ChinaReviewed by:
Kun Zhang, Shanghai Jiao Tong University, ChinaRuo-Can Qian, East China University of Science and Technology, China
Copyright © 2022 Chaloupková, Medříková, Král, Šedajová and Ranc. This is an open-access article distributed under the terms of the Creative Commons Attribution License (CC BY). The use, distribution or reproduction in other forums is permitted, provided the original author(s) and the copyright owner(s) are credited and that the original publication in this journal is cited, in accordance with accepted academic practice. No use, distribution or reproduction is permitted which does not comply with these terms.
*Correspondence: Zuzana Chaloupková, Zuzana.Chaloupkova@upol.cz; Milan Král, milan.kral@fnol.cz