 Edison Zhamungui Sánchez1,2
 Hassan Hijazi1,3
 Jana Haidar1,4
 Enrica Mecarelli5
 Elda Bauda1
 Isabelle Petit-Härtlein1Jean-Marie Teulon1
 Jean-Luc Pellequer1
 Elisabetta Boeri Erba1*
- 1University Grenoble Alpes, Alternative Energies and Atomic Energy Commission (CEA), French National Centre for Scientific Research (CNRS), IBS, Grenoble, France
- 2Center for Molecular Biophysics, French National Centre for Scientific Research (CNRS), Orleans, France
- 3Exploring the Dynamics of Proteomes (EDyP), University Grenoble Alpes, CEA, Inserm, IRIG-BGE UA13, CNRS/CEA FR 2048, CEA Grenoble, Grenoble, France
- 4University Bordeaux, CNRS, Bordeaux INP, IMS, UMR 5218, F-33400, Talence, France
- 5Department of Molecular Biotechnology and Health Sciences, University of Turin, Turin, Italy
Membrane proteins are key players in many cellular events and represent crucial drug targets. Matrix-assisted laser desorption ionization mass spectrometry (MALDI MS) is a valuable approach to investigate them. To our knowledge, there are only a few reports of sequencing small membrane proteins using MALDI in-source decay (ISD). We report the successful fragmentation and sequencing of membrane proteins up to 46 kDa by MALDI-ISD. We have 1) investigated key MALDI parameters that influence the sequencing of a soluble protein; 2) used atomic force microscopy to observe our samples and correlate their topological features with MALDI data, which allowed us to optimize fragmentation conditions; 3) sequenced N- and C-termini of three membrane proteins (SpoIIIAF, TIM23, and NOX), solubilized in three different ways. Our results indicate that detergent and buffer type are of key importance for successful MALDI-ISD sequencing. Our findings are significant because sequencing membrane proteins enables the unique characterization of challenging biomolecules. The resulting fragmentation patterns provide key insights into the identity of proteins, their sequences, modifications, and other crucial information, such as the position of unexpected truncation.
1 Introduction
Membrane proteins are crucial in cellular processes such as signaling, trafficking, and immunological surveillance. Many membrane proteins are found at the cell surface and, consequently, they represent potential targets for numerous therapies (Arinaminpathy et al., 2009). Investigating membrane proteins is a challenge (Duran and Meiler, 2018). They represent 20%–30% of proteins encoded by eukaryotic genes (Martin J and Sawyer, 2019). However, only approximately 3% of experimentally determined protein structures are membrane proteins (Sun et al., 2023). In simple terms, studying membrane proteins is more difficult than investigating soluble proteins because membrane proteins are amphiphilic biomolecules, normally embedded in a lipid bilayer. They contain both hydrophilic domains (exposed to solvents) and hydrophobic domains (buried within a lipid bilayer). During their purification, they are in an aqueous environment. In this context, they may aggregate and precipitate. Therefore, detergents and other compounds are necessary to make them soluble in water. Screening for optimal detergents is often essential for maximal solubility and stability of membrane proteins. Indeed, detergents highly interfere with mass spectrometry (MS). They suppress ionization of membrane proteins, and/or their signals are so prominent that signals of proteins are not visible (Melby et al., 2021). Currently, some studies illustrate successful MS-based sequencing of membrane proteins (Melby et al., 2021). Arduous sample preparation prior to MS analysis indicates that additional methods for MS-based sequencing of membrane proteins (such as MALDI-ISD, refer to the following paragraph) are crucial for investing these important biomolecules.
Biological MS is a key and versatile tool to characterize membrane proteins (Kar et al., 2017; Prados-Rosales et al., 2019). Different types of ionization can be used for this purpose: electrospray (ESI) (Pham et al., 2013), laser-induced liquid bead ion desorption (LILBID) (Hellwig et al., 2018), and matrix-assisted laser desorption ionization (MALDI). MALDI MS has been successfully used to study isolated membrane proteins (Cadene and Chait, 2000; Alves et al., 2007; Trimpin and Deinzer, 2007; Bechara et al., 2012; Marty et al., 2012; Fukuyama et al., 2016), as well as membrane macromolecular complexes (Kohler et al., 2018). However, there are only a few reports of membrane protein sequenced using MALDI in-source decay (MALDI-ISD). To date, MALDI-ISD has allowed the efficient sequencing of the C- and N-termini of several soluble proteins (Suckau and Resemann, 2003; Debois et al., 2013; Theberge et al., 2015). It has also been applied to successfully investigate post-translational modifications (PTMs) such as disulfide bonds, phosphorylation, and PEGylation (Ju, 2019). It is very effective to examine monoclonal antibodies (Abs). Importantly, MALDI-ISD allows confirmation of the Ab known sequence and identification of their PTMs (Ju, 2019). Interestingly, an intact 13.6-kDa camelid antibody has been de novo sequenced by MALDI-ISD (Resemann et al., 2010). To the best of our knowledge, literature has only illustrated the sequencing of membrane proteins up to 9 kDa (Meier-Credo et al., 2022; Suckau and Resemann, 2003; Debois et al., 2013; Theberge et al., 2015; Takayama, 2016). Using MALDI-ISD, specific fragmentation patterns are obtained by imparting excess energy to the sample during the desorption and ionization process (Biemann, 1988; Demeure et al., 2007; Suckau and Resemann, 2009; Debois et al., 2013). Recent reports on peptides indicate that MALDI-ISD is initiated by an electron transfer and then a subsequent proton transfer (Asakawa, 2020; Asakawa et al., 2022; Debois et al., 2013).
Sample preparation highly influences MALDI MS results (Beavis and Chait, 1996; Cohen and Chait, 1996; Cadene and Chait, 2000). Variants of an effective preparation called the “thin-layer method” (or the “overlayer method”) have been developed by several groups (Kussmann et al., 1997; Dai et al., 1999; Fenyo et al., 2007; Signor and Boeri Erba, 2013). In very simple terms, two different layers of matrix are used. First, 1) a microcrystal layer, known as a thin-layer (TL) or first-layer matrix, formed from a fast-evaporating solution, is placed on a MALDI probe. Then, 2) a second-layer matrix and a protein sample are (simultaneously or sequentially) deposited onto the first layer (Beavis and Chait, 1996; Dai et al., 1999; Signor and Boeri Erba, 2013). We are not aware of literature that systematically assessed sample preparations for ISD experiments. For instance, neither the role of TL nor the effect of vacuum to dry samples has been evaluated for sequencing.
Atomic force microscopy (AFM) is a scanning probe technique used to investigate the surface topography of specimens. It is based on rastering a nanosize tip over samples (Gross et al., 2009; Pleshakova et al., 2018; Teulon et al., 2018). Although it is a powerful tool to assess the quality of a MALDI sample preparation surface, AFM has been seldom used for this purpose (Takayama, 2002; Schiller et al., 2007). AFM imaging allows the three-dimensional characterization of the shapes of crystallized small molecules (such as the ones found on MALDI matrices) at nanometer resolution.
Herein, we report the sequencing of three membrane proteins up to 46 kDa using MALDI-ISD performed in reflector-positive ion mode. Our goal was to develop a procedure for sequencing membrane proteins. Before doing that, we carefully investigated the effect of variables that may influence the outcome of MALDI-ISD analyses, such as the type of matrix. To accomplish this, we used bovine serum albumin (BSA), which is considered a standard reference for protein sequencing. Next, we sequenced three membrane proteins that require detergents or other agents to be soluble in aqueous solutions. We decided to use either non-ionic detergents (e.g., DDM) or a high concentration of a chaotropic and denaturing agent (i.e., guanidinium chloride). Because these compounds highly interfere with protein ionization and fragmentation, it was necessary to perform a cleaning procedure before performing the MALDI-ISD experiments. Overall, we have demonstrated the feasibility of using MALDI-ISD to sequence membrane proteins larger than those previously sequenced and reported in the literature (Meier-Credo et al., 2022). The data presented here confirm that the optimization of sample preparation is critical for successful MALDI-ISD sequencing.
2 Materials and methods
2.1 Material
2,5-Dihydroxybenzoic acid (DHB), super-DHB (i.e., a 9:1 mixture of DHB and 2-hydroxy-5-methoxybenzoic acid) (sDHB), and α-cyano-4-hydroxycinnamic acid (CHCA) were used as matrices. The matrices, acetonitrile (ACN), trifluoroacetic acid (TFA), formic acid (FA), 1,4-dithiothreitol (DTT), dodecyl β-D-maltoside (DDM), and bovine serum albumin (BSA), were purchased from Sigma-Aldrich Chimie SARL (Saint Quentin Fallavier, France). All solvents and reagents were of the highest available purity and were used without further purification.
2.2 Purification of proteins
Stage III sporulation protein AF (SpoIIIAF) from Bacillus subtilis 168 was expressed in E. coli BL21 (DE3) cells as a translational fusion containing a poly-histidine tag (His6) and a SUMO cleavage site of the Ulp1 protease (His6-SUMO-SpoIIIAF). A volume of 2 liters of cultures was grown in Terrific Broth (BD Biosciences) at 37°C under agitation (180 RPM) to an optical density at 600 nm (OD 600 nm) of 0.8 and then cooled to 22°C until the OD 600 nm reached 1.5. Expression of the gene of interest was induced by the addition of 0.5 mM isopropyl-β-D-thiogalactoside (IPTG), and the cultures were further incubated at 22°C for 18 h. Cells were harvested by centrifugation (3,500 × g, 30 min, 4°C) and resuspended into a 1:50 volume of lysis buffer [50 mM Tris-HCl pH 8, 0.5 M NaCl, 25 mM imidazole, 10% glycerol, and cOmplete EDTA-free anti-protease cocktail (Roche)]. Mechanical lysis was performed using a microfluidizer, and the cell debris was pelleted by centrifugation (40,000 × g, 30 min, 4°C). The membranes were pelleted by ultra-centrifugation (100,000 × g, 1 h, 4°C), resuspended into 10 mL of lysis buffer containing 40 mM DDM, and incubated overnight at 4°C. Following ultra-centrifugation, the supernatant was loaded onto a 8 mL Ni-NTA superflow agarose-nickel resin (Qiagen). After an intensive wash with 10 column volumes of lysis buffer, the His6-SUMO-SpoIIIAF protein was eluted with a 0%–100% gradient of elution buffer (50 mM Tris-HCl pH 8, 0.3 M NaCl, 0.5 M imidazole, 10% glycerol, and 10 mM DDM) over eight column volumes. The eluted fractions were pooled and concentrated using Amicon centrifugation filter units. For mass spectrometry analysis, the His6-SUMO-SpoIIIAF sample was used at 10 uM in a buffer containing 50 mM Tris-HCl pH 8, 100 mM NaCl, 5 mM DDM, and 120 mM imidazole.
TIM23 was expressed and purified as described elsewhere (Sucec et al., 2020). Briefly, the gene coding for S. cerevisiae TIM23 containing three point mutations (C98S, C209S, and C213A) and a C-terminal His6-tag was cloned in the expression plasmid pET21b. The protein was expressed as inclusion bodies from BL21 (DE3) cells at 37°C during 1.5 h. After breaking the cells by sonication, the insoluble fraction was recovered, washed three times in lysis buffer (50 mM Tris-HCl pH 7.4 and 150 mM NaCl), and solubilized in Buffer D (50 mM Tris-HCl pH 7.4, 150 mM NaCl, and 4 M guanidinium chloride). The protein was then purified by affinity on a superflow Ni-NTA resin (Qiagen). Imidazole was removed by dialysis against Buffer D before concentrating the protein to 20 mg/mL (i.e., 823 uM) in the same buffer. The sample was diluted to 1:50 in 5% FA immediately before the MS analyses.
Nicotinamide adenine dinucleotide phosphate (NADPH) oxidase (NOX) was expressed and purified as previously described (Vermot et al., 2020). Membrane pellets were solubilized in 50 mM Tris-HCl (pH 7), 300 mM NaCl, 5 mM (0.5%) LMNG (NG310-MNG, Anatrace), and 10 mM FAD overnight at 4°C. After ultracentrifugation, the solubilized supernatant was loaded on an equilibrated HisTrap HP Prepacked Column (GE Healthcare). The protein was eluted with 0.025 mM LMNG and 300 mM imidazole. The elution peak was then loaded on a HiLoad 16/600 Superdex 200 column (GE Healthcare) previously equilibrated with 50 mM Tris (pH 7.0), 300 mM NaCl, and 0.025 mM LMNG.
2.3 Mass spectrometry
A commercial MALDI-time-of flight (TOF)/TOF mass spectrometer (Autoflex MAX, Bruker Daltonics, Bremen, Germany) was used for the measurements. In all our experiments, the masses of intact protein samples were first assessed by MALDI MS. The investigated proteins were then fragmented by MALDI-ISD. Ionization was achieved using a proprietary Bruker (Nd:YAG) 355 nm smartbeam™ II solid state laser (maximum frequency: 2 kHz). The laser energy was just above the threshold required for the formation of ions. The measurements of intact proteins were performed in linear positive ion mode using standard settings (Signor and Boeri Erba, 2013). The ISD experiments were performed in reflector positive ion mode, detecting the 1,000–6,000 m/z range. Each mass spectrum was the average of 10,000 laser shots randomly acquired from different sample areas. We used a Bruker AnchorChip™ plate as the target.
We tested several procedures to deposit samples on the MALDI plate. The different flowcharts are described in the following sections. In all cases, we deposited 0.6 μL of proteins of interest, which were obtained by dilutions or after purification using C4 Zip Tip™ columns (Millipore). Samples were diluted with 0.1% TFA solution. On a protein spot, we added 0.6 μL of a matrix (sDHB or DHB or CHCA or CHCA and DHB) as the final step. DHB and sDHB were prepared as saturated solutions in MilliQ water. CHCA (20 mg/mL) was dissolved in a solution containing ACN and 0.1% TFA, which were mixed in a 50:50 (vol/vol) ratio. Final solution concentration: 50% ACN and 0.05% TFA. When CHCA and DHB were mixed in a 1:1 ratio, we followed a published protocol (Signor and Boeri Erba, 2013). Briefly, 20 mg/mL CHCA solution was prepared in ACN and 5% FA (70:30, vol/vol). Final solution concentration: 70% ACN and 1.5% FA. DHB (20 mg/mL) was dissolved in ACN and 0.1% TFA (70:30, vol/vol). Final solution concentration: 70% ACN and 0.03% TFA. Then, the CHCA and DHB solutions were mixed in a 1:1 ratio.
When we utilized a thin layer (TL), the TL was prepared as a saturated solution of a matrix (sDHB, DHB, or CHCA) in acetone or in ACN. When we used a vacuum step, the target was placed under vacuum until the protein samples were dry before adding a second-layer matrix. The second-layer matrix was left to dry under the extractor hood at room temperature. We used two types of standard for external calibration according to the type of experiment. Next to the samples, we deposited 0.5 μL of a calibrant standard and then added 0.5 μL of the matrix solution. For measurements of intact protein masses, trypsinogen, Protein A and BSA were utilized to calibrate (i.e., Protein Standard II, Bruker Daltonics, Bremen). Fragments of BSA were the calibrant signals in the ISD experiments.
The ISD spectra of BSA with the highest sequence coverage were obtained using reduced BSA. Specifically, 100 μM protein was incubated with 1 mM DTT at 56°C for 40 min. Afterward, BSA was diluted in 0.1% TFA to obtain a 10 μM concentration. Regarding the BSA deposition (in the case of the best BSA spectra), first, 0.6 μL of TL prepared as saturated solution of sDHB in ACN was deposited on the MALDI plate. Then, 0.6 μL of 10 μM BSA was deposited on the TL, and a vacuum step dried the protein. Finally, 0.6 μL of second-layer matrix was added. The second-layer matrix was prepared as saturated solution of DHB in water. The second layer was allowed to dry under the extractor hood. In the case of SpoIII, the following protocol was used for the reverse-phase chromatography step. A 4 μL aliquot of the protein sample (10 μM) was mixed with 1 μL of 25% FA. Then, the sample was loaded on a C4 Zip Tip™ column and washed with 0.1% TFA. The sample was eluted with 3 μL of a solution containing ACN and 25% FA (66:33, vol/vol). Final solution concentration: 66% ACN and 8.25% FA. Sample concentration after elution: 13 μM. Further washing of the sample on the target using cold 0.1% TFA improved the crystallization of the second-layer matrix. In the case of TIM23, the following protocol was used for the reverse-phase chromatography step: 1 μL of protein sample (16 μM) was mixed with 1 μL of 0.1% TFA. Then, the sample was loaded on a C4 Zip Tip™ column and washed with 0.1% TFA. The sample was eluted with 3 μL of a solution containing ACN and 0.1% TFA (66:33, vol/vol). Final solution concentration: 66% ACN and 0.033% TFA. Sample concentration after elution: 5 μM. In the case of SpNOX, the following protocol was used: 2 μL of the protein sample (95 μM) were mixed with 2 μL of 0.1% TFA. Then, the sample was loaded on a C4 Zip Tip™ column and extensively washed with 0.1% TFA (using eight different droplets). The sample was eluted with 3 μL of a solution containing ACN and 0.1% TFA (66:33, vol/vol). Sample concentration after elution: 63 μM.
Regarding data analyses, the spectra of intact proteins and of sequenced proteins were processed using flexAnalysis™ (version 3.4), and the baselines of mass spectra were subtracted. No smooth was applied, and the TopHat Baseline Subtraction algorithm was used. In the case of ISD experiments, the Sophisticated Numerical Annotation Procedure (SNAP) detection algorithm was used for the identification of peaks. Using SNAP, we utilized a signal-to-noise ratio (S/N) threshold of 2 and a maximum number of 500 peaks detected. After this, the automatic labeling was applied, and we manually reviewed the peak labeling. Using flexAnalysis, we assessed the resolution at full width at half-maximum (FWHM) of three different peaks representing different m/z ranges. For BSA, the following ions were used: c10 (m/z 1,192.6), c20 (m/z 2423.2), and c30 (m/z 3514.8). The resolution values of the different peaks were plotted according to the type of TL and matrix used. To evaluate the sequence coverages according to the type of sample preparations, all the spectra were processed as previously described using flexAnalysis. Then, the spectra were sent to the software Biotools, which calculates the sequence coverage, taking into account c ions (for N-terminus fragmentation) and z and y ions (for C-terminus fragments). Sequence coverage is expressed as number of amino acids sequenced, taking into account ions with S/N < 2.
2.4 AFM imaging
BSA samples were directly deposited on AFM steel discs (Ted Pella, Redding, CA, United States). AFM images were recorded with the tapping mode in air using a commercial MultiMode 8 (Bruker, Santa Barbara, CA, United States) equipped with a nanoscope V controller. The imaging was performed in the repulsive regime with a ratio of A/A0 ∼ 50%. A triangular silicon nitride cantilever (DNP, lever A, Bruker AFM Probes, Camarillo, CA, United States) was used with the nominal characteristics: k = 0.35 N/m, Fq = 65 kHz, L = 120 μm, and a tip radius of 20 nm. All images were taken at a scan size of 10 µm or 20 µm with 512 pixels per line. Raw AFM images were not flattened, and stripe noise removal was not efficiently performed (Chen and Pellequer, 2011). Consequently, when exporting AFM images, a smoothing was performed using the median filter (3 px) of the software Gwyddion (Nečas and Klapetek, 2012).
3 Results
3.1 Sequencing BSA using different matrices
In all the experiments, the masses of intact protein samples were first assessed by MALDI MS. Then, the investigated proteins were fragmented by MALDI-ISD. We aimed to optimize the MALDI-ISD conditions. Therefore, we carefully investigated the effect of variables (e.g., type of matrix). To accomplish this, we used bovine serum albumin (BSA), which is considered a standard reference for protein sequencing. Regarding the measurements of intact BSA, the best results were obtained using a combination of DHB and CHCA, as previously shown (Signor and Boeri Erba, 2013) (Figure 1). Regarding the ISD analyses of BSA, we evaluated three different matrices: DHB, sDHB, and CHCA (Demeure et al., 2007). We tested TLs prepared in acetone and in ACN. Overall, we examined 32 combinations of TLs and matrices (Table 1; Figure 1). We used resolution and sequence coverage to evaluate the spectra (Supplementary Figure S1). Specifically, we assessed the resolution of three different peaks that were representative of distinct m/z ranges. They corresponded to the c10, c20, and c30 ions (see Materials and Methods, mass spectrometry). Data indicated that the resolution of peaks in the presence of a TL made of ACN was better than the resolution obtained by a TL made of acetone. We also evaluated the BSA sequence coverage according to the type of sample preparation. Different data sets were generated by analyzing untreated BSA and BSA treated with DTT (i.e., the reduced form of BSA). In the absence of DTT, the best sequence coverage of BSA was obtained when we utilized the following sample preparation 1) sDHB saturated solution in ACN (as a TL) and 2) DHB saturated solution in water as a second-layer matrix (Supplementary Table S1).
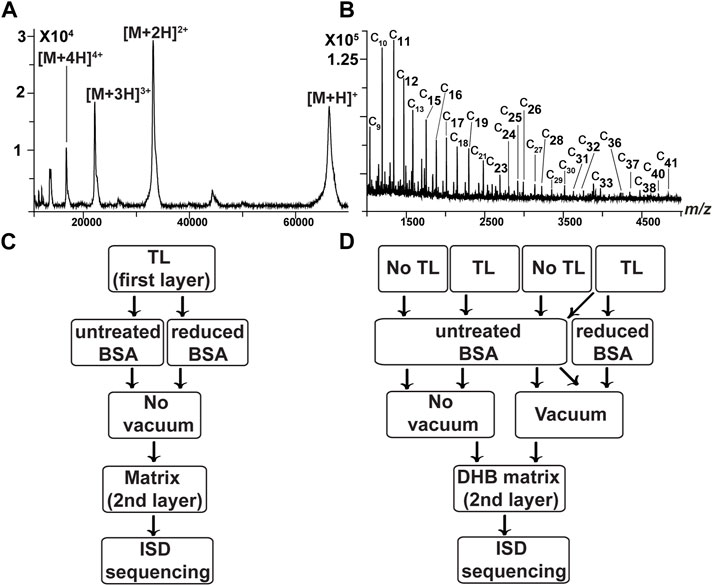
FIGURE 1. Spectra of BSA. (A) Spectrum of intact BSA using a combination of DHB and CHCA (Signor and Boeri Erba, 2013). There are signals of singly, doubly, triply, and quadruply charged BSA ions. (B) ISD spectrum of BSA after reduction of disulfide bridges (untreated with vacuum). Thin layer (TL, first-layer matrix): saturated solution of sDHB in ACN; second-layer matrix: saturated solution of DHB in water. For the simplicity of notation, only c ions are labeled. c9–c33 have a signal-to-noise ratio (S/N) > 2 (Supplementary Table S1). Signals are less intense than those in the spectrum treated with vacuum (see Supplementary Material). (C) Flowchart 1: we assessed three different matrices (DHB, sDHB, and CHCA) and their combination. Thin layers (TLs) are prepared in ACN or in acetone and deposited on the MALDI target. BSA (untreated and treated with DTT) is loaded onto the TL. The second-layer matrix is added to the samples. After all the “spots” are dried, measurements of intact mass and sequencing are performed. (D) Flowchart 2: we evaluated the role of TL and vacuum. For two samples, no TL is used. For three other samples, the TL (prepared in ACN) is deposited on the MALDI target. BSA samples are deposited on the metal target or on the TL. For two samples, no vacuum is used. In the case of three samples, a vacuum allows drying of the BSA. As the final step, the DHB matrix is added to the samples.
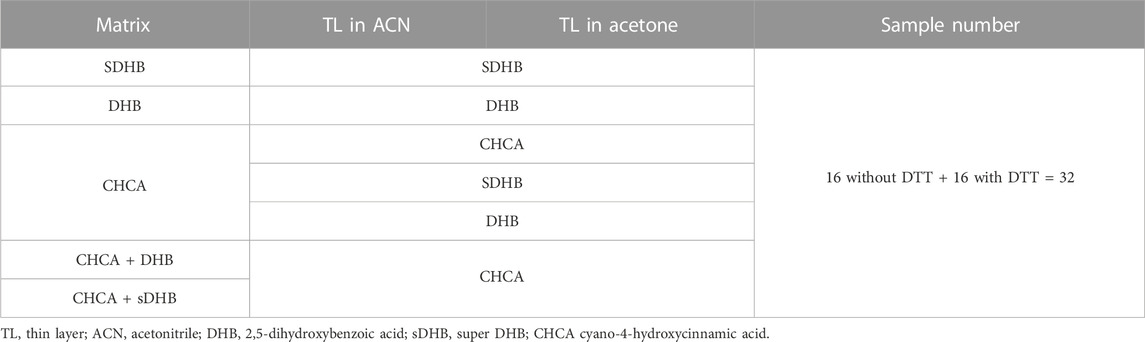
TABLE 1. Thirty-two conditions were tested to evaluate three different matrices (i.e., DHB, sDHB, and CHCA) and their combinations. The experiments were performed in the presence of TL made as a saturated solution of matrix in a) ACN or b) acetone. Each sample preparation was tested twice, before and after reduction of BSA using DTT. Reduction helped improve sequence coverage at the C-terminus. This is the list of all 32 samples. Even-numbered BSA samples were subjected to DTT-based reduction. 1) and 2) TL: saturated sDHB in ACN, second-layer matrix: sDHB in water. 3) and 4) TL: saturated sDHB in acetone, second-layer matrix: sDHB in water. 5) and 6) TL: saturated sDHB in ACN, second-layer matrix: DHB in water. 7) and 8) TL: saturated sDHB in acetone, second-layer matrix: DHB in water. 9) and 10) TL: saturated DHB in ACN, second-layer matrix: DHB in water. 11) and 12) TL: saturated DHB in acetone, second-layer matrix: DHB in water. 13) and 14) TL: saturated CHCA in ACN, second-layer matrix: CHCA in water. 15) and 16) TL: saturated CHCA in acetone, second-layer matrix: CHCA in water. 17) and 18) TL: saturated sDHB in ACN, second-layer matrix: CHCA in water. 19) and 20) TL: saturated sDHB in acetone, second-layer matrix: CHCA in water. 21) and 22) TL: saturated DHB in ACN, second-layer matrix: CHCA in water. 23) and 24) TL: saturated DHB in acetone, second-layer matrix: CHCA in water. 25) and 26) TL: saturated CHCA in ACN, second-layer matrix: CHCA + DHB in water. 27) and 28) TL: saturated CHCA in acetone, second-layer matrix: CHCA + DHB in water. 29) and 30) TL: saturated CHCA in ACN, second-layer matrix: CHCA + sDHB in water. 31) and 32) TL: saturated CHCA in acetone, second-layer matrix: CHCA + sDHB in water.
When we analyzed BSA after reduction of the disulfide bridges, the results indicated that DTT increased the efficiency of the fragmentation independently of the type of sample preparation. For instance, the results were very poor when we used CHCA in the absence of DTT. After DTT treatment, even CHCA samples provided better fragmentation results. Moreover, DTT helped to slightly increase the number of amino acids detected at the C-terminus (Supplementary Figure S1). For instance, only 16 amino acids were sequenced in the absence of DTT (using a TL made of sDHB in ACN and DHB as a second-layer matrix). In the presence of DTT, 26 C-terminal amino acids were detected. To explain these different behaviors, we examined the position of the disulfide bonds of the full-length BSA according to UniProt (Schnaible et al., 2002). A disulfide bridge of BSA is between Cys557 and Cys566 of the full-length BSA (i.e., Cys18 and Cys27, counting from the C-terminus). Therefore, we can hypothesize that DTT reduced this disulfide bridge and allowed the increase of the sequence coverage. No significant increment of amino acids detected at the N-terminus was assessed in the presence of DTT. When we examined the position of the disulfide bonds at the N-terminus, the first disulfide bridge was between Cys53 and Cys62 of BSA. Therefore, this bond is too distant from the N-terminus of BSA to influence the protein fragmentation by MALDI-ISD.
To our knowledge, sample preparations for ISD experiments have not been systematically assessed. For instance, Suckau and Resemann (2003) presented a comparison of ISD results using different matrices and a single type of sample preparation. In particular, proteins were mixed with a matrix solution (i.e., sinapic acid, DHB, and CHCA) in a 1:1 ratio and deposited into a stainless steel target. As far as we know, a few reports indicate the use of the reduction of disulfide bridges to successfully sequence peptides (Takayama and Tsugita, 2000) and proteins (Ju, 2019;Sakakura and Takayama, 2010). Excellent results were obtained using 1,5-diaminonaphthalene (1,5-DAN). However, 1,5-DAN is a carcinogen according to European regulation. Therefore, we did not test this matrix. We aimed to establish protocols that are reasonably safe. Overall, the use of ACN as a TL solvent (instead of acetone) improved the quality of our spectra. In terms of a second-layer matrix, the use of CHCA provided contradictory results, suggesting that a reduced reproducibility of the data obtained using this matrix. Therefore, we choose sDHB as the TL and DHB as the second-layer matrix.
3.2 Different sample preparations to optimize the sequencing of BSA: TL and vacuum
After evaluating three different matrices (i.e., DHB, sDHB, and CHCA), we focused our attention on sample preparation, such as the use of a TL. Moreover, we evaluated a vacuum step to dry the BSA after the protein deposition on the MALDI target and before depositing a second layer of matrix. We tested five different conditions (Table 2; Figure 1D). We sequenced BSA and evaluated how the sample preparation influenced the spectra in terms of resolution and sequence coverage (Supplementary Figure S2). Regarding the resolution, it appears that the vacuum plays a role in increasing the reproducibility of the fragmentation. Indeed, all three sample preparations that included a vacuum step generated similar results. Regarding sequence coverage, the highest coverage was obtained using TL, a vacuum step, and the reduction of disulfide bridges. It has been observed that the addition of a liquid sample on a TL may redissolve a small amount of matrix molecules of the TL (Dai et al., 1999). The dissolved matrix molecules recrystallize, better embodying the analyte. We may speculate that a vacuum may assist the desolvation of the analyte, increasing the homogeneity of BSA distribution and enhancing the reproducibility of the results.
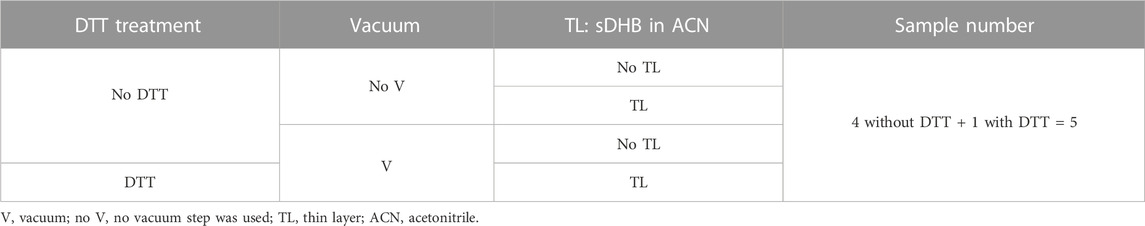
TABLE 2. Five sample preparations were investigated to assess the influence of TL and a vacuum step. These are the samples: 1) No DTT, no TL, no vacuum, matrix: DHB in water. 2) No DTT, TL: saturated sDHB in ACN, no vacuum, second-layer matrix: DHB in water. 3) No DTT, no TL, vacuum step to dry BSA deposited on TL, second-layer matrix: DHB in water. 4) No DTT, TL: saturated sDHB in ACN, vacuum step, second-layer matrix: DHB in water and 5) DTT reduction of BSA, TL: saturated sDHB in ACN, vacuum step, second-layer matrix: DHB in water.
3.3 Different BSA sample preparations studied by atomic force microscopy
Using AFM, we aimed to assess the impact of two different solvents (acetone and ACN) on the TL (in the absence of any sample). Moreover, we evaluated the influence of a vacuum step to dry the BSA (Figure 2; Supplementary Figure S3). First, we assessed whether the TL prepared using a saturated solution of sDHB in acetone was different from the TL prepared using the same matrix in ACN. Thus, we examined two different TLs (in the absence of BSA) using AFM (Table 3). Using a camera, we observed the TL in acetone, where heterogeneities of the surface were evident, and the surface looked rough (Supplementary Figure S3A). In the case of the TL in ACN, the surface looked uniform and smooth (Supplementary Figure S3B). AFM data confirmed that sDHB was more homogeneously distributed in ACN than in acetone (Supplementary Figure S3C, D). The key difference between the two TLs was the distinct degree of homogeneity.
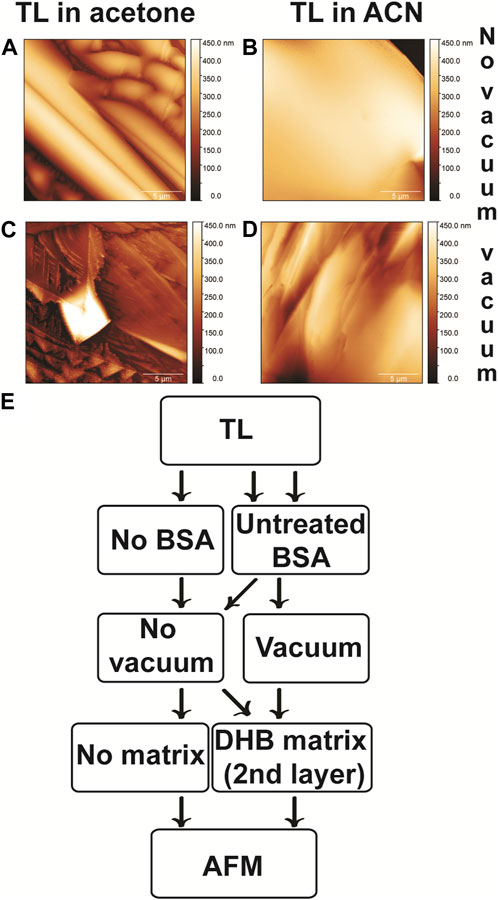
FIGURE 2. AFM images of BSA prepared without and with vacuum. Images on the left are samples whose thin layer (TL) was prepared in acetone. The TL of the samples on the right was prepared in ACN. sDHB was utilized as the TL crystallized on steel surfaces to form a first-layer matrix, and DHB was used as a second-layer matrix. (A,B) No vacuum was used. (A) Matrix crystals looked like needles when the TL was prepared in acetone. (B) When the TL was prepared in ACN, the sample looked smooth, and no needle shapes were detectable. (C–F) A vacuum was utilized to dry the BSA. (C,E) Images of BSA (prepared using TL in acetone and vacuum) examined at different magnifications. The matrix crystals had a pyramidal shape. (D,F) BSA samples (using TL in ACN and vacuum) observed at two different magnifications. No pyramidal shapes were detected. The vertical brown scale bars indicate the relative heights of the visualized structures. (G) Flowchart 3: these samples are prepared for AFM analyses. TLs were prepared in ACN or in acetone and deposited on steel. In the case of two steel plates, only TLs are observed. Therefore, no BSA is added, and no vacuum and no second-layer matrix are used. For four steel plates, BSA is deposited on the TL. For two samples, no vacuum is used. In the case of the two other samples, vacuum allows drying the BSA. The second-layer matrix is added on the BSA.
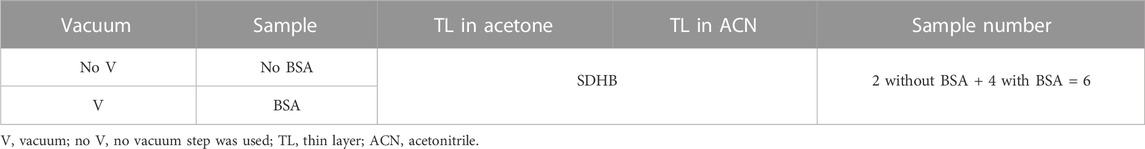
TABLE 3. Six conditions were analyzed by AFM. These samples were not subjected to disulfide bridge reduction. 1) TL: sDHB in acetone, no BSA, no vacuum, no second-layer matrix. 2) TL: sDHB in ACN, no BSA, no vacuum, no second-layer matrix. 3) TL: sDHB in acetone, BSA, no vacuum, second-layer matrix: DHB in water. 4) TL: sDHB in ACN, BSA, no vacuum, second-layer matrix: DHB in water. 5) TL: sDHB in acetone, BSA, vacuum, second-layer matrix: DHB in water. 6) TL: sDHB in ACN, BSA, vacuum, second-layer matrix: DHB in water.
Second, we observed BSA samples deposited on AFM grids in the absence of a vacuum (Figure 2). Specifically, we deposited a TL, and BSA was immediately added on the TL (i.e., no vacuum was used). After BSA deposition, a DHB matrix was added as a second-layer matrix. When the TL was prepared in acetone, AFM images indicated that the surface was heterogeneous, and matrix crystals were visible as needles (Figure 2A). When we analyzed BSA on TL prepared using ACN (Figure 2B), the sample appeared to be smooth, and no needle shapes were detectable. MALDI data indicated that the most homogenous sample provided the spectra with highest sequence coverage.
Third, we aimed to assess whether a vacuum step influenced the topological features of the specimens. We prepared two samples using a vacuum step to dry BSA before the addition of a second-layer matrix (Figures 2C, D). The two samples differed in the solvent of the TL. In the case of the TL in acetone (Figure 2C), AFM indicated that the matrix crystals had a defined pyramidal shape with sharp edges. When we compared the sample subjected to vacuum with the one untreated with vacuum (Figures 2C vs. Figure 2A), the matrix crystals presented different shapes [pyramidal shape (Figure 2C) vs. needle-like (Figure 2A)]. In the case of the TL in ACN, the sample subjected to vacuum was more irregular than the untreated samples (Figures 2D vs. Figure 2B). MALDI data indicated that the vacuum plays a role in increasing the reproducibility of the fragmentation.
Overall, observing MALDI samples by AFM provided topological information about the differences between the six samples. We correlate the topology of the samples with their performances in terms of resolution and sequence coverage. When a TL prepared in ACN and a vacuum step were used, the highest coverage was obtained. This sample appeared homogenous in the AFM images. In the past, AFM has been used to evaluate different isomers of DHB by Schiller et al. (2007). In particular, AFM allowed the assessment of distinct crystallization behaviors of DHB isomers in the absence and presence of lipids. Using a single layer of DHB dissolved in methanol, crystals of intermediate size (i.e., a few micrometers in size and less than a half-µm in height) were obtained and imaged by AFM (Schiller et al., 2007). In terms of shape, Schiller’s crystals markedly differ from those obtained by us (Schiller et al., 2007). Moreover, the addition of lipids to DHB substantially reduced the size of Schiller’s crystals. This reduction effect was not observed in our samples. After finishing our BSA tests, we sequenced three differently solubilized membrane proteins: stage III sporulation protein AF (SpoIIIAF), mitochondrial import inner membrane translocase subunit (TIM23), and nicotinamide adenine dinucleotide phosphate (NADPH) oxidase (NOX).
3.4 Sequencing the membrane protein SpoIIIAF using MALDI-ISD
SpoIIIAF is a membrane protein involved in the formation of dormant bacterial spores. Inferred from a sequence model and reported in the Universal Protein (UniProt) database, it appears that SpoIIIAF has two transmembrane domains (Supplementary Table S2). It was recombinantly expressed and solubilized using a non-ionic detergent (i.e., DDM, MW 510 Da). Its expected average mass is 35,876 Da (317 amino acids). When we analyzed the protein in linear-positive mode, we observed a main signal at ∼17 kDa and two low abundance signals at ∼15 kDa and 34 kDa (Figure 3A). The main peak may correspond to a truncated form of SpoIIIAF or to an unknown contaminant. We used MALDI-ISD to confirm one of our hypotheses and investigated two sample preparations (Table 4 and Supplementary Figure S4). In the MALDI-ISD spectra, we identified three sequence tags corresponding to residues TKNGQ, SA, and SKK (Figure 3B). These tags were part of the SpoIIIAF sequence, indicating that the main signal represents a truncated form of this protein. Considering that the intact mass was ∼17 kDa, the tags corresponded to specific ions (e.g., c11–c16) (Figure 3C; Supplementary Table S3). This shows that the truncated SpoIIIAF contains residues from 165 to 316 with a theoretical mass of 17,098 Da. Taking into account the structure prediction reported in UniProt, we did not sequence any of the predicted transmembrane domains. To confirm the correctness of our interpretation, we submitted the sequence of c37 ion (KTDPEVIFEYLTKNGQSESADIKNQINSKKIEIQASQ) to the Basic Local Alignment Search Tool (BLAST). The results indicated that this sequence belongs to SpoIIIAF from B. subtilis with 100% of identity. We also tested c9 (KTDPEVIFE), and the correct assignment of the SpoIIIAF was confirmed (100% of identity). Nine amino acids were sufficient to uniquely identify this membrane protein. Overall, the determination of the intact mass and the sequencing of SpoIIIAF provided important information with respect to the recombinant production of the protein. It will help improving cloning, expression, and purification steps to avoid the genesis of a truncated form and to obtain a pure, intact 36 kDa SpoIIIAF.
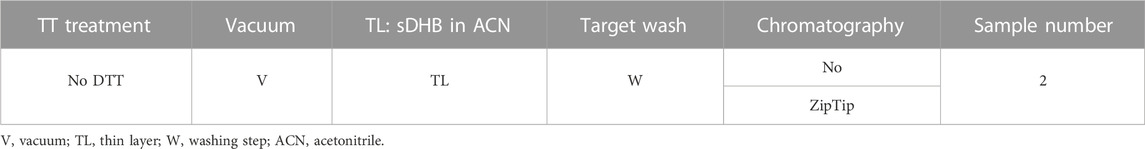
TABLE 4. Two sample preparations were used to analyze SpoIIIAF (that was solubilized in the presence of 5 mM DDM). We assessed reverse-phase chromatography to purify SpoIIIAF. The samples were subjected to a vacuum step and a wash step after the sample was deposited on the target.
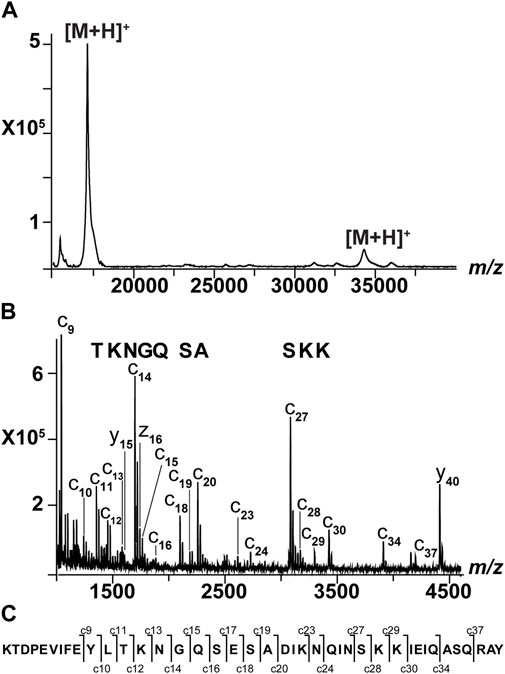
FIGURE 3. Sequencing of SpoIIIAF. (A) MALDI spectrum of intact SpoIIIAF acquired in linear-positive mode. This sample was not subjected to reverse-phase chromatography. It was diluted and subjected to sample deposition, as described previously (Signor and Boeri Erba, 2013). There is a main signal at 17,096 m/z and low-intensity signals at 15,392 m/z and 34,251 m/z. (B) MALDI-ISD spectrum of SpoIIIAF after no ZipTip purification (for abbreviations, see Materials in Supplementary Material). To interpret the data, we calculated mass differences between consecutive ions. This allowed determining the presence of three sequence tags corresponding to TKNGQ, SA, and SKK. The first tag was generated using peaks at m/z 1354, 1455, 1583, 1697, 1754, and 1882. The second tag was obtained by examining signals at m/z 2098, 2185, and 2256. The third tag was generated using the ions at m/z 3082, 3169, 3297, and 3425. The tags were present in the sequence of SpoIIIAF, corresponding to the c11–c16, c18–c20, and c27–c30 ions. ISD data confirmed that SpoIIIAF was truncated, corresponding to the following sequence: KTDPEVIFEYLTKNGQSESADIKNQINSKKIEIQASQRAYILEEMAVQLKKKAEERFSHDEYKVGRIKLTAGEKVDSEEDIKTISVYMAPSSEKTVQTVAPVHIDTDHAYVTKEAAEQKEKQIQTQLADIWEIGSEKITVHMEGESVGNE. (C) Amino terminal sequence of SpoIIIAF where c ions are shown.
3.5 MALDI-ISD analysis of TIM23
Next, we sequenced a membrane protein called TIM23 from Saccharomyces cerevisiae. It is involved in the translocation of presequence-containing mitochondrial protein precursors across the inner membrane of mitochondria. Structural investigation of TIM23 and other TIM proteins has been carried out using NMR spectroscopy, small-angle X-ray scattering (SAXS), MD simulations, and other approaches (Sucec et al., 2020). TIM23 was produced in inclusion bodies and purified under denaturing conditions in the presence of 4 M guanidinium chloride and 150 mM NaCl. Therefore, the high concentration of non-volatile salts (i.e., guanidinium chloride and NaCl) made the sample preparation crucial to successfully analyzing this biomolecule. First, we assessed the mass of intact TIM23 (230 amino acids) with and without applying a reverse-phase chromatography step (Table 5, Supplementary Figures S5, 6). A main signal with mass of 24.1 kDa could represent the protein without the first Met (average theoretical mass 24,178 Da, residues 2–230) (Figure 4A). This hypothesis was tested using MALDI-ISD. We tried different sample preparations to sequence TIM23. As opposed to the measurement of intact mass, only the TIM23 samples subjected to reverse-phase chromatography provided sequencing data. We detected 29 c ions, covering up to the first 42 amino acids (excluding the first Met) (Figures 4B, C). To our knowledge, there are no experimental data regarding whether the N-terminal part is a transmembrane region. In UniProt, it is predicted that the N-terminus may be inserted in the outer mitochondrial membrane. However, topology prediction software (such as Membrain 3.1) did not predict a N-terminal transmembrane domain (Supplementary Table S4). Therefore, we cannot indicate whether or not a transmembrane domain at the N-terminus was fragmented. Regarding the TIM23 C-terminal part, we obtained four z ions, up to z15 (corresponding to the amino acids 216–229). Software predicted that amino acids from 194 to 224 are part of a mitochondrial intermembrane domain. Therefore, the z ions we detected contain part of the transmembrane domain present at the C-terminus (KKRLLEKLE) (Supplementary Table S5). Overall, MALDI-ISD data confirmed that the main signal of 24 kDa was TIM23 without the first Met.
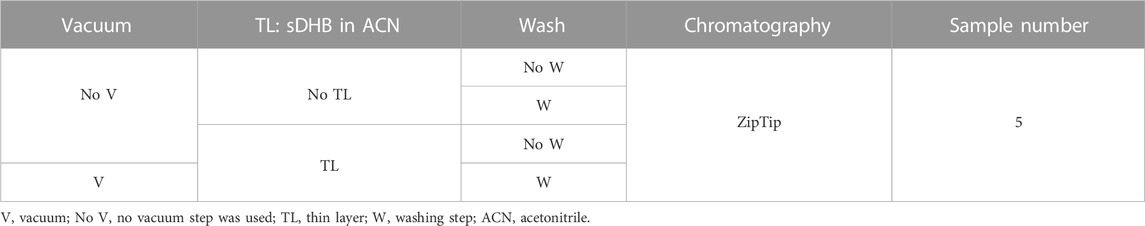
TABLE 5. Five sample preparations were used to sequence TIM23 (that was solubilized in the presence of 4 M guanidinium chloride) utilizing MALDI-ISD. We assessed the role of TL (sDHB in ACN), a vacuum step, and a wash step (using cold 0.1% TFA) after the sample was deposited on the target. All the samples were subjected to reverse-phase chromatography to purify the protein. Five conditions were analyzed: 1) no TL, no vacuum, matrix: DHB in water, no wash step. 2) No TL, no vacuum, matrix: DHB in water, wash step. 3) TL, no vacuum, second-layer matrix: DHB in water, no wash step. 4) TL, no vacuum, second-layer matrix: DHB in water, wash step. 5) TL, vacuum, second-layer matrix: DHB in water, wash step.
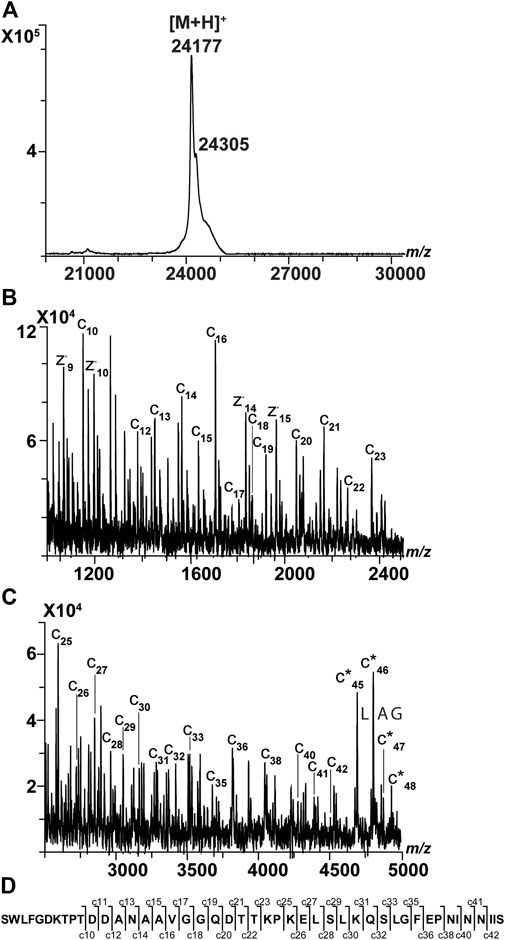
FIGURE 4. Sequencing results of TIM23. (A) MALDI spectrum of intact TIM23. A main signal at m/z 24,177 could represent the protein without the first Met (average theoretical mass 24,178 Da, residues 2–230). A peak shoulder at m/z 24,305 corresponded to the expected mass of intact TIM23. (B) MALDI-ISD spectrum of TIM23 analyzed using TL, after ZipTip purification, a vacuum step, and a wash step of the sample using 0.1% TFA. The range shown is 1,000–2500 m/z. The c ions indicated that the TIM23 had lost its first Met. (C) MALDI-ISD spectrum of TIM23 (same sample as described previously), whose range is 2500–5,000 m/z. Taking into account the ions at m/z 4691, 4804, 4875, and 4932 and their mass difference, a tag was generated corresponding to LAG. This suggested that these four peaks corresponded to a truncated form that had lost the first 15 amino acids. The ions corresponded to c*45, c*46, c*47, and c*48 (TIM23 residues 16–230, theoretical average mass: 22,629 Da). (D) Amino terminal sequence of TIM23 where c ions are shown. For additional information, see Supplementary Table S8.
3.6 MALDI-ISD analysis of SpNOX
We sequenced a membrane protein called NOX from Streptococcus pneumonia (SpNOX). It is a model enzyme with oxidoreductase activity (Vermot et al., 2020; Vermot et al., 2021). Studying the structure and function of this prokaryotic NOX could provide novel insights into eukaryotic NOX enzymes. Recently, a low-resolution structure of the entire SpNOX has been published (Vermot et al., 2020). The small-angle neutron scattering (SANS) data integrated with molecular modeling revealed a SpNOX structure that is less compact than the structure predicted from joining homologous crystal structures of separate transmembrane and dehydrogenase domains. Inferred from a sequence model and reported in the UniProt database, it appears that SpNOX has six transmembrane domains at the N-terminus (Supplementary Table S6). It was recombinantly expressed and solubilized using a non-ionic detergent (i.e., LMNG). Its expected average mass is 46,526 Da (404 amino acids). We purified SpNOX using reverse-phase chromatography (Supplementary Figure S6). We analyzed the protein in linear positive mode and observed a main signal at ∼46 kDa (Figure 5). When we sequenced SpNOX, there were very high signals from the detergent in the range 1,000–1700 m/z. Therefore, we acquired ISD spectra from 1760 m/z and from 1900 m/z (Supplementary Figure S7). Even though signals that could be attributed to the detergent remained, we could interpret the spectra. We obtained seven c ions (Supplementary Table S7). These ions contain the entire first transmembrane domain (SVKGLLFIIASFILTLLTWM). Nine y ions were also generated. They do not contain any transmembrane domain. There were three groups of consecutives ions (e.g., c16–c20), and nine amino acids could be sequenced. Among these amino acids, we identified the unique sequences FIIA and KIQKA. All these data fully confirmed that the N- and C-termini of SpNOX are intact.
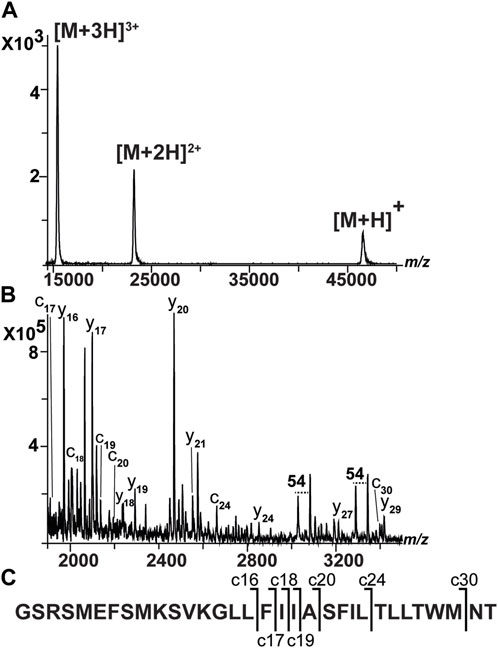
FIGURE 5. Spectra of NOX. This sample was subjected to reverse-phase chromatography. (A) MALDI spectrum of intact NOX acquired in linear-positive mode. There are main signals at 46575 m/z (singly charged) and doubly and triply charged ions (Signor and Boeri Erba, 2013). (B) MALDI-ISD spectrum of NOX. Spectrum acquired from 1900 m/z to reduce the presence of signals from detergents. However, LMNG signals are still present, and they can be identified as double signals with a 54 m/z difference (C) Amino terminal sequence of NOX where c ions are shown.
3.7 Conclusion and prospective
We aimed to optimize sequencing by MALDI MS. First, we investigated key parameters using the reference protein BSA. MALDI-ISD and AFM results indicate that the solvent used for TL (either acetone or ACN) affects the sequencing and topological features of samples. The main difference between the two TLs was their degree of homogeneity, which was higher using ACN. This may be due to the different physicochemical properties of the two solvents (Supplementary Table S8). We used sDHB as the TL and DHB as the second-layer matrix. In the future, other matrices could be tested for sequencing membrane proteins [e.g., 1,5-dihydroxynaphthalene (1,5-DHN) and 5-amino-1-naphthol (5,1-ANL) have been successfully used for MALDI-ISD experiments on peptides (Asakawa et al., 2022)].
Next, we aimed to go beyond the current limits of membrane protein sequencing. Membrane proteins with mass smaller than 9 kDa have previously been sequenced (Meier-Credo et al., 2022). We sequenced three membrane proteins with masses up to 46 kDa. Membrane proteins require detergents or other agents to be soluble in aqueous solutions. It can be very laborious to identify optimal detergent conditions. We used either a non-ionic detergent (i.e., DDM and LMNG) or a chaotropic and denaturing agent (i.e., guanidinium chloride). Because these compounds highly interfere with protein ionization and fragmentation, it was necessary to perform a cleaning procedure before performing the MALDI-ISD experiments. Our data confirm that the optimization of MALDI results is sample-dependent (Cohen and Chait, 1996; Cadene and Chait, 2000). Protein concentration and buffer composition have a high impact on the MALDI results. Based on our experience, samples should be prepared using reverse chromatography in the presence of guanidinium chloride and LMNG. Indeed, LMNG interferes so strongly that it was necessary to start m/z acquisition from values larger than usual (e.g., 1760 m/z instead of the usual 1,000 m/z, Supplementary Figure S7).
Using MALDI-ISD, we sequenced the N- and C-termini of three different membrane proteins (Supplementary Tables S3, 5, 7). This may not be considered high sequence coverage. Bottom-up proteomics may provide higher sequence coverage, but key information would be lost. For example, a full characterization of truncated forms or other proteoforms cannot be performed by bottom-up proteomics (Smith et al., 2013). Therefore, intact mass measurements and top-down MS gain importance (Lermyte et al., 2019). MALDI-ISD is part of top-down MS. There are some outstanding top-down studies of membrane proteins based on ESI-MS (Ro et al., 2019; Brown et al., 2020; Cohn et al., 2021). Sample preparation prior to MS analysis of membrane proteins is indeed challenging and labor-intensive. Therefore, additional straightforward methods for the MS-based sequencing of membrane proteins (such as MALDI-ISD) are necessary. Moreover, MALDI-ISD provides singly charged fragment ions. Fragmentation generated by MALDI-ISD differs from that obtained by other methods (such as CID). It occurs uniformly across a protein without any preference for more fragile peptide bonds (Ju, 2019). Therefore, it provides unambiguous “ladders of amino acids” (Supplementary Tables S1, 3, 5, 7). Overall, MALDI-ISD sequencing well integrates ESI-based methods. MALDI-ISD is a method of protein fragmentation without isolation of parent ions. This means that MALDI-ISD is limited to relatively pure samples (e.g., two different proteoforms). An attractive method is MALDI post-source decay (PSD), which is also called the “T3 method” in the case of Bruker instruments. MALDI PSD allows isolation of fragments to further fragment them. Therefore, more complex samples can be investigated. In the future, we wish to use PSD to overcome issues of sensitivity.
Membrane proteins differ from soluble ones in their ability to be inserted into biological membranes. For this reason, they present a high degree of hydrophobicity. The hydrophobic features of membrane proteins may influence their fragmentation by MALDI-ISD. The structure of matrix crystals is important for the ISD fragmentation (Asakawa et al., 2013). Crystals of DHB matrices have no major hydrophobic domains (Strupat and Horneffer, 1997). Therefore, incorporation of membrane proteins into a matrix crystal may be different from the incorporation of soluble ones. This may affect the efficiency of the ISD fragmentation (Asakawa et al., 2013). The examples reported herein show more ions coming from the non-transmembrane regions than from the transmembrane parts. Further work will assess whether hydrophobic domains, which are normally buried within a lipid bilayer, influence MALDI-ISD fragmentation.
To conclude, we demonstrated the feasibility of using MALDI-ISD to sequence membrane proteins up to 46 kDa. Overall, the presented work is momentous because sequencing membrane proteins allows the characterization of these challenging biomolecules. These proteins are crucial players in many cellular events and potential drug targets. Fragmentation patterns shed light on identity, sequences [e.g., loss of first amino acid (often a Met), annotation errors, and mutations], modifications, and crucial information, such as the position of unexpected truncation.
Data availability statement
The data presented in the study are deposited in the Mendeley Data repository, accession number DOI: 10.17632/w6ztvpjhhx.1.
Author contributions
EZS, HH, JH, EM, J-LP, IP-H, and EBE designed the research. EZS, HH, JH, EM, EB, J-MT, IP-H, and EBE performed the research. EZS, EM, J-LP, and EBE wrote the manuscript with contributions from HH, JH, J-MT and IP-H. All authors contributed to the article and approved the submitted version.
Funding
This work used the platforms of the Grenoble Instruct-ERIC center (ISBG; UAR 3518 CNRS-CEA-UGA-EMBL) within the Grenoble Partnership for Structural Biology (PSB), supported by FRISBI (ANR-10-INBS-0005–02) and GRAL, financed within the University Grenoble Alpes Graduate School (Ecoles Universitaires de Recherche) CBH-EUR-GS (ANR-17-EURE-0003). This work was supported by the Agence National de la Recherche (ANR-17-CE11-0031).
Acknowledgments
The authors thank Luca Signor, Agneta Kiss, Claudio Medana, and Bhavika Advani for helpful discussion. The authors thank Cécile Morlot for supplying the protein SpoIIIAF and Beate Bersch for TIM23. The authors thank Frank Fieschi for providing spNOX. The authors also thank the AFM platform at the IBS. The authors thank François Di Franco for his help performing the AFM experiments. The authors are grateful to Juan C. Fontecilla-Camps and Martine Cadene for the critical reading of the manuscript. IBS acknowledges integration into the Interdisciplinary Research Institute of Grenoble (IRIG, CEA).
Conflict of interest
The authors declare that the research was conducted in the absence of any commercial or financial relationships that could be construed as a potential conflict of interest.
Publisher’s note
All claims expressed in this article are solely those of the authors and do not necessarily represent those of their affiliated organizations, or those of the publisher, the editors, and the reviewers. Any product that may be evaluated in this article, or claim that may be made by its manufacturer, is not guaranteed or endorsed by the publisher.
Supplementary material
The Supplementary Material for this article can be found online at: https://www.frontiersin.org/articles/10.3389/frans.2023.1124741/full#supplementary-material
References
Alves, I. D., Sachon, E., Bolbach, G., Millstine, L., Lavielle, S., and Sagan, S. (2007). Analysis of an intact G-protein coupled receptor by MALDI-TOF mass spectrometry: Molecular heterogeneity of the tachykinin NK-1 receptor. Anal. Chem. 79 (6), 2189–2198. doi:10.1021/ac062415u
Arinaminpathy, Y., Khurana, E., Engelman, D. M., and Gerstein, M. B. (2009). Computational analysis of membrane proteins: The largest class of drug targets. Drug Discov. today 14 (23-24), 1130–1135. doi:10.1016/j.drudis.2009.08.006
Asakawa, D., Calligaris, D., Smargiasso, N., and De Pauw, E. (2013). Ultraviolet laser induced hydrogen transfer reaction: Study of the first step of MALDI in-source decay mass spectrometry. J. Phys. Chem. B 117 (8), 2321–2327. doi:10.1021/jp311464k
Asakawa, D., Hosokai, T., and Nakayama, Y. (2022). Experimental and theoretical investigation of MALDI in-source decay of peptides with a reducing matrix: What is the initial fragmentation step? J. Am. Soc. Mass Spectrom. 33 (6), 1011–1021. doi:10.1021/jasms.2c00066
Asakawa, D. (2020). Ultraviolet-laser-induced electron transfer from peptides to an oxidizing matrix: Study of the first step of MALDI in-source decay mass spectrometry. J. Am. Soc. Mass Spectrom. 31 (9), 1918–1926. doi:10.1021/jasms.0c00186
Beavis, R. C., and Chait, B. T. (1996). Matrix-assisted laser desorption ionization mass-spectrometry of proteins. Methods Enzym. 270, 519–551. doi:10.1016/s0076-6879(96)70024-1
Bechara, C., Bolbach, G., Bazzaco, P., Sharma, K. S., Durand, G., Popot, J. L., et al. (2012). MALDI-TOF mass spectrometry analysis of amphipol-trapped membrane proteins. Anal. Chem. 84 (14), 6128–6135. doi:10.1021/ac301035r
Biemann, K. (1988). Contributions of mass spectrometry to peptide and protein structure. Biomed. Environ. mass Spectrom. 16 (1-12), 99–111. doi:10.1002/bms.1200160119
Brown, K. A., Tucholski, T., Alpert, A. J., Eken, C., Wesemann, L., Kyrvasilis, A., et al. (2020). Top-down proteomics of endogenous membrane proteins enabled by cloud point enrichment and multidimensional liquid chromatography-mass spectrometry. Anal. Chem. 92 (24), 15726–15735. doi:10.1021/acs.analchem.0c02533
Cadene, M., and Chait, B. T. (2000). A robust, detergent-friendly method for mass spectrometric analysis of integral membrane proteins. Anal. Chem. 72 (22), 5655–5658. doi:10.1021/ac000811l
Chen, S. W., and Pellequer, J. L. (2011). DeStripe: Frequency-based algorithm for removing stripe noises from AFM images. BMC Struct. Biol. 11, 7. doi:10.1186/1472-6807-11-7
Cohen, S. L., and Chait, B. T. (1996). Influence of matrix solution conditions on the MALDI-MS analysis of peptides and proteins. Anal. Chem. 68 (1), 31–37. doi:10.1021/ac9507956
Cohn, W., Huguet, R., Zabrouskov, V., and Whitelegge, J. (2021). Dissociation strategies to maximize coverage of α-helical domains in top-down mass spectrometry of integral membrane proteins. J. Am. Soc. Mass Spectrom. 32 (6), 1380–1387. doi:10.1021/jasms.1c00031
Dai, Y., Whittal, R. M., and Li, L. (1999). Two-layer sample preparation: A method for MALDI-MS analysis of complex peptide and protein mixtures. Anal. Chem. 71 (5), 1087–1091. doi:10.1021/ac980684h
Debois, D., Smargiasso, N., Demeure, K., Asakawa, D., Zimmerman, T. A., Quinton, L., et al. (2013). MALDI in-source decay, from sequencing to imaging. Top. Curr. Chem. 331, 117–141. doi:10.1007/128_2012_363
Demeure, K., Quinton, L., Gabelica, V., and De Pauw, E. (2007). Rational selection of the optimum MALDI matrix for top-down proteomics by in-source decay. Anal. Chem. 79 (22), 8678–8685. doi:10.1021/ac070849z
Duran, A. M., and Meiler, J. (2018). Computational design of membrane proteins using RosettaMembrane. Protein Sci. a Publ. Protein Soc. 27 (1), 341–355. doi:10.1002/pro.3335
Fenyo, D., Wang, Q., DeGrasse, J. A., Padovan, J. C., Cadene, M., and Chait, B. T. (2007). MALDI sample preparation: The ultra thin layer method. J. Vis. Exp. JoVE. (3), 192. doi:10.3791/192
Fukuyama, Y., Nakajima, C., Izumi, S., and Tanaka, K. (2016). Membrane protein analyses using alkylated trihydroxyacetophenone (ATHAP) as a MALDI matrix. Anal. Chem. 88 (3), 1688–1695. doi:10.1021/acs.analchem.5b03700
Gross, L., Mohn, F., Moll, N., Liljeroth, P., and Meyer, G. (2009). The chemical structure of a molecule resolved by atomic force microscopy. Science 325 (5944), 1110–1114. doi:10.1126/science.1176210
Hellwig, N., Peetz, O., Ahdash, Z., Tascon, I., Booth, P. J., Mikusevic, V., et al. (2018). Native mass spectrometry goes more native: Investigation of membrane protein complexes directly from SMALPs. Chem. Commun. (Camb) 54 (97), 13702–13705. doi:10.1039/c8cc06284f
Ju, Y. (2019). Applications of matrix-assisted laser desorption ionization in-source decay mass spectrometry. Adv. Exp. Med. Biol. 1140, 45–54. doi:10.1007/978-3-030-15950-4_3
Kar, U. K., Simonian, M., and Whitelegge, J. P. (2017). Integral membrane proteins: Bottom-up, top-down and structural proteomics. Expert Rev. proteomics 14 (8), 715–723. doi:10.1080/14789450.2017.1359545
Kohler, M., Neff, C., Perez, C., Brunner, C., Pardon, E., Steyaert, J., et al. (2018). Binding specificities of Nanobody*Membrane protein complexes obtained from chemical cross-linking and high-mass MALDI mass spectrometry. Anal. Chem. 90 (8), 5306–5313. doi:10.1021/acs.analchem.8b00236
Kussmann, M., Lassing, U., Sturmer, C. A., Przybylski, M., and Roepstorff, P. (1997). Matrix-assisted laser desorption/ionization mass spectrometric peptide mapping of the neural cell adhesion protein neurolin purified by sodium dodecyl sulfate polyacrylamide gel electrophoresis or acidic precipitation. J. mass Spectrom. JMS 32 (5), 483–493. doi:10.1002/(SICI)1096-9888(199705)32:5<483::AID-JMS502>3.0.CO;2-J
Lermyte, F., Tsybin, Y. O., O'Connor, P. B., and Loo, J. A. (2019). Top or middle? Up or down? Toward a standard lexicon for protein top-down and allied mass spectrometry approaches. J. Am. Soc. Mass Spectrom. 30 (7), 1149–1157. doi:10.1007/s13361-019-02201-x
Martin J, A. S., and Sawyer, A. (2019). Tech news. BioTechniques 66 (4), 167–170. doi:10.2144/btn-2019-0030
Marty, M. T., Das, A., and Sligar, S. G. (2012). Ultra-thin layer MALDI mass spectrometry of membrane proteins in nanodiscs. Anal. Bioanal. Chem. 402 (2), 721–729. doi:10.1007/s00216-011-5512-3
Meier-Credo, J., Preiss, L., Wullenweber, I., Resemann, A., Nordmann, C., Zabret, J., et al. (2022). Top-down identification and sequence analysis of small membrane proteins using MALDI-MS/MS. J. Am. Soc. Mass Spectrom. 33 (7), 1293–1302. doi:10.1021/jasms.2c00102
Melby, J. A., Roberts, D. S., Larson, E. J., Brown, K. A., Bayne, E. F., Jin, S., et al. (2021). Novel strategies to address the challenges in top-down proteomics. J. Am. Soc. Mass Spectrom. 32 (6), 1278–1294. doi:10.1021/jasms.1c00099
Nečas, D., and Klapetek, P. (2012). Gwyddion: An open-source software for SPM data analysis. Cent. Eur. J. Phys. 10, 181–188. doi:10.2478/s11534-011-0096-2
Pham, M. D., Yu, S. S., Han, C. C., and Chan, S. I. (2013). Improved mass spectrometric analysis of membrane proteins based on rapid and versatile sample preparation on nanodiamond particles. Anal. Chem. 85 (14), 6748–6755. doi:10.1021/ac400713g
Pleshakova, T. O., Bukharina, N. S., Archakov, A. I., and Ivanov, Y. D. (2018). Atomic force microscopy for protein detection and their physicoсhemical characterization. Int. J. Mol. Sci. 19 (4), 1142. doi:10.3390/ijms19041142
Prados-Rosales, R. C., Aragoneses-Cazorla, G., Estevez, H., Garcia-Calvo, E., Machuca, A., and Luque-Garcia, J. L. (2019). Strategies for membrane protein analysis by mass spectrometry. Adv. Exp. Med. Biol. 1140, 289–298. doi:10.1007/978-3-030-15950-4_16
Resemann, A., Wunderlich, D., Rothbauer, U., Warscheid, B., Leonhardt, H., Fuchser, J., et al. (2010). Top-down de Novo protein sequencing of a 13.6 kDa camelid single heavy chain antibody by matrix-assisted laser desorption ionization-time-of-flight/time-of-flight mass spectrometry. Anal. Chem. 82 (8), 3283–3292. doi:10.1021/ac1000515
Ro, S. Y., Schachner, L. F., Koo, C. W., Purohit, R., Remis, J. P., Kenney, G. E., et al. (2019). Native top-down mass spectrometry provides insights into the copper centers of membrane-bound methane monooxygenase. Nat. Commun. 10 (1), 2675. doi:10.1038/s41467-019-10590-6
Sakakura, M., and Takayama, M. (2010). In-source decay and fragmentation characteristics of peptides using 5-aminosalicylic acid as a matrix in matrix-assisted laser desorption/ionization mass spectrometry. J. Am. Soc. Mass Spectrom. 21 (6), 979–988. doi:10.1016/j.jasms.2010.01.018
Schiller, J., Suss, R., Fuchs, B., Muller, M., Petkovic, M., Zschornig, O., et al. (2007). The suitability of different DHB isomers as matrices for the MALDI-TOF MS analysis of phospholipids: Which isomer for what purpose? Eur. biophysics J. EBJ 36 (4-5), 517–527. doi:10.1007/s00249-006-0090-6
Schnaible, V., Wefing, S., Resemann, A., Suckau, D., Bucker, A., Wolf-Kummeth, S., et al. (2002). Screening for disulfide bonds in proteins by MALDI in-source decay and LIFT-TOF/TOF-MS. Anal. Chem. 74 (19), 4980–4988. doi:10.1021/ac025807j
Signor, L., and Boeri Erba, E. (2013). Matrix-assisted laser desorption/ionization time of flight (MALDI-TOF) mass spectrometric analysis of intact proteins larger than 100 kDa. J. Vis. Exp. JoVE. (79), 50635. doi:10.3791/50635
Smith, L. M., and Kelleher, N. L. and Consortium for Top Down Proteomics (2013). Proteoform: A single term describing protein complexity. Nat. methods 10 (3), 186–187. doi:10.1038/nmeth.2369
Strupat, K. K. J., and Horneffer, V. (1997). Investigations of 2,5-DHB and succinic acid as matrices for UV and IR MALDI. Part II: Crystallographic and mass spectrometric analysis. Int. J. Mass Spectrom. Ion Process. 169-170, 43–50. doi:10.1016/S0168-1176(97)00225-5
Sucec, I., Wang, Y., Dakhlaoui, O., Weinhaupl, K., Jores, T., Costa, D., et al. (2020). Structural basis of client specificity in mitochondrial membrane-protein chaperones. Sci. Adv. 6 (51), eabd0263. doi:10.1126/sciadv.abd0263
Suckau, D., and Resemann, A. (2009). MALDI Top-Down sequencing: calling N- and C-terminal protein sequences with high confidence and speed. J. Biomol. Tech. 20 (5), 258–262.
Suckau, D., and Resemann, A. (2003). T3-sequencing: Targeted characterization of the N- and C-termini of undigested proteins by mass spectrometry. Anal. Chem. 75 (21), 5817–5824. doi:10.1021/ac034362b
Sun, J., Kulandaisamy, A., Liu, J., Hu, K., Gromiha, M. M., and Zhang, Y. (2023). Machine learning in computational modelling of membrane protein sequences and structures: From methodologies to applications. Comput. Struct. Biotechnol. J. 21, 1205–1226. doi:10.1016/j.csbj.2023.01.036
Takayama, M., and Tsugita, A. (2000). Sequence information of peptides and proteins with in-source decay in matrix assisted laser desorption/ionization-time of flight-mass spectrometry. Electrophoresis 21, 1670–1677. doi:10.1002/(SICI)1522-2683(20000501)21:9<1670::AID-ELPS1670>3.0.CO;2-N
Takayama, M. (2016). MALDI in-source decay of protein: The mechanism of c-ion formation. Mass Spectrom. (Tokyo) 5 (1), A0044. doi:10.5702/massspectrometry.A0044
Takayama, M. (2002). The characteristics of in-source decay in mass spectrometric degradation methods -Hydrogen-Attachment dissociation (HAD). J. Mass Spectrom. Soc. Jpn. 50 (216), 337–349. doi:10.5702/massspec.50.337
Teulon, J. M., Godon, C., Chantalat, L., Moriscot, C., Cambedouzou, J., Odorico, M., et al. (2018). On the operational aspects of measuring nanoparticle sizes. Nanomater. (Basel) 9 (1), 18. doi:10.3390/nano9010018
Theberge, R., Dikler, S., Heckendorf, C., Chui, D. H., Costello, C. E., and McComb, M. E. (2015). MALDI-ISD mass spectrometry analysis of hemoglobin variants: A top-down approach to the characterization of hemoglobinopathies. J. Am. Soc. Mass Spectrom. 26 (8), 1299–1310. doi:10.1007/s13361-015-1164-4
Trimpin, S., and Deinzer, M. L. (2007). Solvent-free MALDI-MS for the analysis of a membrane protein via the mini ball mill approach: Case study of bacteriorhodopsin. Anal. Chem. 79 (1), 71–78. doi:10.1021/ac0607919
Vermot, A., Petit-Hartlein, I., Breyton, C., Le Roy, A., Thepaut, M., Vives, C., et al. (2020). Interdomain flexibility within NADPH oxidase suggested by SANS using LMNG stealth carrier. Biophys. J. 119 (3), 605–618. doi:10.1016/j.bpj.2020.06.025
Keywords: membrane proteins, sequencing of proteins, mass spectrometry, matrix-assisted laser desorption ionization mass spectrometry in-source decay, atomic force microscopy, sample preparation
Citation: Zhamungui Sánchez E, Hijazi H, Haidar J, Mecarelli E, Bauda E, Petit-Härtlein I, Teulon J-M, Pellequer J-L and Boeri Erba E (2023) Sequencing intact membrane proteins using MALDI mass spectrometry. Front. Anal. Sci. 3:1124741. doi: 10.3389/frans.2023.1124741
Received: 15 December 2022; Accepted: 20 June 2023;
Published: 13 July 2023.
Edited by:
Tara Louise Pukala, University of Adelaide, AustraliaReviewed by:
Prashant Jethva, Washington University in St. Louis, United StatesKevin J. Zemaitis, Pacific Northwest National Laboratory (DOE), United States
Copyright © 2023 Zhamungui Sánchez, Hijazi, Haidar, Mecarelli, Bauda, Petit-Härtlein, Teulon, Pellequer and Boeri Erba. This is an open-access article distributed under the terms of the Creative Commons Attribution License (CC BY). The use, distribution or reproduction in other forums is permitted, provided the original author(s) and the copyright owner(s) are credited and that the original publication in this journal is cited, in accordance with accepted academic practice. No use, distribution or reproduction is permitted which does not comply with these terms.
*Correspondence: Elisabetta Boeri Erba, ZWxpc2FiZXR0YS5ib2VyaS1lcmJhQGlicy5mcg==