Gender effects of project assessment: Evidence from a market simulation
 Karl Aquino
 Momo Deretic
  John Ries
- Sauder School of Business, University of British Columbia, Vancouver, BC, Canada
We investigate how males and females perform as entrepreneurs and traders using information on the trading activities of students participating in a business game in two university courses. In one course, students create entrepreneurial ventures that they pitch to their peers. These students are issued securities of all the ventures and trade in a simulated market based on information revealed in the classroom pitches. In the second course, students trade these ventures in a separate simulated market but do not see pitches and trade based on anonymized written information about the ventures. We measure student performance as entrepreneurs by the traded prices of their proposed ventures in the online market and performance as traders by the value of their closing portfolios. In the course where traders observe the sales pitches of the entrepreneurial teams, we find that both male and female traders buy and sell at lower prices when the female share of the venture team increases. Females buy at higher prices and sell at lower prices than males and end up with lower portfolio values than males. None of these results obtain in the course where trading is based on the same information delivered in written and anonymized form and the gender composition of the venture teams is not known. These findings provide insight on how the assessment and performance of tomorrow's business leaders is affected by environments involving direct sales pitches.
1. Introduction
Is it more difficult for female entrepreneurs to secure funding for their proposed ventures? There is an extensive literature examining this question and the findings are mixed. In a meta-analysis of 370 studies, Geiger (2020) does not find systematic gender differences regarding success at receiving funding. Focusing on capital from private equity investors, Becker-Blease and Sohl (2007) find that male and female entrepreneurs have an equal probability of receiving investment. Papers that reveal differences in access to venture capital include (Hebert, 2018) who uses French data and established that female-founded start-ups are 25–35% less likely to receive equity financing from external investors, although these differences disappear in certain industries. On the other hand, Johnson et al. (2018) and Gafni et al. (2021), studies on crowdsourcing using data from Kickstarter, find that females have higher success rates at raising funds. Geiger and Oranburg (2018), however, observe the opposite effects for equity crowdfunding. Some studies reveal same-gender bias in the allocation of funding. Ewens and Townsend (2020) find robust evidence of it in three stages of the seed-stage startup financing process. Gafni et al. (2021) reveal that same-gender bias in the backing of projects on Kickstarter whereas (Becker-Blease and Sohl, 2007) find same-gender bias in securing funding from angel investors.
We contribute to the literature on gender effects in entrepreneurial funding by examining how university students assess each others' projects in classroom market simulations. We evaluate project assessment in two courses. In one course, students play two roles: 1) In small teams, they create entrepreneurial ventures and pitch the idea to the class and 2) They are all issued securities in each venture and trade the securities in an online, simulated market. Students know the identities and demographic characteristics of the entrepreneurs as they periodically pitch their ideas through classroom presentations. Since we know the gender composition of the teams and the gender of the traders, we are able to investigate overall effects and same-gender interactions. We compare the results in these markets to those emerging from a slightly different market simulation in a separate academic course where the same entrepreneurial projects are traded but trading is based on written information without any live presentations. Since the gender composition of the entrepreneurial teams is unknown in these markets, we would not expect gender effects unless there were gender differences in the quality of the entrepreneurial ventures. While these classroom simulations are not targeted to allocating investment funds per se, the markets have implications about the likelihood of receiving funding: Ventures that trade at high prices in the market are highly appraised and would be more likely to receive funding.
We compile a number of interesting findings. In the course featuring pitch sessions, venture success is negatively related to the proportion of females (i.e., share) on the entrepreneurial team. Both males and females discount female ventures by trading at lower prices when the female share of the venture increases. Females tend to buy at higher prices and sell at lower prices than males in this market and end up with lower portfolio values than males. In the course with only written information about ventures, there is no statistically significant relationship between female share and price and no gender effect in trader performance. These results may suggest that direct interaction between students is detrimental to female performance.
Our results are relevant to gender performance and equality in a number of real-world competitive settings. The most direct application is to venture capital since our experimental markets simulate interactions between entrepreneurs and investors. However, teams are evaluated in other important settings. Teams within organizations routinely pitch ideas and strategies. For example, the ideas of R&D teams are evaluated by peers and senior managers. Small business owners seeking bank financing must demonstrate the financial viability of their ventures. Business commonly involves teams having their ideas evaluated by peers.
Since the students we study are exposed to a common educational environment and they are similar in ability and skills, our setting mitigates potential confounding effects associated with the heterogeneity in the quality of real-world entrepreneurial projects. By analyzing student assessments of entrepreneurial ventures, our data allow us to examine if gender bias may influence the assessments of individuals who will become future venture capitalists and business leaders.
Other research has also investigated how gender composition affects team performance of students playing a business game, but these studies differ from ours in important dimensions. Apesteguia et al. (2012) analyze student team performance in an online business simulation game. Teams of three students play the role of a general manager of a beauty-industry company and make decisions related to R&D, brand management, and corporate responsibility initiatives. Teams compete against three simulated companies (not against each other) and their performance reflects their decisions as expressed by a stock price index. They find that teams comprised of three women were outperformed by all other gender combinations. Our study differs in that students create their own firms, there is peer review of performance, and one of our games features live presentations to investors. Hoogendoorn et al. (2013) also evaluate a student business game to investigate how team gender composition affects performance. In this game, teams set up and manage a small sized company for an entire academic year. The teams were supported by a coach from the business world as well as a professor. The ventures were real businesses that were funded by shareholders (usually the students themselves or their friends and relatives.) Venture sales and profits were the performance metrics in their study. They find that teams with an equal gender mix performed better than male-dominated teams. One limitation of their study is that they were not permitted to assign students to teams that would be comprised of members of only one gender or where only one person of a particular gender would be represented. Hence, the were unable to test how teams made exclusively of males or females would perform relative to mixed teams. Their study also differs from ours by examining teams who were supported by a coach and professor and performance does not reflect the assessment of their peers.
To the extent that the live venture pitches in one course create a highly competitive environment, our study relates to papers suggesting that interactions with males in competitive environments is detrimental to female performance. Brooks et al. (2014) show that females perform relatively poorly to males in competitive tournaments whereas (Backus et al., forthcoming) find that women obtain significantly worse outcomes against equally able, male opponents in expert chess tournaments. Shurchkov (2012), however, shows that female performance is not compromised in competitive settings where there are only moderate time constraints. Ivanova-Stenzel and Kübler (2011) identify settings where a competitive environment reduces the difference in the relative performance of females and males.
While it could be the competitive environment of pitching ventures in a classroom setting is detrimental to female performance, it could also result if pitches from female teams are judged relatively poorly. Brooks et al. (2014) find that otherwise identical entrepreneurial venture pitches are better received when the voice-over narrator is male. In our study, any preference for pitches by males is shared by both male and female traders.
We provide details about the simulated trading markets and summarize the data in the next section. Section 3 reports on the results of the analysis and the final section summarizes the results and discusses their implications.
2. Business game design
The data used in this study are derived from a business game used in two courses for 4th-year business majors at a leading public university in Canada: New Enterprise Development (NED) and Strategic Management (SM). The activity provides students with experiential learning. All the sections included in this study were taught by one of the coauthors.
In NED, students play two roles. First, as part of a team of students, they act as entrepreneurs pitching a new venture. The students were allowed to form their own teams. There were three presentations spread across the course covering content such as value proposition, business model, technology, market potential, and financial projections. In their second role, students are given an initial portfolio of securities of the proposed new ventures and buy and sell these securities in the online market. They receive identical initial portfolios consisting of 2,000 shares of each venture proposed by the student entrepreneurial teams (including shares of their own venture) along with an initial cash balance equal to $1000 times the number of ventures.
The SM course does not have ventures but students are given information on the ventures being developed in an NED course and trade on this information. The information reflected the instructor's written summary of what each venture team provided in their NED presentations and SM traders received information at different points in time throughout the course. The written information did not reveal the identities of the venture team1. The online trading market operated analogously to the one in NED.
Students were instructed that prices of traded securities reflect probabilities of success, thus each security should trade at an upper bound of 1 and the lower bound of 0.01. They were told that their portfolios would be evaluated at the prices set by experts, volunteers from the business community who observed the final presentations in NED and assigned a probability of success for each venture2. Since these are fictitious projects, there is no actual outcome regarding their commercial success3. Instructing students that the expert scores are the outcomes gives them a concrete metric to consider when choosing trading prices. Students earn a reward based on final portfolio value4. Trading, therefore, is based on whether traders viewed the prices as reflecting the true probability of success as ultimately measured by expert scores. Of course, portfolio values are maximized by selling securities with prices above the true probability of success and buying when prices are below the true probability.
Students traded using an online proprietary trading platform. Instructions on how to use the trading software were posted and reviewed in class. The simulation operated as a continuous double auction. Students log into the online market and trade (buy and sell shares of projects) at any time using any browser. On average, the markets ran about 60 days. Students could post a buy or sell offer with an associated price. Then other traders could either accept the posted offers, completing the trade, or allow them stay outstanding (unfilled)5. Trading with oneself and short selling were not allowed. Students initially set the prices based on preliminary information about the start up projects, and later based on the information from the team presentations and on the other posted prices in the market. Typically, the trading was most active after the arrival of new information delivered in the presentations. Prices tended to be highest in initial trading.
A panel of experts was brought in at the end of the course to hear the team final pitches and participate in Q&A. This final presentation occurred after the end of the term and the closure of the online market and was distinct from the three pitches delivered during the course. The experts score the probabilities of success of students' start-up projects. The experts came from local VC and entrepreneurial community. The panel would typically have three members, one female and two males. The experts were given clear written and oral instructions in terms of scoring probabilities6. These probability scores were later used by the instructor to calculate the value of students closing portfolios and payoffs.
Students enroll in a section of the NED and SM courses and separate market simulations were conducted in each section. We evaluate market outcomes for sections offered from 2011 to 2019. As shown in Table 1, there are 81 venture teams across 10 sections of NED with a total of 338 student participants. Each of these teams pitched an entrepreneurial venture. 539 students were enrolled in 15 different sections of SM. In these simulations, the students were evaluating the ventures developed by NED students7.

Table 1. Simulation markets.
Table 2 reveals that across the two courses, there is roughly an even gender split: 429 females and 448 males. The female share is lower in NED (42%) than in SM (53%). If NED, a course with live sales pitches to an audience, is a more competitive environment than SM, a mainly business-case course, this sorting is consistent with research showing that females shy away from competition (see Niederle and Vesterlund, 2007).
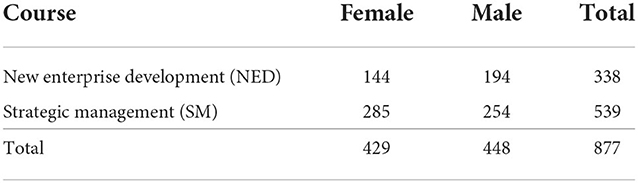
Table 2. Gender breakdown.
Figure 1 shows the distribution of the sizes of the teams. Team sizes range from 2 to 6 with most teams (71 out of 81) having four or five students. There are eight teams of three and one team each of two and six. As portrayed in Figure 2, the gender composition of teams varies significantly, 13 out of the 81 teams had no females and 8 had no male members. There were 10 teams with an equal gender split. The female share of the teams pitching the entrepreneurial ventures is a key variable in the analysis. The correlation between team size and female share is low, –0.06.
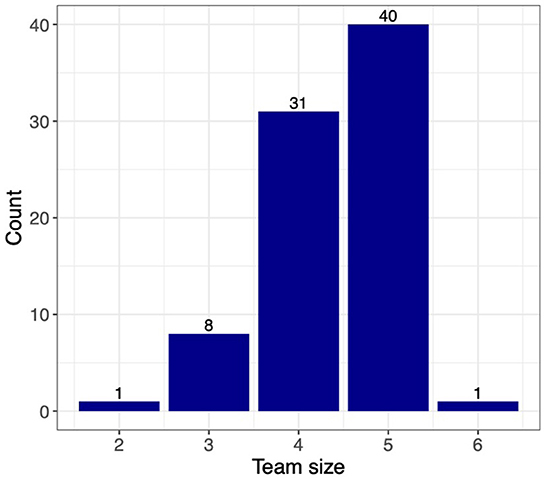
Figure 1. Team sizes.
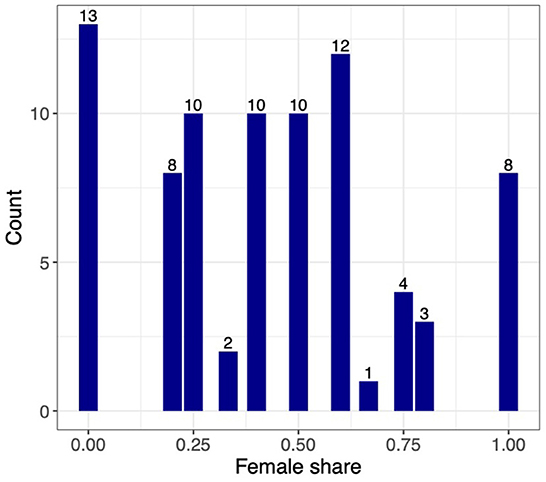
Figure 2. Female shares of teams.
3. Empirical results
We begin by analyzing how the ventures were evaluated with respect to the gender composition of the team pitching the venture. We then report how trader success varies by gender.
3.1. Team success
We investigate the relationship between gender diversity and team success. Our measure of success is the traded price of the venture's security in the market. A high trading price indicates success of the entrepreneurial team pitching the venture as market prices should reflect the probability that the venture will be successful.
We estimate the following specification:
where Pthj is the transaction price for trade t of security (venture) h in market j, fshrhj denotes the female share of team h, and Dj is a fixed effect for market j8. We weight the observations according to the number of shares traded to allow for more weight on larger transactions9. Standard errors allow for clustering at the venture h level. The R2 in all specifications includes variation captured by the fixed effects.
Table 3 shows how the female share of the venture team influences transaction prices. Panel A displays results for the New Enterprise Development (NED) course and Panel B show results for Strategic Management (SM). Columns (1) and (2) of the table show the effect of the female share of the team on prices of sales (“Sell”) and purchases (“Buy”). In principle, since someone's purchase is someone else's sale, the two columns should have the same number of observations and estimated coefficients. They are slightly different because some students traded under names that could not be matched to the student records. Because we utilize student records to identify gender, we dropped transactions where the student could not be identified. The results in the columns (1) and (2) are very similar as observations for “Sell” and “Buy” vary only slightly.
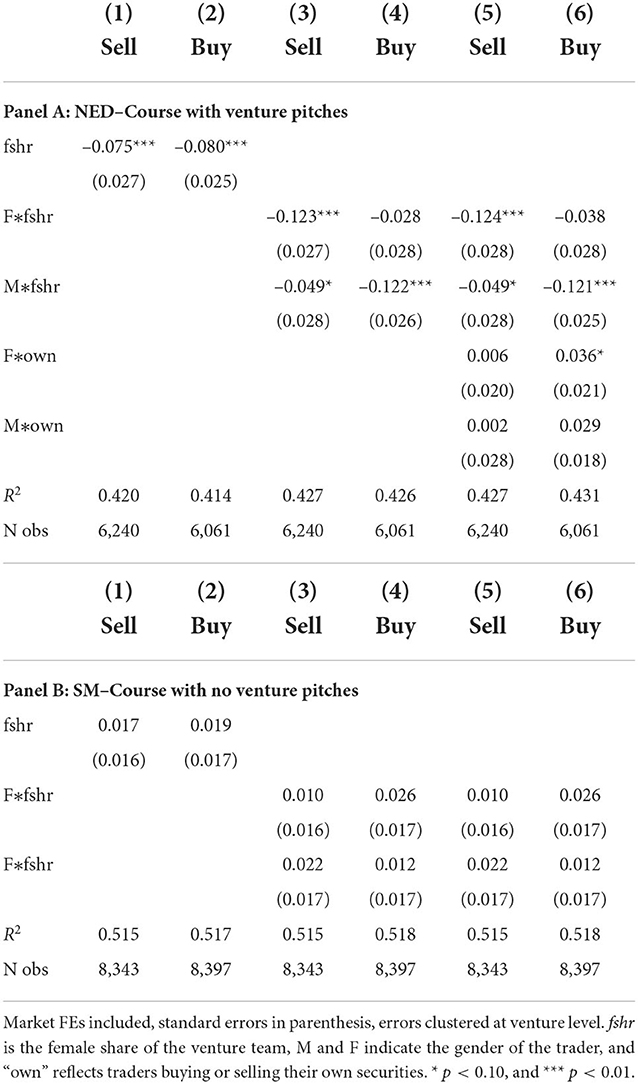
Table 3. Venture price and the female share the team.
We observe that female share has a highly significant negative relationship to venture prices in the NED course (columns 1 and 2 of Panel A) and an insignificant relationship in the SM course (Panel B)10. Recall, the teams pitch ventures in NED but SM trades are based on anonymized, written information. The magnitude of the effect of the venture female share on traded prices in NED is large. The average price of a transaction is 0.43 in NED. The –0.075 estimate for fshr in column (1) implies that an all female venture would transact at an 17% lower price than an all male venture. Since the same set of ventures are considered in both courses, the difference may be attributable to traders observing team presentations in NED, whereas the SM students trade solely based on an information sheet11.
The specifications in columns (3) and (4) allow the female share variable to have different effects depending on gender of the trader though an interaction between trader gender and fshr. Here the“Sell” and “Buy” results need not be the same because of the interaction with trader gender. The notable result we observe is the negative relationship between prices and female share for NED obtains for both male and female traders. The insignificant relationship in SM holds for both genders. The last columns add a variable identifying trading one's own security in NED (traders are not entrepreneurs in SM and thus there is no trading of own securities in this course). These trades are conducted at higher prices but only significantly so in the case of female purchases in NED.
An alternative to running separate regressions for each course is stacking the observations from the two courses and allow the coefficient on the female share to have separate effects when the course is SM or NED. Since all the specifications include separate fixed effects for each market in each class, separate fshr coefficients, and we cluster at the venture level, both specifications produce the same results. In a specification with stacked observations, we could allow for a common effect and a differential effect in one of the courses to get a direct test of statistical difference between the impact of fshr in the two courses. The results that the estimate effect of the female share in prices in NED is negative and significant whereas the effect in SM is slightly positive and insignificant, suggest the difference between the two coefficients is significant, a result we have confirmed.
Figure 3 displays the estimate effects for different groupings of the venture teams–all male, mostly male, split, mostly female, and all female. We show results for “Buy” transactions and the results are very similar for “Sell” transactions. In the specifications, the reference (omitted) group is teams with all males. The bars indicate the 95% confidence interval of the estimate. The results are very consistent with those in Table 3: there are no significant relationships in SM but the prices of teams with large shares of females trade at lower prices in NED. In the latter market, prices are lowest for ventures with all female members (coefficient of –0.075). We observe the securities of teams with the same number of females and males (“Split”) have significantly lower prices than those of all male teams. We note that our result for gender-balanced teams differs from that of Hoogendoorn et al. (2013) who find that these teams perform better than male dominated ones.
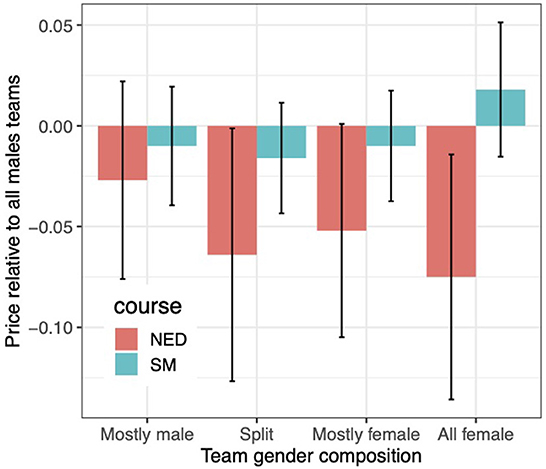
Figure 3. Separate effects for groupings of female share (omitted group all male teams).
Our next exercise investigates differences in what genders pay for the same securities. Our specification employs venture fixed effects and an indicator for female. Since the omitted category is males, the indicator variable captures differences in the prices transacted by female trader relative to males. Table 4 indicates that females buy at higher prices and sell at lower prices than males in NED. The magnitude of the differences in NED is large: The estimates for NED in columns (1) and (2) indicate that females buy the average security at 10% higher prices than males and sell at 10% lower prices. In SM, we observe that females buy at higher prices but the magnitude is small relative to NED. Selling prices in SM do not vary in a significant way across gender.
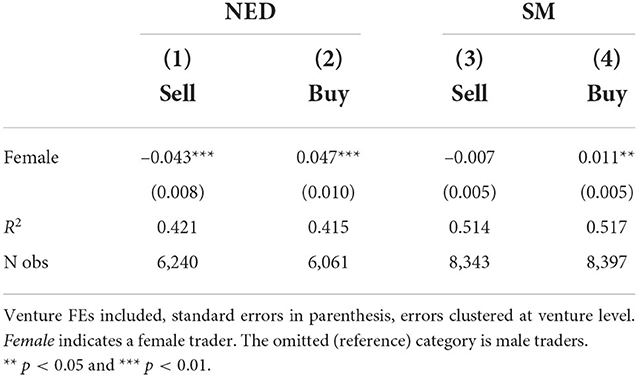
Table 4. Prices.
We also evaluate the ending portfolio balances of traders. Recall that traders are initially allocated a common number of shares (2,000) of each venture. At the end of the simulation, trading will result in students holding varying amounts of securities and cash. In our balances regression, we control for student fixed effects and investigate whether within-student holding of securities of female teams varies by gender. If there were same-gender bias, we would expect to see females holding female securities and males holding male securities. Column (1) of Table 5 suggests this is the case in NED. However, column (2) indicates this apparent same gender bias actually reflects an endowment effect in NED. Adding a variable indicating the security is one's own renders the coefficient on female share insignificant whereas the coefficients on own security are large and significant for both genders. Females and males end up owning 1,317 and 2,023 more shares of their own security than other securities. Since traders do not know the female share of venture teams in SM, we would not expect to see a relationship between portolio holdings and the female share of the venture team and column (3) in Table 5 reveals this to be the case.
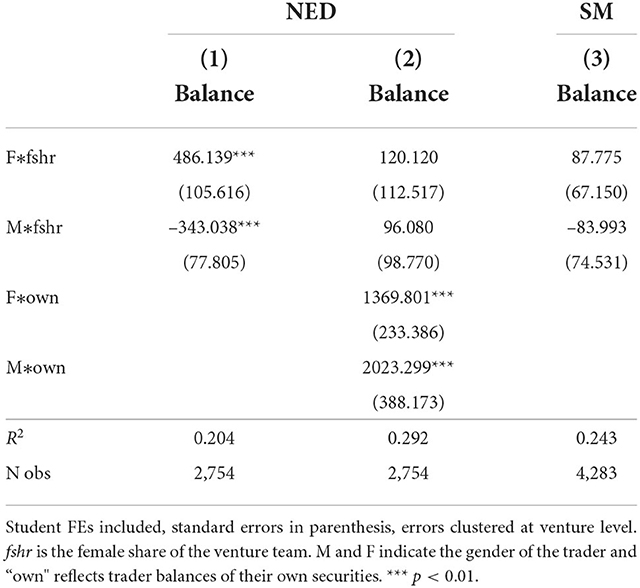
Table 5. Ending security balances.
3.2. Investor success
The result that females buy at higher prices and sell at lower prices in NED suggest they will do worse than males in terms of ending portfolio balances. Portfolio value is calculated as
where PVij is the portfolio value of trader i in market j, sharesijv are the ending share balances of venture v, and Pjv is the price of venture v. We calculate alternative portfolio values based on actual trading prices and the expert scores. The market-price based measures are shares-traded-weighted average prices over different time intervals:
1. P_all: The weighted average price across all transactions.
2. P_half: The weighted average price across transactions during the second half of the course.
3. P_q4: The weighted average price across transactions during the last quarter of the course.
We also use the experts' scores (Expert) to value the security. Expert scores were constructed to sum to one and are on average lower than the trading prices (that on average sum to 4). We generate Expert2 that scales up Expert to achieve the same mean as the average price of the security (P_all above).
Tables 6, 7 shows the summary statistics and correlations of the different price measures. All three trading-price measures had similar means and standard deviations with prices fall slightly over time (mean price of 0.444, 0.434 and 0.427 for all, second half, and last quarter transactions) and the spread slightly increasing. Expert has a mean of 0.124 as it sums to one across ventures whereas Expert2's mean matches P_all by construction.
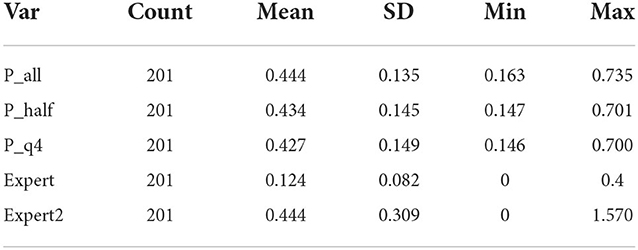
Table 6. Price statistic.
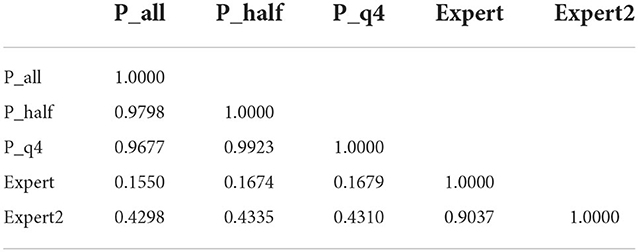
Table 7. Price correlation.
The market-based prices are highly correlated, greater than 0.96 correlation, indicating prices adjust quickly to their equilibrium levels and change little over time. The correlation of Expert to market prices is much lower, about 0.16. Rescaling to generate Expert2 results in a measure more highly correlated to average prices (about 0.43). The correlation between Expert and P_all is 0.20 in NED and 0.12 in SM.
Table 8 shows that the portfolio values of females are significantly lower than that of males in NED but not SM. This makes sense recalling that Table 4 shows that females bought at higher prices and sold at lower prices than males in NED. The lower portfolio values for females are slightly over 10% below the average portfolio values in that course. The low R2 in the specification where we value portfolios at expert prices (column 1) is attributable to the experts' scores being constructed to sum to one—there is very little variation in average portfolio values across markets for the market fixed effects to capture compared to portfolios at valued market prices with average prices varying considerably across markets.
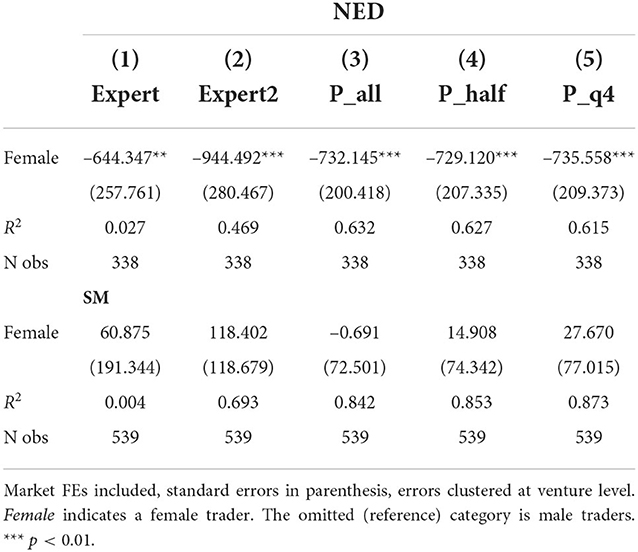
Table 8. Portfolio values.
To investigate whether females were less active traders, we regress transactions on a female indicator variable. Because the number of transactions is highly right skewed (ranging from one to 449), we take the log of the number of trades. The results are reported in Table 9 where the first two columns are results for all trades and the last two for trades where at least 25 share were exchanged in regression with and without market fixed effects. The results reveal no significant differences across males and females in either course.
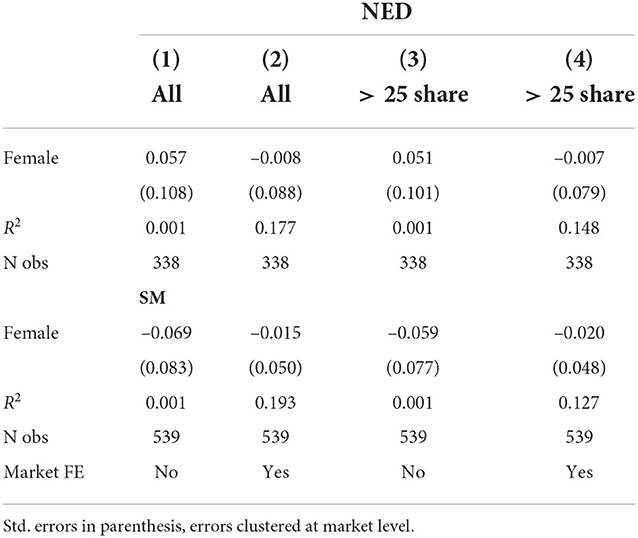
Table 9. Number of transactions.
4. Conclusion
We investigate the performance of students as entrepreneurs and traders in two courses, New Entrerprise Development (NED) and Strategic Management (SM). Venture performance is measured by prices of venture securities in simulated, online markets and trader performance is measured by closing portfolio values. NED featured live presentations by venture teams on their entrepreneurial ideas. In SM, traders only received written information on the ventures with identities anonymized.
Stark contracts emerge. In NED, females performed less well in two dimensions: their ventures trade at lower prices and they end up with lower portfolio values than males. Both males and females assess ventures of female teams less favorably. The lower portfolio value is attributed to females buying at higher prices and selling at lower prices than men. These results do not obtain in SM.
While our data do not allow us to identify the reason why the results in the courses are different, a key difference in the courses is that NED involves direct sales pitches that reveal team identity whereas students in the SM course receive anonymized information associated with the ventures created in NED. The result that female share is unrelated to prices in SM suggests that projects developed by teams with high shares of females were not systematically worse than those of predominately male teams.
An explanation for the differing results could be that both male and female traders evaluate pitches by females less favorably. While this may explain the variation in how venture teams are evaluated, it does not explain why females are less successful as traders in NED. A speculative hypothesis that explains relatively low female performance as entrepreneurs and traders is that NED is a more competitive environment than SM and this causes females to perform less well than males in both capacities. We acknowledge that the two courses differ in other dimensions besides presentations—for example, NED has higher shares of males and these traders are trading their own securities in that course—and we cannot pin down the exact reason for our results.
Since the university students we study will become business leaders, our findings are informative for understanding how they might differentially evaluate the performance of male and female entrepreneurs under certain conditions.
Data availability statement
The raw data supporting the conclusions of this article will be made available by the authors, without undue reservation.
Ethics statement
The studies involving human participants were reviewed and approved by Ethics Approval from UBC Behavioural Research Ethics Board, H20-03223. Written informed consent for participation was not required for this study in accordance with the national legislation and the institutional requirements.
Author contributions
All authors listed have made a substantial, direct, and intellectual contribution to the work and approved it for publication.
Acknowledgments
We thank two reviewers for thoughtful and helpful comments.
Conflict of interest
The authors declare that the research was conducted in the absence of any commercial or financial relationships that could be construed as a potential conflict of interest.
Publisher's note
All claims expressed in this article are solely those of the authors and do not necessarily represent those of their affiliated organizations, or those of the publisher, the editors and the reviewers. Any product that may be evaluated in this article, or claim that may be made by its manufacturer, is not guaranteed or endorsed by the publisher.
Supplementary material
The Supplementary Material for this article can be found online at: https://www.frontiersin.org/articles/10.3389/frbhe.2022.1015626/full#supplementary-material
Footnotes
1. ^See Appendix A for additional details and a sample of the written information on ventures provided to traders in SM.
2. ^Appendix A contains the written instructions given to traders. These instructions were reiterated in class.
3. ^We note that 3–4 projects did ultimately become actual start-ups but their success transpired well after the course concluded.
4. ^A small monetary reward that averaged about $20/student was provided students in the first SM and first NED simulations. In all other simulations, 15% of a student's final marks was related to ending portfolio value. Our results are robust to removing these initial simulations from the sample.
5. ^There was no match maker that would automatically complete the trades.
6. ^The probability of a success they were supposed to score was defined as being around after 2 years of operation.
7. ^Some of the 15 SM sections evaluated the same set of NED projects. We exclude the trades of the seven students who were enrolled in both courses.
8. ^Average price vary by market and the fixed effect controls for these differences.
9. ^Students start with 2,000 shares of each security. Six percent of trades involved single shares.
10. ^These results are robust to aggregating the observations to the venture level and regressing the share-weighted average price of the venture (security h in simulation j) on the female share of the venture. The size of the venture team has an insignificant effect on prices and the female share effects are robust to specifications that include team size.
11. ^Our data includes the ratings of the experts. To investigate whether the negative effect of female share applies to their ratings, we regressed the expert ratings on female share (only relevant to NED as that is the course where they observe team presentations at the end of the class). We find a negative relationship between their ratings and fshr that is not statistically significant (coefficient= –0.073 and SE = 0.043).
References
Apesteguia, J., Azmat, G., Iriberri, N. (2012). The impact of gender composition on team performance and decision making: evidence from the field. Manag. Sci. 58, 78–93. doi: 10.1287/mnsc.1110.1348
Backus, P., Cubel, M., Guid, M., Sanchez-Pages, S., Mañas, E. (forthcoming). Gender, competition performance: evidence from chess players. Quant. Econ.
Becker-Blease, J. R., Sohl, J. E. (2007). Do women-owned businesses have equal access to angel capital? J. Bus. Venturing 22, 503–521. doi: 10.1016/j.jbusvent.2006.06.003
Brooks, A. W., Huang, L., Kearney, S. W., Murray, F. E. (2014). Investors prefer entrepreneurial ventures pitched by attractive men. Proc. Natl. Acad. Sci. U.S.A. 111, 4427–4431. doi: 10.1073/pnas.1321202111
Ewens, M., Townsend, R. R. (2020). Are early stage investors biased against women? J. Financ. Econ. 135, 653–677. doi: 10.1016/j.jfineco.2019.07.002
Gafni, H., Marom, D., Robb, A., Sade, O. (2021). Gender dynamics in crowdfunding (kickstarter): evidence on entrepreneurs, backers, and taste-based discrimination. Rev. Finan. 25, 235–274. doi: 10.1093/rof/rfaa041
Geiger, M. (2020). A meta-analysis of the gender gap (s) in venture funding: funder-and entrepreneur-driven perspectives. J. Bus. Venturing Insights 13, e00167. doi: 10.1016/j.jbvi.2020.e00167
Geiger, M., Oranburg, S. C. (2018). Female entrepreneurs and equity crowdfunding in the us: receiving less when asking for more. J. Bus. Venturing Insights 10, e00099. doi: 10.1016/j.jbvi.2018.e00099
Hebert, C. (2018). Mind the gap: Gender stereotypes and entrepreneur financing. Available at SSRN 3318245. doi: 10.2139/ssrn.3318245
Hoogendoorn, S., Oosterbeek, H., Van Praag, M. (2013). The impact of gender diversity on the performance of business teams: Evidence from a field experiment. Manag. Sci. 59, 1514–1528. doi: 10.1287/mnsc.1120.1674
Ivanova-Stenzel, R., Kübler, D. (2011). Gender differences in team work and team competition. J. Econ. Psychol. 32, 797–808. doi: 10.1016/j.joep.2011.05.011
Johnson, M. A., Stevenson, R. M., Letwin, C. R. (2018). A woman's place is in the… startup! crowdfunder judgments, implicit bias, and the stereotype content model. J. Bus. Venturing 33, 813–831. doi: 10.1016/j.jbusvent.2018.04.003
Niederle, M., Vesterlund, L. (2007). Do women shy away from competition? do men compete too much? Q. J. Econ. 122, 1067–1101. doi: 10.1162/qjec.122.3.1067
Keywords: gender, entrepreneurship, market simulation, venture capital, project assessment
JEL codes: G41, G24, L26, C91
Citation: Aquino K, Deretic M and Ries J (2022) Gender effects of project assessment: Evidence from a market simulation. Front. Behav. Econ. 1:1015626. doi: 10.3389/frbhe.2022.1015626
Received: 09 August 2022; Accepted: 08 November 2022;
Published: 16 December 2022.
Edited by:
Agne Kajackaite, University of Milan, ItalyReviewed by:
Egle Karmaziene, VU Amsterdam, NetherlandsRobert Stüber, New York University Abu Dhabi, United Arab Emirates
Copyright © 2022 Aquino, Deretic and Ries. This is an open-access article distributed under the terms of the Creative Commons Attribution License (CC BY). The use, distribution or reproduction in other forums is permitted, provided the original author(s) and the copyright owner(s) are credited and that the original publication in this journal is cited, in accordance with accepted academic practice. No use, distribution or reproduction is permitted which does not comply with these terms.
*Correspondence: John Ries, john.ries@sauder.ubc.ca