The effects of task difficulty and presentation format on eye movements in risky choice
 Xiaomeng Zhang
 Jason A. Aimone
 Abdelaziz Alsharawy
 Flora Li
 Sheryl Ball
 Alec Smith
- 1Economics Experimental Lab, Nanjing Audit University, Nanjing, China
- 2Department of Economics, Baylor University, Waco, TX, United States
- 3School of Public and International Affairs, Princeton University, Princeton, NJ, United States
- 4Department of Management, Policy, and Community Health, The University of Texas Health Science Center at Houston (UTHealth Houston), Houston, TX, United States
- 5Department of Economics, Virginia Tech, Blacksburg, VA, United States
- 6School of Neuroscience, Virginia Tech, Blacksburg, VA, United States
This study investigates the process of risky choice using eye tracking. We manipulate the complexity and presentation of lottery choices while measuring eye movements. In particular, we measure the frequencies of information collection procedures associated with established theories of risky choice, namely, expected utility theory and component comparison theory. These choice process patterns are sensitive to the difficulty of calculations and the presentation format of lotteries. Participants appear to transition between decision-making procedures depending on how lottery choices are presented and their complexity. They also attend to payoffs as the primary feature considered during component comparisons. Our findings emphasize the influence of information presentation on decision-making processes and decisions.
1 Introduction
Risk is a central aspect of decisions ranging from whether to carry an umbrella to how to allocate retirement investments. Lottery choice tasks are often used to study decisions under risk in incentivized behavioral experiments. In the process of making such decisions, people collect information about the options available to them. Eye tracking has emerged as an essential tool for exploring this process. We use eye-tracking data acquired while people choose between binary lotteries to study the effects of two contextual factors on both the process of making risky decisions and the decisions themselves: (1) the difficulty of aggregating information and (2) the way each options' attributes are presented.
There are two broad categories of information collection procedures in risky choice: In the first type, probabilities (or some function of the actual probabilities) are used as weights for either values or utilities. This procedure is thought to be consistent with expected utility maximization, and hence, we refer to it throughout as EU-type information collection. In the second type of procedure, called component comparison or CC-type information collection, people compare rewards and probabilities across gambles (Bettman, 1975; Tversky et al., 1988). When expected payoffs are more difficult to calculate, decision-makers may change their information collection strategy from computing weighted averages (the first category) to component comparison (Arieli et al., 2011). The resulting change in process also results in changes to decisions (Aimone et al., 2016a). Furthermore, manipulating the process by which participants view lotteries results in changes to both behavior and decisions (Aimone et al., 2016b; Mittone and Papi, 2020).
Many factors affect the process by which people make risky choices. Presentation format and task complexity affect information processing in general (Payne, 1976; Orquin et al., 2021) and specifically in risky choices (Glöckner et al., 2016; Zilker et al., 2020; Oprea, 2022). Repetition matters, and eye-movement patterns in a risk task repeated 100 times were more consistent with deliberate calculations (weighting and adding process) than those in a single-decision task (Su et al., 2013), so it is not surprising that most people's risk preferences became more consistent over time (Charness and Chemaya, 2023). In addition, numeracy was positively associated with consistency in risky choice, albeit with evidence supporting a greater reliance on heuristics among the more numerate group (Ashby, 2017).
This study contributes to the literature in several ways. We study individuals' risky decision-making processes by using an incentivized risky-choice task where participants make many choices (both Arieli et al., 2011 and Aimone et al., 2016a relied upon a limited number of lotteries, and participants were paid a flat fee) with eye tracking (missing from both Aimone et al., 2016b and Mittone and Papi, 2020). We manipulate the difficulty of making expected value calculations (as in Arieli et al., 2011 and Aimone et al., 2016a) while adding a new treatment variable: task presentation. As participants consider their choices we track their eye movements. We provide additional evidence that as tasks become more challenging, people modify their information-acquisition processes. In addition, we show that the presentation of lotteries (either horizontally or vertically) also affects subjects' information acquisition procedures. We find that participants more frequently choose the gamble with higher expected monetary value in difficult choices when the payoff information is presented horizontally but not vertically. Furthermore, they choose the risky gamble more frequently when expected payoffs are more difficult to compute. Finally, when participants make relatively more EU-type eye movements, they place less weight on payoff and probability differences (and therefore more weight on expected monetary values).
We add to a growing literature that studies the process by which people make decisions under risk (Glickman et al., 2019; Stillman et al., 2020; Sheng et al., 2023; Wu et al., 2023; Yang and Krajbich, 2023). Some previous work on risky decision-making has also examined the role of visual attention. Fiedler and Glöckner (2012), for example, studied the dynamics of fixations in risky choice, highlighting the gaze-cascade effect (Shimojo et al., 2003). Stewart et al. (2016) found that within-gamble eye movements are more common than between-gamble transitions, with a tendency for clockwise eye movements. Furthermore, Pachur et al. (2018) find that attention to specific outcomes is linked to choice regularities (as posited by cumulative prospect theory; Tversky and Kahneman, 1992) and that the manipulation of attention can cause changes in preferences (and fitted choice model parameters). Hirmas et al. (2023) also find a tight correlation between behavior and attention by further decomposing fixations into an individual average component and a trial-wise deviation (that varies more readily with contextual factors). Other authors have employed cognitive process modeling (e.g., drift diffusion or leaky accumulator models) of risky choice to describe how individual attributes and differences in attention influence evidence accumulation in a sequential sampling paradigm (Glickman et al., 2019; Smith and Krajbich, 2019; Lee et al., 2023).
In the most closely related previous work on this topic (Arieli et al., 2011; Aimone et al., 2016a), lotteries were predominantly presented vertically (as in Figure 1B). However, participants may be accustomed to collecting information horizontally and from left to right if they read in a language such as English or Spanish. This convention is not universal, so participants who primarily read, for example, Arabic or Hebrew may be accustomed to horizontal right to left presentation, while those who read, for example, Traditional Chinese may be most experienced with vertical information collection. Vertical only presentation conflates information acquisition with reading habits and may affect participants' ability to perform calculations.
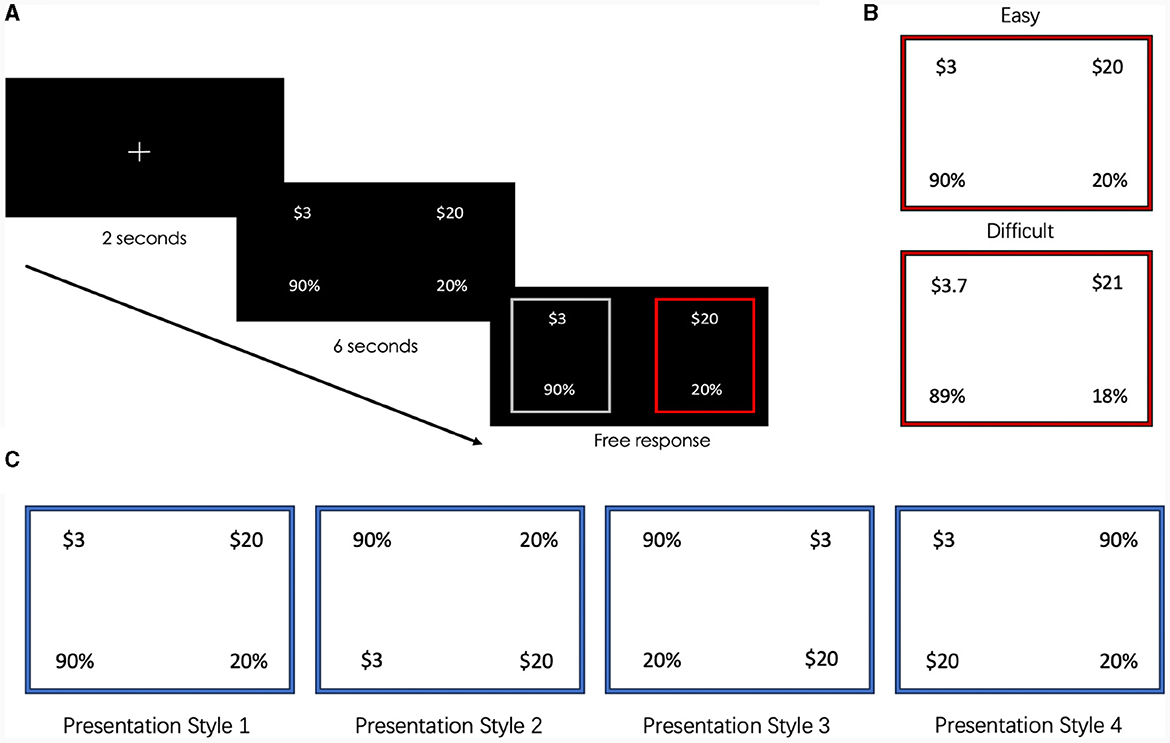
Figure 1. (A) Sequence of events during a single trial. (B) Each easy lottery in a gamble has at most three non-zero digits. For example, $3 with 90% probability has 2. Each difficult to calculate lottery has at least four non-zero digits. (C) The four lottery presentation styles that make up the horizontal and vertical treatments.
Brain imaging studies reveal different cognitive strategies during arithmetic tasks: Exact arithmetic uses language-based representations, while approximate arithmetic focuses on quantity (Dehaene et al., 1999). The choice of these strategies is closely tied to presentation format (Campbell and Clark, 1992). Format variations can influence speed and accuracy, emphasizing the connection between format and working memory (DeStefano and LeFevre, 2004). Specifically, participants solved arithmetic problems more quickly when they were are presented vertically (Trbovich and LeFevre, 2003).
The remainder of this article is structured as follows: Section 2 details the experimental design, while Section 3 presents the primary findings. Finally, Section 4 provides the conclusion and a discussion.
2 Experimental design and procedure
Fifty participants with normal or corrected-to-normal vision were recruited from the university community for this project.1 Each participant made 120 lottery choices while their eye movements were recorded using an eye tracker (1,000 Hz EyeLink 1000 Plus, SR Research). The eye-tracking portion of the experiment averaged ~20 min. Participants each received $10 USD in compensation, in addition to earnings based on the outcome from a randomly chosen lottery, resulting in total average earnings of $20.33.
Each trial of the experiment (Figure 1A) began with a 2-s presentation of a fixation cross, followed by a 6-s evaluation phase during which participants saw the available lotteries for that trial. Following Aimone et al. (2016b), who assessed how long participants needed to complete arithmetic tasks, the minimum time for this initial evaluation was set to ensure that participants did not make a decision either impulsively, too quickly to have a non-rushed exploration of the available information about the decision environment, or before meaningful data on eye movements could be recorded. A possible trade-off of this approach is that a participant might have believed that there was an implicit message about the time needed to make a decision. The selection phase followed during which participants took an average of 1.688 s to make an untimed choice between the two lotteries. Participants were also asked to confirm their choice; however, they did not receive feedback on the outcome of any choice until the end of the experiment.
The main treatment in our within-subject design is whether it was easy or difficult to compute the expected payoff of the lottery. In any trial, the available lottery choices were either both easy or both difficult. Easy lotteries typically featured two non-zero digits, following the pattern $X with a Y0% probability or $X0 with Y% probability, for example, $3 with 90% probability. To maintain consistency, each difficult lottery was constructed from a corresponding easy lottery by adding or subtracting a small, random amount from the easy lottery prize and/or probability. This resulted in lotteries with four non-zero digits, following the format $WX with probability YZ% or $W with probability XYZ%, for example, $3.7 with 89% probability.2
Lottery pairs were divided into four blocks of 30 lotteries per block, where the lotteries within the block were either all easy or all difficult. The first block was chosen at random, and subsequent blocks alternated the treatment condition. Within each block, lottery characteristics were varied to ensure that the riskier lottery did not always offer the highest average payoff and that there was substantial variation in probabilities across lotteries. Each participant saw 100 unique gambles over the course of the experiment. In 64 of these choices, the risky option had a higher expected monetary value (EMV) while in the other 36, the safe option had the higher EMV. We also included 20 check trials, five in each block, where both the payoff and the probability were higher for one lottery than the other, in order to verify task engagement. In these check trials, participants chose the correct (dominant) option 94.4% of the time. Had participants chosen randomly, they would have selected the correct option 50% of the time, indicating that participants do not appear to be making random choices (p < 0.000).3 The large number of trials is important for statistical analysis due to the number of coefficients we wish to estimate in our models, and, as noted earlier, is one of the features that distinguishes this work from other similar studies. One concern is that participants might have been unwilling to perform 240 expected utility calculations. However, previous results show that experience increases EU-type eye movements (Su et al., 2013), suggesting that the number of trials in our task is not likely to influence participants' willingness to perform these calculations.
In earlier research (Arieli et al., 2011; Aimone et al., 2016a,b), information for each lottery was displayed vertically so that there was a lottery on both the right and left sides of the computer monitor (Figure 1B, top). This raised concerns that eye-movement patterns might, in part, result from participants' viewing habits, for example, viewing information horizontally from left to right due to being an English reader. To explore this, our second treatment varied presentation styles so that lotteries were presented vertically in some rounds and horizontally in others (Figure 1C). In addition, we varied whether payoffs or probabilities appeared in the top left position, resulting in four presentation styles, each of which appeared with equal likelihood in each of the four blocks. Participants were aware that they would encounter four distinct presentation styles, and the four presentation styles occurred in random order within each block4. To summarize our design, in each block gambles were either all easy or all difficult, while presentation style varied from trial to trial.
To classify and analyze eye movements, we partitioned the screen into four quadrants: top left, bottom left, top right, and bottom right. We then recorded each participant's eye movements during a 4-s period in which they could view lottery information but could not make a lottery choice (Arieli et al., 2011; Aimone et al., 2016a,b). We define eye movements between the payoff and probability of a single lottery as EU-type eye movements because, to calculate expected monetary value, expected utility, or any similar model, one must multiply the probability and value. We expected that the eye movements of participants following EU-type models would involve more transitions within lottery attributes, that is, of the form payoff1↔probability1 and payoff2↔probability2, where subscripts indicate each lottery. The alternative is eye movements between attributes of the two displayed lotteries, and we define eye movements between the payoffs or between the probabilities as CC-type eye movements, which are consistent with the component comparison model. We expect that participants following the component comparison model would have more eye movements between lottery attributes, of the form payoff1↔payoff2 and probability1↔probability2 (see Figure 2).
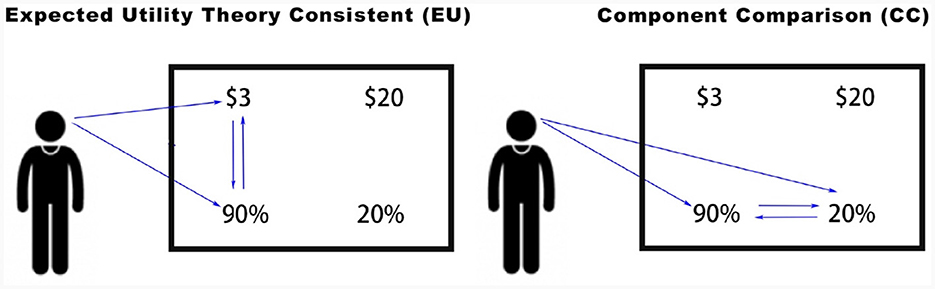
Figure 2. Eye movements corresponding to each evaluation procedure.
3 Results
We divide our results into three subsections. Section 3.1 explores the relationship between our calculation difficulty and information presentation style treatments and our participants' choice processes by analyzing eye-movement patterns. Section 3.2 analyzes how our treatments affect participants' decisions. Finally, Section 3.3 contains our results linking a participant's choice process and their decisions.
3.1 Effects of external manipulations on the decision-making processes
We begin by classifying eye movements by whether they were horizontal, vertical, or diagonal (Table 1, Panel A). Next, we calculated the frequency of CC-type and EU-type eye movements for each subject and difficulty condition (Table 1, Panel B). We find, consistent with prior research results (Arieli et al., 2011; Aimone et al., 2016a,b), that increased calculation difficulty is associated with a decrease in the frequency of EU-type eye movements (Wilcoxon, p = 0.00) and an increase in the frequency of CC-type eye movements (p = 0.00). Because participants cannot predict the presentation style before a trial starts, their first eye movement in each trial is likely to be influenced by the written format of their language. For example, for English speakers, one might expect initial fixations at the top left and initial saccades from left to right. For this reason, we also report the data for only the first eye movement (Supplementary Table S4, Panel A) and those excluding the first eye movement (Supplementary Table S4, Panel B). The effect of task difficulty on eye movements is, qualitatively, the same after excluding first eye movements.
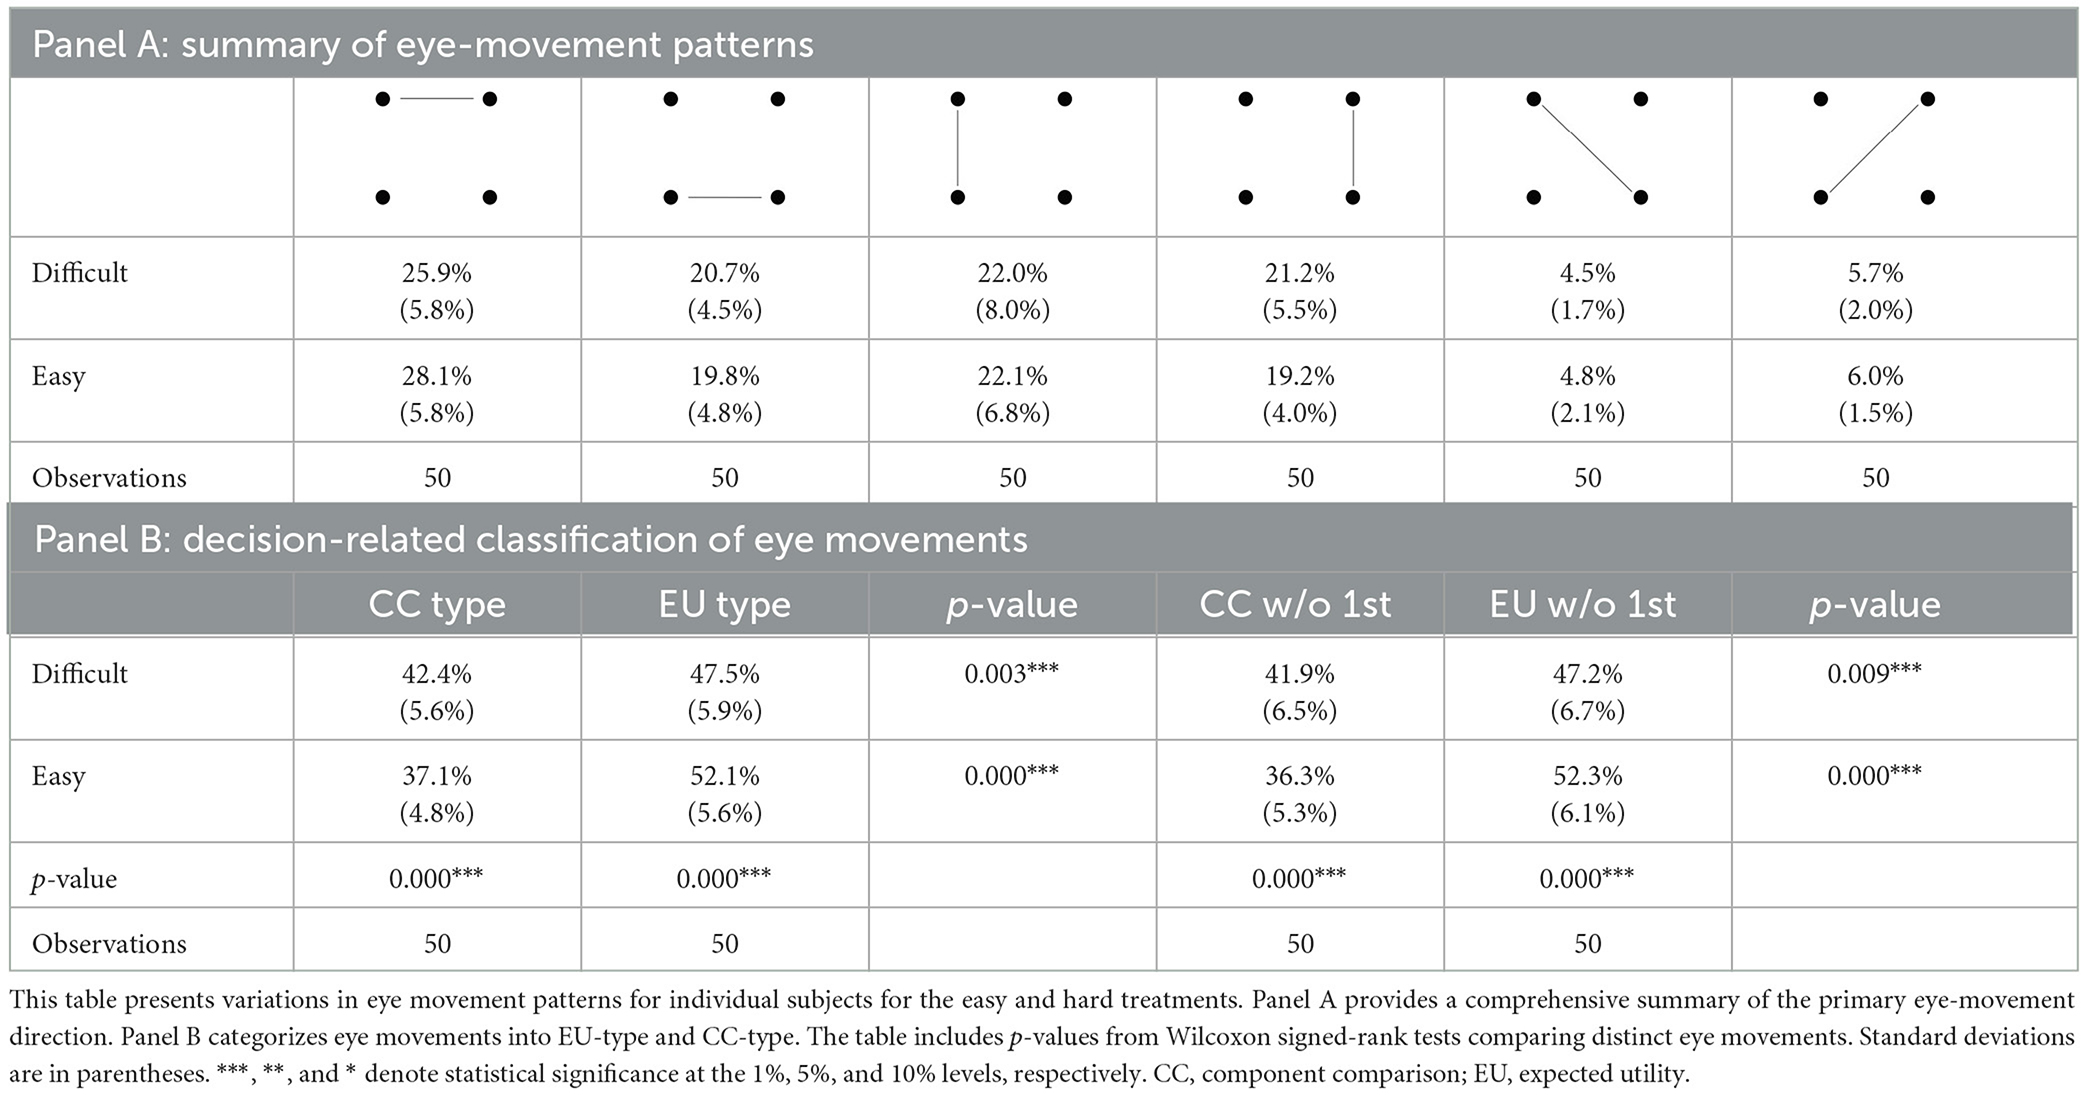
Table 1. Variations in eye movement patterns for the easy and hard treatments.
Next, we examine the relationship between presentation style and eye movements (Table 2, Panel A). There are more CC-type eye movements when the lottery presentation is vertical (Wilcoxon, p = 0.00) and more EU-type eye movements when the presentation is horizontal (p = 0.00; Table 2, Panel B). Further distinguishing between the four presentation formats did not change this result (Supplementary Tables S2, S3). As before, we also report the data without the first eye movement (Supplementary Table S5, Panel B). While it is still the case that there are significantly more EU-type eye movements for both the vertical and horizontal treatments, there is no longer a significant effect of presentation on either CC-type or EU-type eye movements. This is consistent with the hypothesis that, because English has a “left to right” reading format, participants' first eye movements are biased toward being horizontal. Results for only the first eye movement are found in Supplementary Table S5, Panel A.
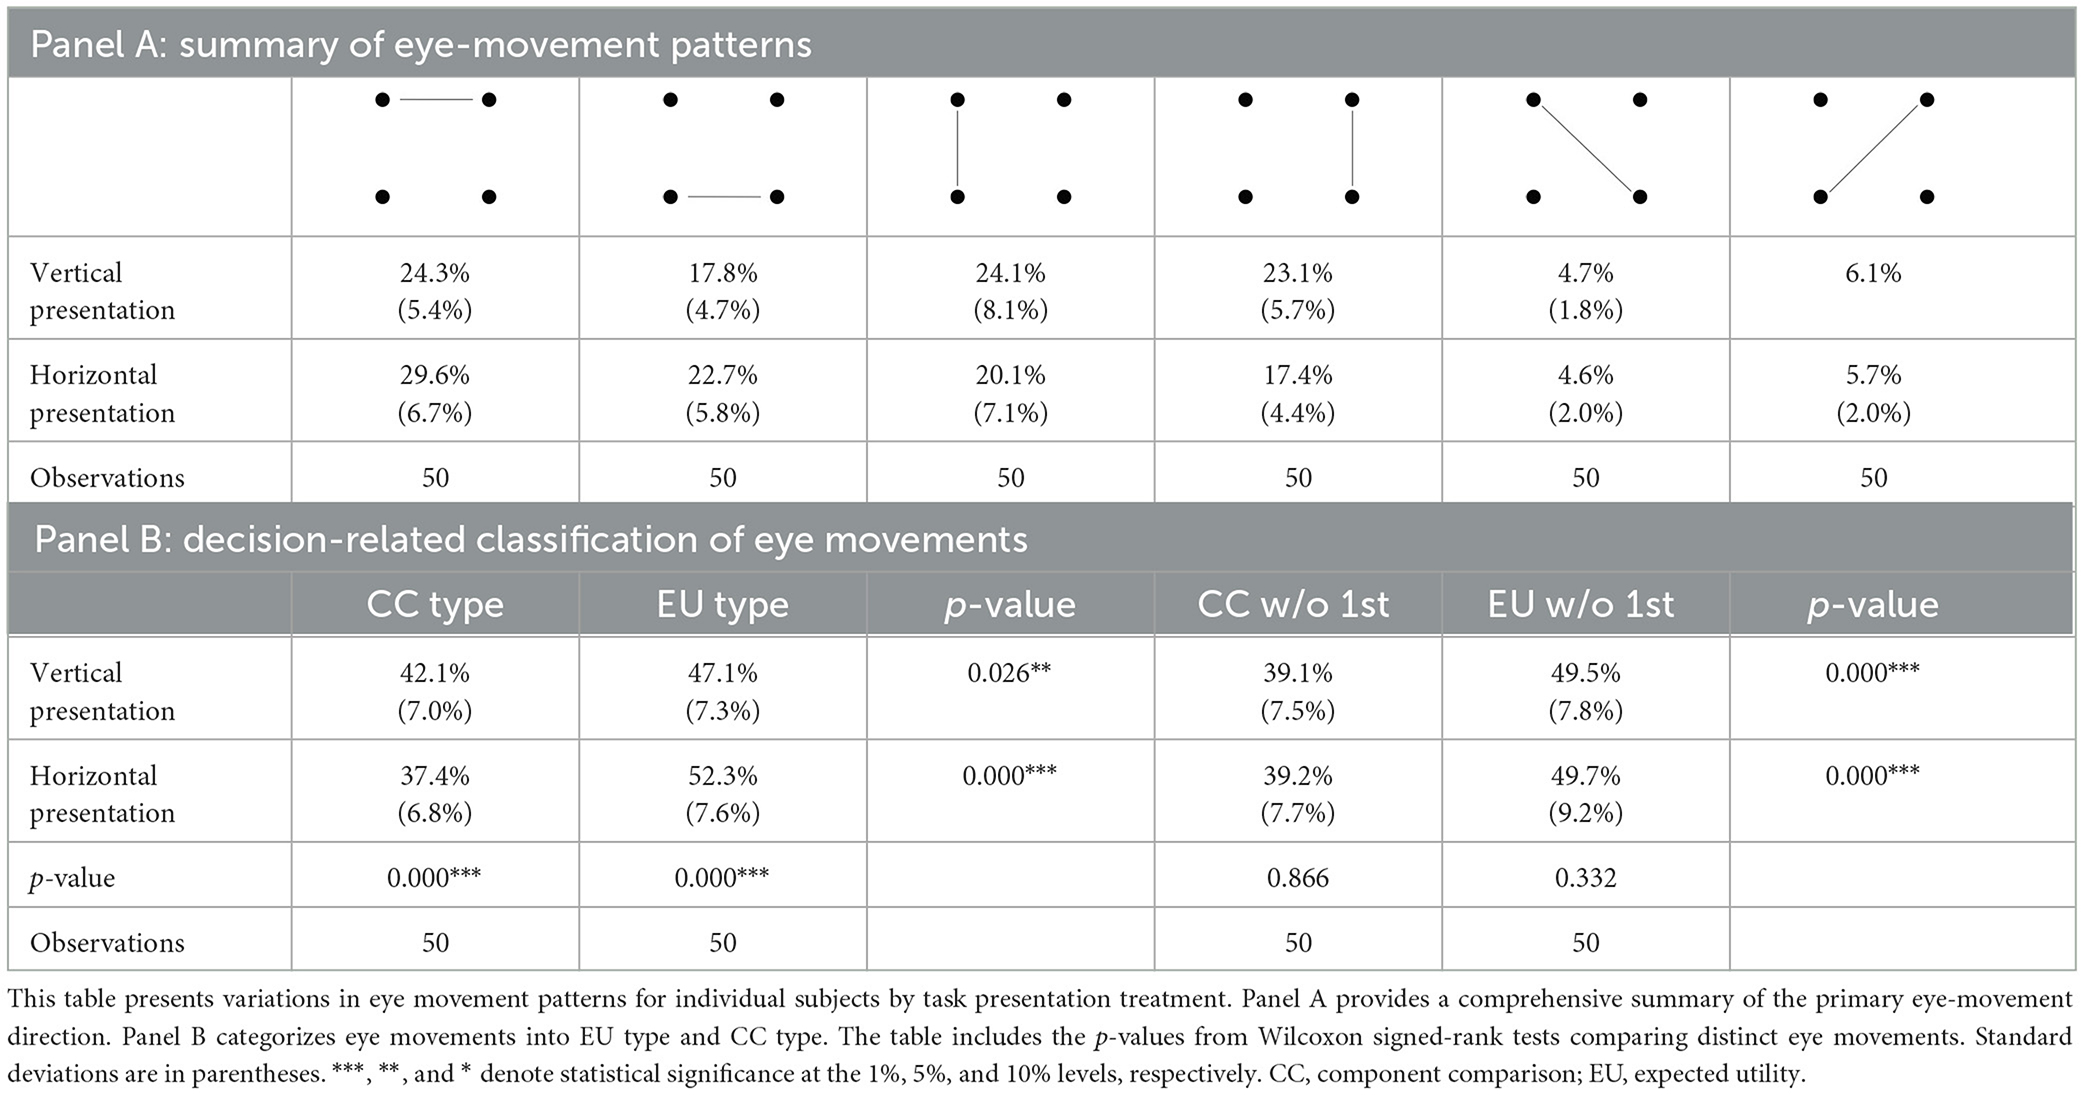
Table 2. Variations in eye movement patterns by presentation format.
Excluding the first eye movement did not significantly change the frequency of CC-type and EU-type eye movements—we still see significantly more (Wilcoxon, p = 0.00) and a decrease in EU-type eye movements (p = 0.00) in the more difficult blocks. However, after excluding the first eye movement, the effect of presentation style is no longer significant (Wilcoxon, p = 0.87 for CC-type eye movement and p = 0.33 for EU-type eye movement). This suggests that the variation in eye movements for different presentation styles is primarily driven by the participants' initial eye movement, which typically follows a pattern from the upper left to the upper right. Consequently, when the presentation style is horizontal, there is an initial tendency toward EU-type eye movements, whereas a vertical presentation prompts an initial CC-type eye movement.
Next we consider whether task difficulty and presentation format interact to affect eye-movement patterns (Table 3). While a Wilcoxon signed-rank test shows no difference in the frequency of CC-type versus EU-type eye movements when difficult lottery choices were presented vertically (p = 0.851), EU-type eye movements increase when easy lottery choices are presented vertically (p = 0.000). Repeating this analysis for the horizontal presentation cases, we find that participants have significantly more CC-type eye movements when lotteries are difficult to calculate (p = 0.000) and significantly more EU-type eye movements when lotteries are easy to calculate (p = 0.000). These results are generally consistent with the single treatment results reported earlier.
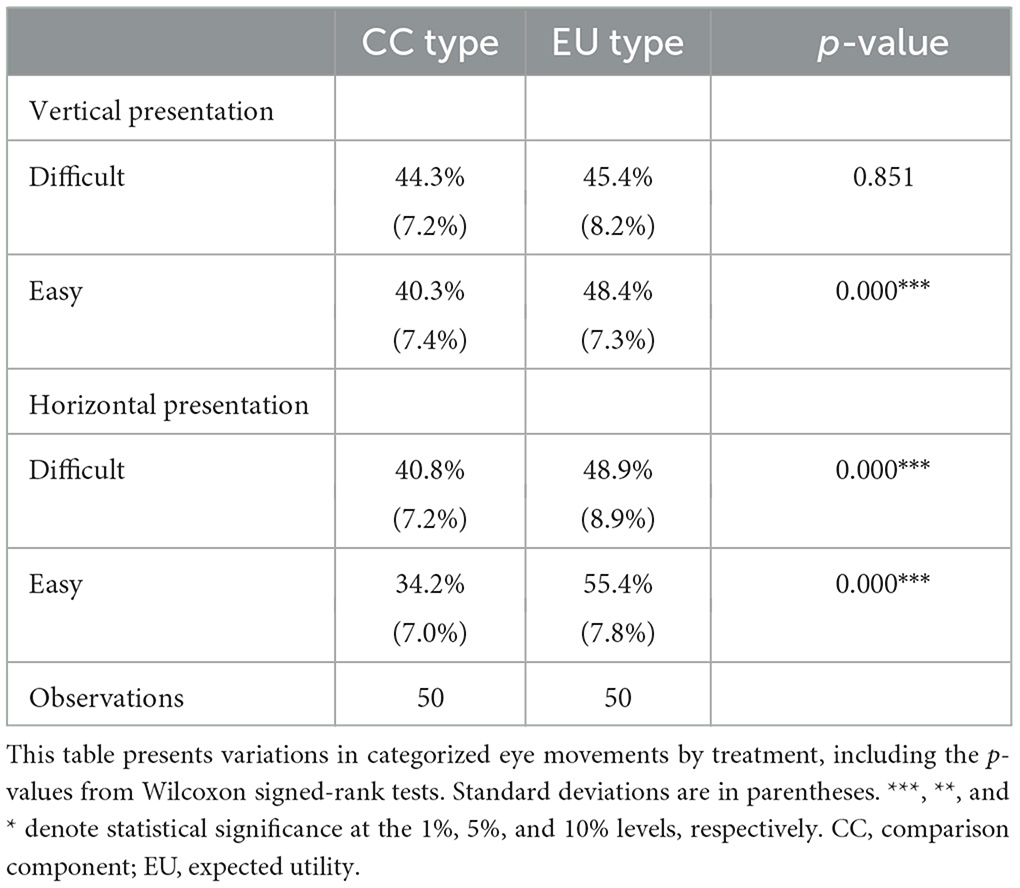
Table 3. Variations in eye-movement patterns by treatment.
Because reaction times provide insight into a decision-maker's attention and processing speed, we next explore whether our treatment variables had an affect on reaction times. As illustrated in Figure 3, we find that calculation difficulty did not result in an increase in reaction times (Kolmogorov–Smirnov test, p = 0.489). Horizontal presentation, by comparison, was associated with decreased reaction times (Kolmogorov–Smirnov test p < 0.000). Because we designed our experiment to allow a sufficient amount of time for participants to have a non-rushed exploration of the information, we would not have predicted the difference in reaction time by presentation style. However, because participants knew the difficulty level but not the presentation style, the faster reaction times in the horizontal treatment likely reflects lower cognitive difficulty because the presentation matched the reading style. If we had blocked our treatments differently, these results may have been different.
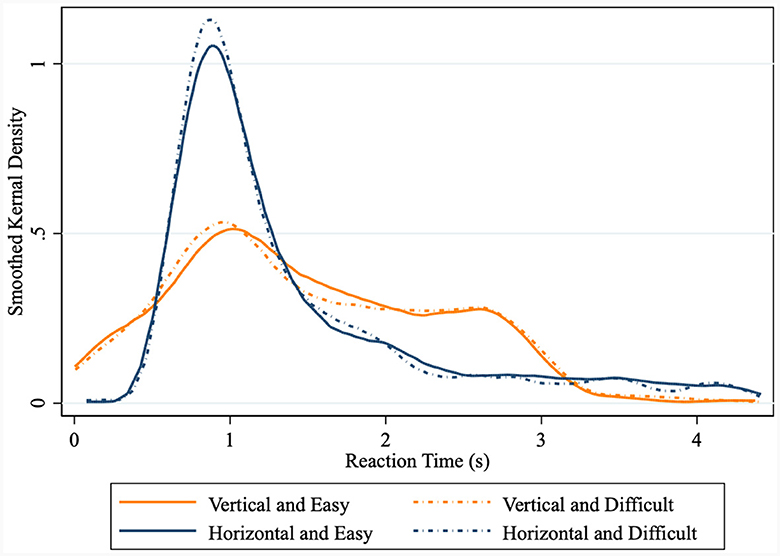
Figure 3. Smoothed Kernel Density of Reaction Time. The Kolmogorov–Smirnov test is used to detect whether the distribution functions are significantly different. ***, **, and * denote statistical significance at the 1%, 5%, and 10% levels, respectively.
In reviewing the results of this subsection, observe that traditional models of decision-making such as expected utility theory do not predict that either calculation difficulty or task presentation affects decision-making. That these treatments do, in fact, affect information collection patterns and reaction times supports the importance of studying choice processes.
We summarize our results on the effects of calculation difficulty and task presentation on the decision-making process as follows:
Result 1: horizontal task presentation is associated with an increase in EU-type eye movements, while vertical task presentation is associated with an increase in CC-type eye movements.
Result 2: difficult-to-calculate gambles are associated with an increase in CC-type eye movements and a decrease in EU-type eye movements.
Result 3: horizontal task presentation is associated with faster reaction times; however, there is no relationship between calculation difficulty and reaction time.
3.2 Effects of external manipulations on decisions
In this section, we analyze the effect of our treatments on participants' decisions. We estimate the following mixed-effects linear regression model:
where Yi is a variable indicating the choice (risky vs. safe lottery or high EMV vs. low EMV lottery) for participant i. The indicator variable Diffculti is equal to 1 when the choice occurs in the difficult block and 0 otherwise, and the indicator Verticali is equal to 1 (and 0 otherwise) when the lotteries are presented vertically. is a vector of control variables that includes the difference in EMV between that trial's lotteries, whether the high-EMV option is risky, and trial number. Finally, ei is a normally distributed error term. Because our data involve repeated measurements from participants, we use mixed-effects regressions that include both fixed effects, capturing average relationships, and random effects, which capture subject-level variation in the relationships between the dependent and explanatory variables; errors are clustered at the subject level (Harrison and List, 2004; Gelman and Hill, 2006).
We begin by exploring whether calculation difficulty and task presentation affect the frequency with which participants chose the high-EMV gamble (Table 4). After including controls (Model 4), the coefficient estimate for the interaction term Difficult × Vertical is negative and significantly different from 0 (p < 0.05), indicating that when calculations are difficult and the task presentation is vertical participants chose the high-EMV option less frequently. The probability of choosing the high-EMV lottery is increasing in the difference between lottery EMVs (p < 0.01), suggesting that the net effect of increasing (decreasing) the EMV of the high (low)-EMV choice is that it is more (less) likely to be selected. When the high-EMV gamble is also the risky gamble, it is less likely to be chosen (p < 0.05). We also find a small but significantly positive effect of trial number (p < 0.05), suggesting that participants became somewhat less risk averse during the course of the experiment.
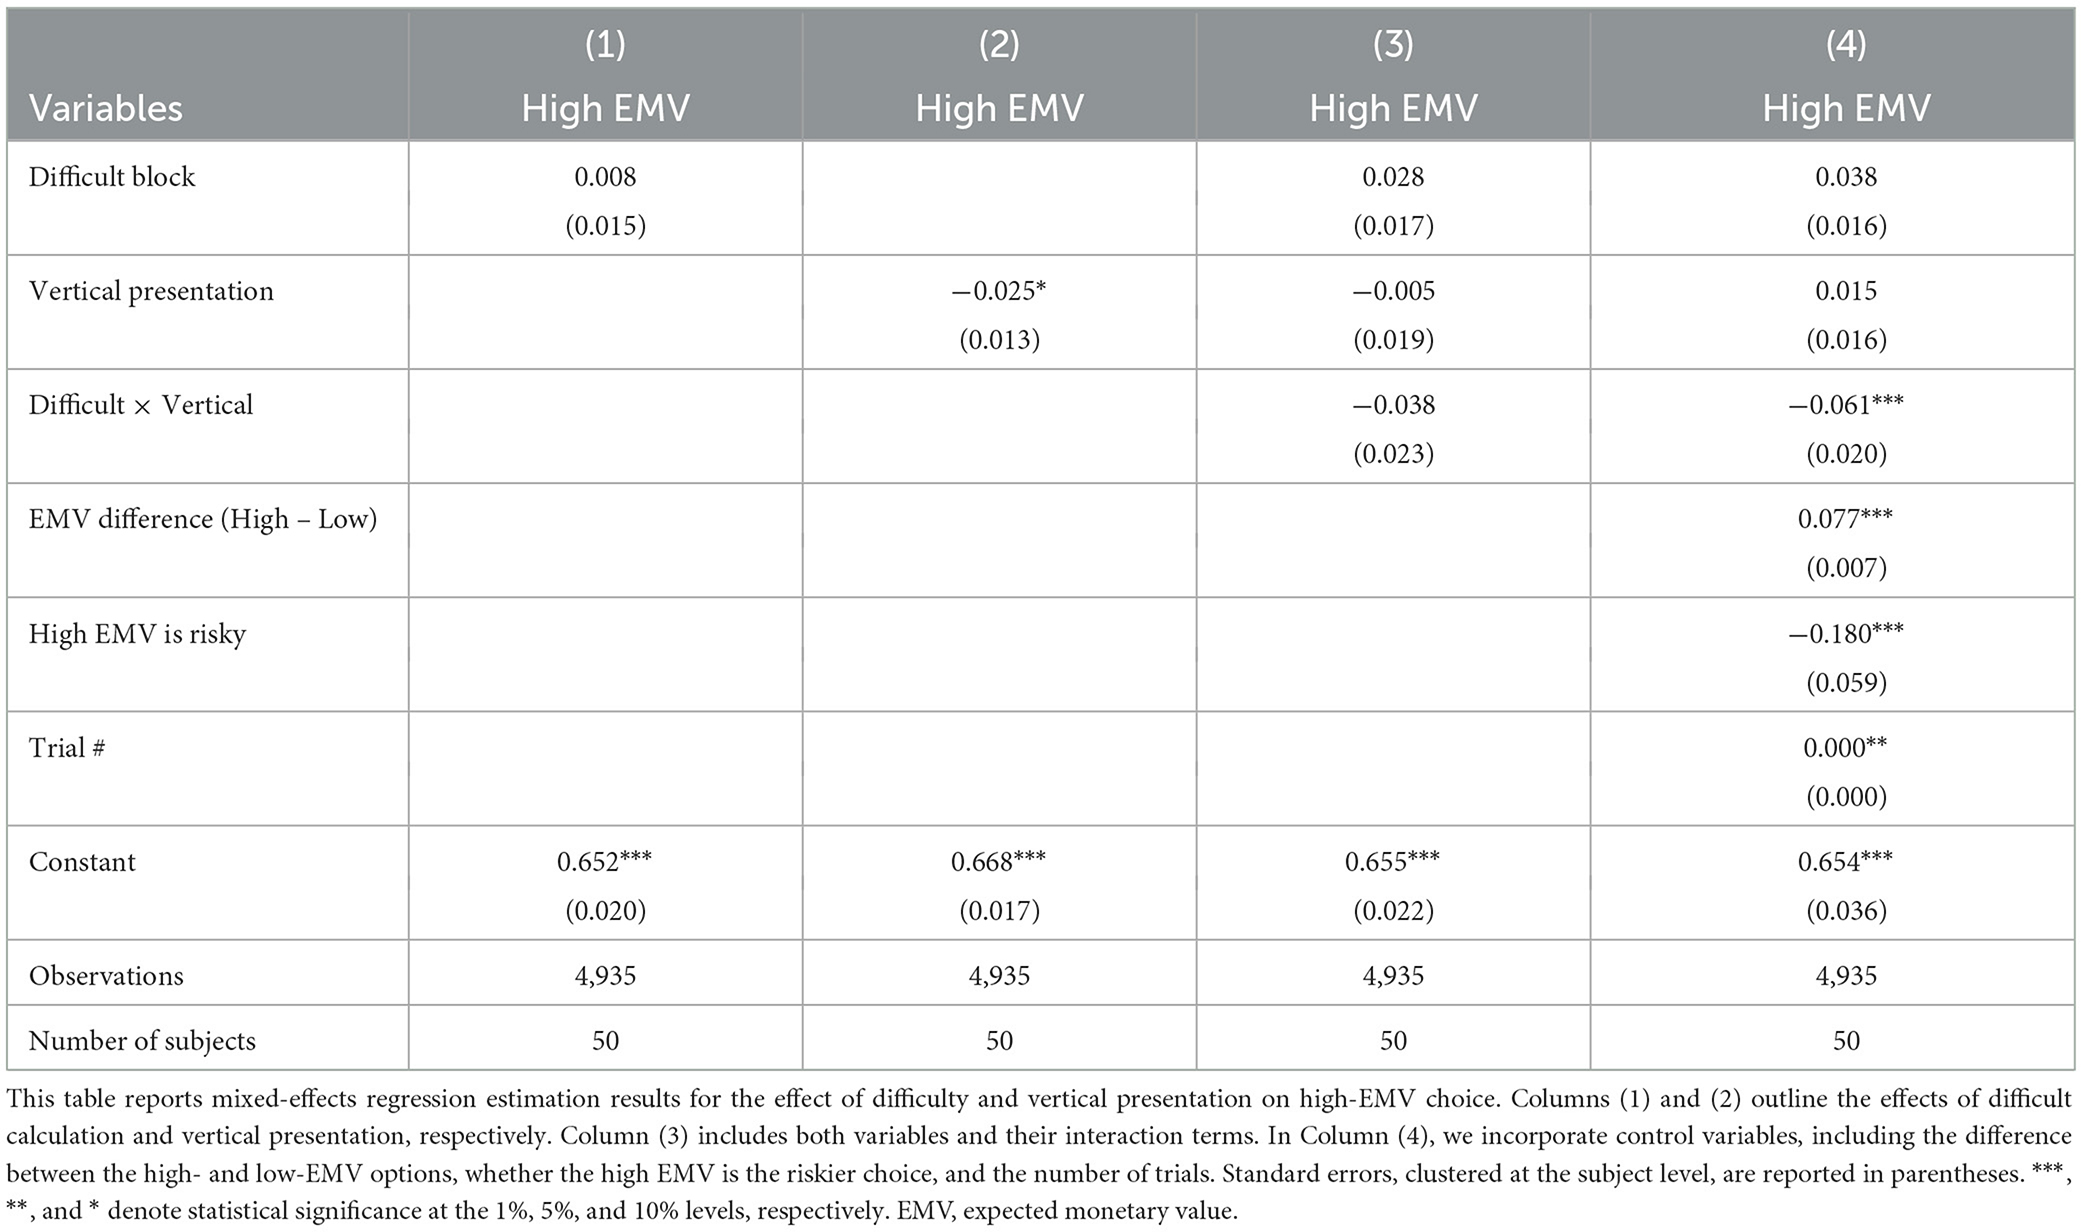
Table 4. Effect of difficulty and vertical presentation on high-EMV choice.
We also examined the effect of vertical presentation separately in both the difficult and easy blocks (Table 5). In the difficult block, vertical presentation makes it less likely that subjects will select the high-EMV option (p < 0.01). In the easy block, however, presentation has no significant effect.
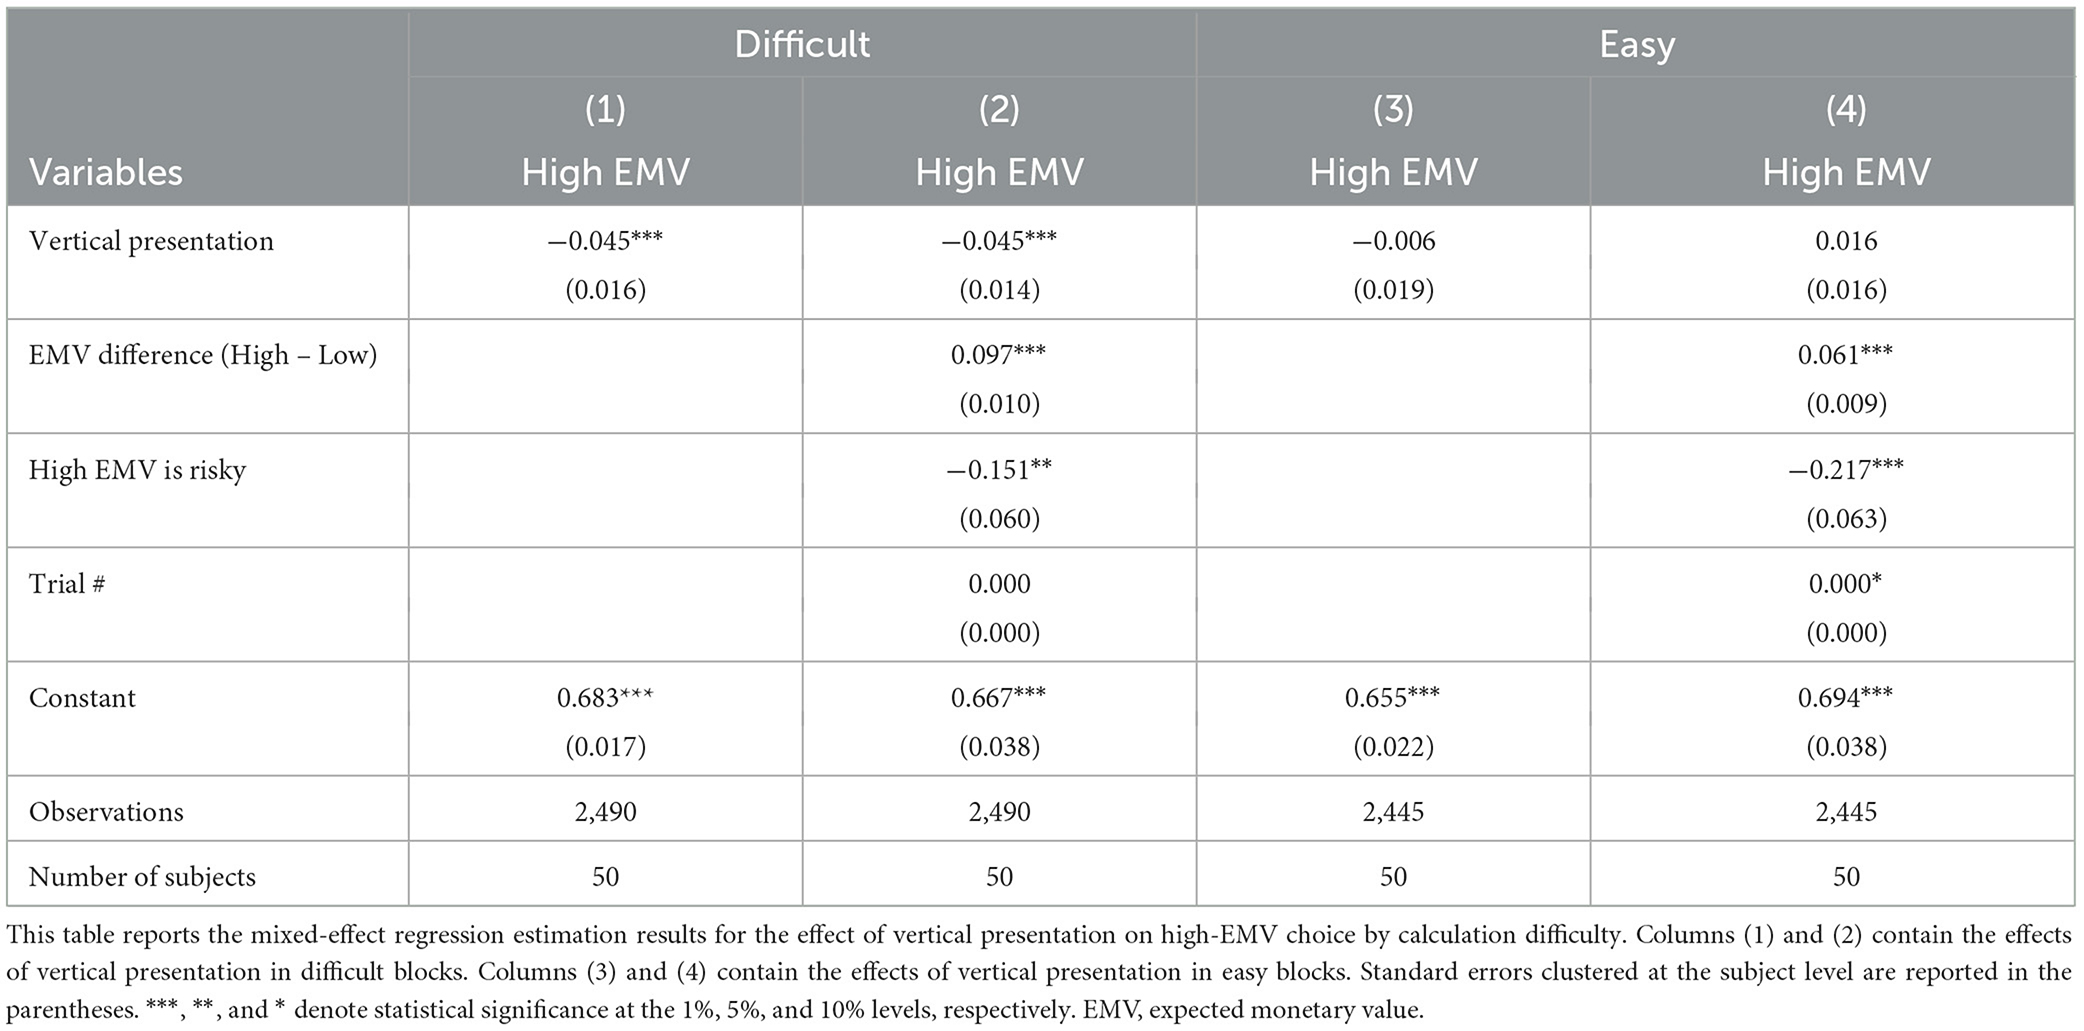
Table 5. Effect of vertical presentation on high-EMV choice by calculation difficulty.
The next group of results focus on whether participants chose the riskier option (Table 6). There is a positive and significant effect of calculation difficulty on choosing the risky option (p < 0.05). As the EMV difference between gambles increases, the risky gamble is more likely to be chosen (p < 0.01). In addition, if the high-EMV gamble is the risky gamble, it is more likely to be chosen (p < 0.01), and there is, again, a small but significant effect of trial number (p < 0.05).
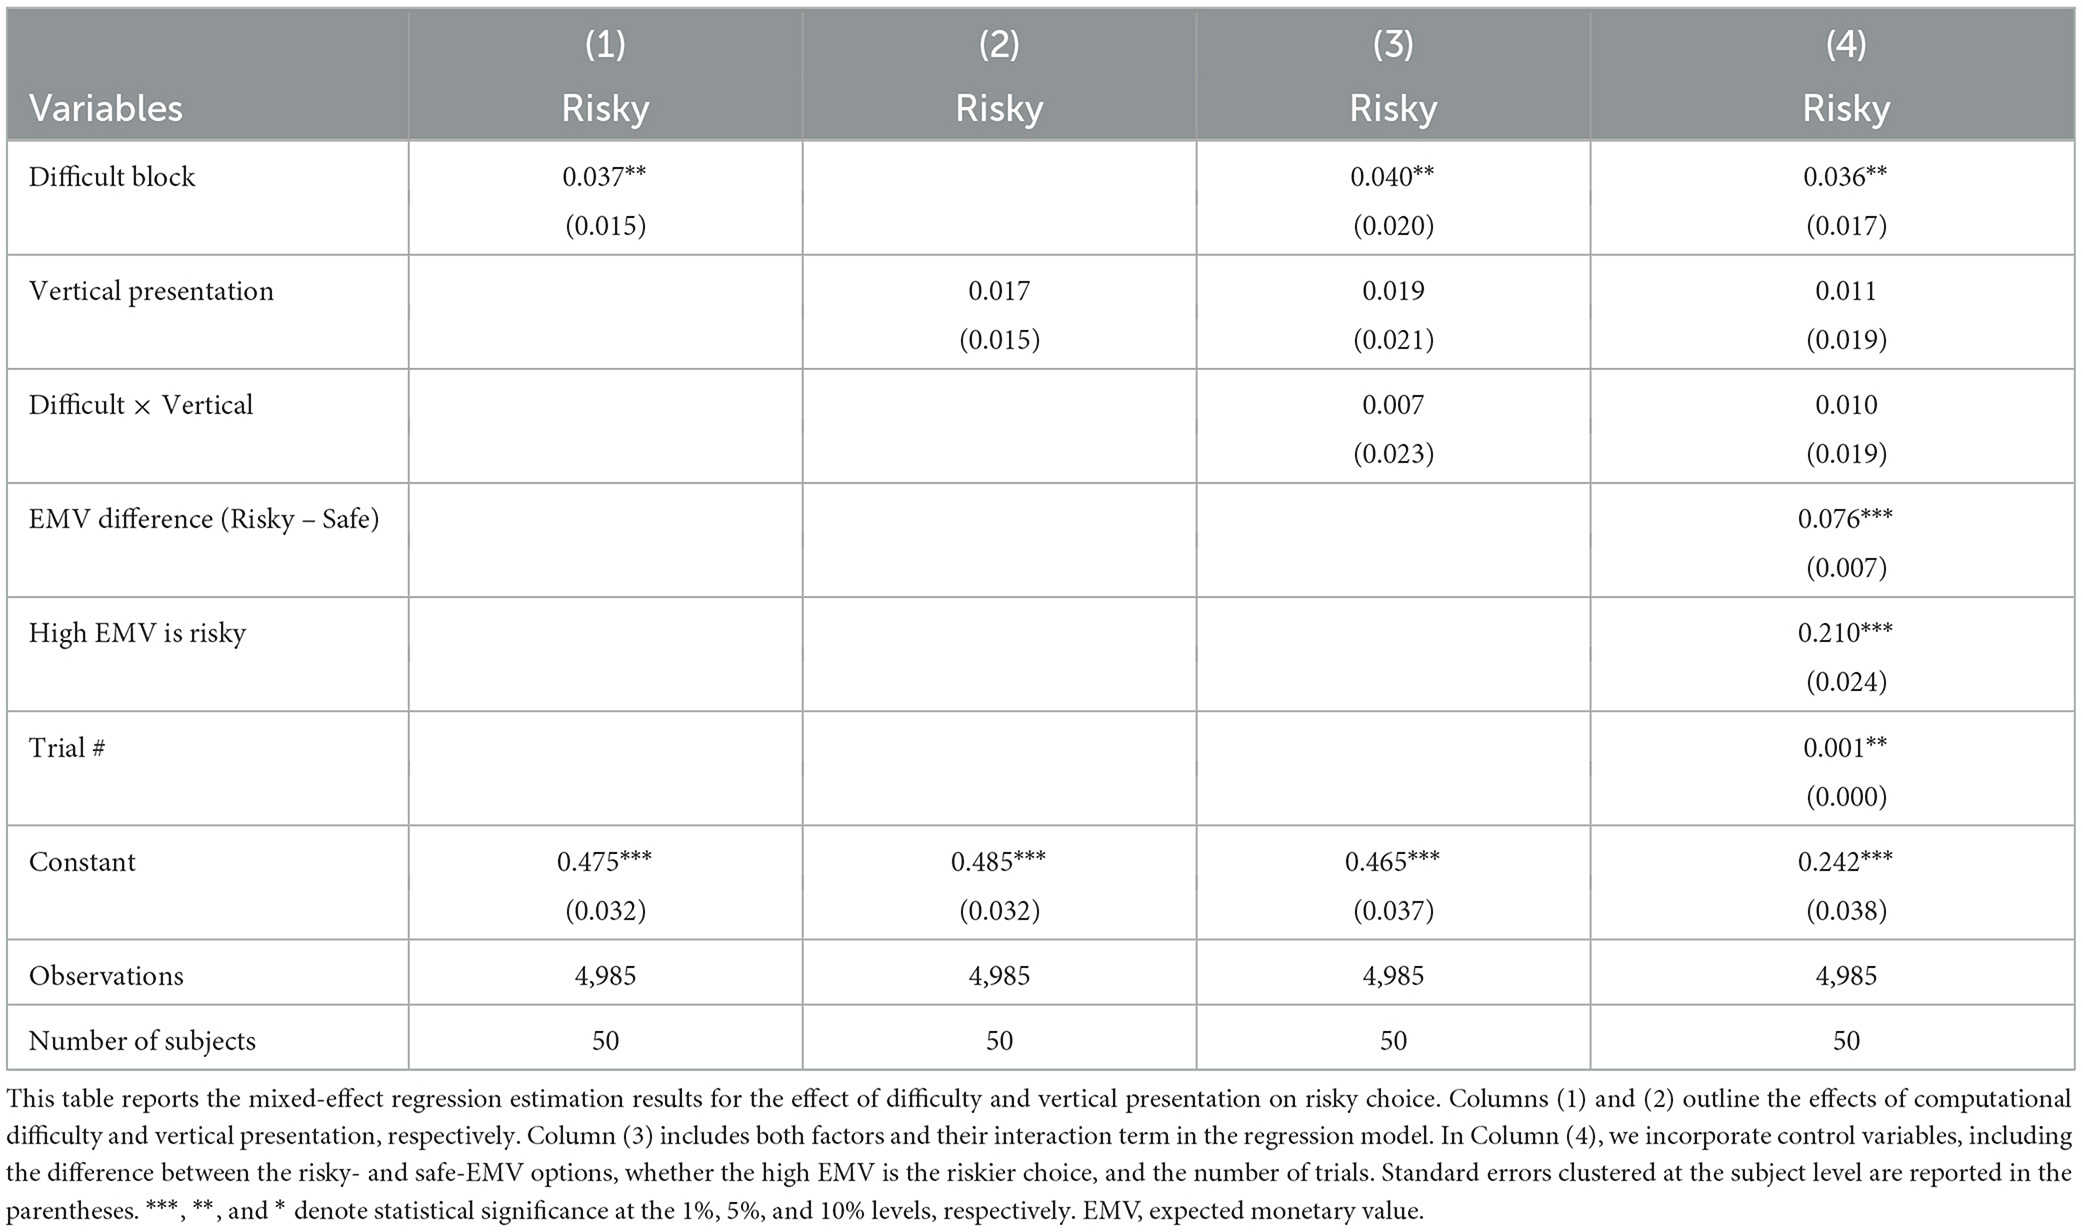
Table 6. Effect of difficulty and vertical presentation on risky choice.
To evaluate the relationship between presentation format, choice difficulty, the characteristics of each lottery choice pair, and participant choices, we performed additional mixed-effects regression analyses, again using “Risky Choice” and “High EMV Choice” as dependent variables (Supplementary Tables S6, S7). The explanatory variables are the difference in payoffs between the risky and safe lotteries (ΔPayoff), the difference in probabilities between the risky and safe lotteries (ΔProbability), the EMVs of the lotteries (EMV of Risky and Safe option when the dependent variable is “Risky Choice” and EMV of High or Low option when the dependent variable is “High EMV Choice”). We included indicators for the difficult and vertical treatments, their interactions with each other and with the lottery characteristics, and the trial number. The results of the analysis are largely consistent with our previous results. We find that participants are more likely to choose the risky gamble (p < 0.05) in difficult blocks (Supplementary Table S6, Models 1 and 3). Interestingly, this pattern seems to result from participants placing increased weight on the EMVs of the lotteries (Models 2 and 4). The results might indicate that the evaluation of the information collected is different in the difficult condition, in addition to our results that the information collection process is different. Additionally, when the dependent variable is whether participants chose the high-EMV gamble (Supplementary Table S7), the coefficient on the Difficult × Vertical indicator variable is negative and significant, which suggests that within difficult blocks, vertical lottery presentations decrease the frequency with which participants selected the high-EMV gambles (p < 0.01).
In summary, we find that when calculations are more difficult, participants are more likely to choose the high-EMV and risky options. Furthermore, high-EMV choices are less frequent in the difficult condition when the lottery presentation is vertical. As demonstrated in the previous section, participants also have more CC-type eye movements in the difficult and vertical conditions. Our findings are consistent with previous lottery choice studies that controlled whether participants could view EU-type or CC-type information (Aimone et al., 2016b; Mittone and Papi, 2020). These studies found that in the EU-type information treatment, participants chose lotteries with the highest payoff options, which also had higher risk. Our results on computational difficulty are not consistent, however, with other work finding that increasing computational difficulty (Arieli et al., 2011; Aimone et al., 2016a) or cognitive load (Deck and Jahedi, 2015; Deck et al., 2021) leads to a decreased willingness to accept risk.5 The next subsection directly explores the link between the decision-making process and participant decisions.
The results in this subsection can be summarized as follows:
Result 4: the high-EMV lottery is chosen less often when the task is presented vertically and gambles are more difficult to evaluate.
Result 5: the risky lottery is chosen more often when gambles are more difficult to evaluate.
3.3 Relationship between the decision-making process and decisions
In the preceding sections, we evaluated the effect of our two treatment variables on eye-movement patterns and choices. We now test links between participants' choices and their choice processes. For our choice process measure, we rely on the Payne Index (Payne, 1976; Payne et al., 1993). The Payne Index normalizes the difference between EU-type and CC-type eye movements by the total number of (nondiagonal) saccades. We calculate the mean Payne Index for each participant i as , where T = 100 is the number of choices per participant (after dropping the check trials). The values EUit and CCit thus represent the number of EU-type and CC-type eye movements for a given participant in a given round. We then create the indicator variable EU Type = 𝟙(Paynei > mediani∈NPaynei), which is equal to 1 if Paynei is greater than the median Payne Index over the N participants and 0 otherwise. A Payne Index closer to −1 indicates that participants make more CC-type eye movements, while a Payne Index that is closer to 1 indicates that participants make more EU-type eye movements.
In the analyses in Table 7, the dependent variables are indicators for “Risky Choice” (1 if participants chose the risky lottery, otherwise 0; Table 7, Panel A) and “High-EMV choice” (1 if participants chose the lottery with greater EMV, otherwise 0; Table 7, Panel B). The explanatory variables are “EU type,” defined as earlier, the difference in payoffs between the risky and safe lotteries (ΔPayoff), the difference in probabilities between the risky and safe lottery, the EMVs of the lotteries (risky and safe for when the dependent variable is “Risky Choice”; high or low when the dependent variable is “High-EMV Choice.” We included interaction terms between the indicator for EU-type behavior and the characteristics of the choices. In addition, we also include indicators for the difficult and vertical treatments, and their interaction, and the trial number.
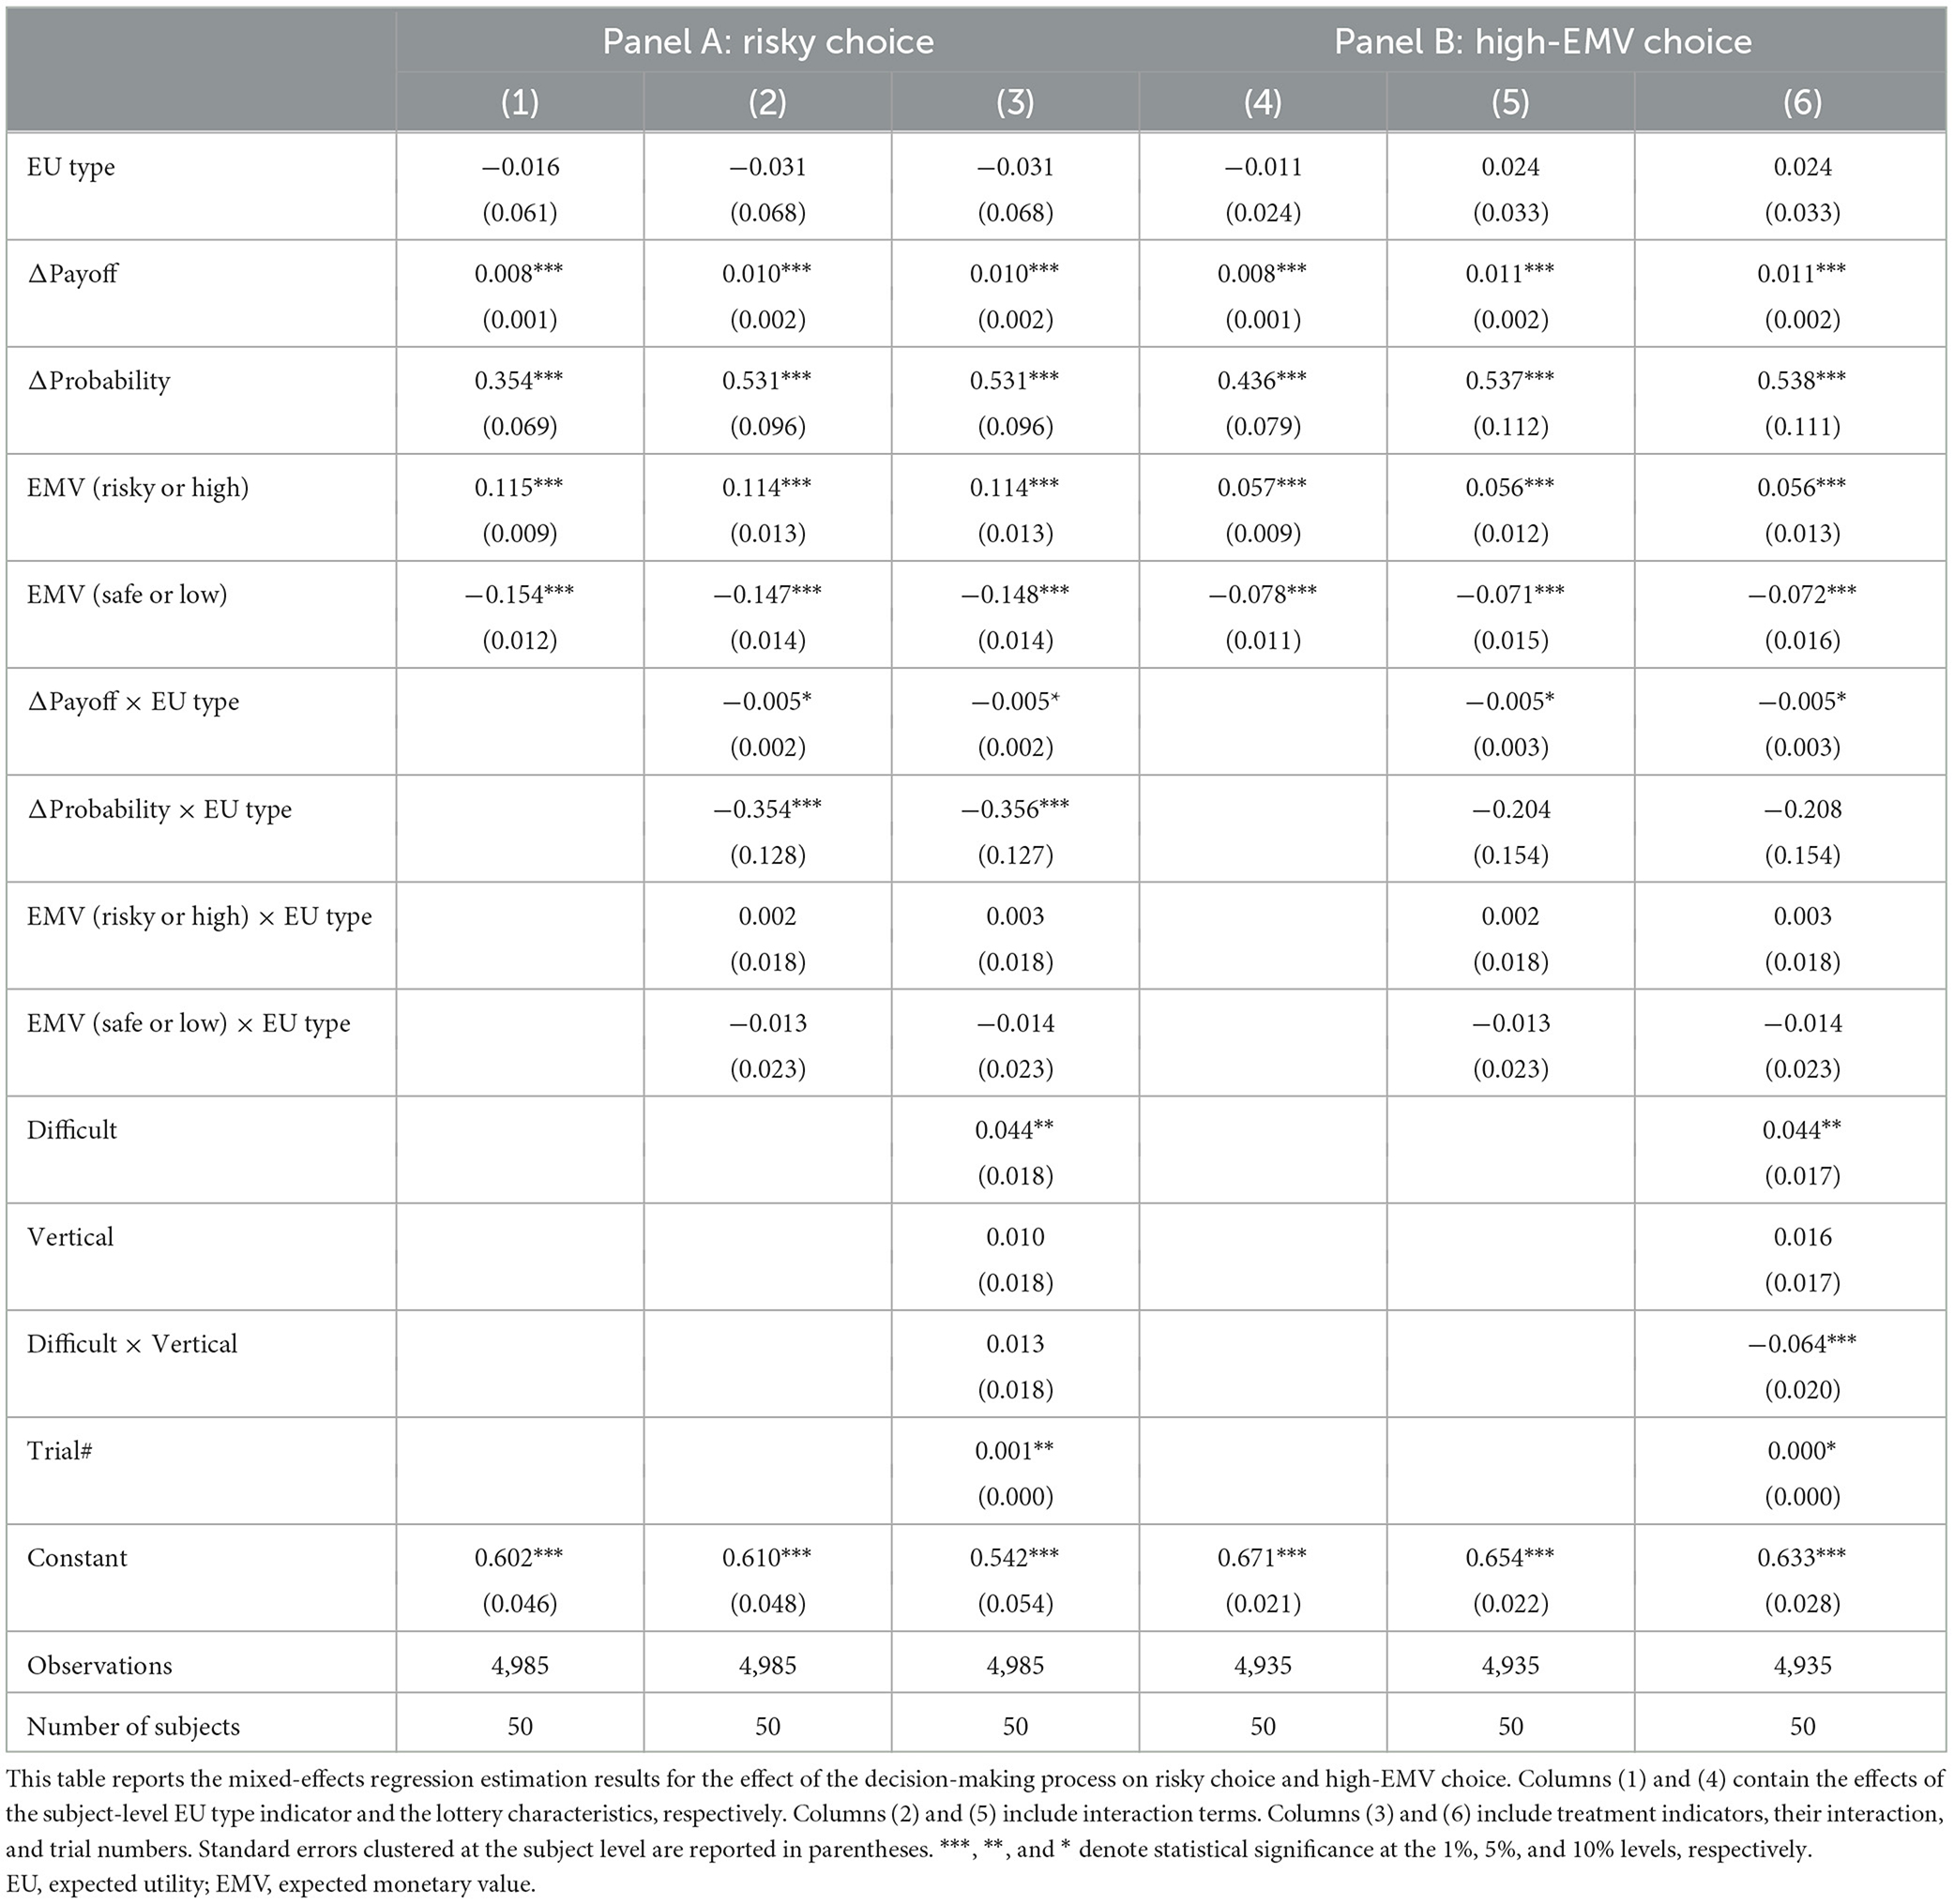
Table 7. Effect of decision-making process on choice.
In our base model, Model 1, the task-specific variables are all associated with the decision, but there is no direct effect of the EU type choice process variable. Model 2 interacts “EU type” with the trial-specific payoff and probability differences and the EMVs of the gambles. High EU type participants had a significantly lower influence of differences in payoff (p < 0.1) and probability (p < 0.01) on choosing the risky option. Model 3 introduces controls for the difficult and horizontal display conditions, their interaction, and the trial numbers. Importantly, the introduction of these controls confirms the robustness of the results, as the coefficient estimate for ΔProbability × EU type is virtually unchanged from Model 2.
The equivalent analyses in Models 4 through 6, where the dependent variable is whether the participant chose the high-EMV gamble, show similar main effects but only a marginally significant interaction effect between the ΔPayoff variable and the EU type (indicator) variable.
In the Supplementary Table S8, we report the results of an alternative regression specification that uses the mean Payne Index for each participant rather than the EU type median split indicator. The results are qualitatively similar: the interaction between ΔPayoff and the Payne Index is significant at the 5% level when the dependent variable is choosing the risky option. In addition, participants with greater Payne Indices appear to put lower weight the EMVs of safe (low) gambles when the dependent variable is “Risky Choice” or “High-EMV Choices.” These results are consistent with the previous conclusion that participants with greater Payne Indices (indicating more EU-type eye movements) weigh EU-type information more relative to CC-type information.
Thus, our final results on the relationship between the decision-making process and outcomes follow:
Result 6: participants with higher than median Payne Indices place greater weight on EU-type information in making risky choices.
4 Discussion
This study uses choice process data to provide insights into the dynamics of the risky decision-making process. Our approach combines methods from neuroscience, psychology, and economics, which enables a more complete understanding of the decision-making process. By examining a broader range of choice process and decision-making data, this research advances the ability to identify underlying mechanisms governing risky choice. This holistic approach contributes to the broader discourse on the integration of interdisciplinary methodologies in decision-making research (Fehr and Rangel, 2011).
A key finding of this work is the susceptibility of behavioral patterns to the complexity of calculations and task presentation formats. This implies that information collection and decision-making procedures are not fixed but rather adaptive, with individuals transitioning between expected utility and component comparison information collection procedures as external circumstances change. This finding challenges the assumption of a rigid decision-making framework and underscores the importance of factors beyond payoffs and probabilities when analyzing the risky choice process. In recent work using a task where participants could only view the payoff and probability for one of two lotteries at a time, participants were relatively more likely to choose the riskier lottery than when all information about both lotteries was available (Aimone et al., 2016b; Mittone and Papi, 2020). In other words, when a decision-maker's process is constrained, their decisions may be altered, a result that is consistent with the current study.
The influence of information presentation styles on decision-making processes, in particular, that horizontal presentation is associated with an increase of EU-type eye movements as well as an increased likelihood of selecting the high-EMV gamble is another important finding of this research. The distinction between vertical and horizontal lottery displays provides valuable insights into the role of reading habits and visual processing in risk assessment. This finding resonates with existing literature emphasizing the impact of presentation format on cognitive processing and decision outcomes (Dehaene et al., 1999; Trbovich and LeFevre, 2003). Recognizing the significance of presentation format, particularly in contexts where precise calculations are involved, can inform the design of decision-support tools and interventions.
Data availability statement
The datasets presented in this study can be found in online repositories. The data and analysis scripts that support the findings of this study are available through the Open Science Framework at doi: 10.17605/OSF.IO/Z83A9.
Ethics statement
All research procedures used in this article were reviewed and approved by the Institutional Review Boards of Virginia Tech (IRB #17–744) and Baylor University (IRB #1501194). The participants provided their written informed consent to participate prior to the beginning of the study.
Author contributions
XZ: Conceptualization, Data curation, Formal analysis, Investigation, Methodology, Project administration, Software, Validation, Visualization, Writing—original draft, Writing—review & editing. JA: Formal analysis, Investigation, Methodology, Validation, Writing—original draft, Writing—review & editing. AA: Data curation, Formal analysis, Investigation, Methodology, Validation, Writing—original draft, Writing—review & editing. FL: Investigation, Writing—review & editing. SB: Conceptualization, Investigation, Methodology, Validation, Writing—original draft, Writing—review & editing. AS: Conceptualization, Formal analysis, Funding acquisition, Investigation, Methodology, Project administration, Resources, Software, Supervision, Validation, Writing—original draft, Writing—review & editing.
Funding
The author(s) declare financial support was received for the research, authorship, and/or publication of this article. Funding was provided by the Virginia Tech Department of Economics.
Acknowledgments
We thank Brooks Casas, Paul Glimcher, Chun-Lei Yang, and participants at the 2019 Society for Neuroeconomics Annual Meetings for their helpful suggestions.
Conflict of interest
The authors declare that the research was conducted in the absence of any commercial or financial relationships that could be construed as a potential conflict of interest.
The author(s) declared that they were an editorial board member of Frontiers, at the time of submission. This had no impact on the peer review process and the final decision.
Publisher's note
All claims expressed in this article are solely those of the authors and do not necessarily represent those of their affiliated organizations, or those of the publisher, the editors and the reviewers. Any product that may be evaluated in this article, or claim that may be made by its manufacturer, is not guaranteed or endorsed by the publisher.
Supplementary material
The Supplementary Material for this article can be found online at: https://www.frontiersin.org/articles/10.3389/frbhe.2024.1321301/full#supplementary-material
Footnotes
1. ^For a summary of demographic information for the experiment participants, see Supplementary Table S1.
2. ^There were minor variations, for example, one stimulus pair had one lottery that paid $15 with 20% probability; another had a lottery that paid $30 with 15% probability, both of which we considered easy to calculate.
3. ^Out of 50 participants, 23 answered all 20 check questions correctly. The breakdown of correct answers for the remaining participants is as follows: 18 participants answered 19 questions; two participants answered 18 questions; one participant correctly answered 17, 16, and 14 questions, respectively; and three participants answered 15 questions. We conducted separate statistical analyses on the check decisions of both the difficult and the easy blocks, with the results detailed in Supplementary Figure S1. The accuracy rate of 96.8% in the easy block significantly exceeds the 92.0% accuracy rate observed in the difficult block (p = 0.015).
4. ^Another approach would have been to create four blocks in which presentation style was held constant and gamble difficulty was randomized within a block. We note that because we have the same type of task uncertainty in all of our treatments, any initial eye movement needed to “orient” a participant to information presentation should be unchanging across the experiment, thus having no impact on our within-subject analysis. Nonetheless, it would be interesting to compare results when participants know the task difficulty and not the presentation style with those where they know the presentation style but not the task difficulty.
5. ^However, see Ball et al. (2023), who did not replicate the results of Deck and Jahedi (2015).
References
Aimone, J. A., Ball, S., and King-Casas, B. (2016a). It's not what you see but how you see it: using eye-tracking to study the risky decision-making process. J. Neurosci. Psychol. Econ. 9:137. doi: 10.1037/npe0000061
Aimone, J. A., Ball, S., and King-Casas, B. (2016b). ‘Nudging' risky decision-making: the causal influence of information order. Econ. Lett. 149, 161–163. doi: 10.1016/j.econlet.2016.10.030
Arieli, A., Ben-Ami, Y., and Rubinstein, A. (2011). Tracking decision makers under uncertainty. Am. Econ. J. Microecon. 3, 68–76. doi: 10.1257/mic.3.4.68
Ashby, N. J. (2017). Numeracy predicts preference consistency: deliberative search heuristics increase choice consistency for choices from description and experience. Judgm. Decis. Mak. 12, 128–139. doi: 10.1017/S1930297500005672
Ball, S., Katz, B., Li, F., and Smith, A. (2023). The effect of cognitive load on economic decision-making: a replication attempt. J. Econ. Behav. Organ. 210, 226–242. doi: 10.1016/j.jebo.2023.03.018
Bettman, J. R. (1975). Information integration in consumer risk perception: a comparison of two models of component conceptualization. J. Appl. Psychol. 60:381. doi: 10.1037/h0076623
Campbell, J. I., and Clark, J. M. (1992). Cognitive number processing: an encoding-complex perspective. Adv. Psychol. 91, 457–491. doi: 10.1016/S0166-4115(08)60894-8
Charness, G., and Chemaya, N. (2023). Repeated experience and consistent risk preferences. Econ. Lett. 233:111375. doi: 10.1016/j.econlet.2023.111375
Deck, C., and Jahedi, S. (2015). The effect of cognitive load on economic decision making: a survey and new experiments. Eur. Econ. Rev. 78, 97–119. doi: 10.1016/j.euroecorev.2015.05.004
Deck, C., Jahedi, S., and Sheremeta, R. (2021). On the consistency of cognitive load. Eur. Econ. Rev. 134:103695. doi: 10.1016/j.euroecorev.2021.103695
Dehaene, S., Spelke, E., Pinel, P., Stanescu, R., and Tsivkin, S. (1999). Sources of mathematical thinking: behavioral and brain-imaging evidence. Science 284, 970–974. doi: 10.1126/science.284.5416.970
DeStefano, D., and LeFevre, J.-A. (2004). The role of working memory in mental arithmetic. Eur. J. Cogn. Psychol. 16, 353–386. doi: 10.1080/09541440244000328
Fehr, E., and Rangel, A. (2011). Neuroeconomic foundations of economic choice–recent advances. J. Econ. Perspect. 25, 3–30. doi: 10.1257/jep.25.4.3
Fiedler, S., and Glöckner, A. (2012). The dynamics of decision making in risky choice: an eye-tracking analysis. Front. Psychol 3:335. doi: 10.3389/fpsyg.2012.00335
Gelman, A., and Hill, J. (2006). Data Analysis Using Regression and Multilevel/Hierarchical Models. Cambridge, MA: Cambridge University Press. doi: 10.1017/CBO9780511790942
Glickman, M., Sharoni, O., Levy, D. J., Niebur, E., Stuphorn, V., Usher, M., et al. (2019). The formation of preference in risky choice. PLoS Comput. Biol. 15:e1007201. doi: 10.1371/journal.pcbi.1007201
Glöckner, A., Hilbig, B. E., Henninger, F., and Fiedler, S. (2016). The reversed description-experience gap: disentangling sources of presentation format effects in risky choice. J. Exp. Psychol. Gen. 145:486. doi: 10.1037/a0040103
Harrison, G. W., and List, J. A. (2004). Field experiments. J. Econ. Lit. 42, 1009–1055. doi: 10.1257/0022051043004577
Hirmas, A., Engelmann, J. B., and van der Weele, J. (2023). Individual and Contextual Effects of Attention in Risky Choice. Working paper. doi: 10.2139/ssrn.3834381
Lee, D. G., D'Alessandro, M., Iodice, P., Calluso, C., Rustichini, A., Pezzulo, G., et al. (2023). Risky decisions are influenced by individual attributes as a function of risk preference. Cogn. Psychol. 147:101614. doi: 10.1016/j.cogpsych.2023.101614
Mittone, L., and Papi, M. (2020). Inducing alternative-based and characteristic-based search procedures in risky choice. Judgm. Decis. Mak. 15, 371–380. doi: 10.1017/S1930297500007178
Orquin, J. L., Lahm, E. S., and Stojić, H. (2021). The visual environment and attention in decision making. Psychol. Bull. 147:597. doi: 10.1037/bul0000328
Pachur, T., Schulte-Mecklenbeck, M., Murphy, R. O., and Hertwig, R. (2018). Prospect theory reflects selective allocation of attention. J. Exp. Psychol. Gen. 147, 147–169. doi: 10.1037/xge0000406
Payne, J. W. (1976). Task complexity and contingent processing in decision making: an information search and protocol analysis. Organ. Behav. Hum. Perform. 16, 366–387. doi: 10.1016/0030-5073(76)90022-2
Payne, J. W., Bettman, J. R., and Johnson, E. J. (1993). The Adaptive Decision Maker. Cambridge, MA: Cambridge University Press. doi: 10.1017/CBO9781139173933
Sheng, F., Wang, R., Liang, Z., Wang, X., and Platt, M. L. (2023). The art of the deal: deciphering the endowment effect from traders' eyes. Sci. Adv. 9:eadf2115. doi: 10.1126/sciadv.adf2115
Shimojo, S., Simion, C., Shimojo, E., and Scheier, C. (2003). Gaze bias both reflects and influences preference. Nat. Neurosci. 6, 1317–1322. doi: 10.1038/nn1150
Smith, S. M., and Krajbich, I. (2019). Gaze amplifies value in decision making. Psychol. Sci. 30, 116–128. doi: 10.1177/0956797618810521
Stewart, N., Hermens, F., and Matthews, W. J. (2016). Eye movements in risky choice. J. Behav. Decis. Mak., 29, 116–136. doi: 10.1002/bdm.1854
Stillman, P. E., Krajbich, I., and Ferguson, M. J. (2020). Using dynamic monitoring of choices to predict and understand risk preferences. Proc. Nat. Acad. Sci. 117, 31738–31747. doi: 10.1073/pnas.2010056117
Su, Y., Rao, L.-L., Sun, H.-Y., Du, X.-L., Li, X., Li, S., et al. (2013). Is making a risky choice based on a weighting and adding process? An eye-tracking investigation. J. Exp. Psychol. Learn. Mem. Cogn. 39, 1765. doi: 10.1037/a0032861
Trbovich, P. L., and LeFevre, J.-A. (2003). Phonological and visual working memory in mental addition. Mem. Cogn. 31, 738–745. doi: 10.3758/BF03196112
Tversky, A., and Kahneman, D. (1992). Advances in prospect theory: cumulative representation of uncertainty. J. Risk Uncertain. 5, 297–323. doi: 10.1007/BF00122574
Tversky, A., Sattath, S., and Slovic, P. (1988). Contingent weighting in judgment and choice. Psychol. Rev. 95, 371. doi: 10.1037/0033-295X.95.3.371
Wu, N., Zhang, X., and Zhou, W. (2023). The impacts of superstition on risk preferences and beliefs: evidence from the Chinese zodiac year. China Econ. Rev. 81:102043. doi: 10.1016/j.chieco.2023.102043
Yang, X., and Krajbich, I. (2023). A dynamic computational model of gaze and choice in multi-attribute decisions. Psychol. Rev. 130:52. doi: 10.1037/rev0000350
Keywords: expected utility theory, component comparison theory, risky decision-making, eye tracking, information presentation, lottery choice
Citation: Zhang X, Aimone JA, Alsharawy A, Li F, Ball S and Smith A (2024) The effects of task difficulty and presentation format on eye movements in risky choice. Front. Behav. Econ. 3:1321301. doi: 10.3389/frbhe.2024.1321301
Received: 13 October 2023; Accepted: 31 January 2024;
Published: 15 March 2024.
Edited by:
Claudia Civai, London South Bank University, United KingdomReviewed by:
Luca Polonio, University of Milano-Bicocca, ItalyAlejandro Hirmas, University of Amsterdam, Netherlands
Copyright © 2024 Zhang, Aimone, Alsharawy, Li, Ball and Smith. This is an open-access article distributed under the terms of the Creative Commons Attribution License (CC BY). The use, distribution or reproduction in other forums is permitted, provided the original author(s) and the copyright owner(s) are credited and that the original publication in this journal is cited, in accordance with accepted academic practice. No use, distribution or reproduction is permitted which does not comply with these terms.
*Correspondence: Alec Smith, alecsmith@vt.edu