Spending on farms ripples into the region: agritourism impacts
 Purushottam Dhungana
  Aditya R. Khanal*
- Department of Agricultural and Environmental Sciences, Tennessee State University, Nashville, TN, United States
Introduction/Purpose: Agritourism is gaining popularity throughout the United States and is an important part of rural and regional development. However, the economic contributions of agritourism, the interface of agriculture and tourism, has received limited attention in regional impact estimation studies. This study was purposed to estimates the regional economic impact of visitor spending in agritourism farms in Tennessee.
Methods: Primary survey data was used from sampled farms in Tennessee and secondary industry-level data. Economic impacts—direct, indirect, and induced—are estimated based on the economic input-output modeling application (IMPLAN) and the social accounting matrix framework.
Result and discussion: We found that an estimated $65 million from visitors' direct spending in agritourism farms contributes to the total industry output of $118.54 million in Tennessee. Additionally, we presented total value added, jobs created, labor incomes, and taxes generated through direct, indirect, and induced effects attributable to visitors' spending in agritourism farms. Our findings indicate that the expansion of agritourism could bring economic development at both the farm and state level, particularly in states like Tennessee, where agriculture is an important industry and tourism is expanding.
Introduction
Farms are increasingly exploring alternative activities, including agritourism, to remain competitive in the farming business (Thilmany and Ahearn, 2013; Hardesty et al., 2014). While most farms are generating profits through agritourism activities, farmers consider agritourism to be crucial for the ongoing operation of their businesses rather than for earning higher profits (Tew and Barbieri, 2012). According to USDA (2019), farm agritourism revenue increased by more than three times between 2002 and 2007, and agritourism revenue grew from $704 million in 2012 to nearly $950 million in 2017, after adjusting for inflation. The nature of activities classified as agritourism and the definition of agritourism varies slightly across different research studies. However, the majority of definitions adopted by literature (McGehee, 2007; Bagi and Reeder, 2012) consider agritourism as an enterprise or operation that consists of an integrated tourism component in a working farm. USDA (2022) broadly defines agritourism as a commercial venture that connects agriculture with tourism to attract visitors to farms for education or entertainment purposes while generating revenue for farm owners. The goal of agritourism is to bring the public to farms and generate additional income by offering activities like farm tours, pumpkin patches, pick-your-own, fishing, wagon rides, horse riding, agricultural/rural heritage museums, bed and breakfast, petting zoos, corn mazes, festivals and fairs, and wineries. The history of agritourism is traced back to the late 18th century (Bruch et al., 2005); however, its popularity and commercialization in the US are relatively recent. As urbanization grows, agritourism now has even more potential to offer rural experiences to urban dwellers and promote culture and knowledge.
In general, US residents exhibit a high affinity for tourism and are willing to pay for tourism services, as evidenced by the heavy reliance of Canada and Mexico's tourism industries on US visitors—more than 500 million annual domestic trips in Canada and Mexico are made by US visitors (Gartner, 2004). Similarly, when visitors perceive the user fees as fair and are supportive of spending in areas that align with their preferences, they are also willing to pay these fees (Chung et al., 2011). In terms of most demographic characteristics, agritourists are not significantly different from other rural tourists (Ainley and Smale, 2009). The demand for agritourism appears to be primarily driven by local residents (Bernardo et al., 2004; Jensen et al., 2006), while there is also notable interest from international visitors like Chinese tourists, who express a willingness to pay for rural food and lodging experiences in the US (Wu et al., 2020). Agritourism helps rural farming communities earn additional income by bringing visitors to their farms from different places and locations and helps to increase the region's economic activities. Therefore, agritourism boosts the rural economy and helps to protect rural farmland, addressing the threats posed by large retailers and global food chains on rural life to some extent (Gartner, 2004). Furthermore, agritourism could help to add value to crops and livestock products and increase the competitive power of family farms by providing a supplementary source of income. Agritourism combines elements of both the tourism industry and the agriculture industry. A study conducted by Omobitan and Khanal (2022) found that small farms in Tennessee can cover less than half of farm expenses from money generated from the sale of agricultural products while remaining expenses are met through earnings from off-farm work, credit, government support, and other sources. Khanal and Mishra (2014) found that diversification is key for small farms to sustain their farming business. Thus, agritourism is one of the promising and economically feasible on-farm diversification options for small farms (Joo et al., 2013; Khanal and Mishra, 2014; Whitt et al., 2019; Holland et al., 2022). Most farms that are already engaged in agritourism activities do these activities primarily for economic reasons (Nickerson et al., 2001). Findings show that additional income generated through agritourism enables farms to remain viable in the farming business during poor production seasons (Barbieri and Mshenga, 2008; Tew and Barbieri, 2012). Therefore, agritourism is a feasible, sustainable method of farm diversification for small and medium sized farms, and family farms (Holland et al., 2022).
According to the Agritourism System Model proposed by McGehee (2007), the agritourism system comprises dynamic activities between agritourism providers, agritourism visitors, and Destination Marketing Organizations (DMOs). The system mainly includes producers willing to offer agritourism activities, visitors, marketing strategies, and Destination Marketing Organizations (DMOs) in the industry (McGehee, 2007; Carpio et al., 2008; Wu et al., 2020), which can pose both opportunities and challenges. In Tennessee, the Pick Tennessee Products and Tennessee Agritourism Association play a role similar to that of a Destination Marketing Organization (DMO) by actively promoting and supporting the marketing efforts of local agricultural products and agritourism activities. The Tennessee Department of Agriculture is promoting agritourism through educational and cost-sharing program (Jensen et al., 2013) in collaboration with several organizations aiming to educate producers about agritourism. Tennessee Agritourism Association and Pick Tennessee products are some of the efforts to expand agritourism within rural communities, promote local products, and provide information to visitors about agritourism venues.
We recognize three main outlooks and gaps based on overall agritourism-related previous studies and efforts in Tennessee. First, researchers (Khanal and Mishra, 2014; Holland et al., 2022) and government stakeholders discuss agritourism as a potential feasible on-farm diversification strategy in Tennessee. Though few previous studies in Tennessee have discussed the general characteristics of the visitors (Bernardo et al., 2004), the specific agritourism activities offered in small farm operations in Tennessee have not been closely analyzed and examined. Second, numerous promotional efforts have been made to encourage farms to adopt agritourism and encourage people to visit agritourism destinations. However, information on the current status of visitors and the amount of visitor expenditure on agritourism operations is lacking. Third, the effect of visitor expenditure on the Tennessee economy and regional development is unknown. Findings and investigation on these three aspects will provide insight into policymakers and researchers and help them understand the consequences and benefits of agritourism activities for Tennessee. Our study builds on these previous efforts and addresses these research gaps by estimating visitor numbers, expenditure per visitor, and the regional economic impact of agritourism in Tennessee.
The remaining content of this paper is structured under four sections. The literature review section critically evaluates previous works on agritourism. The data and methods section discusses primary and secondary data used and provides an overview of an input-output-based model (IMPLAN) on the estimation of direct, indirect, and induced impacts. The results and discussion section presents and discusses findings on visitor numbers, visitor spending, and the output of the impact estimations. Finally, the conclusion section summarizes the key findings and discusses the broader implications of the research.
Literature review
While the United States has been lagging in the development of the agritourism industry compared to Europe and Asia, there has been a notable increase in the number of agritourism farms in recent years. Researchers have represented this growing industry and presented agritourism system models (McGehee, 2007). A number of studies have focused on the producer side (Bagi and Reeder, 2012; Tew and Barbieri, 2012) and the consumer side (Carpio et al., 2008; Melstrom and Murphy, 2018; Wu et al., 2020). McGehee's (2007) agritourism system model proposes that both agritourists and agritourism providers are motivated by economic and ideological factors to engage in agritourism activities. To ensure the effective functioning of the agritourism system, it is crucial to facilitate proper communication and remove any obstacles between them. Producers with larger land areas, nearer to central cities, with higher education, and located in rocky mountain regions and southern plains are more likely to be involved in agritourism (Bagi and Reeder, 2012). A study by Melstrom and Murphy (2018) found that agritourism destinations nearer to metropolitan areas and those owned by college graduates are likely to draw more visitors. In contrast to this, Carpio et al. (2008) found that people living in urban areas are less likely to visit a farm. Further, Carpio et al. (2008) also found that larger family size and the presence of children (s) under 6 years old increases the probability of households visiting agritourism destinations. Carpio et al. (2008) estimated a mean price elasticity of −0.43 and income elasticity of 0.24 associated with agritourism visits and posits that the agritourism visitor in the U.S., on average, makes 10.3 trips per year.
While several studies have focused on producer motivation to offer agritourism activities and visitors' motives for visiting agritourism destinations, very few studies (Jensen et al., 2006, 2013; Das and Rainey, 2010; Magnini, 2017) have estimated visitor numbers, visitor spending, and the resulting economic impact of agritourism in the state or regional economy. The economic impact estimation of agritourism is particularly challenging because there is no specific sector identified as agritourism in the formal industry classification systems, as it is listed neither under agriculture nor under tourism. Note that commonly used and referenced industry classification systems for industry and sectors in the US include the Standard Industry Classification (SIC) and North American Industry Classification System (NAICS). Therefore, there have been mixed approaches across studies on what sectors to include in agritourism. For example, Das and Rainey (2010), in Arkansas-specific estimation, used the data on the number of visitors and total agritourism expenditure dividing total visitors into two groups: those involved in on-farm hunting and those involved in any other related activities. With this, findings suggested that agritourism generated around $120 million directly in Arkansas Delta Byways in 2007, in which on-farm hunting accounted for 90% of expenditure. Further, they predicted that agritourism visitors will continue to increase and agritourism will create more jobs and assist the farming community in the region. Regional impact estimation studies use input-output-based models, which are presented in the methods section. One of the commonly used regional economic impact estimation systems is IMPLAN (Economic Impact Analysis for Planning; https://implan.com/), a regional economic impact assessment software system that also maintains selected industry and sector-specific data (more in the data and methods section).
In Tennessee, Jensen et al. (2006) estimated the economic impact of visitor spending on Tennessee's economy. They used responses from visitor surveys and used 2005 IMPLAN data and software in economic impact analysis. Jensen et al. (2006) found that the average expenditure per visitor was $27.08 for winery farms and $14.35 for non-winery farms. The medium number of agritourism visitors per farm per year was 2,000 for non-winery farms and 10,800 for winery farms. The direct economic impact associated with visitor spending was estimated at ~$17 million, while total industry output was estimated at $31 million, with a total value added of $16.64 million. In the study by Jensen et al. (2006), attractions like on-farm bed and breakfast, on-farm vacations, museums, and Christmas tree farms were not included in the estimation of economic impacts. Following up on their previous study, Jensen et al. (2013) surveyed 171 farm operators in Tennessee and found that agritourism operators earned $35.12 from each visitor, of which 63.4% was from the purchase of farm products, 13.4% from admission fees, 4% from souvenirs, 3.1% from concessions, and 15.19% from other activities. The study estimated that the direct contribution of visitor spending to Tennessee's economy is around $34 million, which is double the previous estimates of Jensen et al. (2006).
A more recent impact study of agritourism was conducted by Magnini (2017), who estimated the economic impact of agritourism in the state of Virginia, the State sharing the border with Tennessee. Magnini's (2017) study considers visitors' on-farm and off-farm spending and estimates total impact. The study found that on-farm visitors' spending directly contributes $216.3 million and off-farm spending contributes $1.093 billion (~$3 per person in the US) to the state's economy and puts $1.2 billion (~$4 per person in the US) as the direct total effect and $2.2 billion (~$7 per person in the US) as the total industry output contribution of visitors. However, one should note that Magnini's (2017) study includes agritourism visitors' off-farm spending, such as visitor spending on outside hotels and motels, off-farm food service establishments, and other sports events, in addition to the direct spending of visitors in agritourism farms. Therefore, the greater contribution comes from the tourism effects outside the farm rather than visitor spending in agritourism farms.
Overall, past impact studies, including a few agritourism impact studies (Jensen et al., 2006, 2013; Magnini, 2017), have used selected sectors and sub-sectors listed under broader agriculture sectors to estimate regional impacts and multiplier effects. The agritourism income per farm calculation is important in impact estimation because it is typically used to make projections about aggregate agritourism income by multiplying it by the number of such farms in the region. Then, the impacts are estimated using the selected industry's relationship with other related industries to account for spillover and ripple effects to both production and market spectrum linkages in the economy.
Tennessee's agritourism industry has been expanding in recent years with the development of new agritourism businesses. Several public and private institutions are making efforts to connect agritourism farms with visitors. Tennessee has also experienced an expansion of metropolitan areas and growth in the tourism sector with direct and indirect market expansions in the last decade. These have implications for agritourism growth, which can be investigated with recent data. Khanal et al. (2020), using county-level data and spatial regression in Tennessee, found significant effects of structural factors such as demographics and educational, economic, and cultural capital factors on the number and location of agritourism establishments. Depending on the location in Tennessee (east, middle, and west), the top three most common agritourism activities in recent years include hosting weddings on the farm, bed and breakfast on the farm, pumpkin patches, and corn and hay mazes (Khanal et al., 2020).
Our study contributes to agritourism and regional economic impact studies in at least two ways. First, it estimates the recent economic impact using the latest data, which captures the most recent growth in the sector, market, and agritourism farms in Tennessee. Second, unlike previous studies in Tennessee (Jensen et al., 2006, 2013), we directly addressed the agritourism incomes of the farms and the estimated weekly visitors per farm rather than relying on the visitors' or farms' responses according to recalled estimates of visitor spending per farm. Therefore, our study is likely to better capture the farm-induced or farm-surrounded spillover or ripple effects in the economy—the aspect more important for agricultural policymakers. In order to assist current agritourism operators, researchers and scholars, and related stakeholders, our study provides updated pictures of visitors and agritourism, farm incomes, visitor spending in agritourism operations, and the economic impact of these on the state's economy. Documentation and quantification of the impacts are expected to facilitate the promotion of agritourism farms and the agricultural sector and invite more entrepreneurs and farmers to new business ventures in the agriculture and tourism interface.
Data and methods
Using the contact information maintained by Pick Tennessee Products and the Tennessee Agritourism Association, a primary survey was conducted between November 2019 and January 2020 to collect data from farms and agricultural operations, including agritourism operations, from the east, west, and middle region of Tennessee. A survey questionnaire was created using Qualtrics, and links were distributed via email to 1,139 farmers. Two reminder emails were sent to the farmers who did not respond to the initial email. The first one was emailed 2 weeks after the initial email, and the other 7–10 days after the first reminder email. The primary survey's main purpose was to gather information about agricultural and farm activities, agritourism operations, the number of visitors to the farms, and their assets, revenues, and incomes. In particular, farms' income from agritourism, number of visitors, and average spending information from the primary survey are used in the estimation of the economic impact of agritourism. A total of 160 responses with a response rate of 14.05% were collected, and 139 suitable full responses were used in further analysis and calculations.
The questionnaire asked about the types of agritourism attractions offered on their farms. As presented in Figure 1, commonly offered agritourism-related activities in our sample farms include farm and school tours, retail farm stands, event hosting, on-farm entertainment like hayrides or wagon rides, selling gifts and floral products, and pick-your-own. These results were similar to the findings of Jensen et al. (2013) and Rich et al. (2016). Based on the frequency distribution of these offerings, we identify admission fees, product purchases, concessions, souvenirs, festivals and wedding events, hayrides or wagon rides, and games and activities inside the venue as major expenditure categories.
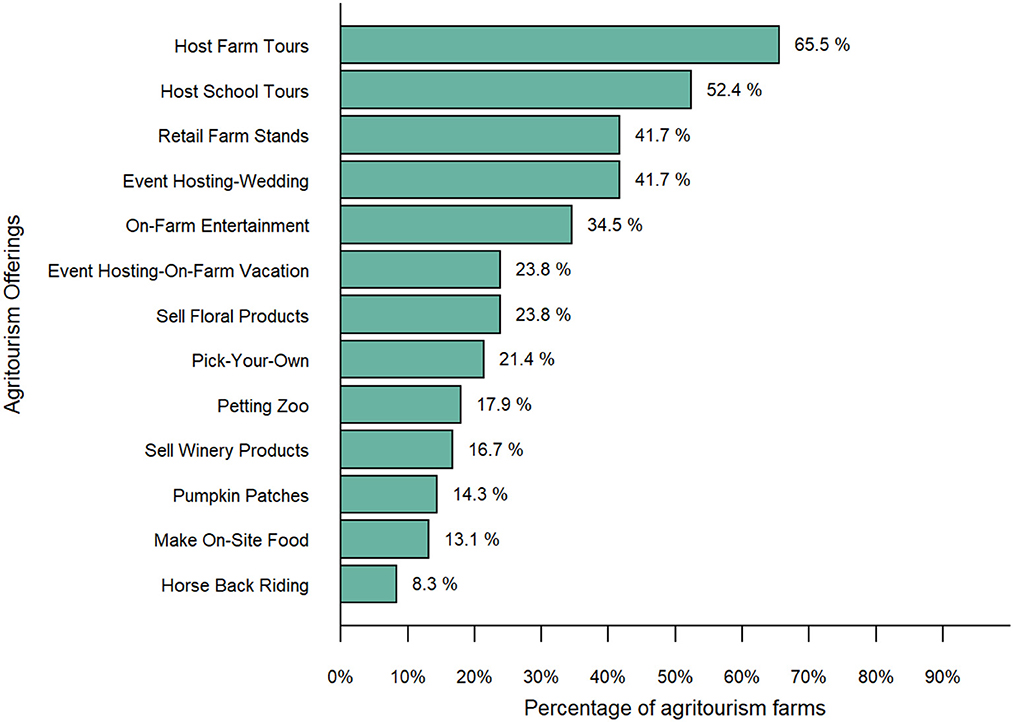
Figure 1. Type of agritourism attractions offered by agritourism farms.
We conducted economic modeling and impact estimations using IMPLAN software and its industry-level data for 2019. As described in its data overview report (IMPLAN, 2023), IMPLAN uses multiple secondary sources to maintain its industry database in the input-output economic modeling system. Main raw data sources include the data from economic and statistical service agencies of the US government: (a) Bureau of Economic Accounts (BEA) for national income and product accounts, employment, GDP, state and county level tax, county-level personal income, regional economic accounts, (b) US Department of Agriculture (USDA)'s Census of Agriculture, National Agricultural Statistics Service, and Economic Research Service, (c) Bureau of Labor Statistics (BLS) for wage and salary incomes, county-level industry, industry information by classification systems, consumer expenditure survey, and (d) US Census Bureau for county business patterns, annual survey of manufacturers, revenue and spending by state, county, and city governments (IMPLAN, 2023).
To project the economic impact, total expenditure was allocated to different sectors in IMPLAN. The sectors identified to match the IMPLAN-listed sector are presented in Table 1. Admission fees, which constitute major expenditure for farm visits, farm tours, and school tours are represented by sector 504, other amusement and recreation. Expenditure from product purchase was classified into sector 2, grain farming; sector 3, vegetable and melon farming; sector 4, fruit farming; sector 6, greenhouse, nursery, and floriculture; and sector 106, wineries. Grain farming represents production from corn mazes, and retail farm stands. Vegetable and melon farming represents production from pumpkin patches, retail farm stands, and pick-your-own. Fruit farming represents retail farm stands and pick-your-own. Similarly, sector 6 represents selling floral products and sector 106 represents selling winery products. Sector 511, all other food and drinking places, and sector 411, general merchandise stores, represent expenditures for concessions and souvenirs. Other remaining expenditure was classified equally into sector 420, scenic and sightseeing transportation and scenic activities for transportation, representing hayrides or wagon rides; sector 500, promoters of performing arts and sports and agenda for public figures, representing festivals and wedding events; and sector 504, other amusement and recreation industries representing games and activities inside venues.

Table 1. Definition of terms IMPLAN uses in the regional economic models.
Input-output model
After estimating total direct spending (Equation 8), these numbers were inputted into IMPLAN (Impact Analysis for Planning), a ready-to-use social accounting matrix framework to estimate total economic impact. It has been frequently used in many previous impact analysis studies (Bernardo et al., 2004; Jensen et al., 2013; Santos et al., 2016; Zendehdel et al., 2021) to estimate the effects of local changes due to agritourism activities on the region or state economy. IMPLAN is based on the Input-Output model and uses a regional social accounting system to provide total industry output, employment, and value added for over 500 industries. Input-output models analyze the inter-industry flow of products for a particular economic area. Leontief (1936) developed this model for the United States economy, showing how output from one sector becomes input for another sector. In mathematical notation, the Input-Output model consists of a system of n linear equations with n unknowns. Therefore, matrix representation is used for showing this inter-industry relationship, where columns represent inputs to a sector and rows represent outputs from the sector. Consider an economy with n sectors with corresponding outputs A1, A2, A3, ……., An. The total production T is equal to the sum of all sectors' production. Here, sectors are interdependent, such that output from one sector is used as input for other sectors (intermediate output). The rest of the total production is the final demand from households, government purchases, private purchases, and exports. Therefore, total industry demand is the sum of intermediate output and final consumer demand. Let output be denoted by A, inputs by W, and consumer demands by Y. For instance, if the total output of sector 1 is A1, then w11 is the portion of output of sector 1 that is used as input for sector 1. In the same way, w12 represents the portion of output from sector 1 that goes into sector 2 and w21 represents the portion of output from sector 2 that is used as input for sector 1. Similarly, Y1, Y2, Y3,……Yn represents the portion of the output from 1,2, 3,….n sectors demanded by final consumers, respectively.
Collecting these, let's suppose , , and .
Equation (1) can be written as,
where i represents column vector. Assume that for one unit of the final product to be manufactured in sector j, it must use αij units from sector i, where αij is a technical coefficient, such that (see Miller and Blair, 2009). So, the final demand for the product of sector i is:
Matrix representation for Equation (3) can be represented as:
where X is a sector-by-sector technical coefficient matrix, A is a vector of total output of all sectors, and Y is the vector of final consumer demand.
Solving for the output, we can get Equation (5).
where I is the Identity matrix, (I − X)−1 matrix is also called Leontief Inverse and represents the level of regional production in each industry due to an increase of final demand from other industry. Therefore, this inverse matrix is also called Leontief multiplier matrix (Choi and Johnson, 2014). For any sector i, Equation (5) can be presented as Ai = (I-X)−1Yi which gives the output for industry that is required to meet the final demand of industry i.
Direct impacts, indirect impacts, induced impacts, and multipliers
IMPLAN uses the Leontief Production Function (LPF) to model the relationship between the inputs and outputs of industries. In Table 1, we present the definitions of different terminologies used and assumed in IMPLAN models. Output is the value of total annual production of industry and is calculated by adding intermediate inputs and value added (Clouse, 2020c). Intermediate inputs are the outputs of an industry that are purchased by businesses to use as inputs to produce goods and services rather than being consumed by households. Apart from purchasing inputs from other industries or using their own output as input, a sector or industry also pays for labor, capital, and other inputs like inventoried items, which are collectively called value added in sector (Miller and Blair, 2009). So, value added is the sum of employee compensation, proprietor income, taxes on production and imports, and realized profits (other property income) (Lucas, 2020). Labor income is the sum of employee compensation, which includes total payroll costs and proprietor income, including payments earned by self-employed individuals and tax-exempt cooperatives (Clouse, 2020a). In IMPLAN, employment represents a mix of wage and salary, with employees and proprietors working either full-time or part-time (Clouse, 2022a).
The total impact of visitor spending can be broken down into direct effects, indirect effects, and induced effects. Direct impacts are the sets of expenditures made by producers/consumers as a result of an activity or policy and are applied to the Input-Output model for impact analysis (Demski, 2020). In the case of agritourism, direct impact constitutes the sum of expenditure made by all visitors at Tennessee agritourism venues. Indirect impacts, on the other hand, comprise the expenditure made by the agritourism operations or businesses to purchase inputs from other related industries and businesses within the same region (Demski, 2020)—for example, the expenditure made to purchase seeds, tractors, intermediate inputs, and various other equipment required for the agritourism business. The direct and indirect effects increase the incomes of participating households related to the input or output sector of agritourism. These additional incomes trigger the households' additional spending in many sectors. Increased spending on multiple sectors by the households' increased incomes are estimated as induced impacts.
Using the estimates of direct, indirect, and induced impacts, two specific types of multipliers are calculated. Multipliers are the basis of I-O models and provide a measure of interdependence between the targeted industry and the rest of the local economy. Multipliers represent the rate of change in output, employment, labor income, or value added in the local economy given the change in the corresponding variables in the targeted industry. Results from IMPLAN are used to calculate the Type I and Type SAM (Social Accounting Matrix) multipliers. Type SAM multipliers are more common and include the effects of household spending on the local economy. Type SAM multipliers are calculated as
Type I multipliers include only indirect effects, i.e., business-to-business purchases, and exclude the effect of local household spending. This multiplier is calculated as
In general, multiplier effect of spending can be used to illustrate overall economic impact on the regional economy, showing how a $1 spending in agritourism sector can generate a substantial ripple effect across interconnected industries.
Results and discussion
Estimation of total visitor expenditure
Our survey questionnaire collected information from agricultural farm operators about their partial or full involvement in tourism and recreation-related activities to generate additional income on farms. Among 139 sampled responses, 61.30% of respondents fully or partially involved their farm in agritourism activities. However, among 85 farms that offered agritourism, only 54 provided data regarding the agritourism incomes. Therefore, the financial data of 54 farms were used to estimate visitor expenditure per agritourism farm in Tennessee. Then, we projected the total visitor expenditure across the agritourism farms of Tennessee using the following formula:
In terms of the total number of agritourism farms, we considered 644 agritourism farms in Tennessee, consistent with the most recent 2017 Census of Agriculture (Leffew and Bruhin, 2020). Moreover, we used our primary survey findings to calculate the average spend per visitor and visitor numbers per farm. Our calculations of total visitor expenditures across different sectors examined are presented in Table 1, which also shows that the total aggregate sum of visitors' expenditure in agritourism farms for the State of Tennessee is estimated at $64,196,496 per year. The total expenditure was allocated to the identified sectors (Table 2). Our calculated numbers on visitor spending categories on farms were similar and comparable with the numbers reported by Jensen et al. (2013), with farms receiving more than 1,000 visitors. Therefore, consistent with Jensen et al. (2013), we allocate 17.9% on admission fees, 12.83% on the product purchase, 6% on concession, 6.9% on souvenirs, and 7.1% on other categories. IMPLAN sectors corresponding to these expenditure categories are identified, and total expenditure is divided among these sectors, as presented in Table 2.

Table 2. IMPLAN sectors and visitor spending in Tennessee agritourism farms, 2019.
Estimation of annual visitors
The annual number of visitors per agritourism farm was estimated by multiplying two terms: the number of weeks the farm offers agritourism activities and the number of weekly visitors, both from the primary survey data.
We asked questions about the exact season(s) of the agritourism activities on the farm or whether it is offered throughout the year. Figure 2 shows that around half of agritourism businesses are open to visitors throughout the year. We found that around 44.2% of agritourism businesses are closed at least during the winter season while offering tourism activities in the spring and fall seasons. All agritourism farms offer tourism activities in the summer season.

Figure 2. Percentages of agritourism farms and season of operation.
Figure 3 presents our findings on the weekly visitors per agritourism farm. In terms of the average number of visitors per week, around two-fifths (40.5%) of farms received fewer than 20 visitors, 15% received 20–50 visitors, 10% received 50–100 visitors, 21.5% received 100–500 visitors, while 12.6% farms received 500 or more visitors (including 6.3% receiving more than 1,000 visits per week; Figure 3). The median number of visitor is 2,600 visitor per year. These are comparable to findings from Jensen et al. (2006), whereby the median number of visitors in non-winery firms was estimated at 2,000 per year; however, this estimate was higher than those from Jensen et al. (2013), whereby a median of 1,000 visits per year was estimated. Though visitor numbers are supposed to increase with urbanization (Carpio et al., 2008), visitor numbers have remained similar over the past two decades. One major reason for this may be inefficient marketing and advertising (McGehee, 2007; Wu et al., 2020). Hence, the number of visitors can be increased by enhancing the role of institutions such as Pick Tennessee Products and the Tennessee Agritourism Association, along with the implementation of additional innovative marketing and advertising strategies.

Figure 3. Percentage of agritourism farms and estimated number of visitors received per week.
Estimation of average visitor expenditure
Farm operators were asked to estimate their total income from farm and farm-related activities. Each farm that has fully or partially engaged in agritourism-related activities was asked to indicate their agritourism incomes as a percentage of their agricultural income that comes from agritourism activities. Figure 4 shows the structure of agritourism income per farm in Tennessee. Our estimates suggest that the average annual income from agritourism-related activities per farm is around $99,684, with around 17% of farms earning more than $250,000 from agritourism (Figure 4). However, the gross farm income of these farms is likely to be different from agritourism income, as these farms may generate income from other agricultural and farm-related activities like agricultural production. Figure 5 shows this by presenting the gross farm income structure of these farms. We found that, around 17% of these farms have gross farm income between $100,000 and $350,000 and around 17% farms have gross farm income higher than or equal to $350,000 (Figure 5). We assumed that the agritourism income of the farms consists mainly of the total visitor spending in that agritourism farm. Therefore, average visitor expenditure (spending) was calculated by dividing the total annual agritourism income of the farm by the annual number of visitors on that farm (Equation 10).

Figure 4. Agritourism farms and their income from agritourism activities.
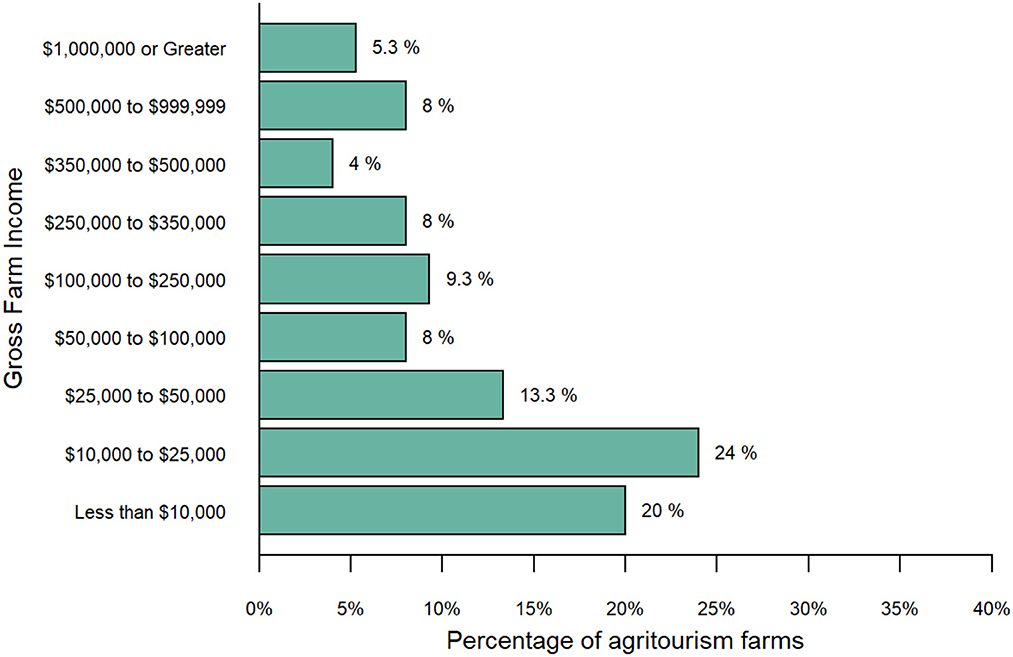
Figure 5. Gross farm incomes of agritourism farms generated from farm and farm-related activities.
We estimated that the average expenditure (spending) per visitor in agritourism farms in Tennessee is $38.34. Bernardo et al. (2004) found that the average expenditure per trip was $49 when the primary purpose of the visit was to see relatives, and $101 for other purposes. It is important to note that these figures are relatively high compared to our estimates as they encompass both on-farm expenses and costs related to travel, lodging, and meals. In contrast, our expenditure analysis focuses solely on on-farm expenses, providing a more specific insight into the economic impact of agritourism activities. Our figures are also comparable to findings from Jensen et al. (2013), whereby the average expenditure by visitors was estimated at $35.12 per visit. Similar findings were also found by Magnini (2017) for Virginia agritourism farms, who estimated an average expenditure of $34.74 for non-local visitors and $21.65 for local agritourists. Over the past 2 decades, average agritourist expenditure has remained similar. As agritourism has low price elasticity of demand (Carpio et al., 2008), it presents a favorable opportunity for farm operators to enhance their revenue by raising the price of their offerings, without significantly reducing demand. Since tourism is considered to be a normal good with a downward-sloping demand curve (Gartner, 2004), increasing prices by implementing some value additions and improving the quality of offerings is even more justifiable.
Economic impacts
Table 3 presents the economic impact of visitor spending calculated using the IMPLAN input-output model. IMPLAN also estimated the direct, indirect, and induced impacts on output, employment, labor income, and value added from agritourism in Tennessee. At an aggregate level, agritourism in Tennessee received $65,092,815 ($65.09 million) from visitor spending on the farm. This is considered a direct output impact. Applying the Type SAM multiplier of 1.82 to the direct output of $65.09 million results in a total industry output of $118.54 million to the Tennessee economy. In terms of total industry output, around 54.91% comes from direct contributions and 45.09% from indirect and induced effects. The graphs presented in Figure 6 show these economic impacts of agritourism and present comparatives. Out of $53.45 million combined indirect and induced effects, $34.62 million are indirect effects representing inter-industry transactions and $18.82 million are induced effects in the economy. In brief, the equivalent of ~$34.62 million in economic activity is stimulated in other related sectors as a result of initial visitor spending. Similarly, initial visitor spending and subsequent indirect effects lead to increased income for individuals and households, which in turn stimulates additional spending. The induced impact of 18.82 million represents the additional economic effects stemming from increased household spending, resulting from the direct and indirect impacts.
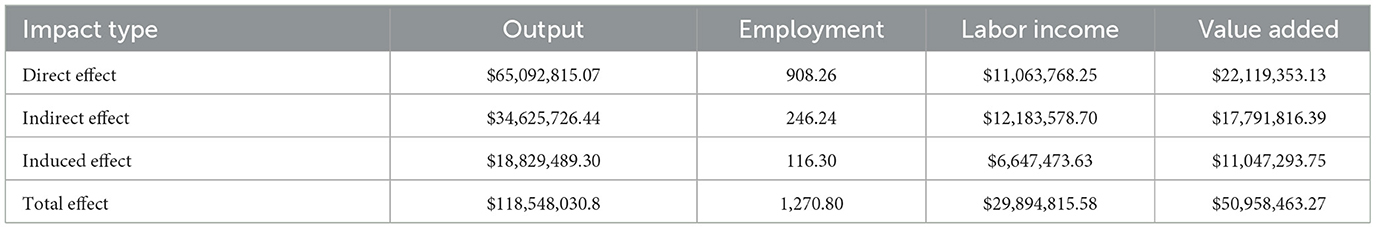
Table 3. Estimated economic impacts of agritourism in Tennessee from visitor spending in agritourism farms.
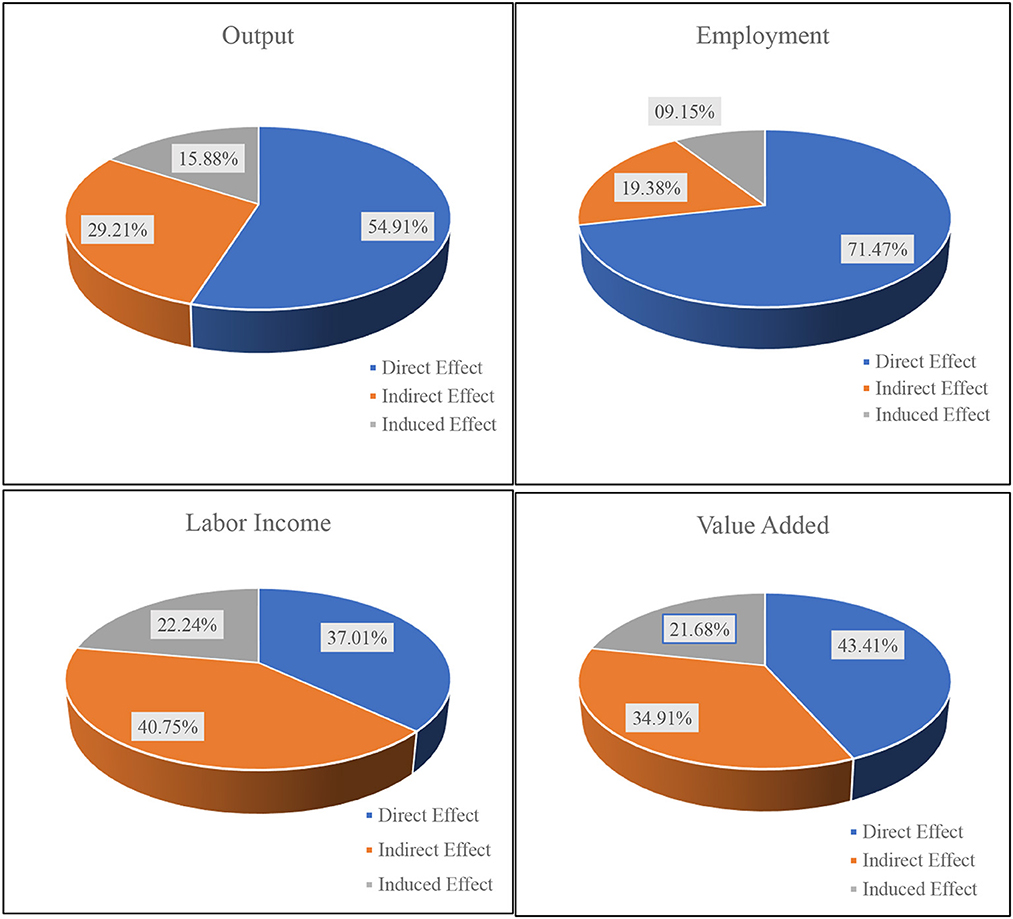
Figure 6. Percentage of direct, indirect, and induced effects of the total state-level impacts of on-farm visitor spending in agritourism farms.
Table 3 shows that visitor spending in farms has generated 1,270 full-time or part-time jobs in Tennessee, equivalent to $29.89 million in labor income. Among these 1,270 jobs, 908 are generated directly from visitor expenditure equivalent to $11.06 million in labor income. An additional 246 indirect jobs were created due to spending by agritourism farms to purchase their operation supplies and inputs within the state. Table 3 also shows that 116 additional jobs (equivalent to $6.64 million in labor income) were induced by the increased household spending attributable to agritourism activities. In terms of percentage, direct employment effects account for 71.47%, and indirect and induced effects account for 19.38 and 9.15% of jobs in the economy, respectively (Figure 6).
The last column of Table 3 shows that $50.95 million is generated in value added from visitor spending at agritourism farms in Tennessee. As shown in Figure 6, value added through direct effects is $22.11 million (43.41% of total value added), and value added through indirect and induced effects are $17.79 million and $11.047, respectively.
To break down the impact contribution by different sub-sector industries related to agritourism, the top 10 industries based on their contribution to output, employment, and value added are presented in Tables 4–6, respectively. Table 4 shows that wineries contribute to 11.92% of the total agritourism industry output, which is the largest among the listed industries. The amusement and recreational industry, accounts for 11.68% of total output impact. In terms of total employment impacts by agritourism-related industries, Table 5 shows that fruit farming generates the highest impact (21.93%, 278 additional jobs), followed by the recreational industry (17.92%, 227 additional jobs). In terms of value-added impacts by industries, Table 6 shows that amusement and recreational industries add the highest value (equivalent to $8.4 million), followed by the industry representing food and drinking places (equivalent to $3.1 million) and wineries (equivalent to $2.7 million). Additionally, our estimates using IMPLAN also suggest that visitor spending in agritourism farms in Tennessee has contributed to a total of $6.37 million in federal taxes, $3.04 million in state taxes, and $1.31 million in county taxes.
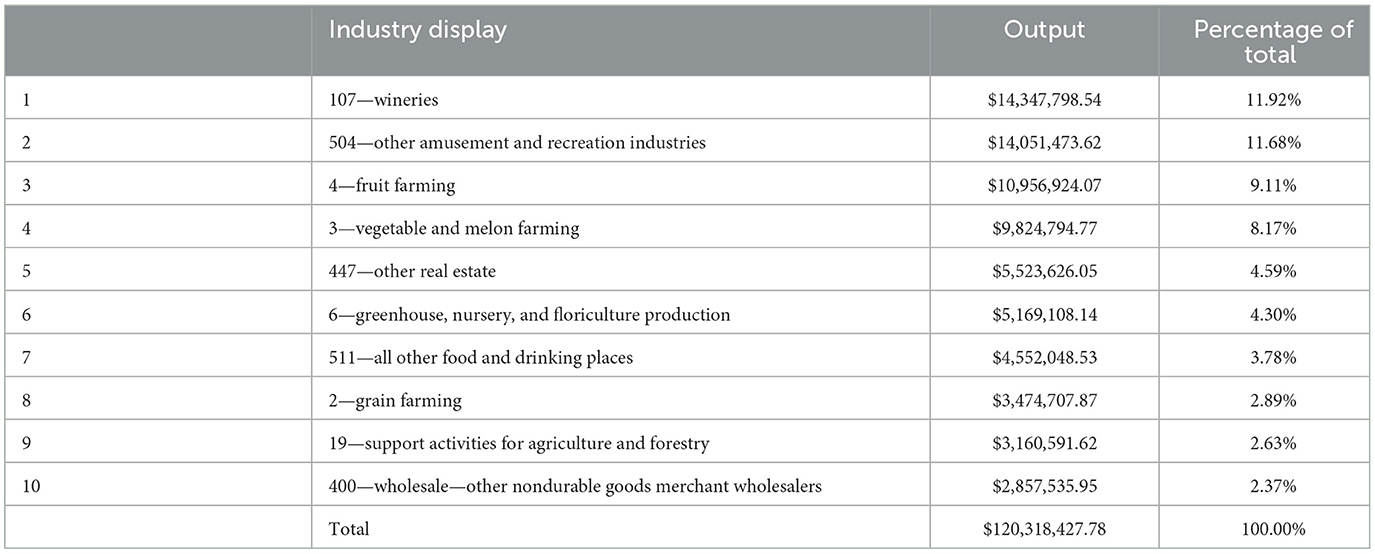
Table 4. Top 10 industries by total industry output impact from on-farm visitor spending at Tennessee agritourism farms, 2022.
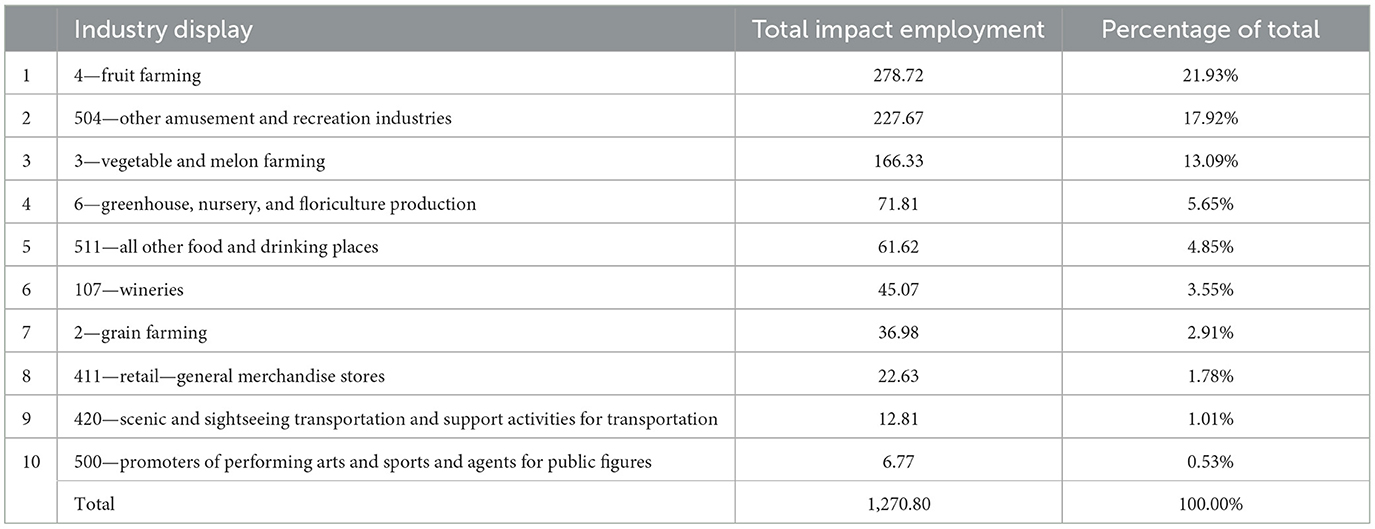
Table 5. Top 10 industries by total employment impact from on-farm visitor spending at Tennessee agritourism farms, 2022.
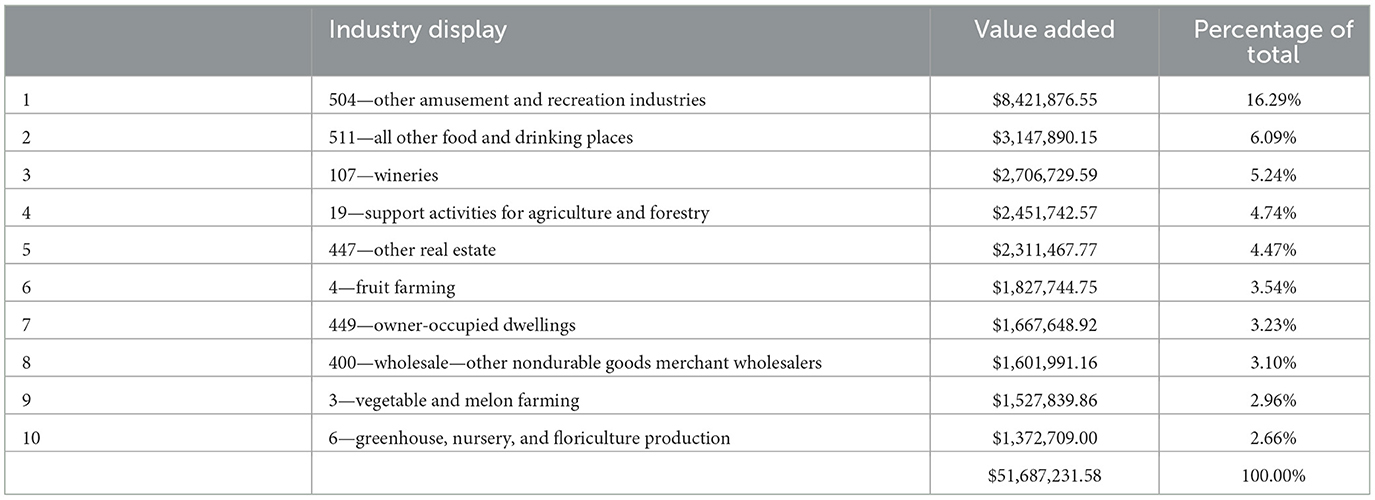
Table 6. Top 10 industries by total value-added impact from on-farm visitor spending at Tennessee agritourism farms, 2022.
Quantifying the multiplier effects
Table 7 shows the multiplier effects associated with the agritourism sector: type SAM multiplier and type I multiplier. Both multipliers are comparable. However, the type SAM multiplier, based on the social accounting matrix, is the most used in regional impact studies. Looking at the type SAM multipliers, the multiplier effects of 1.82 on output and 2.30 on value added suggest that a $1-spend in the agritourism sector is estimated to generate $1.82 of total output and $2.30 of value added to the Tennessee economy. The 1.4 multiplier effect of employment suggest that every direct employment in agritourism sector bring 1.4 jobs to Tennessee economy. Additionally, 2.7 multiplier effect of labor income (Table 7) suggest that for every $1 generated in labor income in agritourism bring up additional $1.7 in labor income in Tennessee economy. The Type I multipliers are smaller in magnitude compared to the Type SAM multipliers since they only account for business-to-business purchases and don't include the effect of local household spending. Type I multiplier for output is 1.53; this means that for $1 spent in the agritourism sector, there is an estimated overall increase of $1.53 throughout the local economy. This multiplier represents the indirect effects generated by the initial change in demand, capturing the ripple effects through the supply chain and other interrelated industries. Similarly, the Type I multiplier for employment is 1.27, which implies that an additional 0.27 jobs in other industries are needed for one direct job in the agritourism sector. Furthermore, the Type I multiplier of 2.10 for labor and 1.80 for value added implies an increase of $2.10 in labor income and $1.80 in value added. It represents the additional income generated in the supply chain and other related industries beyond direct impact. These findings are remarkable and can provide insights into policy interventions in the region.

Table 7. Multipliers associated with on-farm visitor spending in agritourism farms.
Conclusion
This study is focused on estimating the visitor numbers of agritourism operations, visitor expenditures, and the resulting economic impact. It is evident from the findings that the number of visitors and their spending has remained relatively stable or slightly increased in the US over the past two decades. However, as rural tourism in countries like Canada and Mexico relies heavily on US visitors, our research indicates that agritourism providers in the US have the potential to attract a larger number of local agritourists and boost revenue significantly through effective marketing and advertising strategies.
Agriculture and farm sectors are important parts of the regional economy. However, the economic contributions from unique multifaceted aspects underlying the agriculture and farm sector have received limited attention in impact estimation studies. Studies on agritourism, specifically considering it as a viable economic enterprise, have increased relatively recently in the US compared to Europe. Tennessee is one of the most important states for both agriculture and tourism; it has shown a rapid increase in agritourism farms in recent years and can be considered an important representative state for agritourism studies. Considering the increasing popularity of agritourism, it is compelling to document its contribution, interaction, and interdependence with other sectors and the ripple and spillover effects it can generate in the economy. This study captures these aspects and estimates the economic impact of agritourism in Tennessee using both primary survey data and secondary information on the industries in the region.
We also found that the majority of agritourism farms are open for visitors during summer, spring, and fall, while only approximately half of the farms are open during the winter season. Farm and school tours, retail farm stands, event hosting, and on-farm entertainment are among the most common attractions offered by agritourism farms. We found that an agritourism farm earns on average $99,684 in annual income from agritourism. Our estimation suggests that total direct visitor spending in Tennessee agritourism farms is around $65 million. This $65 million generates a total industry output of $118.54 million, 1,271 jobs, $29.89 million in labor income, and $50.95 million in value added in the state. It is important to understand the sector's linkages in input and output relations to other industries. Interestingly, we found that $53.45 million in output generation and $18.83 million in labor income contributions of agritourism are through indirect and induced effects. This indicates the nature and magnitude of the interrelationship of agritourism to other industries and its potential integration to boost regional economic growth in multiple sectors. These have greater implications on the interdependent sectors of agritourism, government tax revenue generation, and the regional economy. For example, wineries, amusement, and recreational industries, fruit farming, and vegetable and melon farming are the top industries that boost their output and employment as the agritourism sector grows. Additionally, recreational and amusement industries and food and drinking places in the region have remarkable positive expansion in their value-added products and services as the agritourism sector grows. We show that spending in the agritourism farms triggers activities through multiplier effects—every dollar spent on agritourism farms adds an additional 82 cents of output and adds an extra $1.30 in value added to the state's economy.
The findings of this study show the importance of the agritourism sector to the regional economy, considering Tennessee as an example state. This study provides important insights into the contribution of agritourism, interrelated sectors, multiplier effects, and economic development that are potentially from farm- and agriculture-centric spending and investment. From a regional economic development perspective, our study portrays a scope to expand agritourism. Improvements and efforts in this sector and related agribusinesses could attract more out-of-state visitors and generate income for the State. The study provides useful information to agriculture and tourism-related research and extension programs, policymakers, and investors, specifically to promote and enhance agritourism. Finally, we acknowledge some limitations and suggestions for future studies. A few limitations that are inherent in IMPLAN's industry- and sector-level classification data and modeling system are beyond the scope of this study. The use of multiple regional impact estimation software and cross-comparison could enhance the robustness of findings in future studies. Additionally, we did not collect information on visitor characteristics in our primary survey. Future similar studies could also collect primary information from both visitors and agritourism farm businesses to derive additional insights into the nature of visitors and their spending.
Data availability statement
The datasets presented in this article are not readily available, because only responses to limited specific questions were applied in the calculation of the part of this study's estimation. Therefore, full primary survey data is not applicable. Requests to access the datasets should be directed at: akhanal1@tnstate.edu.
Author contributions
PD: data compilation, methodology design, data analysis, and writing—original draft. AK: conceptualization, funding acquisition, investigation, resources, software, primary survey design, supervision, validation, and writing—review and editing. All authors contributed to the article and approved the submitted version.
Funding
This study was part of the objectives of the CBG grant (award # 2018-38821-27738) and Evans-Allen Project TENX 2201-GFSHPP (accession #7003373) funded by the National Institute and Food and Agriculture of the US Department of Agriculture (NIFA, USDA).
Acknowledgments
We thank NIFA, USDA for their funding support.
Conflict of interest
The authors declare that the research was conducted in the absence of any commercial or financial relationships that could be construed as a potential conflict of interest.
Publisher's note
All claims expressed in this article are solely those of the authors and do not necessarily represent those of their affiliated organizations, or those of the publisher, the editors and the reviewers. Any product that may be evaluated in this article, or claim that may be made by its manufacturer, is not guaranteed or endorsed by the publisher.
References
Ainley, S., and Smale, B. (2009). A profile of Canadian agritourists and the benefits they seek. J. Rural Community Dev. 5, 58–75. Available online at: https://api.semanticscholar.org/CorpusID:56357891
Bagi, F. S., and Reeder, R. J. (2012). Factors affecting farmer participation in agritourism. Agric. Resour. Econ. Rev. 41, 189–199. doi: 10.1017/S1068280500003348
Barbieri, C., and Mshenga, P. M. (2008). The role of the firm and owner characteristics on the performance of agritourism farms. Sociol. Rural. 48, 166–183. doi: 10.1111/j.1467-9523.2008.00450.x
Bernardo, D., Valentin, L., and Leatherman, J. (2004). “Agritourism: if we build it, will they come,” in Risk and Profit Conference (Manhattan, KS), 19-20.
Bruch, M. L., Ziehl, A., Prather, T. G., Bragg, R., Winchester, R., Hankins, C., and McDaniels, P. (2005). Agritourism in Focus: A Guide for Tennessee Farmers. The University of Teenessee.
Carpio, C. E., Wohlgenant, M. K., and Boonsaeng, T. (2008). The demand for agritourism in the United States. J. Agric. Resour. Econ. 33, 254–269. doi: 10.22004/ag.econ.42465
Choi, E. Y., and Johnson, T. G. (2014). Economic impact of the informal childcare sector in Kansas. J. Reg. Anal. Policy 44, 20–35.
Chung, J. Y., Kyle, G. T., Petrick, J. F., and Absher, J. D. (2011). Fairness of prices, user fee policy and willingness to pay among visitors to a national forest. Tour. Manag. 32, 1038–1046. doi: 10.1016/j.tourman.2010.08.016
Clouse, C. (2020a). Understanding Labor Income (LI), Employee Compensation (EC), and Proprietor Income (PI) – IMPLAN - Support. IMPLAN. Available online at: https://support.implan.com/hc/en-us/articles/360024509374-Understanding-Labor-Income-LI-Employee-Compensation-EC-and-Proprietor-Income-PI- (accessed January 22, 2023).
Clouse, C. (2020b). Understanding Other Property Income (OPI) – IMPLAN - Support. IMPLAN. Available online at: https://support.implan.com/hc/en-us/articles/360016072114-Understanding-Other-Property-Income-OPI- (accessed January 22, 2023).
Clouse, C. (2020c). Understanding the Leontief Production Function (LPF) – IMPLAN - Support. IMPLAN. Available online at: https://support.implan.com/hc/en-us/articles/360044716414-Understanding-the-Leontief-Production-Function-LPF- (accessed January 23, 2023).
Clouse, C. (2022a). Employment – IMPLAN - Support. IMPLAN. Available online at: https://support.implan.com/hc/en-us/articles/115009668668-Employment (accessed January 22, 2023).
Clouse, C. (2022b). Understanding Taxes on Production and Imports, less Subsidies (TOPI) – IMPLAN - Support. IMPLAN. Available online at: https://support.implan.com/hc/en-us/articles/360043652593-Understanding-Taxes-on-Production-Imports-less-Subsidies-TOPI- (accessed January 25, 2023).
Das, B. R., and Rainey, D. V. (2010). Agritourism in the arkansas delta byways: assessing the economic impacts. Int. J. Tour. Res. 12, 265–280. doi: 10.1002/jtr.752
Demski, J. (2020). Understanding IMPLAN: Direct, indirect, and induced effects. IMPLAN. Available online at: https://blog.implan.com/understanding-implan-effects (accessed January 23, 2023).
Gartner, W. C. (2004). Rural tourism development in the USA. Int. J. Tour. Res. 6, 151–164. doi: 10.1002/jtr.481
Hardesty, S., Feenstra, G., Visher, D., Lerman, T., Thilmany-McFadden, D., Bauman, A., et al. (2014). Values-based supply chains: supporting regional food and farms. Econ. Dev. Q. 28, 17–27. doi: 10.1177/0891242413507103
Holland, R., Khanal, A. R., and Dhungana, P. (2022). Agritourism as an alternative on-farm enterprise for small U.S. farms: examining factors influencing the agritourism decisions of small farms. Sustainability 14, 4055. doi: 10.3390/su14074055
IMPLAN (2023). Research and Reports: IMPLAN Data Overview and Sources. IMPLAN Group, LLC., Huntersville, NC. Available online at: https://implan.com/wp-content/uploads/IMPLAN-Data-Overview-and-Sources.pdf (accessed March, 2023).
Jensen, K., Bruch, M., Menard, J., and English, B. (2013). A Snapshot of Tennessee Agritourism: 2013 Update. Center for Profitable Agriculture, University of Tennessee Extension. Available online at: https://ag.tennessee.edu/arec/Documents/AIMAGPubs/MarketandFeasibilityStudies/Agritourism/SnapshotofTNAgritourism2013.pdf
Jensen, K., Lindborg, C., Burton, E., and Menard, J. (2006). Visitors to Tennessee Agri-Tourism Attraction: Demographic, Preferences, Expenditures, and Projected Economic Impacts. Available online at: https://ag.tennessee.edu/arec/Documents/AIMAGPubs/MarketandFeasibilityStudies/Agritourism/VisitorstoTNAgri-TourismAttractions.pdf
Joo, H., Khanal, A. R., and Mishra, A. K. (2013). Farmers' participation in agritourism: does it affect the bottom line? Agricult. Resour. Econ. Rev. 42, 471–490. doi: 10.22004/ag.econ.162297
Khanal, A. R., Honey, U., and Omobitan, O. (2020). Diversification through ‘fun in the farm': analyzing structural factors affecting agritourism in Tennessee. Int. Food Agribusiness Manage. Rev. 23, 105–120. doi: 10.22434/IFAMR2019.0043
Khanal, A. R., and Mishra, A. K. (2014). Agritourism and off-farm work: survival strategies for small farms. Agric. Econ. 45, 65–76. doi: 10.1111/agec.12130
Leffew, M. B., and Bruhin, J. (2020). Value-Added Agriculture, Direct Marketing And Agritourism in Tennessee: A Summary of County Level 2017 Census of Agriculture Data. Report# W-910, Center for Profitable Agriculture, Institute of Agriculture University of Tennessee. Available online at: https://extension.tennessee.edu/publications/Documents/W910.pdf
Leontief, W. W. (1936). Quantitative input and output relations in the economic system of the Unite States. Rev. Econ. Stat. 18, 105–125. doi: 10.2307/1927837
Lucas, M. (2020). Understanding Output – IMPLAN - Support. IMPLAN. Available online at: https://support.implan.com/hc/en-us/articles/360035998833-Understanding-Output (accessed January 22, 2023).
Magnini, V. P. (2017). “The economic and fiscal impacts of agritourism in Virginia,” in VirginiaTech-Pamplin College of Business (Issue April). Available online at: https://www.pubs.ext.vt.edu/content/dam/pubs_ext_vt_edu/AAEC/aaec-157/AAEC-157.pdf (accessed January 29, 2023).
McGehee, N. G. (2007). An agritourism systems model: a Weberian perspective. J. Sustain. Tour. 15, 111–124. doi: 10.2167/jost634.0
Melstrom, R. T., and Murphy, C. (2018). Do agritourism visitors care about landscapes? An examination with producer-level data. J. Travel Res. 57, 360–369. doi: 10.1177/0047287517696981
Miller, R. E., and Blair, P. D. (2009). Input-Output Analysis: Foundations and Extensions, 2nd ed. Cambridge: Cambridge University Press. doi: 10.1017/CBO9780511626982
Nickerson, N. P., Black, R. J., and McCool, S. F. (2001). Agritourism: motivations behind farm/ranch business diversification. J. Travel Res. 40, 19–26. doi: 10.1177/004728750104000104
Omobitan, O., and Khanal, A. R. (2022). Examining farm financial management : how do small US farms meet their agricultural expenses? J. Risk Financial Manag. 15, 133. doi: 10.3390/jrfm15030133
Rich, S. R., Standish, K., Tomas, S., Barbieri, C., and Ainely, S. (2016). The Current State of Agritourism Research in the United States. Amherst, MA: Travel and Tourism Research Association: Advancing Tourism Research Globally, 12.
Santos, X. T., Grado, S. C., and Hunt, K. M. (2016). Assessing the economic impact of waterfowl hunting in Mississippi. Int. J. Soc. Econ. 43, 86–103. doi: 10.1108/IJSE-04-2014-0068
Tew, C., and Barbieri, C. (2012). The perceived benefits of agritourism: the provider's perspective. Tour. Manag. 33, 215–224. doi: 10.1016/j.tourman.2011.02.005
Thilmany, D., and Ahearn, M. (2013). Beginning Farmers and Potential Opportunities within Local Food Systems. Boston, MA: Boston Federal Reserve's Communities and Banking.
USDA (2019). USDAERS - Agritourism Allows Farms To Diversify and has Potential Benefits for Rural Communities. Available online at: https://www.ers.usda.gov/amber-waves/2019/november/agritourism-allows-farms-to-diversify-and-has-potential-benefits-for-rural-communities/ (accessed January 25, 2023).
USDA (2022). AgriTourism. Available online at: https://www.nal.usda.gov/human-nutrition-and-food-safety/local-foods-and-communities/agritourism (accessed January 25, 2023).
Whitt, C., Low, S., and Sandt, A. (2019). Agritourism Allows Farms to Diversify and Has Potential Benefits for Rural Communities. Economic Research Services (ERS, USDA). Available online at: https://www.ers.usda.gov/amber-waves/2019/november/agritourism-allows-farms-to-diversify-and-has-potential-benefits-for-rural-communities/
Wu, T., Henneberry, S. R., Ng'ombe, J. N., and Melstrom, R. T. (2020). Chinese demand for agritourism in rural America. Sustainability 12, 1–12. doi: 10.3390/su12073052
Keywords: agritourism, small farms, alternative enterprises, economic impact, multiplier effect, regional economies
Citation: Dhungana P and Khanal AR (2023) Spending on farms ripples into the region: agritourism impacts. Front. Environ. Econ. 2:1219245. doi: 10.3389/frevc.2023.1219245
Received: 08 May 2023; Accepted: 28 August 2023;
Published: 28 September 2023.
Edited by:
Michele Moretti, University of Pisa, ItalyReviewed by:
Sabrina Tomasi, University of Pisa, ItalyJohn N. Ng'ombe, North Carolina Agricultural and Technical State University, United States
Copyright © 2023 Dhungana and Khanal. This is an open-access article distributed under the terms of the Creative Commons Attribution License (CC BY). The use, distribution or reproduction in other forums is permitted, provided the original author(s) and the copyright owner(s) are credited and that the original publication in this journal is cited, in accordance with accepted academic practice. No use, distribution or reproduction is permitted which does not comply with these terms.
*Correspondence: Aditya R. Khanal, akhanal1@tnstate.edu