ORP should not be used to estimate or compare concentrations of aqueous H2: An in silico analysis and narrative synopsis
 Tyler W. LeBaron1,2,3*
  Randy Sharpe4
- 1Centre of Experimental Medicine, Institute for Heart Research, Slovak Academy of Sciences, Bratislava, Slovakia
- 2Molecular Hydrogen Institute, Enoch, UT, United States
- 3Department of Kinesiology and Outdoor Recreation, Southern Utah University, Cedar City, UT, United States
- 4H2 Analytics, Henderson, NV, United States
Oxidation reduction potential (ORP) has become a commonly used measurement to characterize functional beverages, specifically alkaline ionized water and hydrogen water. Numerous health benefits including antioxidant effects have been attributed to a negative ORP value. A greater negative ORP value is often incorrectly interpreted to mean a greater degree of health benefits and/or a high concentration of H2. Some hydrogen meters use the Nernst equation to calculate the concentration of H2 based on the measured ORP value. Unfortunately, due to the fundamental issues with the ORP meter, the calculated H2 value may be very inaccurate. Using the Nernst equation, we performed an in silico analysis of the ORP as a function of pH, temperature, and H2 concentration. Our analysis shows that a one unit increase in pH (e.g., 7–8) influences the ORP by as much as increasing the H2 concentration by 100 times (e.g., 1–100 mg/L). Similarly, at a saturated H2 concentration (1.57 mg/L) and pH 7, every ∆T of 20 °C changes the ORP by ≈ 30 mV. This is comparable to changing the H2 concentration by a factor of 10 (0.1 mg/L to 1 mg/L). Finally, to measure H2 within 0.1 mg/L, ORP meters need to have an accuracy of about 0.8 mV. However, ORP meters have an error range of at least ±10 mV, which corresponds to a potential error in measured H2 concentration of nearly 2 mg/L (≈125% error). This analysis shows that pH, temperature, and the intrinsic ORP errors can individually influence the ORP greater than the entire contribution of dissolved H2 within normally used ranges. In fact, this can easily result in a water sample with a greater negative ORP than another despite having significantly less H2. This makes it impossible to consistently determine if one water sample has more H2 than another water sample. Therefore, we can only conclude, based on a negative ORP reading, that, excluding the possibility of other reductive redox couples, some level of dissolved H2 is present in the water. Accordingly, ORP and ORP-based H2 meters are not recommended for testing or comparing the concentration of H2 in water. Experimental studies are warranted to determine if the ORP error is as great as or greater than what is predicted via this in silico analysis.
1 Introduction
Oxidation-reduction potential (ORP) is a commonly used measurement to assess the oxidative or reductive properties of water. This measurement has often been used as an indicator of a water’s health benefits when reductive, or harmful effects when oxidative. Specifically, it has often been used to characterize so-called alkaline-ionized water and more recently hydrogen water (Lee et al., 2022). For many years, alkaline ionized water has been researched and advertised as a healthy therapeutic water (Chen and Wang, 2022). Water ionizers perform water electrolysis and separate the cathode from the anode with a semi-permeable membrane to prevent the waters from mixing. The cathodic water has an alkaline pH and is often referred to as alkaline ionized water, or most commonly in the literature as electrolyzed reduced water (ERW) (Shirahata et al., 2012). The oxidation-reduction potential (ORP) meter is commonly used by researchers and marketers to demonstrate that ERW has “different” properties from other types of water. ERW has a negative ORP reading (−100 mV to −750 mV or more) compared to other waters that have a positive ORP reading (Shirahata et al., 2012). Efforts to explicate the reason for and the significance of the negative ORP have spawned many conjectures, including that ERW has a “special structure” or that it contains “free electrons.” This may have been because it has only relatively recently been recognized that hydrogen gas (H2) produced by electrolysis and dissolved in the water has therapeutic effects (Ohsawa et al., 2007; LeBaron et al., 2019a). Therefore, many early ERW papers, and current marketing websites and brochures focus on the negative ORP of ERW (Shirahata et al., 2012). A common perspective of the negative ORP is, “the more negative the ORP, the greater the therapeutic benefit” (Okouchi et al., 2002).
Recently, it has been widely recognized that the benefits of ERW are due to dissolved molecular hydrogen in the water (Jackson et al., 2018). Water electrolysis is one of the many methods to make water containing dissolved hydrogen (hydrogen water). As the therapeutic benefits of hydrogen water are being recognized, researchers and consumers desire to know how much hydrogen is dissolved in the water. Logically, unless a high enough dose of a biologically active substance (e.g., H2) is ingested, it will not have the biological activity demonstrated in clinical studies (LeBaron et al., 2019a). Many have sought to use ORP meters to compare one hydrogen water to another, as well as estimate the H2 concentration in their water. Additionally, relatively inexpensive ORP-based portable “dissolved hydrogen meters” have appeared in the marketplace in recent years. ORP-based H2 meters show a digital display of the H2 concentration in units of parts-per-million/parts-per-billion (ppm/ppb) (Li et al., 2022). On the surface, it appears that these meters may be an excellent option for determining the H2 concentration. However, these ORP-based H2 meters only measure the ORP of the water, not specifically the hydrogen molecules. Moreover, despite the fact that a negative ORP indicates a reductive solution, it does not mean that the solution will act as a reducing and antioxidizing solution. Therefore, a deeper understanding of the actual chemistry responsible for the specific ORP is required before making any definitive conclusion (James et al., 2004).
This article will address some of the many issues surrounding the negative ORP in ERW and hydrogen water including the influence of H2, pH, and temperature. It is not the purpose of this article to provide a detailed description of redox chemistry or electrochemistry theory. Interested readers are referred to other articles and standard chemistry texts [e.g., (James et al., 2004; Harris, 2010]. However, certain aspects of this chemistry are introduced in order to discuss the relationship between ORP and pH/temperature in hydrogen water. Specifically, we will focus on what the negative ORP and ORP-based H2 meters can and cannot tell us about the concentration of molecular hydrogen in the water.
We provide an overview of what ORP means, how it is determined, and its relationship to dissolved hydrogen gas. We also present in silico computations based on the Nernst equation to examine the relationship among the levels of dissolved H2 gas, pH, temperature, and the ORP measurement. Finally, we give a practical summary and recommendations regarding the use of ORP, ORP-based hydrogen meters, and accurate methods for measuring dissolved hydrogen gas levels.
2 Background
2.1 Hydrogen water
The term “hydrogen water” or hydrogen-rich water (HRW), refers to water that contains dissolved molecular hydrogen (H2 gas) (Slezak et al., 2021). Common methods of providing hydrogen water include electrolysis (water ionizers), hydrogen-infusion machines that utilize proton-exchange membranes, tablets that produce H2 gas when placed into water, H2 gas bubblers that infuse H2 into the water, and special pre-packaged cans and pouches as shown in Figure 1 (Henry and Chambron, 2013; LeBaron et al., 2019a). Molecular hydrogen is held together by a relatively stable nonpolar covalent bond, which means that, when it is dissolved into water, it does not chemically bind to the water molecules. In other words, hydrogen water is not a novel chemical substance (e.g., “H4O”). When the H2 molecules are fully dissolved in water, the solution is clear. Sometimes small gas bubbles can be seen initially in hydrogen water or it may even have a “foggy” appearance, but, unless it is dissolved, it does not contribute to the ORP or the therapeutic effects. This is because any undissolved H2 will readily rise to the water surface and escape into the atmosphere. H2 will not stay in solution forever. In an open container it has an approximate half-life of 2 hours (Fujita et al., 2009). Hydrogen’s high volatility combined with its small molecular size allows it to permeate most containers except for special aluminum packaging (Ohta, 2015).
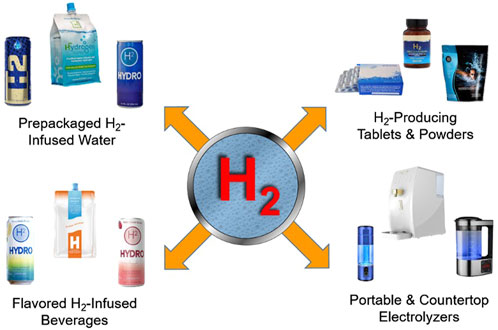
FIGURE 1. Various hydrogen water and beverage products commonly encountered in the market.
Dissolved hydrogen is usually measured in molarity (mmol/L) or milligrams per liter (mg/L), which is the preferred unit of measure, instead of the equivalent unit of parts per million (ppm). The most commonly used concentrations of molecular hydrogen are 0.5 to >2 mg/L (LeBaron et al., 2019a). At standard pressure (1 atm), and ambient temperature (25°C), the saturation of hydrogen water is about 1.6 mg/L (Alwazeer et al., 2021). Increasing the pressure and/or altering the temperature results in a greater saturation level according to Henry’s Law (James et al., 2004; Harris, 2010).
2.2 Negative oxidation-reduction potential in hydrogen water
As discussed, hydrogen water and ERW that have molecular hydrogen will have a negative ORP (-100 to -750 mV or more) (Shirahata et al., 2012; Chen and Wang, 2022). This negative ORP is often touted as evidence that the water has been imparted with “special properties” from the electrolysis or production process. These special qualities include claims that the water has a smaller more bioavailable molecular water cluster, or that the water itself possesses a “negative charge” due to “free electrons” entrained in the water (Mohr, 2016). Although even an elementary understanding of chemistry is sufficient to refute such claims, they continue to gain traction. These claims have added to the confusion about 1) the meaning/reason for the negative ORP, 2) the true reason of ERW’s/hydrogen water’s benefit, and 3) the proper method to compare and contrast the benefits of one water to another. It should be recognized that it is exclusively the existence of dissolved H2 in ERW that is responsible for the negative ORP (Piskarev et al., 2010; Shirahata et al., 2012). During electrolysis, electricity produces molecular hydrogen at the cathode by converting protons (H+) into H2 (g). In electrolysis units that have specialized membranes separating the cathode and anode electrodes, reduction of these hydrogen ions results in a rise in the pH of the catholyte (Henry and Chambron, 2013). The process of electrolysis does not impart special enigmatic properties to the water. Indeed, any H2 water, including that made without the use of electricity (e.g., H2-producing tablets or infusing H2 into solution), will also have a negative ORP (Jackson et al., 2018). Since it is well established that molecular hydrogen is exclusively responsible for the therapeutic benefit of ERW/hydrogen water (Jackson et al., 2018), then the focus should be to determine the level of H2, not the ORP value. A negative ORP is simply an indicator of the presence of molecular hydrogen. Moreover, the magnitude of the negative ORP reading does not provide helpful information about the level of molecular hydrogen in the water as often suggested (Okajima et al., 2022) and will be discussed in this article.
2.3 The oxidation-reduction potential meter
The ORP meter as seen in Figure 2 is an instrument frequently used by technical personnel in a variety of commercial and industrial sectors, such as environmental, wastewater treatment, food and beverage industry (Awulachew, 2021; Kondjoyan et al., 2022; Wu et al., 2022), pool and spa, and horticulture (Ari and Darren, 2014). A high positive ORP can indicate the effectiveness of sanitizing agents (oxidizers) used to kill various pathogens in water (Kim et al., 2000). This ORP meter operates in many ways that are similar to conventional voltmeters, with the major difference being the ORP sensor electrode. Because the metal sensor is composed of the inert metal platinum, it isn’t an active participant in redox chemistry. The ORP reading is determined by comparing the voltage produced from the platinum electrode to the internal secondary silver-silver chloride electrode that is found inside the probe housing (Ari and Darren, 2014).
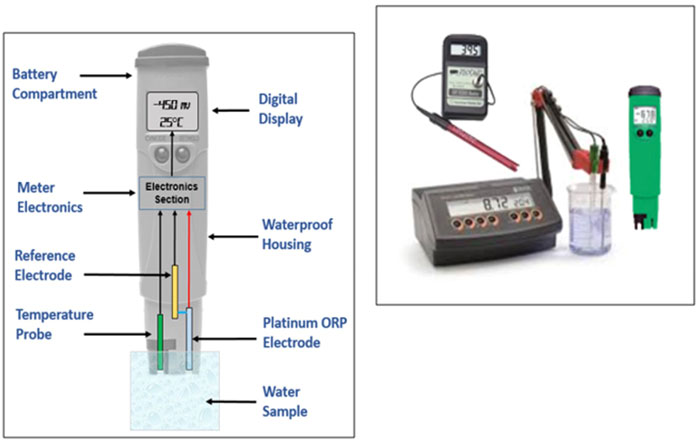
FIGURE 2. Pictorial diagram and some typical portable ORP meters
There are different types of ORP meters, from consumer-grade units to more sophisticated industrial/laboratory models. The portable ones generally have the probes integrated into the housing of the meter itself. The large ORP meters have their probes located externally in a separate enclosure, which is then connected to a flexible cable that goes to the meter. When the electrode is submerged in the sample water, electrons are either accepted or donated from the probe at the platinum surface. The exchange of electrons is used by the meter’s internal electronics based on its internal reference to generate a voltage measurement. The ORP meter will then digitally display this voltage in millivolts (mV) (Harris, 2010). Depending on the type of chemical species in the water, the displayed voltage will either be negative or positive. Hydrogen gas is only one of many reducing chemical species that can give a negative ORP reading.
2.4 Oxidation-reduction potential and voltage potential
A water’s oxidation-reduction potential indicates its tendency to be oxidizing or reducing. Discussions about ORP generally focus on the “O” (oxidation) and the “R” (reduction) (Ari and Darren, 2014), but detailed descriptions about the “P” (potential) component do not occur as often. The ORP describes some type of electrical potential and its units are expressed in volts (V). What this voltage reading actually tells us about the water, and the source of this potential will be addressed.
First, voltage is the difference in electrical potential energy between two points (Vujević et al., 2011). This is because a single object cannot have a “voltage”; a potential difference must be measured between two points. For example, the nine-volt battery in Figure 3 does not “have a voltage of 9 V.” The nine-volt potential exists only between the positive and negative terminals. This is similar to how altitude is referenced to sea level, or temperature is referenced to the freezing point of water. Figure 2 shows these points, the ORP platinum electrode where electron transfer takes place, and the internal reference electrode.
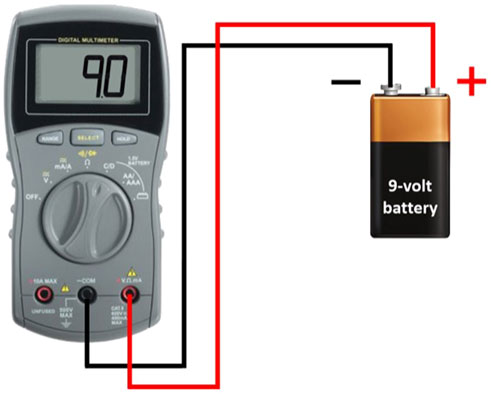
FIGURE 3. Illustration of a nine-volt battery.
A voltage potential is essentially the amount of work that can be done using electricity (the flow of electrons). A battery has the potential to do work because we can measure its voltage. A typical voltmeter measures the stored potential between the two terminals of the battery.
Importantly, voltage potential only refers to the tendency and directions that electrons might be transferred, not the number of electrons transferred. The larger the voltage potential, the greater the tendency. However, whether there really will be a transfer of electrons and the number, depends upon the resistance of the circuit to the flow of electrons. Similarly, the potential for electron transfer as measured by the ORP meter does not mean that electron transfer will readily occur. For example, if the wire connecting the lightbulb to the battery had high resistance due to corrosion, then, despite how good the battery was, its voltage potential may not be great enough to overcome the resistance. Similarly, chemical reactions need to be able to overcome another type of resistance (e.g., activation energy), possibly requiring energy from an outside source (e.g., heat) before they can proceed (Blanco and Blanco, 2022).
In biological systems, some less-obvious forms of work are accomplished. For example, when an antioxidant reacts with and neutralizes a reactive free radical, work is performed (Angelé-Martínez et al., 2022). A negative ORP itself does not tell us if a solution will exert antioxidant effects inside the body. This depends, not only on the identity and concentration of the chemical agent responsible for producing the negative ORP, but also as mentioned, on the ability of the reaction to overcome the “chemical” resistance, either on its own or with help (e.g., enzymatic catalysis) (Blanco and Blanco, 2022). Therefore, although the term “potential” refers specifically to voltage potential, the term also conveys a second meaning, that of “possibility.” Therefore, although a negative ORP indicates the potential for anti-oxidation, other factors must also be favorable in order for it to proceed.
2.5 Oxidation and reduction
The “O,” in ORP stands for “oxidation,” and the “R,” for “reduction.” This is where the term REDOX for REDuction and OXidation comes from. Redox reactions are those chemical reactions involving the transfer of electrons between two different chemical species (ions, atoms, or molecules); one species accepts electrons, while another species donates electrons (Nelson et al., 2008). Oxidation and reduction reactions must happen in conjunction with each other, i.e., when one species loses electrons, another must gain electrons. The species that loses electrons undergoes oxidation, whereas the species that gains electrons undergoes reduction (Alemanno, 2020). Configurations of the electrons dictate the chemical properties of a substance. Therefore, when the electron configurations are altered by redox reactions, the substance has a different set of chemical characteristics. Indeed, monitoring changes in redox potential can predict the oxidation of foods (e.g., lipids, meats, nutrients) (Kondjoyan et al., 2022) and food quality (Bhunia et al., 2017), as well as determine if the food packaging environment is favorable or not for bacterial growth (Roussel et al., 2022).
The redox reactions that produce O2 and H2 gas during the electrolysis of water are examples of oxidation and reduction reactions that occur simultaneously at the anode and cathode, respectively. During electrolysis, the cathode supplies the electrons that reduce hydrogen ions to hydrogen molecules (i.e., 2H+ + 2e− → H2) (Harris, 2010), as depicted in Figure 4. This reaction happens immediately (even without considering electron and proton tunneling, which also occur) (Hofbauer and Frank, 2012), meaning that the electrons from the cathode do not “swim” in the water as “free electrons” (Hofbauer and Frank, 2012).
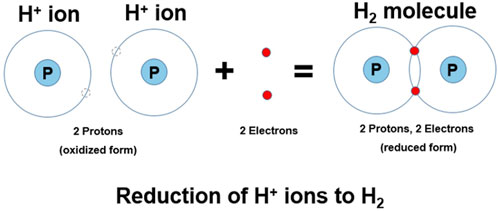
FIGURE 4. Pictorial representation of the reduction of hydrogen ions to form molecular hydrogen.
The reaction starts with the two H+ ions, essentially two protons (no electron), and after the redox reaction, the H2 molecule is formed and has two shared electrons. The disparity in electrons results in an energy potential between the two hydrogen species (i.e., H+ and H2). These two chemical species represent the “potential” to do work, which, when in water, can be measured by an ORP meter. Changing the concentration of either of these species will influence the ORP.
As discussed, each reduction reaction has a corresponding simultaneous oxidation reaction. Reduction occurs at the cathode, forming H2 (g), and oxidation occurs at the anode, forming O2 (g). Specifically, at the anode, hydroxide ions (OH−) are oxidized to produce O2 (g), water (H2O), and electrons (i.e., 4OH− → O2 + 2H2O+ 4e−). The produced electrons are sent to the anode which is connected to the positive terminal of the power supply (Zeng and Zhang, 2010).
In conventional alkaline water ionizers, the anode and cathode chambers are isolated from each other with a membrane, which prevents the two types of waters from mixing (Henry and Chambron, 2013). While the water from the primary (drinking water) hose will measure a negative ORP, the water that comes from the other hose has a positive ORP (Henry and Chambron, 2013). This water will measure a positive ORP because the produced acidic water contains different redox couples (e.g., an oxygen and/or chlorine species), rather than the H+/H2 redox couple (Ari and Darren, 2014). Other types of devices that do not use any membrane will produce water containing both dissolved oxygen and hydrogen gas. In this case, the water would have both oxidizing and reducing redox couples at a pH closer to neutral. Since our discussion about ORP focuses on hydrogen gas produced at the cathode, we will not spend time examining the anode reaction or its ORP/redox couples in detail. Interested readers are referred to (Aider et al., 2012).
2.6 Redox potential and the redox couple
Each chemical species has its own intrinsic tendency to give up or acquire electrons. They can be categorized according to their measured voltage potential. These voltage potentials are referred to as “standard reduction potentials” denoted as E° (Harris, 2010). Table 1 shows the standard reduction potentials for common half-cell reactions under standard conditions of concentration, pressure, and temperature. Their calculated values are relative to the standard hydrogen electrode (SHE), which has been assigned an arbitrary potential of 0.000 mV (Harris, 2010).
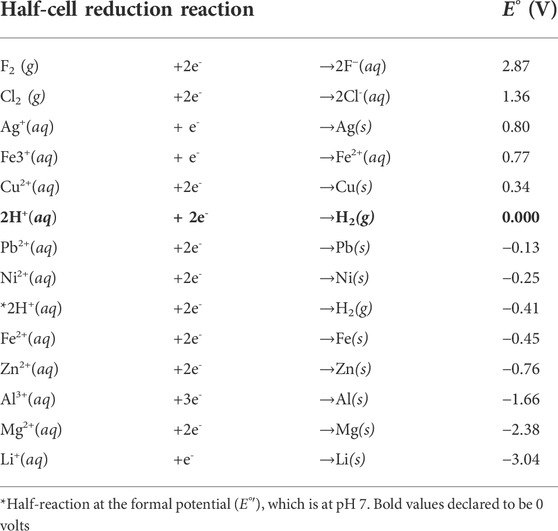
TABLE 1. Redox potentials for common half-cell reduction reactions.
Those with the most negative redox potentials are the strongest reducing agents, and conversely, those that have the highest positive redox potentials are the strongest oxidizing agents. Although Table 1 gives the standard reduction potentials, ORP meters report the potential under non-standard (or formal) conditions. The magnitude of the ORP reading, as well as whether it is positive or negative, depends on the specific identity and the relative concentrations of each species in the redox couple (Harris, 2010). A positive ORP suggests that the chemical species dissolved in solution will have a tendency to act as an oxidizing agent, while a negative ORP suggests that the chemical species in the water will be more prone to act as a reducing agent.
2.7 The hydrogen redox couple
While there are many redox couples in chemistry, a few of them noted in Table 1, we are concerned with the H+/H2 redox couple. This redox couple is seen in the reaction where two hydrogen ions (H+) each accept an electron to make one molecule of H2 (2H+ + 2e− → H2). This could also be written as one hydrogen ion accepts one electron to form atomic hydrogen (i.e., H+ + e− → H•). However, atomic hydrogen is a free radical that quickly reacts with another atomic hydrogen to form hydrogen gas (i.e., H• + H•→ H2 gas). Multiplying half reactions by any coefficient does not change E. The hydrogen ion (H+) is the oxidized form of hydrogen, containing no electrons, and the H• or H2 are the reduced forms, containing one or two electrons, respectively (see Figure 4). The H+ ion does not have any electrons, but is a single proton willing and ready to accept electrons. The newly formed H2 molecule, on the other hand, contains two electrons, which allows it (under the right conditions) to donate them, acting as a reducing (or anti-oxidizing) agent (Ohsawa et al., 2007).
2.8 The hydrogen ion (H+) concentration (pH)
It is helpful to review some primary concepts about pH since, as we will see, it has a strong influence on the ORP reading (Jackson et al., 2018). The term, pH, stands for “potential of hydrogen,” and is a measure of the concentration of the hydrogen ions (H+) (Nelson et al., 2008). Hydrogen (H+) ions are essentially the acidic constituent of water. The greater the H+ concentration, the more acidic the water. The pH has a direct influence on the ORP reading because one of the two species, the H+ ion, is in our redox couple of interest (i.e., H2/H+). The pH scale is a more understandable way to express very small numbers as powers of ten (exponents), instead of using the equivalent and more cumbersome scientific notation. For example, instead of writing 1 × 10⁻⁷ or 0.0000001 for the H+ concentration, we can write pH 7. The pH scale is a logarithmic scale in which the concentration of H+ ions is expressed as a negative power of 10, and goes from 0 to 14. The equation is pH = −log [H+].
Importantly, because pH is a logarithmic function, every unit change in pH represents a ten-fold change in the H+concentration. Consequently, relatively small integer increases in pH, represent very large changes in the H+ concentration. Therefore, a pH of zero represents a 1 M H+ ion concentration, while a pH of 14 represents a very low H+ (1 × 10⁻¹⁴ M) concentration. The concentration of H+ ions determines whether the water is considered neutral (pH 7), acidic (below 7), or alkaline (above 7). Table 2 illustrates the exponential (logarithmic) relationship between the pH and the concentration of the hydrogen ions.
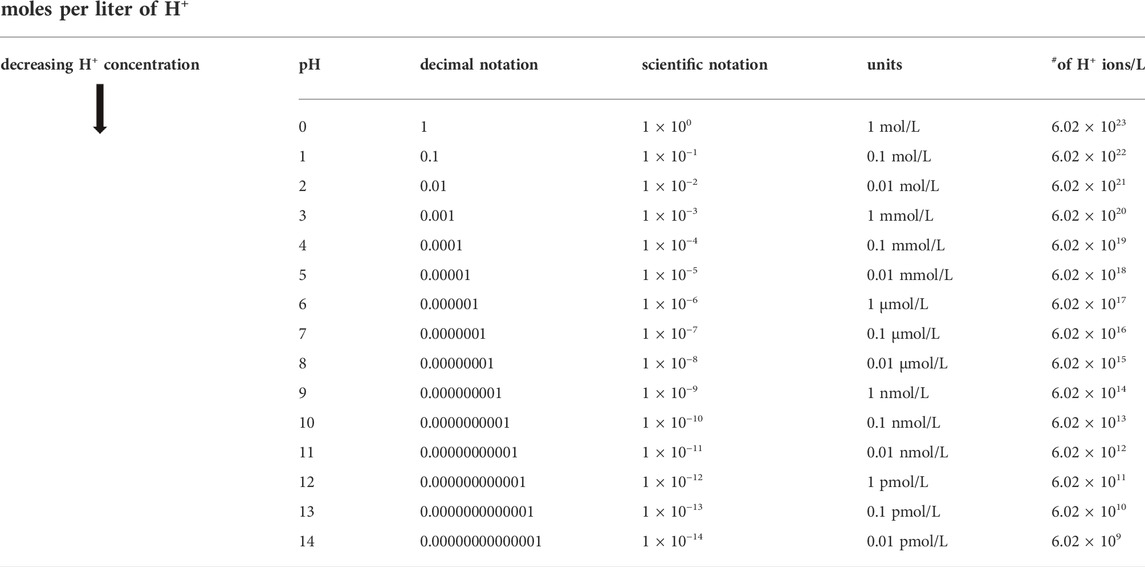
TABLE 2. Relationship between pH and the hydrogen ion concentration.
Importantly, pH is not associated with dissolved H2 gas. However, some methods used to make hydrogen water can change the pH of the water. For example, ERW produced by an alkaline ionizer has an alkaline pH. This occurs due to the electrolysis of water, where hydrogen ions are reduced to H2 at the cathode. There is an increase in pH because the H+ ions (acid) are being consumed, and the level of OH− ions (base) increases (Henry and Chambron, 2013). Unfortunately, the correlation between increased pH and dissolved hydrogen gas in ERW has led to confusion. This misunderstanding is exacerbated by the fact that the higher the pH the greater the negative ORP, which is often assumed to indicate more hydrogen gas. In fact, some marketers confuse the term pH and incorrectly interpret it to mean “potential of hydrogen gas,” falsely suggesting the higher the pH the higher the hydrogen gas concentration, instead of the more correct meaning “potential of hydrogen ion”, which signifies the higher the pH the lower (not higher) the hydrogen ion concentration. Bubbling H2 gas into water will not change the water’s pH because molecular hydrogen is neither acidic nor basic, as it does not readily donate or accept H+ ions (Korchef, 2022).
2.9 The Nernst equation
German chemist Walther Nernst formulated what is now widely known as the Nernst equation (Cropper, 1987). The Nernst equation represents the thermodynamic relationship of the standard redox potential to the effective concentration (activity), pressure, and temperature of a chemical species undergoing a redox reaction under non-equilibrium conditions (Cropper, 1987). In the field of electrochemistry, it is perhaps the most helpful equation. Eq. 1 depicts the generalized form of the Nernst equation:
The Nernst equation can be used to determine how the contributions of dissolved hydrogen gas, pH, and temperature influence the ORP reading. In order to utilize the Nernst equation to calculate expected ORP values for ERW/hydrogen water, we need to substitute the values for the half-reaction of hydrogen: i.e., 2H+(aq) + 2e− → H2(g). Because E0, the standard cell potential, is zero for the hydrogen half-reaction (see Table 1), we can eliminate that term. The term “[red]” is substituted with the pressure of hydrogen gas, “PH2”, which is the reduced form of hydrogen, and the term “[ox]” with the concentration of the oxidized form of hydrogen, “H+”.
The final form of the Nernst equation used in this analysis is shown in Eq. 2:
where:
• E, Nernst potential in volts (ORP),
• R, universal gas constant, 8.314 J•K−1mol−1,
• T, temperature, 298.15⁰ K (25°C),
• n, number of electrons transferred in the reaction, 2,
• F, Faraday constant, 96,485 Cmol-1 (electron charge/mole),
• [H2], hydrogen gas concentration (in partial pressure, PH2), and
• [H+], hydrogen ion concentration (derived from the pH).
Figure 5 illustrates the two chemical hydrogen species from the modified Nernst equation (Eq. 2) which form our “redox couple of interest.” This term provides helpful insight into how the ORP is determined.
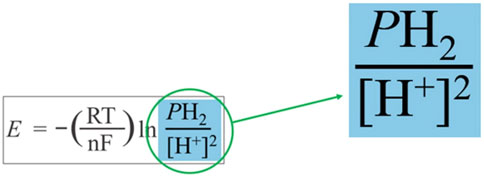
FIGURE 5. The two chemical species of interest for calculating the redox potential of hydrogen water.
The oxidized and the reduced forms of hydrogen represent the two chemical species in the water whose concentrations primarily contribute to the redox potential of hydrogen water. While water usually contains multiple redox couples whose different redox potentials combine to produce the overall ORP (Ari and Darren, 2014), in our in silico calculations, we consider only the H2/H+ redox couple.
3 Investigation of oxidation-reduction potential as a function of pH, H2, and temperature: In silico analysis from theory and calculations
In the case of hydrogen water, the ORP reading is essentially dependent on two factors 1) the molecular hydrogen concentration, and 2) the H+ (pH) concentration. The relationship between these two species begs a few questions:
• What concentration of molecular hydrogen is needed to achieve a negative ORP?
• To what degree does the ORP respond to changes in pH, temperature, and H2 concentration?
• Can the ORP measurement be used to estimate the concentration of molecular hydrogen?
• Can the ORP measurements from two different water samples be compared to determine which one has more dissolved H2?
We investigate these questions via an in silico analysis using the Nernst equation. We evaluate how changes in temperature, H+, and H2 influence the ORP reading. The results of this analysis are illustrated and discussed below for each one of these variables.
3.1 The relationship between dissolved H2 concentration and oxidation-reduction potential
By keeping pH, temperature, and pressure constant, we can determine how changes in only the H2 concentration influence the ORP. Figure 6 shows the predicted ORP readings for an H2 concentration of 0.5 mg/L to 50 mg/L at a pH of 7. Remember, H2 saturation in pure water at Standard Ambient Temperature and Pressure (SATP) is approximately 1.6 mg/L, and the typical range for studies is between 0.5 and 2 mg/L.
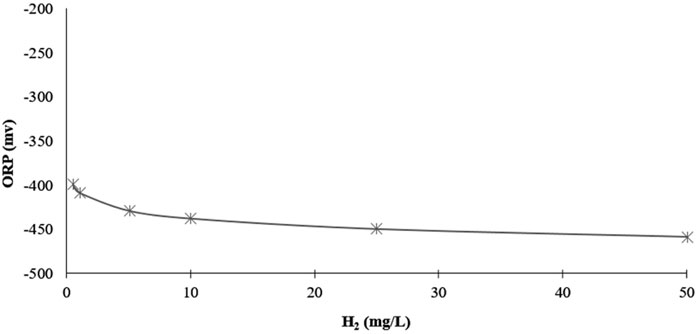
FIGURE 6. Predicted influence of dissolved H2 concentration on ORP values at a constant pH (7) and temperature (25°C).
Between the dissolved H2 concentrations of 0.5 mg/L to 2 mg/L, the negative ORP decreases by only 18 mV. This rather small change in ORP obfuscates the fact that it is a fourfold increase in H2 concentration, which, therapeutically, could be the difference between no effects and clinical effects. Moreover, increasing the concentration from 0.5 mg/L to 50 mg/L, the negative ORP decreases from −399 to −459 mV, only 59.16 mV more negative. Although such a high dissolved H2 level could likely only be achieved under laboratory conditions, this, nevertheless, illustrates just how little the ORP responds to even extremely large changes in the H2 concentration.
Moreover, the Nernst equation predicts that an H2 concentration of only 1 × 10⁻⁵ mg/L (orders of magnitude below therapeutic levels), is all that is needed to produce a negative ORP of −260 mV. However, a dissolved H2 concentration this low would only produce this specific negative ORP “on paper,” only based on the Nernst equation without considering any other redox couples in the water. In fact, that is more hydrogen than is naturally dissolved in water (≈8.65 × 10⁻⁷ mg/L) when at equilibrium with the 5.5 × 10⁻⁵% H2 in the atmosphere. However, due to the presence of oxidizing redox couples at higher concentrations that are also dissolved in solution (e.g., a chlorine and/or oxygen species), regular water measures a positive ORP. Nevertheless, this example shows that even a very low concentration of H2 is capable of producing a negative ORP. It also illustrates how little the ORP reading can actually tell us about how much H2 the solution contains.
3.2 The relationship between pH and oxidation-reduction potential
To evaluate the influence that changes in only the H+ concentration (pH) have on the ORP, we can change the pH, while maintaining a constant H2 concentration and temperature. Figure 7 depicts the predicted ORP readings for six different values of pH, all at the same temperature (25°C) and dissolved H2 concentration (1.57 mg/L). As can be seen, in contrast to the weak impact of H2, the magnitude to which pH changes the ORP is very significant.
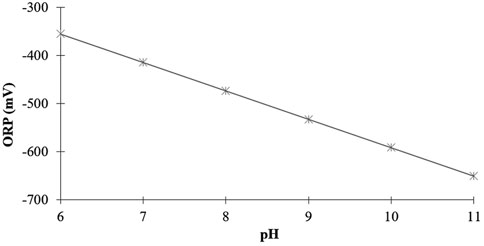
FIGURE 7. Predicted influence of pH on the ORP values at a constant 1.57 mg/L H2 concentration at 25°C.
For example, as the pH increases from six to eleven, there is a significant increase in the negative ORP, from −355 mV to −651 mV. The ORP becomes more negative by 296 mV, while the temperature and H2 concentration stay the same. Because the ORP changes almost exclusively because of changes in pH, the magnitude of the ORP reading does not really provide any helpful information regarding the actual concentration of molecular hydrogen in the water.
3.3 Comparing the impact of H2 and pH on oxidation-reduction potential
After examining the individual influences that differences in H2 and pH have on the ORP, it is also informative to evaluate their combined impact. Figure 8 shows a graph with two horizontal axes that plots the lines for both ORP vs. H2 and ORP vs. pH. Similar to the previous example, the graph of ORP vs. pH has the H2 constant at 1.57 mg/L, and the graph of ORP vs. H2 has the pH kept neutral. In both cases, the temperature is held constant at 25 °C.
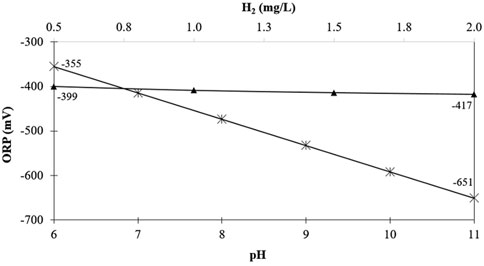
FIGURE 8. Influence of pH and H2 concentration on predicted ORP values. ORP vs. pH ( ) ORP vs. H2 (
 ).
).
As illustrated in Figure 8, over a common concentration range of molecular hydrogen (0.5–2 mg/L), the ORP will deviate by only 18 mV. However, over the given range in pH (6–11), the ORP will change by 296 mV. These examples clearly illustrate that the ORP reading is largely governed by the water’s pH, as the contribution from H2 is relatively small.
3.4 Why does pH have a greater impact on oxidation-reduction potential than H2?
It has so far been demonstrated by in silico analysis that the ORP reading changes predominantly with changes in pH and insignificantly with changes in H2. We briefly summarize why this is true.
3.4.1 Concentrations of H+ are expressed exponentially (pH)
As discussed earlier, the pH scale represents the changes in the hydrogen ion concentration by powers of 10. Thus, a one unit increase in pH corresponds to a ten-fold decrease in the hydrogen ion concentration (101 = 10). Since minor changes in pH correspond to exponential changes in the H+ concentration, even a seemingly small change in pH represents a very significant change in the true concentration of H+ ions. It is common for the pH of hydrogen water to span more than several units of pH, which means the H+ concentration can vary by a factor of 100,000 or more.
3.4.2 Concentrations of H2 are expressed linearly.
Unlike H+ concentrations, H2 concentrations are expressed on a linear scale, milligrams per liter (mg/L), and span a significantly smaller range of concentrations than H+. As a result, compared to the large changes possible in H+, changes in H2 typically represent relatively small changes. For example, expressing concentrations of H2 as powers of ten like pH, then a concentration range of 0.5–5 mg/L would represent a change of only a factor of ten, not even close to the factor of 100,000 possible with the range of pH often encountered with hydrogen water. This inequality in the concentration ranges between H2 and H+ illustrates why H2 influences the ORP reading significantly less than the pH. Moreover, although a change in H2 level from 0.1 mg/L to 1 mg/L has an imperceptible impact on the ORP, and thus appears to be very small, it, nevertheless, is very significant from a perspective of therapeutic benefit, (Slezak et al., 2021).
3.4.3 The Nernst equation has an exponential math operation on the [H+] term.
Figure 9 focuses our attention on the H2 reaction equation along with the Nernst equation using the H2/H+ redox couple. This illustrates another reason for the dominating force of pH on the ORP reading:
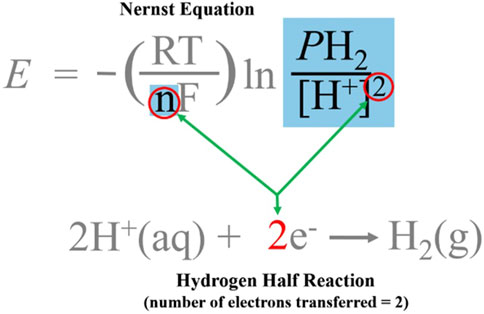
FIGURE 9. Graphical representation of the Nernst equation.
In the blue box of Figure 9, the denominator, “[H+]”, includes the exponent “2” outside of the brackets (circled in red), while the numerator [H2], does not. The equation underneath shows that the source of this exponent is the coefficient of “e−”. The Nernst equation requires that the number of electrons used to convert the oxidized species (H+) of the redox couple to its reduced form (H2 gas) must be expressed as an exponent for the [H+] term. The number of electrons needed for the reduction reaction has to be accounted for when calculating the new reduction potential (Harris, 2010). This exponent of “2” signifies that the [H+] term must be raised to the second power (square), whose value, when expressed as pH, is already an exponential expression of the H+ concentration. However, no similar exponential function is performed on the PH2 term. By changing the H+ concentration by a factor of 10, Q (the quotient) changes by a factor of 100, which results in a change in ORP of 59.16 mV. At 25°C, a change in Q by a factor of 10 changes the ORP by 59.16/n mV. In our case, n = 2, which means a factor of 100 change in Q is necessary to change the ORP by 59.16 mV. This can be done by changing the H+ concentration by a factor of 10 (a one-unit change in pH) since it is squared in the denominator (102 = 100), or by increasing the concentration of H2 100 times. This exponential math operation in the Nernst equation clarifies why an ostensibly minor change in the pH of the water (of even just a few tenths) results in such a large change on the ORP reading, essentially, overpowering the relatively imperceptible impact of the H2 on the ORP.
These three points lucidly illustrate why even ostensibly small changes in pH represent exponentially large changes in the actual H+ concentration. Consequently, the large influence of pH on the ORP measurement overpowers the minor impact of H2, and effectively “controls” the ORP reading.
3.5 Relationship between oxidation-reduction potential and temperature
Most ORP meters do not have a temperature probe that adjusts the voltage reading. Compared to the very minor influence of molecular hydrogen on ORP, temperature differences are much more significant. The temperature dependence of ORP is an intrinsic part of the Nernst equation, contained within RT/nF. Since n (number of electrons) equals 2, the only term in RT/nF which is not a constant is temperature (T). This means that, even when not considering the ratio of the redox couple, every ∆T of 20°C, changes the ORP by ≈ 30 mV. This is comparable to changing the H2 concentration by a factor of 10 (0.1 mg/L to 1 mg/L) and is essentially the same as changing the pH by ½ a unit. These changes in ORP as a function of temperature are illustrated in Figure 10, where the value of Q remains constant by keeping the H+ and H2 pressure constant (pH, 7; pressure, 1 atm). As the temperature increases, the magnitude of the negative ORP increases, despite the actual concentration of H2 decreasing. For example, at 0°C the solubility of H2 is 1.96 mg/L, which gives −379 mV; whereas, at 100°C, the H2 solubility is only 0.97 mg/L but the ORP is now −518 mV. According to the Nernst equation, at a pH of 7 and 25°C, the concentration of H2 required to produce the same −518 mV is 5,500 mg/L. Therefore, as shown in Figure 10, despite the solubility of H2 at 0°C being nearly twice as much compared to 100°C, the change in ORP would give the false impression that, instead of decreasing by twice as much, the H2 concentration increased by nearly 3,000 times.
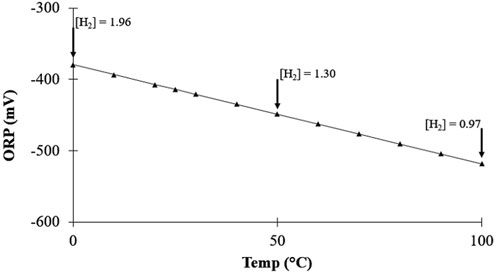
FIGURE 10. Relationship between ORP and temperature showing the change in H2 solubility ([H2] in mg/L), at constant pH (7) and H2 pressure (1 atm).
This can have very significant implications in real-world applications. For example, using an ORP-based method that does not include temperature compensation to estimate the H2 concentration of cold hydrogen water (e.g., stored in the refrigerator) in which the solubility of H2 is higher, would give you a less-negative ORP reading, underestimating the actual H2 concentration compared to measuring it at room temperature (25 °C). Similarly, researchers using this ORP method to estimate the H2 concentration at incubation temperature (37 °C) would overestimate the actual H2 concentration.
3.6 Larger negative oxidation-reduction potential readings do not signify more molecular hydrogen
As has been illustrated, the negative ORP reading cannot be directly associated with any specific concentration of aqueous molecular hydrogen. However, the question remains as to whether it is possible to compare the ORP reading from two different water samples to evaluate the relative amounts of molecular hydrogen that they contain. Theoretically, this would be possible if we knew the exact pH, temperature, and ORP of only the H2/H+ redox couple. However, since ORP and ORP-based H2-meters usually do not have this information, they must assume an exact pH and temperature, likely 7 and 25°C, which, as discussed, is rarely the case for water. Even so, on the surface, a rational supposition might be that the greater the water’s negative ORP, the higher the concentration of molecular hydrogen. However, the data in Table 3 shows why this assumption is not necessarily true.
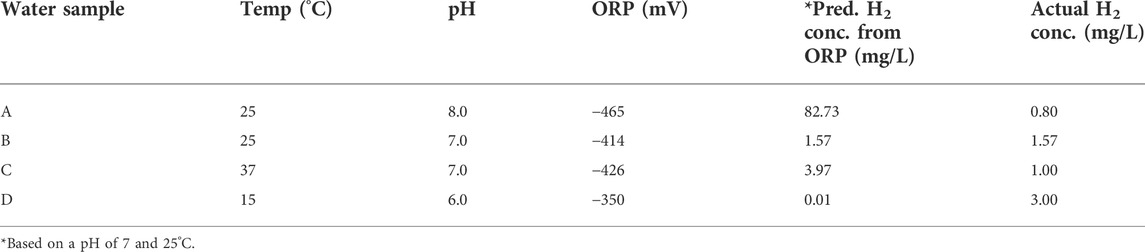
TABLE 3. Predicted ORP of four waters with different pH, H2, and temperatures.
Hypothetically-measured ORPs for hydrogen waters having different pH values, dissolved H2 levels, and temperatures are shown in Table 3. Additionally, the predicted H2 concentration based on the hypothetical ORP reading, without corrections for pH and temperature (assumption 7 pH and 25°C), are presented. Because the pH of sample A is one pH unit higher than B’s, it has a more negative ORP, even though B has twice the concentration of H2. Similarly, sample C at the higher temperature appears to have more H2 than sample B despite having 38% less H2. Moreover, there could be many permutations of slightly increased pH and elevated temperature that individually may not seem significant, but collectively have consequential effects. For example, sample D has a slightly acidic pH, like reverse osmosis/distilled water, from absorbing CO2, and a lower temperature (15°C). Despite a high actual H2 concentration, its lower pH and temperature result in an ORP reading that is significantly less negative than all the other samples. Using the Nernst equation, the estimated H2 concentration from this ORP reading, assuming 25°C and pH 7, would give a large underestimation of the true H2 concentration (0.01 mg/L vs. 3 mg/L).
These scenarios demonstrate why it is wrong to presume that, if one water has a more negative ORP reading than another, then it also has a greater concentration of molecular hydrogen. Some marketers may employ the technique of reducing the flow rate of an alkaline water ionizer to a “trickle” or increasing the temperature before measuring the ORP. However, as illustrated, a greater negative ORP does not necessarily signify a higher concentration of molecular hydrogen. Indeed, the water with the more negative ORP may easily contain a lower concentration of molecular hydrogen.
Theoretically, an ORP-based H2 meter would work if the measured ORP was truly an accurate ORP value. But, in order to achieve an accuracy in H2 concentration of ≈ ± 0.1 mg/L, such a meter would need to be able to determine the exact differential or potential between only the H+ and H2 species within approximately ±1 mV. However, normal ORP meters cannot do this and, in hydrogen water, ORP readings often have an error range of ±100 mV, depending on a variety of factors (e.g., pH, temperature, H2 concentration, minerals, etc.). This precludes us from obtaining an accurate E. Therefore, the only way to determine the H2 concentration using the redox potential (E) would be to first determine the concentration of each redox species of interest (i.e., H2/H+). Once the concentration of each is known, then the equation can be solved for E, and then finally for PH2. This value is then converted to concentration of H2 (C) as shown in Eq 3, which is a rearrangement of the Nernst equation (Eq. 2) combined with Henry’s Law (i.e., C=P/Kh).
However, if it is required that we know the H2 concentration in order to use the ORP method (i.e., E value) to determine the H2 concentration, then there is no point in determining the ORP at all, when one could simply stop after directly obtaining the H2 concentration.
3.7 Oxidation-reduction potential meter error: Accuracy and precision
All measurements require a certain level of accuracy (proximity to the true value) and precision (reproducibility of results) to be valid. The degree of accuracy and precision are intrinsically linked to the measuring instrument and, along with systemic errors, contribute to the uncertainty of the results. When measuring a calibration solution, ORP meters typically have a range of ±5 mV. While this may not seem like a lot, this 10-mV range corresponds to an error of H2 estimation of ≈ ± 1 mg/L. This alone represents a significant problem since the normal range of H2 often used by the researcher and consumer is between 0.5 and 1.5 mg/L. However, the situation may be even less favorable with hydrogen water because, as discussed, the error range of an ORP meter when measuring hydrogen water may be as large as ± 100 mV. This is significant, as it corresponds to an error in H2 estimation of ±500 mg/L. Therefore, the ORP meter’s contribution to uncertainty might be greater than the combined influence of pH and temperature. Table 4 shows the different sources of error from typical consumer-grade (not lab-grade) sensors for ORP, pH, and temperature devices in measuring neutral-pH water with a hydrogen concentration of 1.57 mg/L. For example, the ORP may deviate by 100 mV from its true value of -414 mV. This corresponds to either a significant underestimation (0.0006 mg/L) or an egregious overestimation (3,750 mg/L) of the H2 concentration. Similarly, even if we tried to correct for pH or temperature by measuring their values, these instruments still contain inherent error ranges that likewise result in significantly under or overestimating the true H2 concentration. Indeed, the rather minor ±0.1 error in pH corresponds to an error that spans a 1.50 mg/L range (0.99 mg/L to 2.49 mg/L).
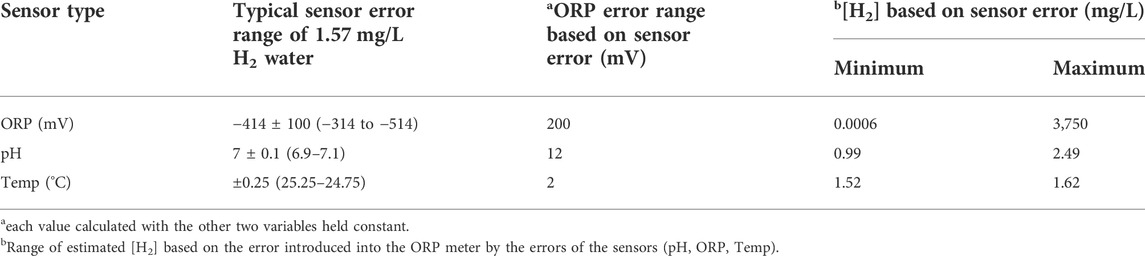
TABLE 4. H2 measurement error for ORP-based H2 meter with pH and temperature compensation based on [H2] of 1.57 mg/L, pH 7, and temperature 25°C.
In order to have the lowest practical resolution of 0.1 mg/L for H2 concentration, the ORP meter would have to be accurate within about 0.8 mV, which, as expected, is not even attainable when using normal calibration solutions. The possible ranges of error for each instrument are essentially greater than the tolerance required for a meaningful ORP reading. These errors are further compounded when used to estimate the H2 concentration, which precludes the use of ORP for this purpose.
4 Discussion
Our in silico computational calculations and analysis of the relationship among pH, H2, temperature, and ORP demonstrate that ORP and ORP-based meters should not be used to estimate the dissolved levels of molecular hydrogen, especially since they may not have a temperature probe to make important corrections. The Nernst equation illustrates how biologically significant changes in H2 concentration essentially have an imperceptible influence on the ORP compared to even very minor changes in pH and normal variations in temperature.
ORP and ORP-based hydrogen meters should not be confused with more accurate and expensive technologies that specifically measure molecular hydrogen. Examples include gas chromatography and certain H2 meters that incorporate ultra-sensitive H2 sensors (polarographic/voltammetric) (Boshagh and Rostami, 2020). These tools, used mainly for scientific and industrial use, are often beyond the reach and/or usability of the typical consumer. This makes the use of ORP-based hydrogen meters an attractive option but unfortunately, as demonstrated, also problematic. ORP-based H2 meters endeavor to report the H2 concentration via determining the water’s negative redox potential. This results primarily from the contribution of the H+ species (represented by pH) of the H2/H+ redox couple, and from the temperature of the water, but only to a relatively small degree from the H2 species of the redox couple. Nevertheless, these relatively inexpensive digital hydrogen meters available on the market are often used by consumers and researchers (Tanaka et al., 2020).
The meter attempts to calculate the dissolved H2 level from the water’s redox potential. Theoretically, this should be possible but would require very accurate measurements of the pH and temperature, as well as knowing the contribution to the ORP from only the H2/H+ redox couple. This is unlikely for normal ORP instruments and ORP-based H2 meters that do not require making a standard calibration curve. Additionally, while ORP meters cannot be used to specifically measure H2, they also have several inherent shortcomings, which reduce their utility for even their intended purpose of measuring ORP.
Consider the following points regarding ORP-based H2 meters:
1) If the ORP-based H2 meters do not have a pH probe, it requires that the solution being measured has a pH of exactly 7, which is what the meter would assume. However, as mentioned, since most solutions rarely have exactly a neutral pH, minor deviations from 7, even as small as ½ of a pH unit, will impact the ORP reading by as much as the entire contribution made by an H2 concentration over the normal range of 0.2–2 mg/L (≈29.58 mV).
2) Water contains other redox couples that contribute to a positive redox potential. This positive ORP works in opposition to the negative ORP from the presence of molecular hydrogen. Mixed potentials are often present and depend on different redox couples, including bicarbonate ions. However, despite being aware of their presence, there is no easy way to subtract their contributions to the overall redox potential. Therefore, they may influence the ORP reading in an unpredictable way and skew the reported H2 concentration.
3) As demonstrated, temperature also influences ORP. However, most consumer-grade ORP meters do not compensate for temperature. This can be significant because, at a neutral pH, changing the temperature from 5°C to 25°C, changes the ORP by −30 mV. To get the same 30-mV change by H2, its concentration needs to increase tenfold. In other words, a ∆T of 20°C influences the ORP to about the same extent as does a ½ unit change in pH.
4) For most in vivo studies or consumer use of hydrogen water, it is important to be able to measure within 0.1 mg/L of hydrogen. This would require an ORP accuracy of about 0.8 mV
5) To the authors’ knowledge, only positive calibration solutions exist. Even if negative ORP calibrations were available, it would not change the fact that ORP meters are not specific to the hydrogen molecule.
6) Some ORP measurements can require a long time before the readings stabilize, possibly as long as 60 min. But, in hydrogen water with a half-life of only ≈1–2 h, a significant amount of dissolved H2 would be lost while the ORP equilibrates.
7) The ORP meter may yield unstable readings in solutions containing redox-active molecules, and the ORP given would not be only from the H2/H+ redox couple.
8) Chemical substances that have more than one redox state may not always exhibit reversible behavior at the platinum electrode surface.
These inherent weaknesses further illustrate why ORP meters and ORP-based hydrogen meters are not recommended to estimate dissolved hydrogen in aqueous solutions.
4.1 Oxidation-reduction potential and the relative hydrogen score
Any redox reaction that involves hydrogen ions is subject to the overwhelming influence that pH has on the ORP reading. Most redox reactions that occur in aqueous solutions either involve hydrogen ions directly as part of the reaction or are influenced by the changes in pH. This has led to the attempt to remove the influence of pH by mathematically transforming the ORP reading. This is referred to as the relative hydrogen score (rH or rH2). This method was first proposed by W.M. Clark in 1923 for evaluating the redox capacity of a system (Clark and Gibbs, 1925). This rH index is based on the Nernst equation and Gibbs free energy using the Boltzmann constant to make it pH-independent relative to the standard hydrogen electrode (SHE). This is then used to estimate the solution’s antioxidant capacity (Henry and Chambron, 2013). The rH score ranges from 0 to 42, where 28 is considered neutral. Although this method may have some benefits in some areas (Clark and Gibbs, 1925), it also has fundamental problems in biochemistry, nutrition, and ecology (Garban, 2008). Moreover, since the rH score is derived from the ORP and pH, it maintains the same inherent errors and limitations as previously delineated for all ORP-based measurements. Additionally, like ORP, the rH score doesn’t consider the identity or the concentration of chemical specie(s) responsible for the rH score, or the conditions to determine if a redox reaction would occur at a meaningful timescale. These intrinsic problems of ORP are obfuscated by the mathematical transformation to the rH score. Accordingly, the use of rH score in evaluating the physicochemical properties of hydrogen water is not recommended.
4.2 Applying these results to hydrogen-water devices and technologies
Over the past decade novel hydrogen water technologies have emerged. Irrespective of the method used to make hydrogen water, the relationships among H2, pH, temperature, and the predicted ORP remain the same. Unfortunately, it is likely that the ORP meter will continue to be used by marketers, researchers, and those in the food and beverage industry as tool to promote or evaluate a hydrogen water product. However, due to the disproportionate impact of pH on ORP, neutral-pH devices will produce water with less-negative ORP measurement compared to alkaline water. This is even despite the fact that the neutral-pH water may have the same or even a much greater concentration of H2. For example, the Nernst ORP prediction for H2 water at a pH of 7 and a concentration of 1.57 mg/L is −414 mV. However, water at 9.5 pH with tenfold less H2 (0.16 mg/L), a concentration lower than what is used in clinical studies, will measure −533 mV. Similarly, H2-producing tablets often used in clinical studies (LeBaron et al., 2019b; Korovljev et al., 2019; LeBaron et al., 2020) can provide a high concentration of H2, >7 mg/L, but due to their acidic pH (≈4), the measured ORP is predicted to only be around −256 mV. Those promoting and selling alkaline water devices might knowingly or unknowingly exploit the ORP difference (due solely to a difference in pH and/or temperature), and use it to convince potential customers that, based on its more negative ORP, the alkaline water has a higher level of dissolved H2 and/or has more therapeutic benefit than the neutral or lower pH water of their competitors.
Importantly, because ORP meters are not specific to the H2 molecule, other redox couples including antioxidants (e.g., vitamin C at high pH) can give water a negative ORP. This can be interpreted by the ORP-based H2-meter as either a higher concentration of H2 than truly exists, or as even the presence of H2 when none exists. Moreover, a negative ORP does not always signify a therapeutic benefit. Some toxic substances can also produce a negative ORP (e.g., β-Mercaptoethanol). It is critical to know what the chemical species in the water is that responsible for the negative ORP, as well as the concentration of that substance. Figure 11 shows a flow chart decision tree of how to navigate water claimed to have a negative ORP and/or contain molecular hydrogen. If the water truly does have hydrogen, it will have a negative ORP, meaning we can reject water purported to be hydrogen water if its ORP is positive. However, as mentioned, just because water has a negative ORP does not mean that it contains hydrogen, as other substances, including toxic ones, could be responsible for the negative ORP. It should first be confirmed what the identity of the chemical species is. Finally, since the ORP meter does not indicate the concentration of the chemical species, the concentration should be specifically determined as it may not have any biological activity when ingested.
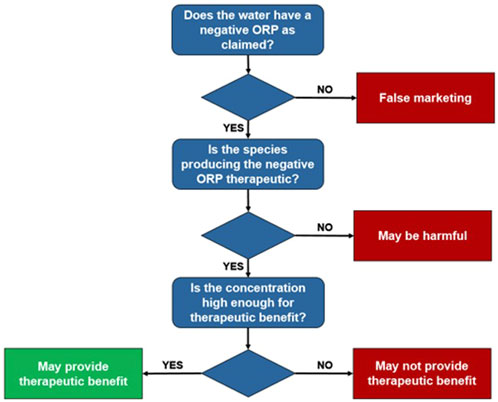
FIGURE 11. Flow chart to navigate water with a “claimed” negative ORP.
With an understanding of the concepts presented here, researchers and consumers can understand why the magnitude of the “negative ORP measurement” does not indicate either the concentration of molecular hydrogen or the potential therapeutic benefits of the water. The main value of the ORP meter might be that it does demonstrate a difference between hydrogen water and other waters. Hydrogen water at a concentration of 0.05 mg/L to >5 mg/L will measure a several hundred negative millivolts reading. Therefore, although a high negative ORP does not mean that there is a sufficient concentration of hydrogen, it does mean that, if the hydrogen water measures a positive ORP or only a slightly negative ORP, then it most likely does not contain molecular hydrogen, or at least not enough for a therapeutic effect. Thus, a rapid ORP test might be useful in some scenarios but could be problematic when not interpreted correctly.
4.3 Limitations to the in silico analysis
The analyses and calculations were performed only with the variables found in the equations. We did not calculate the activity coefficients or discuss instrument limitations (e.g., drift in junction potential, sodium, acid error, etc.). Moreover, we did not consider equilibration time or reaction kinetics with the many other potential redox-active chemical species in water. Lastly, we made general assumptions based on the Nernst equation about ORP meters and ORP-based H2 meters and how they would respond to changes in pH, H2, and temperature. However, there could be additional algorithms and trade-secret computations that adjust for some of these errors. For example, our in silico calculations may suggest an error much greater than what is normally seen in practice. This may be particularly true for a small range of hydrogen water concentrations (e.g., 0.5 mg/L to 1.5 mg/L), at or near neutral pH and room temperature. On the other hand, the deviation from the actual concentration may be more than what is predicted by the calculations. Indeed, not all redox-active species were considered (e.g., oxygen, chlorine, minerals). Additionally, at the extreme ends of pH, temperature, and H2 concentrations, the error might be compounded due to the meter’s lack of sensitivity. Experimental analysis in real-world situations on these issues is required before drawing definitive conclusions. However, this in silico analysis of the significance of pH and temperature provides a foundational framework for ORP/ORP-based H2 meters that should be considered by consumers and researchers.
4.4 Final recommendations
Because of the shortcomings of ORP measurements, the International Hydrogen Standards Association (IHSA) has specifically discouraged the use of ORP sensors and ORP-based hydrogen meters by researchers, consumers, and companies. Instead, the gold standard for hydrogen measurements is gas chromatography performed by a qualified expert. IHSA also approves of certain types of hydrogen meters/sensors that selectively measure the H2 molecule. This is often based on polarographic, voltammetric, and other intrinsic properties of the H2 molecule (Boshagh and Rostami, 2020). With all of these measurement techniques, a standard calibration curve is created using known concentrations of molecular hydrogen, and then the concentration of the unknown sample is determined by comparing it to the calibration curve. To the authors’ knowledge, the only simple and relatively accurate method of measuring dissolved H2 concentration is with a redox titration reagent (e.g., MiZ, Japan; and H2Blue®, United States of America). The reagent comprises methylene blue and platinum nanoparticles, which act as a catalyst to facilitate the reduction of methylene blue (blue color) to leucomethylene blue (clear) (Seo et al., 2012). For these products, the user simply adds a 6-ml aliquot of hydrogen water to a beaker, followed by stepwise drops of the reagent until the titration endpoint is reached. Typically, one drop represents 0.1 mg/L of dissolved H2, thus, if 16 drops are required to reach the titration endpoint, the concentration of H2 is 1.6 mg/L. However, this also has its limitations (e.g., not specific to H2, catalyst can be poisoned, etc.).
5 Conclusion
Based on our in silico analysis of the impact that molecular hydrogen, pH, and temperature exert on the ORP, it is demonstrated that, compared to pH and temperature, the level of dissolved hydrogen gas in the water plays a minor role in the ORP reading. Therefore, while molecular hydrogen is the species responsible for the negative ORP measurement, we can only conclude, based on a negative reading, that, excluding the possibility of other redox couples that give a negative ORP, some level of dissolved H2 is present in the water. Inherent fluctuations in the ORP meter, combined with the significant influence that even small deviations in pH and temperature have on the ORP, will always dominate the ORP measurement. Therefore, solely from a theoretical perspective, without knowing and adjusting for the actual pH and temperature, it is impossible to use the magnitude of a negative ORP reading to determine how much H2 there is or to accurately compare hydrogen waters to each other. However, a high-quality ORP instrument and ORP-based H2 meter may still provide useful information when pH, temperature, and non-H2/H+ redox couples are carefully controlled and considered. Moreover, experimental analysis of real-world scenarios is highly warranted to bridge the gap from theory to practice and confirm, refute, or adjust our understanding of the usability, validity, and reliability of ORP-type meters. Finally, to accurately measure the concentration of molecular hydrogen in aqueous solutions, it is recommended to use a method that specifically measures the H2 gas itself, rather than one that relies on the solution’s redox potential, due to its inherent dependence on pH and temperature.
Data availability statement
The raw data supporting the conclusion of this article will be made available by the authors, without undue reservation.
Author contributions
TL and RS equally contributed to the manuscript, calculations, interpretations, and final manuscript writing.
Conflict of interest
RS is President/CEO of H2 Sciences Inc., the manufacturer & distributor of H2Blue®, a redox titration reagent used to determine the concentration of dissolved H2. He is also Director of Testing for H2 Analytics, a company involved with testing dissolved hydrogen using gas chromatography.
The remaining authors declare that the research was conducted in the absence of any commercial or financial relationships that could be construed as a potential conflict of interest.
Publisher’s note
All claims expressed in this article are solely those of the authors and do not necessarily represent those of their affiliated organizations, or those of the publisher, the editors and the reviewers. Any product that may be evaluated in this article, or claim that may be made by its manufacturer, is not guaranteed or endorsed by the publisher.
References
Aider, M., Gnatko, E., Benali, M., Plutakhin, G., and Kastyuchik, A. (2012). Electro-activated aqueous solutions: Theory and application in the food industry and biotechnology. Innovative Food Sci. Emerg. Technol. 15, 38–49. doi:10.1016/j.ifset.2012.02.002
Alemanno, F. (2020). “Enzymes and coenzymes (A brief, boring but necessary preamble),” in Biochemistry for anesthesiologists and intensivists (New York, NY: Springer), 1
Alwazeer, D., Liu, F. F., Wu, X. Y., and LeBaron, T. W. (2021). Combating oxidative stress and inflammation in COVID-19 by molecular hydrogen therapy: Mechanisms and perspectives. Oxid. Med. Cell. Longev. 2021, 5513868. doi:10.1155/2021/5513868
Angelé-Martínez, C., Goncalves, L. C. P., Premi, S., Augusto, F. A., Palmatier, M. A., Amar, S. K., et al. (2022). Triplet-energy quenching functions of antioxidant molecules. Antioxidants 11 (2), 357. doi:10.3390/antiox11020357
Ari, C., and Darren, A. L. (2014). Measuring the oxidation–reduction potential of important oxidants in drinking water. J. Am. Water Works Assoc. 106 (1), E10–E20. doi:10.5942/jawwa.2014.106.0002
Awulachew, M. T. (2021). Food Product Shelf stability overview of sourdough-risen flatbread. J. Food Tech. Nutri. Sci. 123 (3), 1–5. doi:10.47363/jftns/2021(3)123
Bhunia, K., Ovissipour, M., Rasco, B., Tang, J., and Sablani, S. S. (2017). Oxidation–reduction potential and lipid oxidation in ready‐to‐eat blue mussels in red sauce: Criteria for package design. J. Sci. Food Agric. 97 (1), 324–332. doi:10.1002/jsfa.7738
Boshagh, F., and Rostami, K. (2020). A review of measurement methods of biological hydrogen. Int. J. Hydrogen Energy 45 (46), 24424–24452. doi:10.1016/j.ijhydene.2020.06.079
Chen, B.-K., and Wang, C.-K. (2022). Electrolyzed water and its pharmacological activities: A mini-review. Molecules 27 (4), 1222. doi:10.3390/molecules27041222
Clark, W. M., and Gibbs, H. (1925). Studies on oxidation-reduction: VIII. Methylene blue. Public Health Rep. 40 (23), 1131. doi:10.2307/4577559
Cropper, W. B. (1987). Walther Nernst and the last law. J. Chem. Educ. 64 (1), 3. doi:10.1021/ed064p3
Fujita, K., Seike, T., Yutsudo, N., Ohno, M., Yamada, H., Yamaguchi, H., et al. (2009). Hydrogen in drinking water reduces dopaminergic neuronal loss in the 1-methyl-4-phenyl-1, 2, 3, 6-tetrahydropyridine mouse model of Parkinson's disease. PLoS One 4 (9), e7247. doi:10.1371/journal.pone.0007247
Garban, Z. (2008). The fundamental problems regarding the relative hydrogen (rH) score in biochemistry Note I. Theoretical bases of rH determination. J. Agroalimentary Process. Technol. 14, 50.
Henry, M., and Chambron, J. (2013). Physico-chemical, biological and therapeutic characteristics of electrolyzed reduced alkaline water (ERAW). Water 5 (4), 2094–2115. doi:10.3390/w5042094
Hofbauer, F., and Frank, I. (2012). Electrolysis of water in the diffusion layer: First‐principles molecular dynamics simulation. Chemistry 18 (1), 277–282. doi:10.1002/chem.201002094
Jackson, K., Dressler, N., Ben-Shushan, R. S., Meerson, A., LeBaron, T. W., and Tamir, S. (2018). Effects of alkaline-electrolyzed and hydrogen-rich water, in a high-fat-diet nonalcoholic fatty liver disease mouse model. World J. Gastroenterol. 24 (45), 5095–5108. doi:10.3748/wjg.v24.i45.5095
James, C. N., Copeland, R. C., and Lytle, D. (2004). Relationships between oxidation-reduction potential, oxidant, and pH in drinking water. San Antonio, Texas: AWWA WQTC.Proc. 2004.
Kim, C., Hung, Y.-C., and Brackett, R. E. (2000). Roles of oxidation–reduction potential in electrolyzed oxidizing and chemically modified water for the inactivation of food-related pathogens. J. Food Prot. 63 (1), 19–24. doi:10.4315/0362-028x-63.1.19
Kondjoyan, A., Sicard, J., Cucci, P., Audonnet, F., Elhayel, H., Lebert, A., et al. (2022). Predicting the oxidative degradation of raw beef meat during cold storage using numerical simulations and sensors—prospects for meat and fish foods. Foods 11, 1139. doi:10.3390/foods11081139
Korchef, A. (2022). Understanding general chemistry. Boca Raton, FL: CRC Press, Taylor & Francis Group.
Korovljev, D., Stajer, V., Ostojic, J., LeBaron, T. W., and Ostojic, S. M. (2019). Hydrogen-rich water reduces liver fat accumulation and improves liver enzyme profiles in patients with non-alcoholic fatty liver disease: A randomized controlled pilot trial. Clin. Res. Hepatol. Gastroenterol. 43 (6), 688–693. doi:10.1016/j.clinre.2019.03.008
LeBaron, T. W., Kura, B., Kalocayova, B., Tribulova, N., and Slezak, J. (2019a). A new approach for the prevention and treatment of cardiovascular disorders. molecular hydrogen significantly reduces the effects of oxidative stress. Molecules 24 (11), E2076. doi:10.3390/molecules24112076
LeBaron, T. W., Larson, A. J., Ohta, S., Mikami, T., Barlow, J., Bulloch, J., et al. (2019b). Acute supplementation with molecular hydrogen benefits submaximal exercise indices. Randomized, double-blinded, placebo-controlled crossover pilot study. J. Lifestyle Med. 9 (1), 36–43. doi:10.15280/jlm.2019.9.1.36
LeBaron, T. W., Singh, R. B., Fatima, G., Kartikey, K., Sharma, J. P., Ostojic, S. M., et al. (2020). The effects of 24-week, high-concentration hydrogen-rich water on body composition, blood lipid profiles and inflammation biomarkers in men and women with metabolic syndrome: A randomized controlled trial. Diabetes Metab. Syndr. Obes. 13, 889–896. doi:10.2147/DMSO.S240122
Lee, M., Fadriquela, A., Antonio, J. M., Kim, C.-S., Cho, I.-Y., Kim, K.-E., et al. (2022). Effects of alkaline-reduced water on exercise-induced oxidative stress and fatigue in young male healthy adults. Processes 10 (8), 1543. doi:10.3390/pr10081543
Li, F., Hu, Y., Shan, Y., Liu, J., Ding, X., Duan, X., et al. (2022). Hydrogen-rich water maintains the color quality of fresh-cut Chinese water chestnut. Postharvest Biol. Technol. 183, 111743. doi:10.1016/j.postharvbio.2021.111743
Nelson, D., Albert, L., and Cox, M. (2008). Lehinger principles of biochemistry. New York, NY: Macmillan.
Ohsawa, I., Ishikawa, M., Takahashi, K., Watanabe, M., Nishimaki, K., Yamagata, K., et al. (2007). Hydrogen acts as a therapeutic antioxidant by selectively reducing cytotoxic oxygen radicals. Nat. Med. 13 (6), 688–694. doi:10.1038/nm1577
Ohta, S. (2015). Molecular hydrogen as a novel antioxidant: Overview of the advantages of hydrogen for medical applications. Methods Enzymol. 555, 289–317. doi:10.1016/bs.mie.2014.11.038
Okajima, M., Okajima, Y., Wada, Y., Shimokawa, K.-i., and Ishii, F. (2022). Physicochemical properties and detergency of special electrolytic-reduction ion water. Drug Discoveries & Therapeutics. Available at: https://doi.org/10.5582/ddt.2022.01027
Okouchi, S., Suzuki, M., Sugano, K., Kagamimori, S., and Ikeda, S. (2002). Water desirable for the human body in terms of oxidation-reduction potential (ORP) to pH relationship. J. Food Sci. 67(5), 1594. doi:10.1111/J.1365-2621.2002.Tb08689.X
Piskarev, I. M., Ushkanov, V. A., Aristova, N. A., Likhachev, P. P., and Myslivets, T. C. (2010).Determination of the redox potential of water saturated with hydrogen]. Biofizika 55 (1), 19
Roussel, C., Ebel, B., Munier, E., Michelon, D., Martin-Dejardin, F., Beuvier, E., et al. (2022). Green strategies to control redox potential in the fermented food industry. Food Res. Int. 156, 111154. doi:10.1016/j.foodres.2022.111154
Seo, T., Kurokawa, R., and Sato, B. (2012). A convenient method for determining the concentration of hydrogen in water: Use of methylene blue with colloidal platinum. Med. Gas. Res. 2, 1. doi:10.1186/2045-9912-2-1
Shirahata, S., Hamasaki, T., and Teruya, K. (2012). Advanced research on the health benefit of reduced water. Trends Food Sci. Technol. 23(2), 124. doi:10.1016/J.Tifs.2011.10.009
Slezak, J., Kura, B., LeBaron, T. W., Singal, P. K., Buday, J., and Barancik, M. (2021). Oxidative stress and pathways of molecular hydrogen effects in medicine. Curr. Pharm. Des. 27 (5), 610–625. doi:10.2174/1381612826666200821114016
Tanaka, Y., Teraoka, F., Nakagawa, M., and Miwa, N. (2020). Dependencies of hydrogen-water on mineral-based hardness, temperatures and the container materials, and effects of the oral washing and drinking. Med. Gas. Res. 10 (2), 67–74. doi:10.4103/2045-9912.285559
Vujević, S., Modrić, T., and Lovrić, D. (2011). The difference between voltage and potential difference.” in Proceedings of the joint INDS'11 & ISTET, 11. IEEE, 1. Available at: https://ieeexplore.ieee.org/document/6024799/citations?tabFilter=papers#citations
Wu, T., Sakamoto, M., Inoue, N., Imahigashi, K., and Kamitani, Y. (2022). Effect of functional water on the antioxidant property of concentrated reconstituted juice. Foods 11 (16), 2531. doi:10.3390/foods11162531
Keywords: oxidation-reduction potential, molecular hydrogen, hydrogen-rich water, nernst equation, redox potential, antioxidant
Citation: LeBaron TW and Sharpe R (2022) ORP should not be used to estimate or compare concentrations of aqueous H2: An in silico analysis and narrative synopsis. Front. Food. Sci. Technol. 2:1007001. doi: 10.3389/frfst.2022.1007001
Received: 29 July 2022; Accepted: 13 September 2022;
Published: 07 October 2022.
Edited by:
Filiz Icier, Ege University, Izmir, TurkeyReviewed by:
Patricio Orellana-Palma, Universidad de La Serena, ChileMustafa Çam, Erciyes University, Turkey
Copyright © 2022 LeBaron and Sharpe. This is an open-access article distributed under the terms of the Creative Commons Attribution License (CC BY). The use, distribution or reproduction in other forums is permitted, provided the original author(s) and the copyright owner(s) are credited and that the original publication in this journal is cited, in accordance with accepted academic practice. No use, distribution or reproduction is permitted which does not comply with these terms.
*Correspondence: Tyler W. LeBaron, tylerlebaron@suu.edu