Determination of dielectric properties and predictive modeling for designing radio-frequency heating of ground beef
 Anuj Purohit1
  Anand Mohan
- 1Department of Food Science and Technology, University of Georgia, Athens, Georgia
- 2Laboratory of Applied Food Chemistry, Microbiology and Process Engineering, Department of Chemical Engineering, Birla Institute of Technology, Ranchi, India
Dielectric properties of ground beef as affected by the variation of fat content (73/27, 80/20, and 85/15 lean/fat) and temperature (0–90 °C) were determined using a parallel plate LCR meter and liquid test fixture at the radiofrequency (RF) of 27.12 MHz. The values of dielectric constant (ε′) and dielectric loss factor (ε'') of ground beef significantly increased with temperature (p < 0.05) whereas the values of penetration depth (dp) decreased with temperature (p < 0.05) up to the respective points of local extrema. Values of both ε′ and ε'' were significantly lower (p < 0.05) for the leaner blend 85/15 and conversely, penetration depth was significantly higher (p < 0.05) for the leaner blend. As temperature increased beyond the point of maximum for ε′ and ε'' and point of minimum for dp, there was no significant difference in the dielectric properties between the different lean/fat blends. Predictive equations of second order in temperature and fat content were developed for the dielectric properties which explained 74, 93, and 98% variation in ε′, ε'', and for dp respectively, based on R2 values. The dielectric properties and their fitted models can be utilized for designing pilot and mass scale RF processes for heating ground beef.
Introduction
Radiofrequency (RF) has gained importance in the recent decade as an effective meat processing technology (Zhou & Wang, 2018). It has been utilized in various heating applications for thawing, pasteurizing, and cooking meat products (Guo et al., 2019). RF thawing of different lean: fat beef blends were shown to have an 85 fold reduction in process time compared to conventional air thawing (Farag et al., 2011; Dag et al., 2020) and RF defrosting resulted in significantly lesser drip loss (Farag et al., 2009). RF tempering of beef of different lean/fat compositions had greater endpoint temperature uniformity and a 30-fold reduction in time compared to conventional tempering (Farag K. et al., 2008). RF has been demonstrated to reduce pathogenic microorganisms in ground beef similar to conventional heating but with much shorter cooking times (Guo et al., 2006). More recently, a pilot-scale RF (6 kW) equipment was demonstrated to effectively reduce pathogenic loads in ground beef (Nagaraj et al., 2016) and in non-intact beef steaks (Rincon and Singh, 2016). Thus, RF is a promising technology for meat processing that warrants further exploring of process design, material properties, and effects on physical and chemical qualities of RF-treated meat products (Zhang et al., 2022).The RF heating has been shown to be much more rapid than conventional heating (Traffano-Schiffo et al., 2021). The RF processing has a great potential for commercialization for mass-scale meat processing. A proper understanding of food properties is necessary in order to install, design, and operate continuous processes employing RF. The RF is non-ionizing electromagnetic radiation that produces capacitative or dielectric heating in materials (Ma et al., 2021). Dielectric properties are important in determining how the food molecules couple with the external electromagnetic field, re-align, and generate heat (Llave & Erdogdu, 2020). Muscle foods behave as “lossy” dielectrics or insulating capacitors, i.e., they dissipate the electrical energy from an externally applied electromagnetic field into heat (Gambuteanu & Alexe, 2013). This results from successive charging and discharging of the dielectric material. Two important fundamental properties are used to describe this coupling with the electromagnetic field.
Materials and methods
Sample preparation
Packaged fresh ground beef of different lean/fat blends (73/27, 80/20, and 85/15) was obtained from a local beef purveyor. The packaged beef was transported on ice to the University of Georgia Food Science Building in Athens, GA. The fresh ground beef was refrigerated at 2 ± 1°C and stored in dark prior to experiments and used within 4 days. The ground beef was thoroughly mixed (homogenized) prior to use to minimize localized fat pockets.
Moisture and ash content determination
The ground beef was homogenized and analyzed separately in triplicate for moisture, protein, fat, and ash contents. The moisture content of the ground beef blends (lean/fat blends: 73/27, 80/20, and 85/15) was determined using AOAC Method (AOAC 934.06) in a vacuum drying oven (National Appliance Co., Skokie, Ill. United States). The ground beef samples of 5 g were evenly spread over bottom of metal dish and tightly covered. The samples were dried at 75°C and 65 mmHg for 6 h. Dish was cooled to room temperature (23±5 °C) in desiccator and final weight was recorded for calculating the moisture content. For the determination of ash content, 2 g of ground beef samples were weighed in crucible and placed in temperature-controlled furnace, heated to 600°C. The temperature was hold at 600°C for 2 h. The crucible was transferred to desiccator to cool and immediately weigh to get ash content (AOAC Method 942.05). All experiments were replicated a minimum of three times on different occasions and data was averaged for statistical analysis.
Dielectric properties measurement
The dielectric properties of ground beef were analyzed using a custom-built fixture (#4285A; Agilent Technologies, Palo Alto, CA, United States) according to the methods described by (Shrestha and Baik, 2015; Zhang et al., 2004). A custom-built temperature cell connected to an oil bath was used for controlling the ground beef temperature during dielectric property measurement. Prior to experiments, the liquid test cell was cleaned with warm water and a soft detergent, rinsed with double-distilled deionized water, air dried, and standardized using the manufacturer’s instructions. A fiber optic temperature probe (Fiso Tech. Inc. Quebec, Canada) was inserted to touch the periphery of the ground beef bed within the test cell as shown in Figure 1A. This probe was connected to a Universal Multichannel Instrument (Fiso Tech. Inc. Quebec, Canada) used to record the temperature. To avoid variations, the system was calibrated before each measurement.
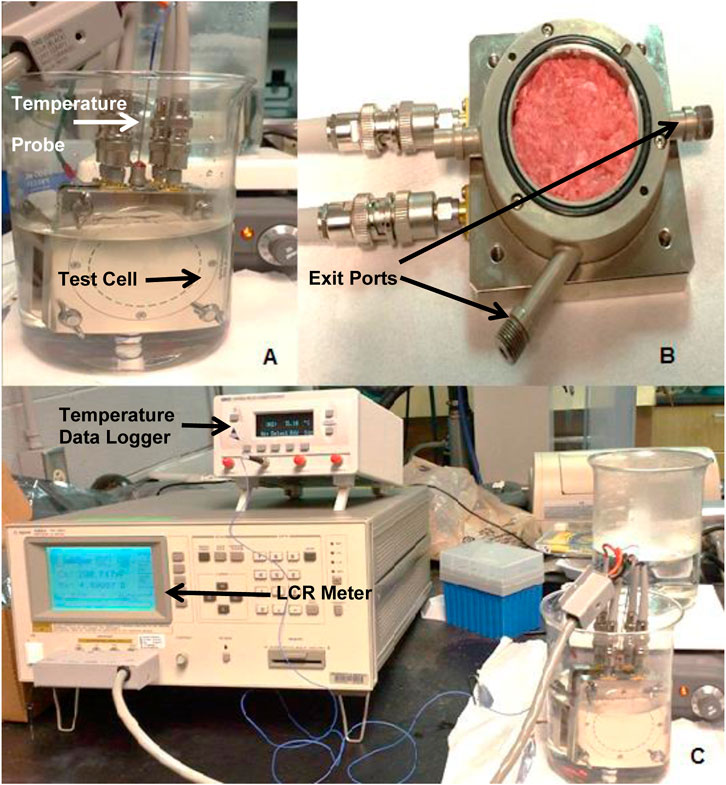
FIGURE 1. (1A): Liquid test cell submerged in a water bath; (1B): Inside of the test cell with the ground beef sample, exit ports sealed with water proof tape; (1C): Instrumentation set up for the experiment.
A thin layer of ground beef was spread onto the liquid test cell as shown in Figure 1B. The thickness was adjusted to 1.3 mm using the spacer disk provided by the manufacturer. The ground beef being analyzed served as a dielectric spaced between the parallel plates of the test cell. Two of the three exit ports were sealed with waterproof tape to prevent the beef from escaping the parallel plate assembly. All dielectric measurements were made in a temperature-controlled environment. The dielectric constant (
The instrumentation is shown in Figure 1C. The parallel plate capacitance
Where D is the gap between the electrodes (1.3 × 10⁻³ m),
Statistical analysis
The experiment was replicated three times (n=3) and the calculated values were averaged for statistical analysis. The least-square method was employed for multiple regression of response variables, with fat (F) and temperature (T) being the factors. All the predictor coefficients had a significance of <0.05. Model fitting was carried out using R (R Core Team, 2013). The dielectric properties were plotted using MS Excel 2010. Regression coefficients, goodness of fit (R2), and root mean square of error are reported in Table 2. The three response variables were regressed on F and T in the following form: a + bT + cT2 + dF + eF2 + f (T× F). Regression coefficients that were not significant were eliminated when p > 0.05.
Results and discussion
Proximate composition analysis of the ground beef revealed that ground beef of different blends varied (p < 0.05) with variation in total moisture content (Table 1). More specifically, ground beef blend with higher fat content contained higher moisture level. A similar trend was observed for the total fat content across three ground beef blends. Total ash content was did not differ (p < 0.05) among three ground beef blends.
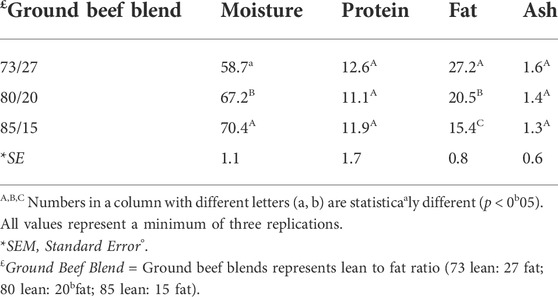
TABLE 1. Proximate composition of ground beef of different lean and fat blends.
The variation of the dielectric constant with temperature and fat content is shown in Figure 2. For all the three blends, the value of the dielectric constant increased with temperature (p < 0.05) as the ground beef was heated above 0°C. The values reached maxima at 65°C for 73/27 and 80/20 ground beef following which they significantly reduced (p < 0.05). The maximum was observed at 70°C for the leaner blend 85/15. The numerical value of the dielectric constant was lowest at 90°C for all three blends. Amongst the three blends employed, the values of dielectric constant were significantly lower (p < 0.05) for 85/15 ground beef till 80°C. There was no statistical difference between the values obtained for the 73/27 and 80/20 blends in the entire temperature range scanned.
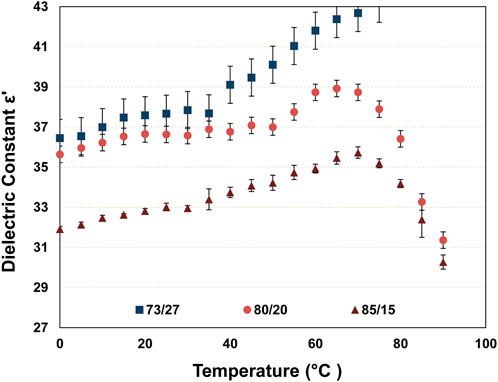
FIGURE 2. Variation of dielectric constant with temperature and lean/fat blends-values represent mean of three replicates with standard deviation.
The variation in dielectric constant observed is similar to that reported previously in literature at 27.12 MHz for beef Biceps femoris muscle (Brunton et al., 2006) and at microwave frequencies of 915 and 2540 MHz for beef meat (Bircan and Barringer, 2002). However, the maximum in the dielectric constant value was observed at a lower temperature in the present work compared to the cited studies. This trend is similar to the trends observed for dielectric constant values measured at microwave frequencies of 300, 915 and 2540 MHz (Brunton et al., 2006). Current study uses commercial RF frequency of 27.12 MHz that has greater potential of heat generation. It can be assumed that due to higher doses of RF frequency, there would be generation of localized heat that may promote the denaturation of myosin collagen and actin that cumulatively exhibits such increase. Also, in this case, the tendency of denaturation was higher as we have used ground beef having disrupted myofibrillar and connective tissue network that leads to loss of moisture, salts, and water soluble proteins. It also can be pointed out that, the minced beef with different lean/fat blends is prepared by mixing separated lean and fat portion. The fat portion didn’t contain the salt part, and minced beef with higher moisture content bears higher leached salt content. This leached salt has a significant negative effect in the dielectric constant. Thus, in minced beef offered a increasing value for dielectric constant with increase in fat content following opposite trend to the reported literature (Lyng et al., 2002), (Lyng et al., 2005). Another interesting observation with respect to fat% and temperature is observed in the current study where after 40°C, the values of dielectric constant increased for all the cases showing maximum for 80/20. With increasing temperature, the disrupted myofibrillar and connective tissue network leads to rapid loss of moisture, salts, and water soluble proteins. As a cumulative effect of leaching of salt, moisture loss and ever evaporation, and denaturation of water soluble proteins exhibited increase in the values of dielectric constant after 40 °C. In ground beef the myofibrillar and connective tissue network is disrupted which results in greater moisture, salts, and water soluble proteins being released.
The values of dielectric loss factor significantly increased with temperature (p < 0.05) for all the three blends with a maximum appearing at 75°C as seen in Figure 3. A similar trend was previously reported in dielectric loss factor for solid pieces of Biceps femoris (Brunton et al., 2006). The dielectric loss factor values observed for the 85/15 blend were significantly lower (p < 0.05) than the other two blends up to the point of maxima. There was no statistical difference between the dielectric loss factor values obtained for the 73/27 and 80/20 blends. The values of dielectric constant and loss factor reduced with increasing fat content (p < 0.05) and increased with temperature above 0°C (p < 0.05).
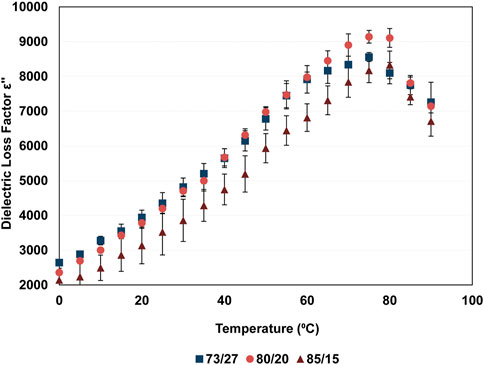
FIGURE 3. Variation of dielectric loss factor with temperature and lean/fat blends-values represent mean of three replicates with standard deviation.
A similar trend in variation of dielectric loss factor has been previously reported in literature for beef Biceps femoris at 27.12 MHz radiofrequency (Brunton et al., 2006) and for ground beef at microwave frequencies (Gunasekaran et al., 2005) although the values were measured only up to 70°C in the latter study. However, the value of dielectric loss factor was lower for high fat percentage in the same study. The difference in this trend is possibly explained by the microwave frequency employed in the cited study on ground beef. Above 50°C myosin denaturation is initiated, and this leads to release of calcium and magnesium ions (Hamm, 1966). At approximately 62°C, collagen denaturation occurs which is accompanied by release of moisture and water-soluble salts. Both mechanisms result in higher ionic mobility by release of fluids and ions (Brunton et al., 2006). Both the increasing temperature and heat induced increase in ionic mobility explain the increase in dielectric loss factor.
The variation in penetration depth with temperature and fat content is shown in Figure 4. The penetration depth significantly decreased (p < 0.05) as the temperature increased above 0°C with a minimum appearing for all three blends at 75°C. The penetration depth was significantly higher (p < 0.05) for the leaner blend (85/15) compared to the other two blends up to the point of minimum observed for all three blends. Beyond this temperature, there was no significant difference in the dp values for the three blends. Thus, interaction of temperature and fat content was observed. This trend closely resembles the variation in penetration depth reported for Semitendinosus muscle at RF and microwave frequencies (Basaran-Akgul et al., 2008). Similar values for penetration depth have been reported for ground beef at microwave frequencies up to 75°C (Gunasekaran et al., 2005). However, penetration depth was shown be higher for higher fat content in the cited study. The difference in
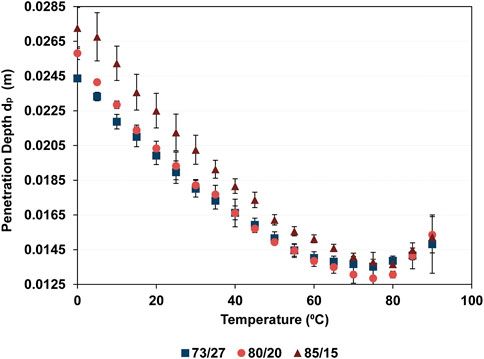
FIGURE 4. Variation of power penetration depth with temperature and lean/fat blends-values represent mean of three replicates with standard deviation.
United States Department of Agriculture–Food Safety and Inspection Services (USDA-FSIS) recommends that research studies using cooking of ground beef products should show that a consistent temperature distributed across the ground beef products that are either partially cooked or cooked from the thawed rather than the frozen state (Berry, 2000). Ground beef products cooked from the frozen state will take longer time and higher temperature to achieve the target endpoint temperature than those that have been thawed (Luchansky et al., 2013). In any case, this research study recommends that in commercial settings, a detailed RF cooking instruction must be provided on the label and commercial establishments should consider conducting additional tests to assess the impact on cooking adequacy. Commercial establishments must consider that consumers generally tend not to fully thaw the frozen product prior to cooking. Alternatively, commercial establish must consider providing two different sets of RF cooking instructions: one for RF heating of thawed ground beef products and additional instruction for RF heating or cooking of frozen raw ground beef products.
As the temperature increased beyond the respective maxima for
Second order regression models were fitted for the dielectric constant, dielectric loss factor, and the power penetration depth in Table 2. The goodness of fit (R2) for
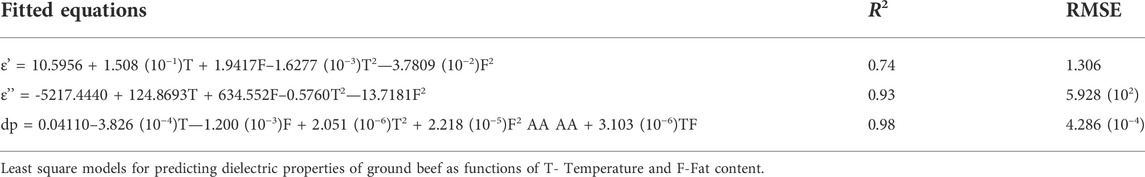
TABLE 2. Fitter equations representing andepsi;’, ε'', and dp including R2 and root mean square.
Conclusion
Values of all the dielectric properties
Data availability statement
The datasets presented in this article are not readily available because No data sets were generated for this research. Requests to access the datasets should be directed to AM, anandmohan@uga.edu.
Author contributions
AP: Conceptualization, Methodology, Investigation, Writing—Original draft. AM: Conceptualization, Methodology, Validation, Writing—Original draft, review and editing, Visualization, Project supervision and administration, and Funding acquisition.
Conflict of interest
The authors declare that the research was conducted in the absence of any commercial or financial relationships that could be construed as a potential conflict of interest.
Publisher’s note
All claims expressed in this article are solely those of the authors and do not necessarily represent those of their affiliated organizations, or those of the publisher, the editors and the reviewers. Any product that may be evaluated in this article, or claim that may be made by its manufacturer, is not guaranteed or endorsed by the publisher.
References
Agilent Technologies (2000). Agilent 16452 liquid test fixture operation manual. 3rd Edition. Japan: Operating and Service Manual.
Basaran‐Akgul, N., Basaran, P., and Rasco, B. (2008). Effect of temperature (-5 to 130 degrees C) and fiber direction on the dielectric properties of beef Semitendinosus at radio frequency and microwave frequencies. J. Food Sci. 73 (6), E243–E249. doi:10.1111/j.1750-3841.2008.00835.x
Berry, B. W. (2000). Use of infrared thermography to assess temperature variability in beef patties cooked from the frozen and thawed states. Foodserv. Res. Int. 12 (4), 255–262.
Bircan, C., and Barringer, S. A. (2002). Determination of protein denaturation of muscle foods using the dielectric properties. J. Food Sci. 67 (1), 202–205. doi:10.1111/j.1365-2621.2002.tb11384.x
Brunton, N. P., Lyng, J. G., Zhang, L., and Jacquier, J. C. (2006). The use of dielectric properties and other physical analyses for assessing protein denaturation in beef biceps femoris muscle during cooking from 5 to 85 °C. Meat Sci. 72 (2), 236–244. doi:10.1016/j.meatsci.2005.07.007
Calay, R. K., Newborough, M., Probert, D., and Calay, P. S. (1994). Predictive equations for the dielectric properties of foods. Int. J. Food Sci. Technol. 29 (6), 699–713. doi:10.1111/j.1365-2621.1994.tb02111.x
Dag, D., Singh, R. K., and Kong, F. (2020). Developments in radio frequency pasteurization of food powders. Food Rev. Int. 38 (6), 1197–1214. doi:10.1080/87559129.2020.177564110.1080/87559129.2020.1775641
Farag, K., Lyng, J., Morgan, D., and Cronin, D. (2008a). A comparison of conventional and radio frequency tempering of beef meats: Effects on product temperature distribution. Meat Sci. 80 (2), 488–495. doi:10.1016/j.meatsci.2008.01.015
Farag, K., Lyng, J., Morgan, D., and Cronin, D. (2011). A comparison of conventional and radio frequency thawing of beef meats: Effects on product temperature distribution. Food bioproc. Tech. 4 (7), 1128–1136. doi:10.1007/s11947-009-0205-z
Farag, K. W., Duggan, E., Morgan, D. J., Cronin, D. A., and Lyng, J. G. (2009). A comparison of conventional and radio frequency defrosting of lean beef meats: Effects on water binding characteristics. Meat Sci. 83 (2), 278–284. doi:10.1016/j.meatsci.2009.05.010
Farag, K. W., Lyng, J. G., Morgan, D. J., and Cronin, D. A. (2008b). Dielectric and thermophysical properties of different beef meat blends over a temperature range of −18 to +10 °C. Meat Sci. 79 (4), 740–747. doi:10.1016/j.meatsci.2007.11.005
Gambuteanu, C., and Alexe, P. (2013). Comparison of thawing assisted by low-intensity ultrasound on technological properties of pork Longissimus dorsi muscle. J. Food Sci. Technol. 52 (4), 2130–2138. doi:10.1007/S13197-013-1204-7
Gunasekaran, N., Mallikarjunan, P., Eifert, J., and Sumner, S. (2005). Effect of fat content and temperature on dielectric properties of ground beef. Trans. ASAE 48 (2), 673–680. doi:10.13031/2013.18297
Guo, C., Mujumdar, A. S., and Zhang, M. (2019). New development in radio frequency heating for fresh food processing: A review. Food Eng. Rev. 11 (1), 29–43. doi:10.1007/s12393-018-9184-z
Guo, Q., Piyasena, P., Mittal, G., Si, W., and Gong, J. (2006). Efficacy of radio frequency cooking in the reduction of Escherichia coli and shelf stability of ground beef. Food Microbiol. 23 (2), 112–118. doi:10.1016/j.fm.2005.02.004
Hamm, R. (1966). "Heating of muscle systems," in The physiology and biochemistry of muscle as a food. Editors E. J. Briskey, R. G. Cassens, and J. C. Trautman 363. Madison, Wisconsin: The University of Wisconsin Press.
Llave, Y., and Erdogdu, F. (2020). Radio frequency processing and recent advances on thawing and tempering of frozen food products. Crit. Rev. Food Sci. Nutr. 62 (3), 598–618. doi:10.1080/10408398.2020.1823815
Luchansky, J. B., Porto-Fett, A. C. S., Shoyer, B. A., Phillips, J., Chen, V., Eblen, D. R., et al. (2013). Fate of shiga toxin-producing O157:H7 and non-O157:H7 Escherichia coli cells within refrigerated, frozen, or frozen then thawed ground beef patties cooked on a commercial open-flame gas or a clamshell electric grill. J. Food Protect. 76 (9), 1500–1512.
Lyng, J. G., Scully, M., McKenna, B. M., Hunter, A., and Molloy, G. (2002). The influence of compositional changes in beefburgers on their temperatures and their thermal and dielectric properties during microwave heating. J. Muscle Foods 13 (2), 123–142. doi:10.1111/J.1745-4573.2002.TB00325.X
Lyng, J. G., Zhang, L., and Brunton, N. P. (2005). A survey of the dielectric properties of meats and ingredients used in meat product manufacture. Meat Sci. 69 (4), 589–602. doi:10.1016/J.MEATSCI.2004.09.011
Ma, L., Zhang, M., Xu, J., and Bai, B. (2021). Quality evaluation of Kungpao Chicken as affected by radio frequency combined with ZnO nanoparticles. LWT 135, 110203. doi:10.1016/J.LWT.2020.110203
Nagaraj, G., Purohit, A., Harrison, M., Singh, R., Hung, Y., and Mohan, A. (2016). Radiofrequency pasteurization of inoculated ground beef homogenate. Food control. 59, 59–67. doi:10.1016/j.foodcont.2015.04.020
Piyasena, P., Dussault, C., Koutchma, T., Ramaswamy, H., and Awuah, G. (2003). Radio frequency heating of foods: Principles, applications and related properties—a review. Crit. Rev. Food Sci. Nutr. 43 (6), 587–606. doi:10.1080/10408690390251129
Rincon, A. M., and Singh, R. K. (2016). Inactivation of Shiga toxin-producing and nonpathogenic Escherichia coli in non-intact steaks cooked in a radio frequency oven. Food control. 62, 390–396. doi:10.1016/j.foodcont.2015.11.021
R Core Team (2013). R: A language and environment for statistical computing. Vienna. http://www.R-project.org/.
Shrestha, B., and Baik, O. (2015). Dielectric behaviour of whole-grain wheat with temperature at 27.12 mhz: A novel use of a liquid dielectric test fixture for grains. Int. J. Food Prop. 18 (1), 100–112. doi:10.1080/10942912.2013.793198
Tomas-Egea, J. A., Castro-Giraldez, M., Colom, R. J., and Fito, P. J. (2022). New technique for determining the critical freezing temperatures of chicken breast based on radiofrequency photospectrometry. J. Food Eng. 333, 111155. doi:10.1016/J.JFOODENG.2022.111155
Traffano-Schiffo, M. V., Castro-Giraldez, M., Colom, R. J., Talens, P., and Fito, P. J. (2021). New methodology to analyze the dielectric properties in radiofrequency and microwave ranges in chicken meat during postmortem time. J. Food Eng. 292, 110350. doi:10.1016/J.JFOODENG.2020.110350
Tran, V., and Stuchly, S. (1987). Dielectric properties of beef, beef liver, chicken and salmon at frequencies from 100 to 2500 MHz. J. Microw. Power Electromagn. Energy 22 (1), 29–33. doi:10.1080/08327823.1987.11688003
Zhang, L., Lyng, J. G., and Brunton, N. P. (2004). Effect of radio frequency cooking on the texture, colour and sensory properties of a large diameter comminuted meat product Meat Sci. 68 (2), 257–268. doi:10.1016/j.meatsci.2004.03.011
Zhang, Y., Pandiselvam, R., Zhu, H., Su, D., Wang, H., Ai, Z., et al. (2022). Impact of radio frequency treatment on textural properties of food products: An updated review. Trends Food Sci. Technol. 124, 154–166. doi:10.1016/J.TIFS.2022.04.014
Keywords: radiofrecuency, ground beef, dielectric properties, dielectric loss, predictive modeling
Citation: Purohit A, Kumari A, Roy A and Mohan A (2022) Determination of dielectric properties and predictive modeling for designing radio-frequency heating of ground beef. Front. Food. Sci. Technol. 2:960471. doi: 10.3389/frfst.2022.960471
Received: 03 June 2022; Accepted: 25 July 2022;
Published: 31 August 2022.
Edited by:
Filiz Icier, Ege University, Izmir, TurkeyReviewed by:
Ravi Jadeja, Oklahoma State University, United StatesMohan Naik, Karunya Institute of Technology and Sciences, India
Copyright © 2022 Purohit, Kumari, Roy and Mohan. This is an open-access article distributed under the terms of the Creative Commons Attribution License (CC BY). The use, distribution or reproduction in other forums is permitted, provided the original author(s) and the copyright owner(s) are credited and that the original publication in this journal is cited, in accordance with accepted academic practice. No use, distribution or reproduction is permitted which does not comply with these terms.
*Correspondence: Anand Mohan, anandmohan@uga.edu