Label-free analysis of bacterial growth and lysis at the single-cell level using droplet microfluidics and object detection-oriented deep learning
 Anuj Tiwari
 Nela Nikolic
 Vasileios Anagnostidis
 Fabrice Gielen
- 1Living Systems Institute, Faculty of Health and Life Sciences, University of Exeter, Exeter, United Kingdom
- 2Translational Research Exchange @ Exeter, University of Exeter, Exeter, United Kingdom
- 3Department of Physics and Astronomy, Faculty of Environment, Science and Economy, University of Exeter, Exeter, United Kingdom
Bacteria identification and counting at the small population scale is important to many applications in the food safety industry, the diagnostics of infectious diseases and the study and discovery of novel antimicrobial compounds. There is still a lack of easy to implement, fast and accurate methods to count populations of motile cells at the single-cell level. Here, we report a label-free method to count and localize bacterial cells freely swimming in microfluidic anchored picolitre droplets. We used the object detection oriented YOLOv4 deep learning framework for cell detection from bright-field images obtained with an automated Z-stack setup. The neural network was trained to recognize Escherichia coli cell morphology with an average precision of approximately 84%. This allowed us to accurately identify individual cell division events, enabling the study of stochastic bacterial growth starting from initial populations as low as one cell. This work also demonstrates the ability to study single cell lysis in the presence of T7 lytic bacterial viruses (phages). The high precision in cell numbers facilitated the visualization of bacteria-phage interactions over timescale of hours, paving the way towards deciphering phage life cycles in confined environments.
1 Introduction
The early detection of bacterial presence is of primordial importance for human and animal welfare (Maurer et al., 2017; Wang et al., 2020). In particular, the presence of food microbial contaminants, or antimicrobial resistant strains in hospital settings constitutes a severe threat to human health with up to 15% of all hospitalized patients affected by healthcare-associated infections (Rudd et al., 2020; Tropea, 2022; Accolti et al., 2019). Rapid identification strategies and their translation into diagnostic devices hold the promise to improve prevention and alleviate healthcare burden (Pliakos et al., 2018). In addition, early elimination of pathogenic bacteria would reduce risks that they develop defence mechanisms under long-term selection pressure (e.g., from a specific food source, antibiotic regimen) (Oz et al., 2014; Lambert and Kussell, 2015).
With rising numbers of antimicrobial resistant strains, it is also important to rapidly identify and assess the efficacy of bacteriolytic agents without the need for long culturing times (which may not be feasible for non-culturable strains) (Balouiri et al., 2016; Qin et al., 2021).
Amongst alternatives to antibiotics to combat bacterial infections, bacterial viruses or phages lyze bacteria in a highly specific manner, preserving healthy microbiomes while making safe and effective patient-specific treatment a possibility (Koskella and Meaden, 2013; Ross et al., 2016). Compassionate use has already seen some significant success in treating recurrent infections (Dedrick et al., 2019; McCallin et al., 2019). However, current gold standard assays to quantify phage efficacy such as the plaque assay are slow and labour intensive (Acs et al., 2020). Methods that can rapidly assess the lytic potential of phages without requiring extensive bacterial culture are still needed. Likewise, platforms that inform on possible bacterial resistance to phages will play an important role to understand future clinical use for phage therapy (Ly-Chatain, 2014).
Testing antimicrobials on a small subset of cells would accelerate time to results which could shorten the time to deliver adequate treatment. Current methods to study bacterial populations down to the single-cell level focus on either growth of bacterial cells in 2D on the surface of agar plates, confined within microchannels or in small liquid cultures (Koutsoumanis and Lianou, 2013; Jin et al., 2018; Yang et al., 2018; Barizien et al., 2019; Taylor et al., 2022). 2D cultures produce cell monolayers in early growth stages which are highly suited for high-resolution imaging with the ability to track cell divisions and individual lineages for an in-depth understanding of growth kinetics. This has allowed the development of analytical models for predicting bacterial growth from a single or a few cells (Alonso et al., 2014; Garcia et al., 2017).
In their natural environment, bacteria may be found in water-filled microcavities or in condensation droplets in which they can proliferate without attachment to a solid substrate. For some strains, the ability to swim is an essential phenotypic trait which help them colonize new habitats or respond to physical or chemical cues (Ni et al., 2020). Understanding unconstrained bacterial growth in 3D is therefore desirable to quantify cell lifestyle which includes non-surface attached aggregates or biofilms (Cai, 2020). Growing cells within microfluidic or sessile droplets enable long-term visualization of a small group of cells confined within picolitre volumes (Jin et al., 2018). Many methods have been developed to ensure long-term, stable imaging, for example, by anchoring droplets in multilayer devices, or using geometrical traps (Schmitz et al., 2009; Abbyad et al., 2011; Knowles et al., 2011; Bentley et al., 2022a). In addition, numerous methods have been developed for counting cells using various imaging modalities in 2D formats (Ollion et al., 2019; Smith et al., 2019). In the context of 3D motion, there is an unavoidable trade-off between technical simplicity, counting accuracy and time-to-result (Jelli et al., 2023).
The use of fluorescence markers to count and track individual cells result in high sensitivity and signal-to-noise ratio, and has been historically successful for assessing bacterial population dynamics (Muthukrishnan et al., 2017; Nikolic et al., 2023). On the other hand, fluorescently labelling bacteria may interfere with the cell biology and would increase the number of steps of the overall sample preparation. For these reasons, it is desirable to use label-free imaging (e.g., transmitted light, phase contrast, dark field) on unaltered cell samples, simplifying overall procedures and making them generally more applicable. Various complex optical systems have been devised to perform 3D object tracking. Multifocal imaging can provide volumetric imaging data and be used in phase contrast or darkfield modes (Xiao et al., 2020; Amin et al., 2022). Digital holographic microscopy with multiple light sources has been used to track freely diffusing Escherichia coli bacteria (Saglimbeni et al., 2014). In phase contrast mode, diffraction patterns can be used to infer localization of bacterial cells (Taute et al., 2015). Dark-field imaging with an 87-channel multispectral system has been used to identify several bacterial species (Wilson and Vigil, 2013). Standard bright-field imaging has already shown potential for high-resolution imaging of bacterial cells (Sakuma et al., 2014; Li et al., 2022). Accurate counting of individual, unstained cells over time remains a significant challenge (Spahn et al., 2022). Even when using low height microchambers relative to cell size, cell identification is difficult as cells can move in and out from the focal plane and orient themselves randomly resulting in various appearances for the same cell. This explains why studies, even when using fluorescent strains, have focussed on obtaining estimates of absolute cell counts for large populations of up to ∼10,000 cells (Taylor et al., 2022; Barizien et al., 2019). Although such approaches provide information on large population growth kinetics, they are not so informative on early-stage population development. In particular, early cell division events may be missed even though they are crucial for informing on cell viability, capturability and adaptation phase.
Cell detection has recently benefited from significant advances made in deep learning algorithms, including from images obtained using bright-field microscopy. Deep learning algorithms such as two-stage (e.g., R-CNN, SPP-Net) and single-stage detectors (e.g., YOLO, SSD) have proven abilities to accurately identify, classify and locate objects in images using manually curated training datasets (Nitta et al., 2018; Anagnostidis et al., 2020; Howell et al., 2022). Efforts towards dissemination of such deep learning models (e.g., through open-access training datasets) have made these methods more widely accessible (Spahn et al., 2022).
In this paper, we demonstrate label-free, accurate counting of freely-swimming bacterial cell populations starting from as few as one cell. We combine standard bright-field imaging with a rapid and automated Z-scanning method which enables detection of 3D positions for cells growing in 8 μm tall, anchored droplets. We use the YOLOv4 object detector to count in-focus cells and obtain accurate cell numbers over time. Finally, we demonstrate the ability of the platform to detect single cell lysis events induced by lytic phages.
2 Methods
2.1 Bacterial strain and phage lysate preparation
Bacterial strain Escherichia coli BW25113 was used for all the experiments in this study. Streaks consisting of single colonies on Lysogeny Broth (LB) agar plates were obtained from a glycerol stock of the strain stored at −80°C. Individual colonies were picked for each experiment and added to a sterile culture tube containing 4 mL of LB media (10 g/L tryptone, 5 g/L yeast extract, 10 g/L NaCl) and incubated overnight at 37°C with shaking at 230 rpm. 40 μL of the overnight culture was added to 4 mL of fresh LB media and cultivated at 37°C and 230 rpm until it reached a desirable OD600 reading between 0.20 and 0.35 (optical density measured at 600 nm, serving as a proxy for bacterial population size). One culture was cultivated longer, until the late exponential phase with OD600 of 1. (optical density measured at 600 nm, serving as a proxy for bacterial population size). Standard colony forming unit (CFU) assays were also carried out for each experiment (Supplementary Section S2.1). Phage T7 lysates were preserved in SM buffer (0.1 M NaCl, 8 mM MgSO4·7H2O, 50 mM Tris-Cl pH 7.5, 0.01% gelatin) at 4°C, with phage titer of 109 PFU/mL (PFU, plaque-forming unit) (Supplementary Section S3.2 and Supplementary Figure S2). All experiments were performed at room temperature (measured to be around 25°C) and at 37°C with all equipment placed in a warm room respectively, as E. coli is capable of growing in a wide temperature range (8°C–48°C) (Madigan, 2017).
Our aim was to start each experiment in exponential phase of growth and encapsulate a small number of cells per droplet. Since the number of cells in each droplet follows a Poisson distribution, we could expect the average number of cells based on population data for different OD600 values. Our protocol included cultivation of precisely 2 h for each bacterial culture to reach exponential growth phase. This resulted in measured OD600 in the range of 0.2–0.35 after this cultivation period, due to well-known stochasticity in growth reported between independently cultivated cultures of the same bacterial species or genotype. Each experiment starts with an independently cultivated bacterial culture of the same bacterial genotype to capture a variety of phenotypic differences constantly encountered in any population.
For growth experiments, 1 mL aliquots of desired OD600 culture were directly utilized for experiments. For lysis experiments, aliquots of OD600 cultures were mixed with phage titers in different volumes to obtain a desired multiplicity of infection (MOI). MOI is the ratio between the number of phage particles and number of bacterial cells. The experimental conditions are listed in Tables 1, 2.
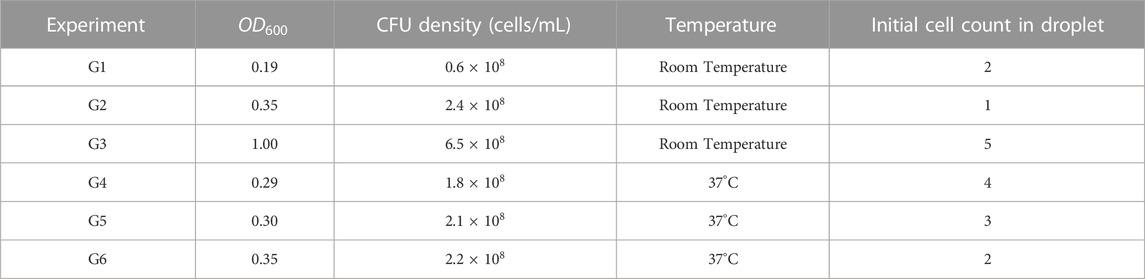
TABLE 1. Experimental conditions for growth experiments.
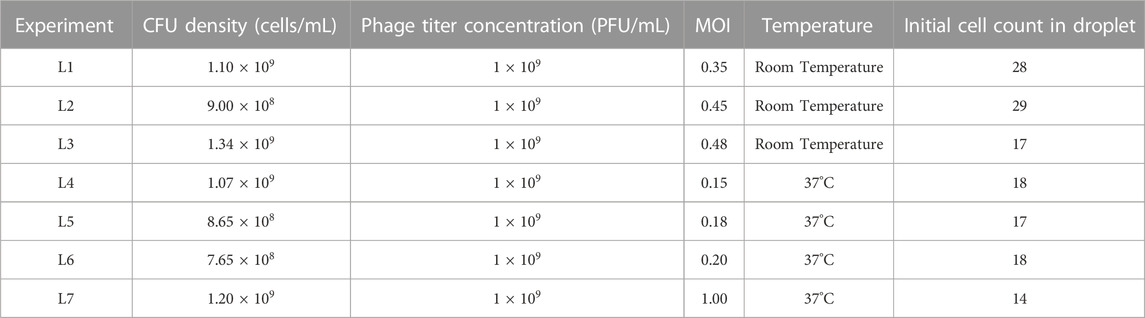
TABLE 2. Experimental conditions for lysis experiments.
2.2 Microfluidic device fabrication
The two-layer microfluidic device was fabricated using soft lithography with a high-resolution acetate mask (Microlithography Services). Supplementary Figure S1 shows the fabrication process in form of a schematic. Negative photoresist SU8 TF6000 (MicroChem) was patterned on a silicon wafer by exposure to UV light through a transparent film mask. The device consists of two layers with pillars (first layer, 4 μm) and microdroplet traps (second layer, 4 μm). The droplet trap diameter was 60 µm. A detailed procedure is described in a previous work (Bentley et al., 2022b). PDMS (polydimethylsiloxane, Ellsworth) and curing agent were mixed in a ratio of 10:1, poured on the patterned silicon wafer and degassed. To minimize evaporation of droplets during the time-lapse experiments, a small piece of coverslip (thickness 0.15 mm) was placed over the trap array prior to the curing process. The wafer was then cured at 70°C for 120 min. The cured PDMS was cut out and 1 mm holes were punched (Kai Medical) to create inlets for the oil and bacteria culture media. Plasma treatment (Diener Zepto) was used to bond the PDMS to a thin coverslip (22 × 50 mm, 0.13–0.17 mm thick). Finally, a solution of 1% (v/v) trichloro(1H,1H,2H,2H-perfluorooctyl)silane (Merck) silane dissolved in HFE-7500 oil was flushed through the device which was incubated at 70°C for at least 30 min.
2.3 Droplet generation and trapping
The microfluidic device was placed on the microscope stage and clamped using scotch tape. Droplets were generated on-chip by phase change in which the aqueous phase containing the bacterial cells/bacteria-phage mix was replaced by the oil phase, forming anchored droplets where traps were designed. The continuous phase consisted of 1% (w/v) 008-Fluorosurfactant (RAN Biotechnologies) in HFE-7500 (Fluorochem) oil. The aqueous phase consisted of E. coli cultured in growth medium until the indicated OD600 (control experiments) or E. coli-T7 phage mixture at a specific MOI. A schematic of the microscope setup is shown in Figure 1A. To start the experiments, the aqueous and carrier oil phase were loaded into PTFE tubing (SLS) connected to 1 mL plastic syringes (BD Plastipak) and syringes were mounted on syringe pumps (Nemesys, Cetoni). 100 μL of bacterial cell culture/bacteria-phage mix was aspirated in one of the syringes as aqueous phase. The device was filled with the oil solution to remove all the air inside the trapping chambers. The oil flow was then stopped, and bacteria solution/bacteria-phage mix was flown until the whole trapping array was filled. In turn, the bacteria solution/bacteria-phage mix was stopped, and the oil solution was introduced again to flush the cell sample. This procedure created droplets of the cell sample immobilised in the circular traps as seen in Figure 1B.
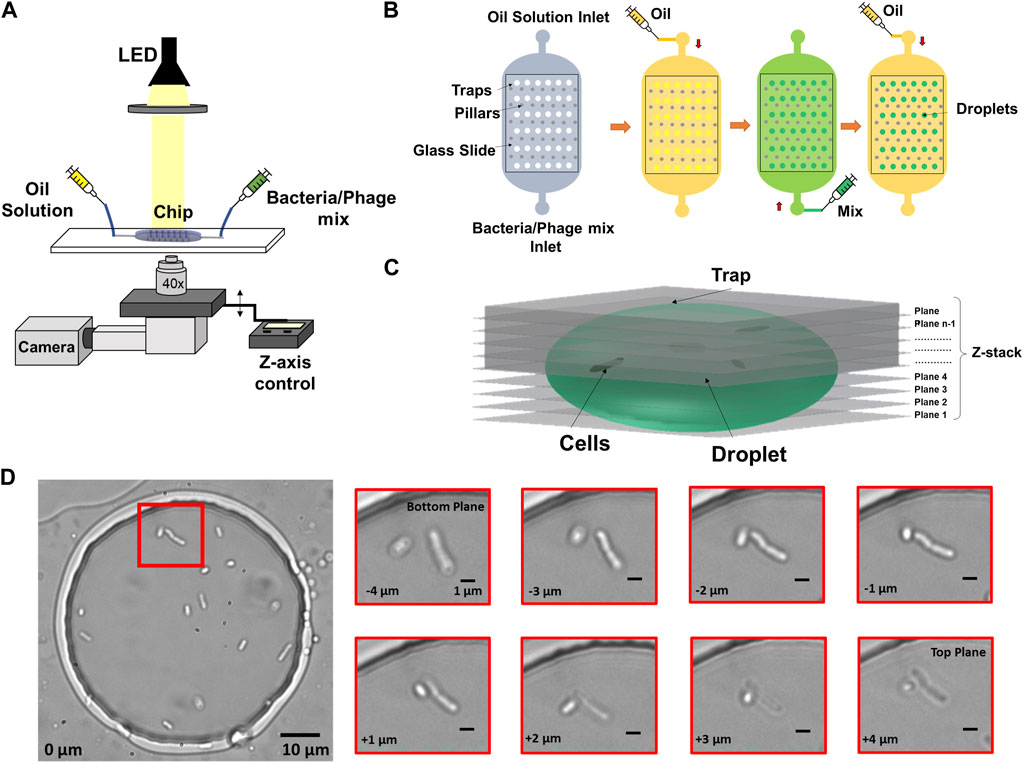
FIGURE 1. Imaging and microfluidics setup to observe individual bacterial cells trapped in droplets. (A) Droplets were illuminated by a collimated white LED light source and imaged in bright-field, using a ×40 objective on a microscope with motorized Z-focus control. (B) Droplets were generated using a water-in-oil self-digitization method. The microfluidic chip was first primed with oil to remove any air. Bacteria solution or bacteria-phage mix was flushed to replace the oil solution. The oil solution was flushed once more to form droplets in individual traps. (C) 3D schematic of Z-stack imaging on a trapped droplet. (D) Example image of multiple cells encapsulated in an anchored droplet and zoomed-in image panel showing two cells obtained at eight different Z focal planes. The relative vertical distance between images is indicated at the bottom left of every image.
2.4 Imaging
A major challenge for observing individual bacteria by microscopy in 3D environments include their ability to swim away from optimum focus between different planes as well as lateral movement within the said environment. To compensate for this motion and obtain accurate counting, we employed a Z-stack method together with image-based drift correction to image the bacterial cells inside the traps as shown in Figure 1C over timescales of hours. Figure 1D shows an example droplet containing multiple cells and zoomed-in images of cells obtained at different Z focal planes.
An inverted Olympus IX73 semi-motorized microscope was used to image the bacteria trapped in the chambers. The microscope was equipped with a white LED (CoolLED pE-100) and a direct coupling motorized Z-focus with a focus controller (ProScan III, Prior Instruments). We used a ×40 objective with a numerical aperture of 0.45 (UPLFLN40X-2, Olympus). The microscope was placed on a vibration damping platform (Newport VIP320X1218-50140). A USB camera (DMK 37AUX287, The Imaging Source) was used to obtain images of droplets of size 720 x 540 pixels encoded on 8 bits.
A Python script was written to control the imaging sequence as well as the movement of the vertical position of the microscope objective Z-axis. Drift correction was utilized to compensate for the possible impact of any external factors such as movement of the clamped device or vibration of the table on which the microscope is set. The Python script enabled us to control the number of stacks, the time gap between the stacks, the height of each step in the stack as well as correct any drift in focus that might occur due to factors mentioned above. The first step in drift correction was to generate an average image calculated from 10 different images of the same chamber. The average image was generated by taking an average of light intensity over 10 images. This average image was then used as a reference for actual stack imaging. Each time a new stack was acquired, the first image of the stack was checked against the average image obtained initially (sum of all absolute values of pixel-to-pixel subtraction). If this global difference between the images was found to be over a certain threshold, the Z-axis would move in either direction (upwards or downwards) until the difference between the new stack image and the average image changed to less than the threshold. If Z-axis movement failed to find suitable correction with vertical movement, a new average image was generated replacing the old image. This process continued over the duration of the experiment. All images within each Z-stack were taken within 2.1 s (at the speed limit of the setup) to minimize the effect of cell motion during acquisition. All imaging parameters used in this study can be found in Supplementary Section S1.
2.5 Deep learning using YOLOv4 for E. coli single-cell detection: labelling, training, and detection
YOLOv4 is a one-stage deep learning based object detection framework capable of detecting different classes of objects in images with high speed and accuracy (Bochkovskiy et al., 2020). The choice of YOLOv4 model was based on existing comparisons of deep learning object detection model performances on the standard MS-COCO dataset (Liu et al., 2021). YOLOv4 was shown to outperform other algorithms such as R-CNN, Mask R-CNN, Single Shot MultiBox Detector and RetinaNET.
Images were obtained using the setup mentioned in Section 2.4 to create a dataset containing examples of E. coli cells in droplets. The dataset consisted of 200 images chosen across different microscopy conditions (light intensity, collimator position) to improve the robustness and versatility of the model. A total of 1,670 in-focus cells were manually labelled by drawing bounding boxes. Examples of cells considered in focus can be seen in Supplementary Figure S3. The labelled data were split into a ratio of 70:30 for training and validation, respectively. The model was trained for 6,000 iterations on YOLOv4 darknet using the Google CoLab platform. Trained YOLOv4 weights that exhibited high average precision (AP) and low loss were obtained and converted into TensorFlow format for post processing. To test whether we could improve the model, we undertook preliminary hyperparameter optimization by changing the learning rate and momentum for training. The results are listed in the Supplementary Material (Supplementary Section S5; Supplementary Figures S4, S5). The converted YOLOv4 model was used to perform detections on all experimental data. For every raw image input, the model outputs a detection image containing bounding boxes around cells and a NumPy file containing the information on the coordinates of these bounding boxes.
2.6 Utilising detections for data analysis
A counting method extracting the number of E. coli cells per droplet using Z-stack information was implemented using MATLAB. Every image part of the Z-stack had associated YOLOv4 detections. In a typical experiment, a selected droplet was imaged across more than 20 focal planes, each spaced by 0.5 microns. The plane with the maximum number of cell detections was used to obtain an initial cell count. However, the same cell may be detected in multiple planes due to its changing orientation and motility. It took 75 milliseconds to image two consecutive slices that were 0.5 microns apart. We experimentally determined that a cell would have moved on average less than 4 microns in the same timeframe (c.f. analysis in Supplementary Figure S7). If, for a slice different than the initial one, a cell was detected at a position sufficiently close to a cell already counted, we assumed that it was the same cell and therefore was registered only once. However, if two cells lied in the same plane, the algorithm would count both, independent of their relative location. After all slices were processed, a final cell count and location was obtained (referred to as “detection count”). This process was repeated for all time points, enabling tracking of cell counts in a given droplet.
The raw “Detection count” data was filtered to extract accurate times for individual cell division events. We implemented a function that decreased detection noise and rounded the cell counts to the local maximum values. Briefly, we applied a moving average function for every 3 data points to attenuate sudden spikes. Inaccuracies in cell detection count can occur, mainly because of the positioning of the cells with respect to the droplet interface. Supplementary Figure S9 displays examples of false detections. This results in local fluctuations across time series. Consequently, a single change in the detection count may not be reflective of an actual change in cell number. Therefore, we only updated the cell count whenever the same detection number was repeated N times within a given time interval (referred to as the Nth maximum method). This filtered cell count was termed “processed count” in Figures 2C, 3.
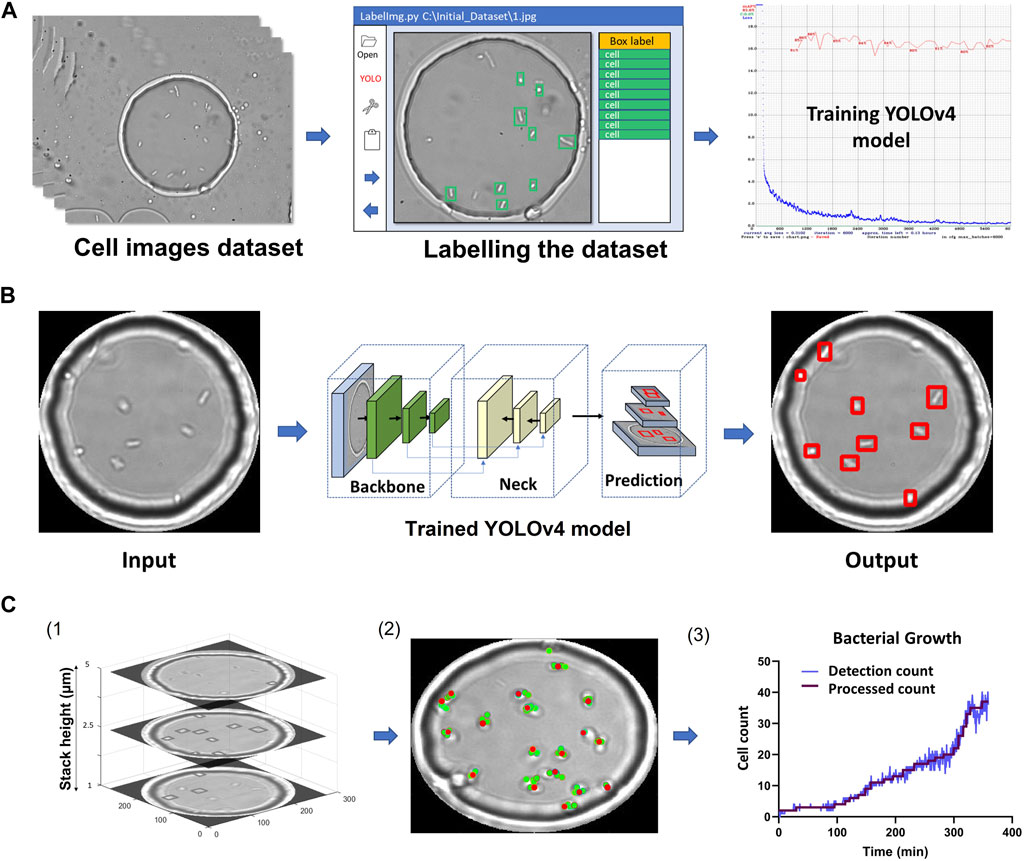
FIGURE 2. YOLOv4 model training and data analysis (A) Flow chart of labelling procedure involving dataset acquisition, labelling using LabelImg and training using YOLOv4. (B) Flow chart showing image masking, image passing through YOLOv4 and cell detection output image. (C) MATLAB analysis flowchart. 1) Example Z-stack with cells detected for 3 planes. 2) The location of detected single cells overlaid on one of the Z-stack images are represented by red dots (Supplementary Figure S7). 3) Cell counts over time. The figure was plotted using the process described in (2) for every time point. The final processed count was generated using the 3rd maximum method (Section 2).
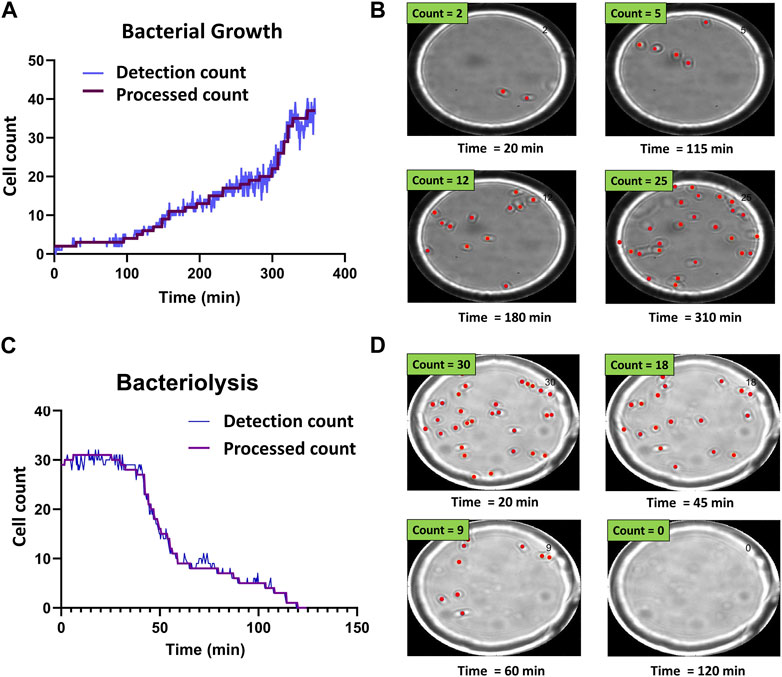
FIGURE 3. Time-resolved bacterial growth and phage-induced bacteriolysis. (A) Example of detection and processed counts for E. coli population growth. Starting from a single E. coli cell, we tracked the growth of the population. (B) Selected images showing corresponding detections at different time points (Supplementary Movie S1) (C) Example of detection and processed counts for lysis of individual E. coli cells. (D) Selected images showing corresponding detections at different time points (Supplementary Movie S2).
Similarly, for lysis experiments, if a decrease in cell count was observed N times, the processed cell count was decreased to the lowest count value (‘Nth minimum method’). This allowed us to generate the step count increases/decreases and obtain accurate cell division and lysis times for all growth and lysis experiments.
Figure 2 summarizes the image processing workflow, including YOLOv4 training, detections across slices and post-processing to obtain final cell counts and locations.
2.7 Calculation of doubling times using processed bacterial counts
Doubling times for bacterial population were calculated using the slope of the bacterial count plots. We manually identified the portion of the plots with highest slope and excluded at least the first 20 and 70 min for the 37°C and room temperature experiments respectively (individual fits are shown in Supplementary Figure S12). The resulting linear fits helped us obtain the specific growth rates and doubling times using the following equation:
Where D is the population doubling time and SR the specific growth rate.
3 Results
3.1 Counting single E. coli cells using YOLOv4
We developed a method to characterize growth and lysis of bacterial populations by counting single bacterial cells using label-free bright-field microscopy and YOLOv4 based object detection oriented deep learning. Lysis of bacterial cells was induced upon infection of bacterial populations with their virus called bacteriophage or phage. In our experimental system, we employed the most studied bacterium, Escherichia coli to investigate bacterial growth in droplets, or infected E. coli with their phage T7 to observe bacterial cell death due to lysis. We employed the E. coli strain BW25113, which is a derivative of the wild-type E. coli K-12 strain, described as weakly motile, and it is a known host strain for propagation of phage T7 (Wang and Wood, 2011; Mutalik et al., 2020). T7 is the most suitable phage model for bacterial real-time lysis experiments because of its short infection cycle (approx. 15 min at 37°C) and high lytic activity (Mandal et al., 2021). Using our method, individual E. coli cells were trapped in anchored droplets and their growth and lysis observed in a 3D liquid environment. The YOLOv4 model to detect cells in focus was trained for 6,000 iterations and the average precision (AP) value of 83.6% was obtained (Supplementary Figures S5, S6). Our model achieved an accuracy of ∼84% with IoU of 50% and 93% with IoU of 25%. For each experiment, one anchored droplet was selected and observed over a period of up to 10 h. Droplets were imaged using a Z-stack method. Briefly, 20 to 30 images at 0.5 microns intervals were acquired, ensuring that cells were in focus and detected by our model in at least one focal plane in the stack (c.f. Section 2.4). The whole stack was acquired in 1.5–2.1 s depending on the number of slices chosen. Z-stack images were circularly masked to avoid any detections outside the zone of interest (Supplementary Section S8). The masked images were used as the input for the trained YOLOv4 model and detection images were obtained along with coordinates of all bounding boxes. YOLO detections for each Z-stack generated the detection counts which were then processed using the 3rd maximum or 3rd minimum method to identify individual cell doubling and cell lysis events, respectively (Section 2.4; Supplementary Figure S11).
Figure 3 shows representative bacterial growth and bacteriolysis assays. Figure 3A shows the increase in cell count over time. Each step in the processed count plot represents cell division events. Increase in cell count for each step was manually verified using corresponding time-point images as seen in Figure 3B and Supplementary Movie S1. Similarly, Figure 3C shows a decrease in cell count as phages cause bacteriolysis. Each step corresponds to lysis events and was verified using corresponding time-point images as seen in Figure 3D and Supplementary Movie S2.
3.2 Analysis of E. coli growth
Experiments were conducted at different temperatures and different initial cell numbers to check the versatility and applicability of the cell count method developed using the YOLOv4 model. For all experiments, we visualised E. coli cells growing in culture medium in the 3-dimensional environment of the anchored droplet. Table 1 gives a detailed account of experimental conditions employed during growth experiments. The parameters for imaging of each of these growth experiments have also been listed in Supplementary Table S1. All growth curves include a 10-min delay due to the time required for cell loading and initiation of image acquisition.
3.2.1 Growth of E. coli at room temperature
We conducted multiple experiments at room temperature starting at various loading optical densities corresponding to different bacterial population size and initial cell numbers. Mean cell number could be anticipated from Poisson statistics using a droplet volume of 15 pL calculated assuming an ellipsoid droplet shape. In the first experiment, we started with a loading OD600 value of 0.19 and an initial cell count of 2. We reached a final cell count of 47 after 470 min. When the loading OD600 was 0.35 and initial cell count was 1, cell number reached a final count of 37 in 396 min. When we started with a loading OD600 of 1 and an initial cell count of 5, we reached a final count of 21 in 445 min. Figure 4A shows the increment in cell count in the form of individual steps every time a cell divides for each of these experiments. We observed that the growth of cells in each condition was dependent on the loading OD600 values in all the cases. Single-cell times to division in all experiments were broadly evenly spread across the duration of the experiments as seen in Figure 4B. Population doubling times of 103 ± 3 min (OD600=0.35), 156 ± 3 min (OD600=0.19) and 215 ± 5 min (OD600=1) were calculated. The growth of cells in the droplets was found to be reflective of the media carrying capacity. At lower OD600 values (0.19 and 0.35), we observed faster cell division and higher cell yield due to higher concentration of nutrients present, whereas droplets generated with high initial OD600 showed slower growth and lower yields due to nutrient depletion in the media as media carrying capacity was approached.

FIGURE 4. Comparison between growth of E. coli cells at room temperature and 37°C. (A) Growth of E. coli populations at room temperature determined by the increase in number of cells due to cell division. (B) The corresponding histogram showing the distribution of single-cell time-to-division for each experiment. (C) Growth of E. coli populations at 37°C determined by increase in number of cells due to cell division. (D) The corresponding histogram showing the distribution of single-cell time-to-division.
3.2.2 Growth of E. coli at 37°C
We performed three experiments starting with different OD600 and number of bacterial cells in droplets. When the loading OD600 were 0.29 and 0.30 with cell count of 4 and 3 respectively, the cell population reached the same count of 16 in 135 min and 100 min respectively. When the OD600 was 0.35, and the droplet contained 2 cells initially, the cell number reached a total of 15 in 145 min. Since the media carrying capacity was almost identical in all three cases, the growth yields for all experiments were comparable. Figure 4C shows the increment in cell count in form of individual steps for experiments conducted at 37°C and Figure 4D the corresponding single-cell times to division. The doubling times were calculated to be 29 ± 3 min (OD600=0.30), 43 ± 3 min (OD600=0.35) and 79 ± 5 min (at OD600=0.29).
3.3 Analysis of E. coli lysis with T7 phage
Phage T7 was chosen to perform bacteriolysis experiments as its lytic cycle causes the infected cells to undergo sudden burst, making identification of intact cells that retained their morphology easier.
3.3.1 Lysis of E. coli cells at room temperature
Aliquots of exponentially growing E. coli cultures with determined OD600 values were mixed with the T7 phage lysate (109 PFU/mL) at different volumes to obtain different expected MOI in droplets for each experiment. Specific parameters of all lysis experiments are summarized in Table 2. The initial cell counts in experiment with expected MOI value 0.35 was 28 and all the cells in the observed droplet were lyzed within 206 min. In the experiment with an expected MOI value of 0.45, we started the experiment with an initial cell count of 29 and noted complete bacteriolysis in 123 min. For the droplets with expected MOI value of 0.48, complete cell lysis from an initial cell counts of 17 was observed within 106 min. Figure 5A shows the comparison for the three lysis experiments at room temperature. We observed that higher MOI resulted in faster cell lysis, which is to be expected as applying higher MOI indicates that bacterial cells were initially challenged with more phage particles. Figure 5B shows individual cell lysis events extracted from Figure 5A. A peak of lysis at time 60 min seem to point towards the average time to lysis of E. coli at room temperature. Indeed, in experiments L2 and L3, we observed a sudden onset of cell burst at 60 min, lyzing more than half the population of cells.
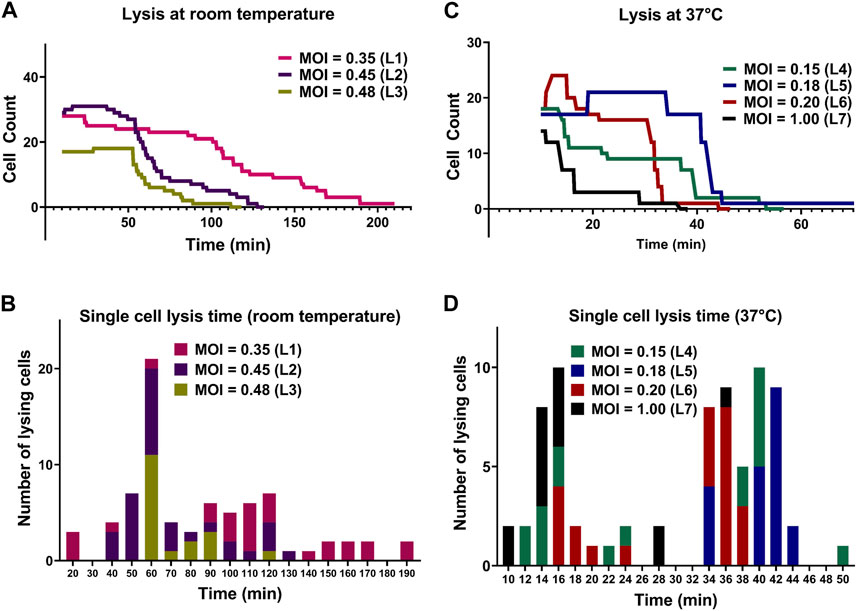
FIGURE 5. Comparison between lysis of E. coli cells by T7 phages at room temperature and 37°C. (A) Lysis of individual E. coli cells at room temperature. (B) The corresponding histogram shows the distribution of time to lysis of single bacterial cells for each experiment. (C) Lysis of individual E. coli cells at 37°C. (D) The corresponding histogram shows the distribution of time to lysis of single bacterial cells. All lysis curves include a 10-min delay due to the time required for cell loading and initiation of image acquisition.
3.3.2 Lysis of E. coli by T7 phages at 37°C
The lytic cycle of the T7 phage at 37°C is known to be around 17 min resulting in the duration of lysis experiments at 37°C being significantly shorter than that of lysis experiments at room temperature (Heineman and Bull, 2007; Jack et al., 2019). Considering the speed of T7 lytic cycle, low expected MOI values were chosen to aid in observing individual lysis events. Parameters of experiments and imaging are summarized in Supplementary Table S2. For droplets with MOI value 0.15, we began the experiment with an initial cell count of 18 (i.e., estimated initial phage count of 3) and observed complete cell lysis in 48 min. For droplets with expected MOI value 0.18, the initial cell count was noted to be 17 (estimated initially as 3 phage particles) and almost all the cells were lyzed within 39 min. The T7 phage burst size refers to the number of viral particles produced during the lytic cycle of phage infection and is predicted to be hundreds for T7 phage (Nguyen and Kang, 2014). However, one cell was observed to remain whole even with the expected presence of large number of T7 phages produced by previous lysis of other cells in the same droplet (experiment L5).
For droplets with expected MOI 0.20 with initial cell count 18, cell count increased to 22 (experiment L6) and most cells lyzed after around 30 min with complete lysis observed within 38 min. For the experiment with a relatively high MOI of 1 (experiment L7) and initial cell count 14 (14 expected phages initially), approximately 75% of the population was lysed within 16 min and complete cell lysis was observed in 36 min. Figure 5C shows the comparison between lysis experiments at different expected MOI. Similar to room temperature experiments, we observed faster cell lysis in droplets with higher expected MOI. Figure 5D shows individual cell lysis events for each experiment in Figure 5C. Overall, we observed both early lysis (between 11 and 17 min) and late events with noticeable time delay as seen in Figure 5D (with many recorded lysis events occurring after 28 min from mixing).
4 Discussion
By combining bright field microscopy, microfluidics, Z-stack imaging and YOLOv4 based object detection framework, we demonstrate a robust platform that enables single-cell level monitoring of growth or lysis of bacterial cells in liquid environments. Growth experiments demonstrated the ability of anchored droplets to act as independent microreactors allowing the cells to grow with little physical constraints. This label-free platform enabled us to detect and count individual cells purely based on their morphological features without any biological modifications or need for fluorescent labelling. Our method poses limited restrictions (presence of an oil-water interface, finite resources within the droplet) on the cells and allows us to monitor large cell populations which more faithfully represent both in vivo and environmental conditions.
A key enabling advance has been the ability to detect cells of various morphology using deep learning methods. Our YOLOv4 model exhibited adaptable and accurate detection of E. coli cells in focus across different levels of brightness and contrast (Supplementary Figure S8) making the method robust to experimental drift. Average Precision (AP) was calculated to be 83.6% with an average loss of 0.4 after 5,600 iterations of training (Supplementary Figure S5 for more details). The weights corresponding to these conditions were used to perform all deep learning-based detections and analysis throughout this study. E. coli detection in bright-field images using YOLO was also performed by Sun et al (Sun et al., 2022) in a solidified agar-based microchannel in a microfluidic chip. Their study employed the use of YOLOv3, YOLOv4 and YOLOv5 to identify and E. coli cells with a training dataset consisting of 400 images. The precision they obtained in detecting the E. coli cells using YOLOv3, YOLOv4 and YOLOv5 was noted to be 68.6%, 72.9% and 73.4% respectively. In contrast, the detection precision in our method (∼84%) has already surpassed this detection precision using fewer images and with freely swimming cells.
We have observed that the cells could swim at speeds commensurate with the one of our Z-scan acquisition. It is therefore possible for the same cell to be in-focus in different images of a Z-stack. To alleviate this issue, we therefore counted all cells sharing the same (x,y) coordinates within a tolerance (‘exclusion’) radius as one (unless there was more than one cell detected in the slice with the most number of cells). This choice of methodology partly explains the noise we report in the detection counts. However, the probability that 2 cells share the same (x,y) coordinates within an 8 micron deep trap is small and cells will eventually swim away from one another.
The accuracy of detections was mainly limited by the positioning of cells with respect to the droplet interface and by the local density. Supplementary Sections S8, S9 exemplify false positive detections and show standard deviation as a function of cell number. We observed that cells were often undetected if they were positioned or moved around the circumference of the selected droplet as they could not be resolved in images as seen in image in Supplementary Figure S9. Similarly, the accuracy in cell count was found to be directly dependent on the number of cells. Supplementary Figure S10 shows the standard deviation for cell count accuracy versus the total number of cells. We observed that the accuracy of cell count decreased as the number of cells in the droplet increased, imposing a practical limit on the maximum number of cells that can be counted per experiment. Our radius of exclusion method also set a hard boundary on the maximum cell density (i.e., one cell per 44 μm2) corresponding to about 50 cells given our droplet diameter. This method is generalizable to other bacterial species. Our approach is directly applicable to any rod-shaped bacteria of similar size. For instance, in Supplementary Figure S13 we demonstrate the detections of P. aeruginosa using the same model utilized to detect E. coli in our study.
T7 phages cause infected E. coli cells to burst. The YOLOv4 model did not detect the lyzed cells or floating debris because it was specifically trained to detect cells that retain their shape as seen in Supplementary Figure S3. One limitation of our method is the finite tracking ability of cells on an individual basis to construct the lineage tree of a population. This is linked to the relatively long time required to acquire complete Z-stacks, limiting our time resolution to typically 1.5–2.1 s. The use of smaller Z-stacks and shallower traps could increase this time resolution further and enable tracking of low-motility strains. Extension of the presented method to larger populations in larger drops (i.e., with larger, taller traps) could be implemented by adapting the method to evaluate cell-to-cell distances in 3D instead of the exclusion radius method presented. Automated screens of multiple droplets at a time could also be done using a motorized microscope stage at the cost of time resolution per droplet. Bacterial growth starting from a few cells exhibited strong stochasticity. As the histograms in Figure 4B illustrate, population development did not follow reproducible patterns, in line with expected stochasticity at the single-cell level which has been covered in detail in other studies (Koutsoumanis and Lianou, 2013; Garcia et al., 2017; Barizien et al., 2019). Experiments at both room temperature and 37°C show stochasticity under similar growth conditions.
For phage experiments, we hypothesize that all cells in a given droplet may not be infected immediately especially at low MOI experiments. This allows non-infected cells to grow and divide as seen in Figures 5A, C (experiments L2, L5 and L6). As infected cells lyze, the concentration of phages in the droplet increases, causing the rest of the cells within the droplet to lyze from secondary infections as seen in Figure 5C. Phage life cycle highly depends on temperature. At room temperature, as found in the environment, phage adsorption and replication dynamics may be affected. Our experiment at room temperature still shows efficient lysis albeit much slower than at 37°C. In our droplet microfluidics setup, T7 phage lyzed almost all cells within 200 and 50 min at room temperature and 37° respectively. However, some cells did not lyze for several minutes even after the lysis of all other cells and remained motile in the droplet (Figure 5C, experiment L5). This could be explained by resistance against phage infection developed via many different mechanisms (Labrie et al., 2010).
We have shown the utility of the currently presented low throughput setup in the precise characterization of bacteria-phage interactions monitored via the change in number of bacteria present at any given time, with a realistic 3 repeats per day currently possible. Extending this work to higher throughput would be desirable to obtain larger datasets but will require compromise in either spatial or temporal resolution. We foresee two main approaches for increasing throughput: using a motorised microscope stage or lower magnification objectives to simultaneously image multiple droplets. Increasing the density of traps in the microfluidic design would also enable multiple droplet acquisition per image. An example of implementing a lower magnification approach is shown is Supplementary Section S14 of Supplementary Material (imaging two droplets at once).
5 Conclusion
Our microdroplet trapping device and analysis pipeline from Z-stack bright-field images provides a means to study dynamic interactions between microbes and antimicrobial agents. This includes the life cycle of phages, e.g., dynamic transition between lysogenic and lytic pathways observed via long-term balance between growth and lysis, and the evolution of resistance to phages, an essential consideration for pre-empting future resistance to phage treatment. The technical simplicity of the setup coupled with shareable deep learning models will accelerate phenotypic studies of bacterial populations. In future work, the platform could be used to study combinatorial effects of antibiotics and phages. One could also expand object detection-oriented methods to study polymicrobial cultures of clinically relevant strains to characterise the impact of a microbial community composition with respect to the lytic efficacy of phages. Finally, our method could be used to evaluate susceptibility of cells to antimicrobial agents other than phages via change in bacterial growth dynamics or morphological changes at sub-inhibitory concentrations.
Data availability statement
The datasets presented in this study can be found in online repositories. The names of the repository/repositories and accession number(s) can be found in the article/Supplementary Material.
Author contributions
AT: Conceptualization, Formal Analysis, Investigation, Methodology, Writing–review and editing, Resources. NN: Formal Analysis, Investigation, Methodology, Writing–review and editing, Funding acquisition, Resources, Supervision. VA: Formal Analysis, Investigation, Methodology, Resources, Writing–review and editing. FG: Conceptualization, Formal Analysis, Methodology, Funding acquisition, Resources, Supervision, Writing–review and editing.
Funding
The author(s) declare financial support was received for the research, authorship, and/or publication of this article. This work was supported by BBSRC grant BB/T011777/1 and BBSRC/NC3R grant (NC/X002187/1) to FG, the Wellcome Trust Institutional Strategic Support Funding (WT105618MA) Research Restart Award and Pump-Priming Initiative to NN. This work was also supported by the Biotechnology and Biological Sciences Research Council-funded South-West Biosciences Doctoral Training Partnership (training grant reference 2578821).
Acknowledgments
The authors thank Dr. Remy Chait for useful discussions and comments, Dr. Wolfram Möbius for the bacterial strain and phage. We would also like to acknowledge the use of the Exeter Microfluidics Facility and Savchenko Centre for Nanoscience.
Conflict of interest
The authors declare that the research was conducted in the absence of any commercial or financial relationships that could be construed as a potential conflict of interest.
Publisher’s note
All claims expressed in this article are solely those of the authors and do not necessarily represent those of their affiliated organizations, or those of the publisher, the editors and the reviewers. Any product that may be evaluated in this article, or claim that may be made by its manufacturer, is not guaranteed or endorsed by the publisher.
Supplementary material
The Supplementary Material for this article can be found online at: https://www.frontiersin.org/articles/10.3389/frlct.2023.1258155/full#supplementary-material
References
Abbyad, P., Dangla, R., Alexandrou, A., and Baroud, C. N. (2011). Rails and anchors: guiding and trapping droplet microreactors in two dimensions. Lab. Chip 11 (5), 813–821. doi:10.1039/c0lc00104j
Accolti, M. D., Soffritti, I., Mazzacane, S., and Caselli, E. (2019). Fighting AMR in the healthcare environment: microbiome-based sanitation approaches and monitoring tools. Int. J. Mol. Sci. 20 (7), 1535. doi:10.3390/ijms20071535
Acs, N., Gambino, M., and Brondsted, L. (2020). Bacteriophage enumeration and detection methods. Front. Microbiol. 11, 594868. doi:10.3389/fmicb.2020.594868
Alonso, A. A., Molina, I., and Theodoropoulos, C. (2014). Modeling bacterial population growth from stochastic single-cell dynamics. Appl. Environ. Microbiol. 80 (17), 5241–5253. doi:10.1128/aem.01423-14
Amin, M. J., Zhao, T., Yang, H., and Shaevitz, J. W. (2022). Multicolor multifocal 3D microscopy using in-situ optimization of a spatial light modulator. Sci. Rep. 12 (1), 16343. doi:10.1038/s41598-022-20664-z
Anagnostidis, V., Sherlock, B., Metz, J., Mair, P., Hollfelder, F., and Gielen, F. (2020). Deep learning guided image-based droplet sorting for on-demand selection and analysis of single cells and 3D cell cultures. Lab a Chip 20 (5), 889–900. doi:10.1039/d0lc00055h
Balouiri, M., Sadiki, M., and Ibnsouda, S. K. (2016). Methods for in vitro evaluating antimicrobial activity: a review. J. Pharm. Analysis 6 (2), 71–79. doi:10.1016/j.jpha.2015.11.005
Barizien, A., Suryateja Jammalamadaka, M. S., Amselem, G., and Baroud, C. N. (2019). Growing from a few cells: combined effects of initial stochasticity and cell-to-cell variability. J. R. Soc. Interface 16 (153), 20180935. doi:10.1098/rsif.2018.0935
Bentley, S. A., Laeverenz-Schlogelhofer, H., Anagnostidis, V., Cammann, J., Mazza, M. G., Gielen, F., et al. (2022a). Phenotyping single-cell motility in microfluidic confinement. Elife 11, e76519. doi:10.7554/elife.76519
Bentley, S. A., Laeverenz-Schlogelhofer, H., Anagnostidis, V., Cammann, J., Mazza, M. G., Gielen, F., et al. (2022b). Phenotyping single-cell motility in microfluidic confinement. Elife 11, 11. doi:10.7554/elife.76519
Bochkovskiy, A., Wang, C.-Y., and Liao, H.-Y. M. (2020). Yolov4: optimal speed and accuracy of object detection. Available at: https://arxiv.org/abs/2004.10934.
Cai, Y. M. (2020). Non-surface attached bacterial aggregates: a ubiquitous third lifestyle. Front. Microbiol. 11, 557035. doi:10.3389/fmicb.2020.557035
Dedrick, R. M., Guerrero-Bustamante, C. A., Garlena, R. A., Russell, D. A., Ford, K., Harris, K., et al. (2019). Engineered bacteriophages for treatment of a patient with a disseminated drug-resistant Mycobacterium abscessus. Nat. Med. 25 (5), 730–733. doi:10.1038/s41591-019-0437-z
Garcia, M. R., Vázquez, J. A., Teixeira, I. G., and Alonso, A. A. (2017). Stochastic individual-based modeling of bacterial growth and division using flow cytometry. Front. Microbiol. 8, 2626. doi:10.3389/fmicb.2017.02626
Heineman, R. H., and Bull, J. J. (2007). Testing optimality with experimental evolution: lysis time in a bacteriophage. Evolution 61 (7), 1695–1709. doi:10.1111/j.1558-5646.2007.00132.x
Howell, L., Anagnostidis, V., and Gielen, F. (2022). Multi-Object detector yolov4-tiny enables high-throughput combinatorial and spatially-resolved sorting of cells in microdroplets. Adv. Mater. Technol. 7 (5), 2101053. doi:10.1002/admt.202101053
Jack, B. R., Boutz, D. R., Paff, M. L., Smith, B. L., and Wilke, C. O. (2019). Transcript degradation and codon usage regulate gene expression in a lytic phage. Virus Evol. 5 (2), vez055. doi:10.1093/ve/vez055
Jelli, E., Ohmura, T., Netter, N., Abt, M., Jiménez-Siebert, E., Neuhaus, K., et al. (2023). Single-cell segmentation in bacterial biofilms with an optimized deep learning method enables tracking of cell lineages and measurements of growth rates. Mol. Microbiol. 119, 659–676. doi:10.1111/mmi.15064
Jin, Z., Nie, M., Hu, R., Zhao, T., Xu, J., Chen, D., et al. (2018). Dynamic sessile-droplet habitats for controllable cultivation of bacterial biofilm. Small 14 (22), e1800658. doi:10.1002/smll.201800658
Knowles, T. P., White, D. A., Abate, A. R., Agresti, J. J., Cohen, S. I. A., Sperling, R. A., et al. (2011). Observation of spatial propagation of amyloid assembly from single nuclei. Proc. Natl. Acad. Sci. U. S. A. 108 (36), 14746–14751. doi:10.1073/pnas.1105555108
Koskella, B., and Meaden, S. (2013). Understanding bacteriophage specificity in natural microbial communities. Viruses 5 (3), 806–823. doi:10.3390/v5030806
Koutsoumanis, K. P., and Lianou, A. (2013). Stochasticity in colonial growth dynamics of individual bacterial cells. Appl. Environ. Microbiol. 79 (7), 2294–2301. doi:10.1128/aem.03629-12
Labrie, S. J., Samson, J. E., and Moineau, S. (2010). Bacteriophage resistance mechanisms. Nat. Rev. Microbiol. 8 (5), 317–327. doi:10.1038/nrmicro2315
Lambert, G., and Kussell, E. (2015). Quantifying selective pressures driving bacterial evolution using lineage analysis. Phys. Rev. X 5 (1), 011016. doi:10.1103/physrevx.5.011016
Li, X., Liu, X., Yu, Z., Luo, Y., Hu, Q., Xu, Z., et al. (2022). Combinatorial screening SlipChip for rapid phenotypic antimicrobial susceptibility testing. Lab. Chip 22 (20), 3952–3960. doi:10.1039/d2lc00661h
Liu, Z., Jin, L., Chen, J., Fang, Q., Ablameyko, S., Yin, Z., et al. (2021). A survey on applications of deep learning in microscopy image analysis. Comput. Biol. Med. 134, 104523. doi:10.1016/j.compbiomed.2021.104523
Ly-Chatain, M. H. (2014). The factors affecting effectiveness of treatment in phages therapy. Front. Microbiol. 5, 51. doi:10.3389/fmicb.2014.00051
Mandal, P. K., Ballerin, G., Nolan, L. M., Petty, N. K., and Whitchurch, C. B. (2021). Bacteriophage infection of Escherichia coli leads to the formation of membrane vesicles via both explosive cell lysis and membrane blebbing. Microbiol. Read. 167 (4), 001021. doi:10.1099/mic.0.001021
Maurer, F. P., Christner, M., Hentschke, M., and Rohde, H. (2017). Advances in rapid identification and susceptibility testing of bacteria in the clinical microbiology laboratory: implications for patient care and antimicrobial stewardship programs. Infect. Dis. Rep. 9 (1), 6839. doi:10.4081/idr.2017.6839
McCallin, S., Sacher, C. J., Zheng, J., and Chan, B. K. (2019). Current state of compassionate phage therapy. Viruses 11 (4), 343. doi:10.3390/v11040343
Mutalik, V. K., Adler, B. A., Rishi, H. S., Piya, D., Zhong, C., Koskella, B., et al. (2020). High-throughput mapping of the phage resistance landscape in E. coli. PLoS Biol. 18 (10), e3000877. doi:10.1371/journal.pbio.3000877
Muthukrishnan, T., Govender, A., Dobretsov, S., and Abed, R. (2017). Evaluating the reliability of counting bacteria using epifluorescence microscopy. J. Mar. Sci. Eng. 5 (1), 4. doi:10.3390/jmse5010004
Nguyen, H. M., and Kang, C. (2014). Lysis delay and burst shrinkage of coliphage T7 by deletion of terminator tφ reversed by deletion of early genes. J. Virol. 88 (4), 2107–2115. doi:10.1128/jvi.03274-13
Ni, B., Colin, R., Link, H., Endres, R. G., and Sourjik, V. (2020). Growth-rate dependent resource investment in bacterial motile behavior quantitatively follows potential benefit of chemotaxis. Proc. Natl. Acad. Sci. U. S. A. 117 (1), 595–601. doi:10.1073/pnas.1910849117
Nikolic, N., Anagnostidis, V., Tiwari, A., Chait, R., and Gielen, F. (2023). Droplet-based methodology for investigating bacterial population dynamics in response to phage exposure. Front. Microbiol. 14. doi:10.3389/fmicb.2023.1260196
Nitta, N., Sugimura, T., Isozaki, A., Mikami, H., Hiraki, K., Sakuma, S., et al. (2018). Intelligent image-activated cell sorting. Cell 175 (1), 266–276. e13. doi:10.1016/j.cell.2018.08.028
Ollion, J., Elez, M., and Robert, L. (2019). High-throughput detection and tracking of cells and intracellular spots in mother machine experiments. Nat. Protoc. 14 (11), 3144–3161. doi:10.1038/s41596-019-0216-9
Oz, T., Guvenek, A., Yildiz, S., Karaboga, E., Tamer, Y. T., Mumcuyan, N., et al. (2014). Strength of selection pressure is an important parameter contributing to the complexity of antibiotic resistance evolution. Mol. Biol. Evol. 31 (9), 2387–2401. doi:10.1093/molbev/msu191
Pliakos, E. E., Andreatos, N., Shehadeh, F., Ziakas, P. D., and Mylonakis, E. (2018). The cost-effectiveness of rapid diagnostic testing for the diagnosis of bloodstream infections with or without antimicrobial stewardship. Clin. Microbiol. Rev. 31 (3), e00095-17. doi:10.1128/cmr.00095-17
Qin, N., Zhao, P., Ho, E. A., Xin, G., and Ren, C. L. (2021). Microfluidic technology for antibacterial resistance study and antibiotic susceptibility testing: review and perspective. ACS Sens. 6 (1), 3–21. doi:10.1021/acssensors.0c02175
Ross, A., Ward, S., and Hyman, P. (2016). More is better: selecting for broad host range bacteriophages. Front. Microbiol. 7, 1352. doi:10.3389/fmicb.2016.01352
Rudd, K. E., Johnson, S. C., Agesa, K. M., Shackelford, K. A., Tsoi, D., Kievlan, D. R., et al. (2020). Global, regional, and national sepsis incidence and mortality, 1990-2017: analysis for the Global Burden of Disease Study. Lancet 395 (10219), 200–211. doi:10.1016/s0140-6736(19)32989-7
Saglimbeni, F., Bianchi, S., Lepore, A., and Di Leonardo, R. (2014). Three-axis digital holographic microscopy for high speed volumetric imaging. Opt. Express 22 (11), 13710–13718. doi:10.1364/oe.22.013710
Sakuma, K., Aoi, W., and Yamaguchi, A. (2014). The intriguing regulators of muscle mass in sarcopenia and muscular dystrophy. Front. Aging Neurosci. 6, 230. doi:10.3389/fnagi.2014.00230
Schmitz, C. H., Rowat, A. C., Köster, S., and Weitz, D. A. (2009). Dropspots: a picoliter array in a microfluidic device. Lab. Chip 9 (1), 44–49. doi:10.1039/b809670h
Smith, A., Metz, J., and Pagliara, S. (2019). MMHelper: an automated framework for the analysis of microscopy images acquired with the mother machine. Sci. Rep. 9 (1), 10123. doi:10.1038/s41598-019-46567-0
Spahn, C., Gómez-de-Mariscal, E., Laine, R. F., Pereira, P. M., von Chamier, L., Conduit, M., et al. (2022). DeepBacs for multi-task bacterial image analysis using open-source deep learning approaches. Commun. Biol. 5 (1), 688. doi:10.1038/s42003-022-03634-z
Sun, L., Xu, Y., Rao, Z., Chen, J., Liu, Z., and Lu, N. (2022). YOLO algorithm for long-term tracking and detection of Escherichia coli at different depths of microchannels based on microsphere positioning assistance. Sensors (Basel) 22 (19), 7454. doi:10.3390/s22197454
Taute, K. M., Gude, S., Tans, S., and Shimizu, T. (2015). High-throughput 3D tracking of bacteria on a standard phase contrast microscope. Nat. Commun. 6, 8776. doi:10.1038/ncomms9776
Taylor, D., Verdon, N., Lomax, P., Allen, R. J., and Titmuss, S. (2022). Tracking the stochastic growth of bacterial populations in microfluidic droplets. Phys. Biol. 19 (2), 026003. doi:10.1088/1478-3975/ac4c9b
Tropea, A. (2022). Microbial contamination and public health: an overview. Int. J. Environ. Res. Public Health 19 (12), 7441. doi:10.3390/ijerph19127441
Wang, H., Ceylan Koydemir, H., Qiu, Y., Bai, B., Zhang, Y., Jin, Y., et al. (2020). Early detection and classification of live bacteria using time-lapse coherent imaging and deep learning. Light Sci. Appl. 9, 118. doi:10.1038/s41377-020-00358-9
Wang, X., and Wood, T. K. (2011). IS5 inserts upstream of the master motility operon flhDC in a quasi-Lamarckian way. ISME J. 5 (9), 1517–1525. doi:10.1038/ismej.2011.27
Wilson, B. K., and Vigil, G. D. (2013). Automated bacterial identification by angle resolved dark-field imaging. Biomed. Opt. Express 4 (9), 1692–1701. doi:10.1364/boe.4.001692
Xiao, S., Gritton, H., Tseng, H. A., Zemel, D., Han, X., and Mertz, J. (2020). High-contrast multifocus microscopy with a single camera and z-splitter prism. Optica 7 (11), 1477–1486. doi:10.1364/optica.404678
Keywords: microfluidics, deep learning, object detection, single-cell analysis, bacteriolysis, phages
Citation: Tiwari A, Nikolic N, Anagnostidis V and Gielen F (2023) Label-free analysis of bacterial growth and lysis at the single-cell level using droplet microfluidics and object detection-oriented deep learning. Front. Lab. Chip. Technol. 2:1258155. doi: 10.3389/frlct.2023.1258155
Received: 13 July 2023; Accepted: 30 October 2023;
Published: 05 December 2023.
Edited by:
Bo Peng, Northwestern Polytechnical University, ChinaReviewed by:
Eric Brouzes, Stony Brook University, United StatesFeng Shen, Shanghai Jiao Tong University, China
Copyright © 2023 Tiwari, Nikolic, Anagnostidis and Gielen. This is an open-access article distributed under the terms of the Creative Commons Attribution License (CC BY). The use, distribution or reproduction in other forums is permitted, provided the original author(s) and the copyright owner(s) are credited and that the original publication in this journal is cited, in accordance with accepted academic practice. No use, distribution or reproduction is permitted which does not comply with these terms.
*Correspondence: Fabrice Gielen, f.gielen@exeter.ac.uk